

Abstract
Background
As part of our influenza pandemic preparedness, we studied the dispersion distances of exhaled air and aerosolized droplets during application of a jet nebulizer to a human patient simulator (HPS) programmed at normal lung condition and different severities of lung injury.
Methods
The experiments were conducted in a hospital isolation room with a pressure of − 5 Pa. Airflow was marked with intrapulmonary smoke. The jet nebulizer was driven by air at a constant flow rate of 6 L/min, with the mask reservoir filled with sterile water and attached to the HPS via a nebulizer mask. The exhaled leakage jet plume was revealed by a laser light sheet and images captured by high-definition video. Smoke concentration in the plume was estimated from the light scattered by smoke and droplet particles.
Findings
The maximum dispersion distance of smoke particles through the nebulizer side vent was 0.45 m lateral to the HPS at normal lung condition (oxygen consumption, 200 mL/min; lung compliance, 70 mL/cm H2O), but it increased to 0.54 m in mild lung injury (oxygen consumption, 300 mL/min; lung compliance, 35 mL/cm H2O), and beyond 0.8 m in severe lung injury (oxygen consumption, 500 mL/min; lung compliance, 10 mL/cm H2O). More extensive leakage through the side vents of the nebulizer mask was noted with more severe lung injury.
Interpretation
Health-care workers should take extra protective precaution within at least 0.8 m from patients with febrile respiratory illness of unknown etiology receiving treatment via a jet nebulizer even in an isolation room with negative pressure.
Key words: dispersion, exhaled air, influenza, jet nebulizer, severe acute respiratory syndrome
Abbreviations: HPS, human patient simulator; NPPV, noninvasive positive pressure ventilation; SARS, severe acute respiratory syndrome
Influenza A/H5N1 is one of the major emerging infectious diseases of global concern in the 21st century. The widespread occurrence of the H5N1 avian influenza infection among poultry and birds in several continents has increased the risk of human exposure to avian influenza. Respiratory failure is the major complication in patients with influenza A/H5N1 infection, and many progress rapidly to ARDS and multiorgan failure, with a fatality rate > 60%.1, 2
A recent study3 has shown that influenza virus may be contained in fine particles generated during tidal breathing, suggesting that aerosols may play a role in the transmission of influenza. There is a strong association between ventilation, environmental air movements, and the airborne transmission of infectious diseases such as measles, tuberculosis, chickenpox, influenza, smallpox, and severe acute respiratory syndrome (SARS).4 Since respiratory therapy may generate infective aerosols, there is potential risk that treatment may result in a superspreading event among patients and health-care workers in close contact. The use of a jet nebulizer driven by air at 6 L/min for the administration of aerosolized salbutamol in an index patient had probably enhanced the spread of SARS, leading to a major nosocomial outbreak in our hospital in 2003.5, 6, 7
We have reported the dispersion distances of exhaled air, as marked by smoke particles, during application of oxygen therapy via a simple mask and during noninvasive positive pressure ventilation (NPPV).8, 9, 10 As part of our influenza pandemic preparedness, we studied dispersion distances of exhaled air and aerosolized droplets during application of a jet nebulizer to a human patient simulator (HPS) programmed to breathe at normal lung condition and at different degrees of lung injury. We hypothesized that as lung compliance deteriorated with worsening lung injury, there would be more extensive leakage through the side vents of the jet nebulizer.
Materials and Methods
The experiments were conducted in an isolation room that measured 2.8 × 4.22 × 2.4 m, with 12 air exchanges per hour (Fig 1 ). This is one of the 36, double-door, negative pressure (− 5 Pa) isolation rooms specifically constructed on the top floor of the hospital after the major outbreak of SARS5 to facilitate management of patients with highly infectious diseases. The experimental design and method of data analysis have been described in details in our previous studies8, 9, 10 on exhaled air dispersion related to NPPV and simple oxygen mask. In this study, we examined the extent of exhaled air leakage through the side vents of the jet nebulizer (Salter Labs; Arvin, CA) attached to a high-fidelity HPS (HPS 6.1; Medical Education Technologies Inc.; Sarasota, FL). The jet nebulizer had a built-in air pump driven by a constant flow of air at 6 L/min for the purpose of the study. The nebulizer reservoir was filled with sterile water.
Figure 1.
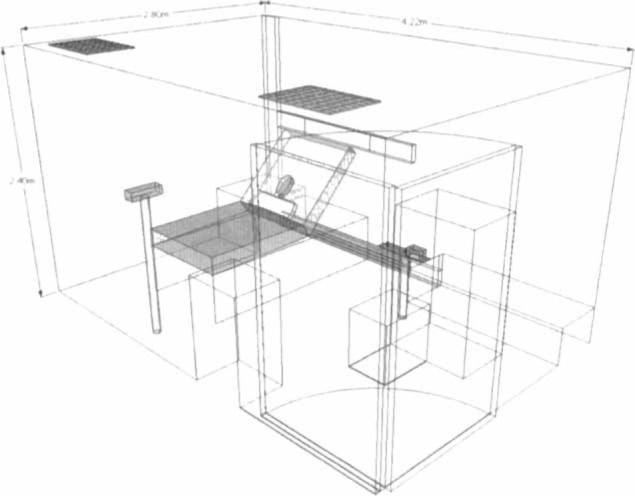
The room dimension and equipment layout inside the negative pressure isolation room. The room measured 4.22 m (depth) by 2.80 m (width) by 2.4 m (height). The camera and laser device were positioned along the sagittal plane and the coronal plane of the head of patient, respectively. Two fresh air diffusers as air inlet were mounted on the ceiling. The negative pressure of the isolation room was provided by the air exhausts positioned at the bottom of the bed.
The HPS contains a realistic airway and a lung model that undergoes gas exchange (ie, it removes oxygen and adds carbon dioxide to the system). Lung compliance and airway resistance also respond in a realistic manner to relevant challenges. In addition, the HPS produces an airflow pattern that is close to the in vivo human situation, and has been applied in previous studies11, 12, 13, 14, 15 to simulate human respiration. The simulator represented a 70-kg adult male sitting on a 45°-inclined hospital bed. In this study, we programmed lung compliance and oxygen consumption of the HPS to mimic three different lung conditions: normal, mild lung injury, and severe lung injury (Table 1 ).16, 17
Table 1.
Three Different Lung Settings of HPS Applied in this Study*
Flow Visualization
Visualization of airflow around the nebulizer mask was facilitated by marking air with smoke particles produced by a smoke generator (M-6000, N19; DS Electronics; Sydney, Australia) as in our previous studies.8, 9, 10 The oil-based smoke particles, measured < 1μm in diameter, are known to follow the airflow pattern precisely with negligible slip.18 The smoke was introduced continuously to the right main bronchus of the HPS. It mixed with alveolar gas and was then exhaled through the airway. Sections through the leakage jet plume were then revealed by a thin laser light sheet created by a diode-pumped solid stated laser device (OEM UGH-800mW; Lambdapro Technologies; Beijing, China), with custom cylindrical optics for two-dimensional laser light sheet generation.8, 9, 10
The experiments were recorded with a digital video camcorder (Sony High-Definition, HDR-SR8E; Sony; Tokyo, Japan; ClearVid CMOS Sensor, Carl Zeiss Vario-Sonnar T *Lens; Carl Zeiss GmbH; Jena, Germany), with optical resolution of 1,440 × 1,080 pixels per video frame. The laser light sheet (green; wavelength, 532 nm; continuous-wave mode) was adjusted to encompass the largest cross-section of the entire leakage jet plume through the nebulizer side vents along the coronal plane lateral to the HPS. This allowed us to investigate the regions directly above and lateral to the mask and the patient. All leakage jet plume images revealed by the laser light sheet were captured by the high-definition video camera positioned at the end of the bed directly opposite to the HPS. Smoke concentration in the plume was estimated from the light scattered by smoke particles (Fig 2 ).8, 9, 10
Figure 2.
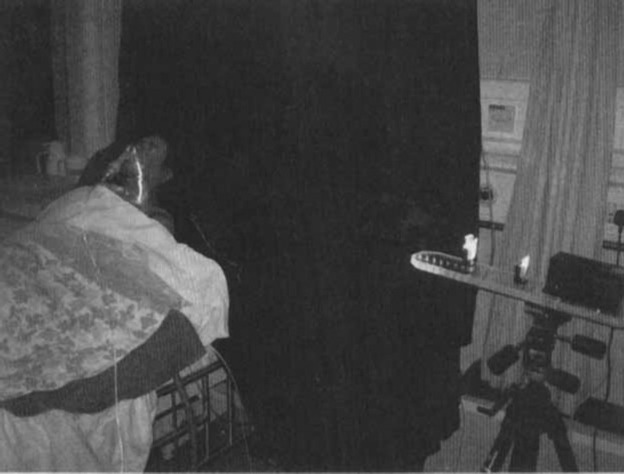
A jet nebulizer was attached to a high-fidelity HPS with a laser light sheet shining from the left side of the simulator at the coronal plane. The simulator represented a 70-kg adult man sitting on a 45°-inclined hospital bed and was programmed to breathe spontaneously.
Image Analysis
We estimated normalized smoke concentration in the mask leakage air from the light scattered by the particles. In short, the thin laser light sheet of near-constant intensity illuminated smoke particle markers in the mask airflow leakage. Smoke particles scattered laser light perpendicular to the light sheet, and this was collected and integrated by the complementary metal oxide semiconductor (CMOS) video camera element and lens.8, 9, 10 This analysis was based on scattered light intensity being proportional to particle concentration under the special conditions of constant intensity laser light sheet illumination and monodisperse, small (submicrometer) particles.18
Image Capture and Frame Extraction
The motion video of several breathing cycles for a given lung model setting was captured to a computer and individual frames extracted as gray scale bitmaps for intensity analysis. Frames were extracted at times corresponding to the beginning of inspiration to generate an ensemble average for the corresponding instant of the respiratory cycle.8, 9, 10 The largest spread of contours from the nebulizer mask was chosen, and this was found to be at approximately the mid-time of the respiratory cycle.
Intensity Averaging and Concentration Normalization
All gray scale frames were read into a program specifically developed for this study (MathCad 8.0; Mathsoft; Cambridge, MA),19 along with background intensity images taken with the laser switched off. The background intensity image was subtracted from each frame pixel by pixel to remove any stray background light, and the pixel intensity values were averaged over all frames to determine the ensemble averaged intensity. The resulting image was the total intensity of light scattered perpendicular to the light sheet by the smoke particles and was directly proportional to smoke concentration. The image was normalized against the highest intensity found within the leakage jet plume to generate normalized particle concentration contours.8, 9, 10
The leakage jet plume consists of a combination of pulmonary smoke and the aerosolized medication. The leakage plume of “unused” aerosolized medications from the jet nebulizer should also be considered as infective because it mixes with the exhaled air before it escapes through the side vents of the nebulizer mask. As the smoke particles mark air that originates from the HPS airways, before leaking from the mask, the concentration contours effectively represent the probability of encountering exhaled air and the aerosolized medication around the patient that has come from within the mask and/or the patient's respiratory system. The smoke concentration contours are made up of data collected from 10 breaths. A contour value of 1 indicates a region that consists entirely of air exhaled by the patient, where there is a very high chance of exposure to the exhaled air, such as at the mask exhaust vents. A value near 0 indicates no measurable air leakage in the region and a small chance of exposure to the exhaled air.8, 9, 10 The study received nonionizing radiation and biological/chemical safety approval by the Chinese University of Hong Kong.
Results
As the exhalation smoke jet was noted to leak through the side vents of the nebulizer mask, we therefore presented the lateral distances of air particle dispersion with reference to the coronal plane (Fig 3 , top left). The dispersion distances increased with worsening lung injury.
Figure 3.

Top left: This photograph was taken with the room light switched off and revealed smoke and aerosolized droplet dispersion through the left exhalation port of the nebulizer mask attached to the simulator. All leakage jet plume images revealed by the laser light sheet were captured by a high-definition video camera positioned at the end of the bed directly opposite to the simulator. The X-axis represents the distance lateral to the center of the nebulizer mask, and the Y-axis represents the vertical distance from the center of the mask. Smoke concentration in the plume was estimated from the light scattered by smoke particles by computer analysis. Top right: The simulator was programmed to mimic normal lung condition, with oxygen consumption set at 200 mL/min and lung compliance at 70 mL/cm H2O. Average respiratory rate was 12 breaths/min, and tidal volume was 700 mL. The maximum dispersion distance of a low concentration (light blue zone on the smoke concentration scale) of smoke particles was 0.45 m, whereas that of a high concentration (red zone and above) was 0.2 m lateral to the simulator. The white color code and the red color code represented regions consisting of 100% and 70%, respectively, of smoke particles, whereas the background of the isolation room (deep blue code) was free of smoke particles. Bottom left: The simulator was programmed to mimic mild lung injury with oxygen consumption of 300 mL/min, lung compliance of 35 mL/cm H2O, respiratory rate of 25 breaths/min, and tidal volume of 300 mL. The maximum exhalation distance of a low concentration of smoke particles increased to 0.54 m, whereas that of a high concentration was 0.15 m. Bottom right: The simulator was programmed to mimic severe lung injury with oxygen consumption of 500 mL/min, lung compliance of 10 mL/cm H2O, respiratory rate of 40 breaths/min, and tidal volume of 150 mL. Although the exhalation distance of a high concentration of smoke particles (red zone) was < 0.1 m, that of a low concentration of smoke particles was noted to extend beyond 0.8 m as a result of more extensive leakage through the nebulizer side vents of the nebulizer mask, with a projectile shape due to gravitational effect.
At normal lung condition (oxygen consumption, 200 mL/min; lung compliance, 70 mL/cm H2O), the average respiratory rate was 12 breaths/min and tidal volume was 700 mL. The maximum dispersion distance of smoke particles, defined as the boundary with a region encountering < 5% concentration of exhaled smoke particles (light blue contour), was 0.45 m, whereas the dispersion distance of a high concentration of smoke particles (white and red zone and above) was 0.2 m (Fig 3, top right). In mild lung injury (oxygen consumption, 300 mL/min; lung compliance, 35 mL/cm H2O; respiratory rate, 25 breaths/min; tidal volume, 300 mL), the maximum dispersion distance of a low concentration of smoke particles increased to 0.54 m, whereas that of a high concentration was 0.15 m (Fig 3, bottom left).
In severe lung injury (oxygen consumption, 500 mL/min; lung compliance, 10 mL/cm H2O; respiratory rate, 40 breaths/min; tidal volume, 150 mL), a larger and more diffuse exhalation jet leaked through the side vents of the nebulizer mask was noted, probably due to its gravitational effect. Although the exhalation distance of a high concentration of smoke particles (eg, red zone on scale) was < 0.1 m, the maximum dispersion distance extended beyond 0.8 m due to more extensive leakage through the nebulizer side vents (Fig 3, bottom right).
Discussion
With an extremely fine smoke particle tracer in order to demonstrate the maximum distribution of exhaled air, this study investigated the dispersion distances of exhaled air particles during application of a jet nebulizer under normal lung condition vs different degrees of lung injury in our hospital isolation room with negative pressure. Using laser smoke visualization methods, we have shown that the maximum dispersion distance of a low concentration of air particles increased from 0.45 m at normal lung condition to 0.54 m and beyond 0.8 m during mild and severe lung injury, respectively. Interestingly, the dispersion of high-concentration smoke particles was reduced with worsening lung injury. These data suggest that the dispersion of exhaled air during application of jet nebulizer is determined by both the expiratory effort and the leakage of “unused” aerosolized droplets through the exhalation ports of the jet nebulizer. In this regard, exhaled air from the lungs contained high concentration of smoke particles and was dispersed according to expiratory flow. Therefore, the dispersion distance of high-concentration smoke particles was significantly reduced by > 40% as the tidal volume was decreased from 700 to 150 mL. In contrast, the extent of leakage of aerosolized droplets was inversely proportional to the tidal volume. Although aerosol deposition within the simulated patient does not model deposition within a real lung, much of the aerosolized medication was deposited within the simulated patient during inspiration, and the amount of leakage was therefore less in normal lung condition than in the severe lung injury model. Although the leakage of aerosolized droplets carried only small amount of exhaled smoke particles, these were responsible for dispersing low-concentration smoke particles to a longer distance in severe lung injury. These findings have important clinical implications to the health-care workers who often manage patients with respiratory failure and febrile illness of unknown etiology at a close distance. It is important to provide adequate respiratory protection for health-care workers in addition to applying standard, contact, and droplet precautions in order to prevent nosocomial infections.
The jet nebulizer is an aerosol-generating device commonly used to deliver aerosolized bronchodilation to patients with airway diseases and pneumonia. It was implicated as the cause of a major hospital outbreak of SARS in 2003.5, 6, 7 While the major routes for transmission of SARS were related to infected droplets and fomites, as is usually the case in viral pneumonia,20 there was evidence that SARS might have spread by airborne transmission.21, 22, 23, 24 It was not entirely clear if different modalities of respiratory support had contributed to the nosocomial outbreaks of SARS through generation of infective aerosols. Our previous studies9, 10 have shown that the maximum exhaled air dispersion distances from patients receiving oxygen via a Hudson mask and during NPPV were 0.4 m and 0.45 m, respectively. A case-control study25 involving 124 medical wards in 26 hospitals in Guangzhou and Hong Kong has identified SARS patients requiring oxygen therapy or NPPV as independent risk factors for superspreading nosocomial outbreaks of SARS.
Our previous study9 has shown an exhaled air dispersion distance of 0.22 m from the simple oxygen mask when oxygen was delivered at 6 L/min to the HPS with mild lung injury. The current study has shown that the jet nebulizer system driven by air at 6 L/min can extend the dispersion distance much further, especially in the presence of more severe lung injury (Table 2 ).
Table 2.
A Summary of Maximum Exhaled Air Dispersion Distances During Application of Different Types of Respiratory Therapy to the HPS Under Different Lung Settings*
| NPPV (Mild Lung Injury)† |
Simple Oxygen Mask (Mild Lung Injury)‡ |
Jet Nebulizer Driven by Air at 6 L/min (Current Study) |
|||
|---|---|---|---|---|---|
| IPAP/EPAP, cm H2O | Distance, m | L/min | Distance, m | Injury | Distance, m |
| 10/4 | 0.40 | 4 | 0.20 | Normal | 0.45 |
| 14/4 | 0.42 | 6 | 0.22 | Mild lung injury | 0.54 |
| 18/4 | 0.45 | 8 | 0.30 | Severe lung injury | > 0.80 |
| 10 | 0.40 | ||||
Lung compliance was set as 35 mL/cm H2O and oxygen consumption at 350 mL/min. Tidal volume and respiratory rate were regulated so that a respiratory exchange ratio of 0.8 was maintained during measurements. Typically, this was achieved with a tidal volume of 500 mL at a rate of 14 breaths/min. IPAP = inspiratory positive airway pressure; EPAP = expiratory positive airway pressure.
By ResMed Mirage Mask (ResMed; Sydney, Australia) [Hui et al10].
Hui et al.9
Apart from aerosol-generating procedures, environmental factors such as medical ward airflow and ventilation play a significant role in the aerosol transmission of infection in health-care premises.26 A recent review4 has demonstrated a strong association between ventilation, air movements in buildings, and the transmission/spread of infectious diseases such as measles, tuberculosis, influenza, and SARS, but there are insufficient data to specify and quantify the minimum ventilation requirements in hospitals and isolation rooms in relation to spread of infectious diseases via the airborne route. In a study27 of the dispersion characteristics of polydispersed droplets in a general hospital ward equipped with ceiling-mixing type ventilation system, the small droplets or droplet nuclei (initial size ≤ 45 μm) behaved as airborne transmittable particles (staying airborne for > 360 s) and the dispersions were strongly affected by the ward ventilation airflow pattern. The expiratory droplets exhibited an initial rapid dispersion followed by slower dispersion in the subsequent stage. In contrast, large droplets (with initial size from 87.5 to 137.5 μm) were subjected to gravitational effects and stayed airborne for < 30 s.
This study has applied smoke particles as markers for exhaled air in the HPS model because there is no safe and reliable marker that can be introduced into human lungs for study.8, 9, 10 The inertia and weight of larger droplets in an air droplet two-phase flow would certainly cause them to have less horizontal dispersion than the continuous air carrier phase in which they travel. However, evaporation of water content in some respiratory droplets during the jet nebulizer therapy would produce droplet nuclei suspended in air, whereas the larger droplets would fall to the ground in a trajectory pathway due to gravitational effects. A droplet nucleus is the airborne residue of a potentially infectious aerosol from which most of the liquid has evaporated and may have diameter < 10 μm.4, 26 As the smoke particles in this study mark the continuous air phase, our data contours are referring to exhaled air and droplet nuclei (including the aerosolized medication) rather than the risk of large droplet transmission.8, 9, 10 However, we could not capture the full air-dispersion distance in severe lung injury because we were unable to position the laser team far away from the HPS due to the small size of the isolation room.
When an infected person coughs or sneezes, respiratory droplets are released. In addition to maintaining contact, droplet, and standard precautions among the health-care workers when providing routine care to patients infected with H5N1 influenza, the World Health Organization28 currently recommends airborne precautions in health-care facilities, including placing patients with suspected and confirmed H5N1 influenza in isolation rooms with at least 12 air exchanges per hour (if available) during aerosol-generating procedures due to the high lethality of the disease and uncertainty about the mode of human-to-human transmission. The negative pressure room will reduce the spread of airborne contamination between rooms. The air-exchange rate and airflow patterns are important factors in the control of airborne virus infection, and good ventilation arrangement may enhance the safety of staff when performing medical treatments within isolation rooms.29 In health-care facilities where negative pressure isolation room is not available, an alternative is to administer bronchodilator to high-risk patients in the form of a metered-dose inhaler via a spacer or in dry powder formulation because these methods have equivalent efficacy to the jet nebulizer in relieving bronchospasm due to acute asthma.30, 31, 32, 33, 34
In summary, this study has shown that substantial exposure to exhaled air occurs at least within 0.8 m from patients receiving treatment via a jet nebulizer in an isolation room with negative pressure. Health-care workers should take special precautions when caring for patients with febrile respiratory illness requiring treatment via a jet nebulizer.
Footnotes
Funding was provided by the Research Fund for the Control of Infectious Diseases No. 06060202 (Food and Health Bureau, Hong Kong Special Administrative Region).
The authors have no conflicts of interest to disclose.
Reproduction of this article is prohibited without written permission from the American College of Chest Physicians (www.chestjournal.org/misc/reprints.shtml).
References
- 1.Abdel-Ghafar AN, Chotpitayasunondh T, Gao Z. Writing Committee of the Second World Health Organization Consultation on Clinical Aspects of Human Infection with Avian Influenza A (H5N1) Virus: update on avian influenza A (H5N1) virus infection in humans. N Engl J Med. 2008;358:261–273. doi: 10.1056/NEJMra0707279. [DOI] [PubMed] [Google Scholar]
- 2.Hui DS. Review of clinical symptoms and spectrum in humans with influenza A/H5N1 infection. Respirology. 2008;13(suppl 1):S10–NS13. doi: 10.1111/j.1440-1843.2008.01247.x. [DOI] [PubMed] [Google Scholar]
- 3.Fabian P, McDevitt JJ, DeHaan WH. Influenza virus in human exhaled breath: an observational study. PLoS ONE. 2008;3:e2691. doi: 10.1371/journal.pone.0002691. [DOI] [PMC free article] [PubMed] [Google Scholar]
- 4.Li Y, Leung GM, Tang JW. Role of ventilation in airborne transmission of infectious agents in the built environment: a multidisciplinary systematic review. Indoor Air. 2007;17:2–18. doi: 10.1111/j.1600-0668.2006.00445.x. [DOI] [PubMed] [Google Scholar]
- 5.Lee N, Hui DS, Wu A. A major outbreak of severe acute respiratory syndrome in Hong Kong. N Engl J Med. 2003;348:1986–1994. doi: 10.1056/NEJMoa030685. [DOI] [PubMed] [Google Scholar]
- 6.Wong RS, Hui DS. Index patient and SARS outbreak in Hong Kong. Emerg Infect Dis. 2004;10:339–341. doi: 10.3201/eid1002.030645. [DOI] [PMC free article] [PubMed] [Google Scholar]
- 7.Tomlinson B, Cockram CS. SARS: experience at Prince of Wales Hospital, Hong Kong. Lancet. 2003;361:1486–1487. doi: 10.1016/S0140-6736(03)13218-7. [DOI] [PMC free article] [PubMed] [Google Scholar]
- 8.Hui DS, Ip M, Tang JW. Airflows around oxygen masks: a potential source of infection? Chest. 2006;130:822–826. doi: 10.1378/chest.130.3.822. [DOI] [PMC free article] [PubMed] [Google Scholar]
- 9.Hui DS, Hall SD, Chan MTV. Exhaled air dispersion during oxygen delivery via a simple oxygen mask. Chest. 2007;132:540–546. doi: 10.1378/chest.07-0636. [DOI] [PMC free article] [PubMed] [Google Scholar]
- 10.Hui DS, Hall SD, Chan MT. Non-invasive positive pressure ventilation: an experimental model to assess air and particle dispersion. Chest. 2006;130:730–740. doi: 10.1378/chest.130.3.730. [DOI] [PMC free article] [PubMed] [Google Scholar]
- 11.Good ML. Patient simulation for training basic and advanced clinical skills. Med Educ. 2003;37(suppl 1):14–N21. doi: 10.1046/j.1365-2923.37.s1.6.x. [DOI] [PubMed] [Google Scholar]
- 12.Meka VV, van Oostrom JH. Bellows-less lung system for the human patient simulator. Med Biol Eng Comput. 2004;42:413–418. doi: 10.1007/BF02344718. [DOI] [PubMed] [Google Scholar]
- 13.So CY, Gomersall CD, Chui PT. Performance of an oxygen delivery device for weaning potentially infectious critically ill patients. Anaesthesia. 2004;59:710–714. doi: 10.1111/j.1365-2044.2004.03802.x. [DOI] [PubMed] [Google Scholar]
- 14.Goodwin JA, van Meurs WL, Sa Couto CD. A model for educational simulation of infant cardiovascular physiology. Anesth Analg. 2004;99:1655–1664. doi: 10.1213/01.ANE.0000134797.52793.AF. [DOI] [PubMed] [Google Scholar]
- 15.Lampotang S, Lizdas DE, Gravenstein N. An audible indication of exhalation increases delivered tidal volume during bag valve mask ventilation of a patient simulator. Anesth Analg. 2006;102:168–171. doi: 10.1213/01.ANE.0000181833.23904.4E. [DOI] [PubMed] [Google Scholar]
- 16.Kuhlen R, Max M, Dembinski R. Breathing pattern and workload during automatic tube compensation, pressure support and T-piece trials in weaning patients. Eur J Anaesthesiol. 2003;20:10–16. doi: 10.1017/s0265021503000024. [DOI] [PubMed] [Google Scholar]
- 17.Light RB. Pulmonary pathophysiology of pneumococcal pneumonia. Semin Respir Infect. 1999;14:218–226. [PubMed] [Google Scholar]
- 18.Soo SL. Fluid dynamics of multiphase systems. Blaisdell Publishing Company; Toronto, Canada: 1967. [Google Scholar]
- 19.Mathcad 8.0 for Windows, users guide. MathSoft; Cambridge, MA: 2000. [Google Scholar]
- 20.Peiris JS, Yuen KY, Osterhaus AD. The severe acute respiratory syndrome. N Engl J Med. 2003;349:2431–2441. doi: 10.1056/NEJMra032498. [DOI] [PubMed] [Google Scholar]
- 21.Yu IT, Li Y, Wong TW. Evidence of airborne transmission of the severe acute respiratory syndrome virus. N Engl J Med. 2004;350:1731–1739. doi: 10.1056/NEJMoa032867. [DOI] [PubMed] [Google Scholar]
- 22.Booth TF, Kournikakis B, Bastien N. Detection of airborne severe acute respiratory syndrome (SARS) coronavirus and environmental contamination in SARS outbreak units. J Infect Dis. 2005;191:1472–1477. doi: 10.1086/429634. [DOI] [PMC free article] [PubMed] [Google Scholar]
- 23.Chu CM, Cheng VC, Hung IF. Viral load distribution in SARS outbreak. Emerg Infect Dis. 2005;11:1882–1886. doi: 10.3201/eid1112.040949. [DOI] [PMC free article] [PubMed] [Google Scholar]
- 24.Yu IT, Wong TW, Chiu YL. Temporal-spatial analysis of severe acute respiratory syndrome among hospital inpatients. Clin Infect Dis. 2005;40:1237–1243. doi: 10.1086/428735. [DOI] [PMC free article] [PubMed] [Google Scholar]
- 25.Yu IT, Xie ZH, Tsoi KK. Why did outbreaks of severe acute respiratory syndrome occur in some hospital wards but not in others? Clin Infect Dis. 2007;44:1017–1025. doi: 10.1086/512819. [DOI] [PMC free article] [PubMed] [Google Scholar]
- 26.Tang JW, Li Y, Eames I. Factors involved in the aerosol transmission of infection and control of ventilation in healthcare premises. J Hosp Infect. 2006;64:100–114. doi: 10.1016/j.jhin.2006.05.022. [DOI] [PMC free article] [PubMed] [Google Scholar]
- 27.Wan MP, Chao CY, Mg YD. Dispersion of expiratory droplets in a general hospital ward with ceiling mixing type mechanical ventilation system. Aerosol Sci Technol. 2007;41:244–258. [Google Scholar]
- 28.Clinical management of human infection with avian influenza A (H5N1) virus: WHO updated advice 15 Aug 2007. Available at: http://www.who.int/csr/disease/avian_influenza/guidelines/clinicalmanage07/en/index.html Accessed December 18, 2007.
- 29.Kao PH, Yang RJ. Virus diffusion in isolation rooms. J Hosp Infect. 2006;62:338–345. doi: 10.1016/j.jhin.2005.07.019. [DOI] [PMC free article] [PubMed] [Google Scholar]
- 30.Raimondi AC, Schottlender J, Lombardi D. Inhaled albuterol via jet nebulizer no better than via metered dose inhaler with spacer or dry powder for Rx of severe asthma. Chest. 1997;112:24–28. doi: 10.1378/chest.112.1.24. [DOI] [PubMed] [Google Scholar]
- 31.Rubilar L, Castro-Rodriguez JA, Girardi G. Randomized trial of salbutamol via metered-dose inhaler with spacer versus nebulizer for acute wheezing in children less than 2 years of age. Pediatr Pulmonol. 2000;29:264–269. doi: 10.1002/(sici)1099-0496(200004)29:4<264::aid-ppul5>3.0.co;2-s. [DOI] [PubMed] [Google Scholar]
- 32.Leversha A, Campanella SG, Aickin RP. Costs and effectiveness of spacer versus nebulizer in young children with moderate and severe acute asthma. J Pediatr. 2000;136:497–502. doi: 10.1016/s0022-3476(00)90013-1. [DOI] [PubMed] [Google Scholar]
- 33.Newman K, Milne S, Hamilton C. A comparison of albuterol administered by metered-dose inhaler and spacer with albuterol by nebulizer in adults presenting to an urban emergency department with acute asthma. Chest. 2002;121:1036–1041. doi: 10.1378/chest.121.4.1036. [DOI] [PubMed] [Google Scholar]
- 34.Delgado A, Chou KJ, Silver EJ. Nebulizers vs metered-dose inhalers with spacers for bronchodilator therapy to treat wheezing in children aged 2 to 24 months in a pediatric emergency department. Arch Pediatr Adolesc Med. 2003;157:76–80. doi: 10.1001/archpedi.157.1.76. [DOI] [PubMed] [Google Scholar]