

Abstract
Study objectives:
Severe acute respiratory syndrome (SARS) is a rapidly progressive disease caused by a novel coronavirus (CoV) infection. However, the disease presentation is nonspecific. The aim of this study was to define clearly the presentation, clinical progression, and laboratory data in a group of patients who had SARS.
Design:
Retrospective observational study.
Setting:
A tertiary care medical center with 51 negative-pressure isolation rooms in Taipei, Taiwan.
Patients:
Fifty-three patients with SARS seen between April 27 and June 16, 2003.
Results:
Fever (ie, temperature > 38°C) was the most common symptom (98%) and the earliest. When admitted to the isolation unit of the hospital for observation, most patients reported nonspecific symptoms associated with their fever. Only two patients with preexisting illnesses had cough on the same day the fever began. Eventually, 39 patients (74%) developed cough, beginning at a mean (± SD) time of 4.5 ± 1.9 days after fever onset, and 35 patients (66%) had diarrhea beginning at a mean time of 6.0 ± 3.3 days after fever onset. Thirty-one patients (59%) had abnormal findings on chest radiographs on hospital admission, and all but 1 patient (98%) eventually developed lung infiltrates that were consistent with pneumonia. The majority of patients (63%) first developed unifocal infiltrates at a mean time of 4.5 ± 2.1 days after fever onset, while in 37% of patients the initial infiltrates were multifocal, appearing at a mean time of 5.8 ± 1.3 days after fever onset. Common laboratory findings included lymphopenia (on hospital admission, 70%; during hospitalization, 95%), thrombocytopenia (on hospital admission, 28%; during hospitalization, 40%), elevated lactate dehydrogenase (on hospital admission, 58%; during hospitalization, 88%), creatine kinase (on hospital admission, 18%; during hospitalization, 32%), and aspartate aminotransferase or alanine aminotransferase levels (on hospital admission, 27%; during hospitalization, 62%). Throat or nasopharyngeal swab for SARS-CoV by reverse transcriptase polymerase chain reaction (PCR) and real-time PCR was positive in 40 of the 47 patients (85%) in whom the test was performed.
Conclusions:
None of the presenting symptoms or laboratory findings are pathognomonic for SARS. Even though cough developed in a majority of patients, it did not occur until later in the disease course, suggesting that a cough preceding or concurrent with the onset of fever is less likely to indicate SARS. While PCR for SARS-CoV appears to be the best early diagnostic test currently available, it is clear that better methods are needed to differentiate between SARS and non-SARS illness on initial presentation.
Key words: clinical course, coronavirus, laboratory data, nasopharyngeal swab, reverse transcriptase polymerase chain reaction, severe acute respiratory syndrome
Abbreviations: ALT, alanine aminotransferase; AST, aspartate aminotransferase; bp, base pairs; CK, creatine kinase; CoV, coronavirus; ED, emergency department; FD, day since fever of > 38°C began; HCW, health-care worker; LDH, lactate dehydrogenase; PCR, polymerase chain reaction; PPE, personal protective equipment; RDS, respiratory distress syndrome; RT, reverse transcriptase; SARS, severe acute respiratory syndrome; WHO, World Health Organization
Severe acute respiratory syndrome (SARS) is caused by a novel coronavirus (CoV) infection,1 2 3 4 5 6 which has spread rapidly around the world through international travel. The spread of infection resulted in significant loss of life and serious economic consequences in affected areas.7 8 9 One of the reasons for the rapid spread and societal disruption was the lack of an effective diagnostic method, necessitating the use of a clinical case definition.10 Unfortunately, this definition was unable to differentiate SARS from other febrile respiratory illnesses. Many studies havesuggested a variety of methods to differentiate between bacterial and viral pneumonia by using clinical,11 radiologic,12 13 and laboratory tests.14 15 However, these methods are not sufficiently reliable under normal circumstances, let alone for the public health crisis presented by SARS.
Any patient suspected of having SARS based on the World Health Organization (WHO) case definition16 required immediate isolation, in a negative-pressure room if possible. Such patients also had to be reported immediately to the public health bureau, which then instituted a quarantine for anyone who had had close contact with the patient. Since, in the early stages, we could not reliably distinguish between SARS and other forms community-acquired pneumonia, many patients who did not have SARS were caught in the wide net cast by the WHO case definition. This placed a tremendous burden on hospitals, especially if adequate isolation facilities were limited, and on the community, where compulsory quarantines severely disrupted normal activities and caused serious anxiety.17 18 Thus, the impact of the outbreak was not confined to the SARS victims themselves and their families. It adversely affected the community, regional health system, and economy. Clearly, if SARS reappears, more precise diagnostic criteria are needed if we are to avoid a repeat of the serious health and societal consequences experienced in the recent outbreak.
Beginning at the end of April 2003, a major outbreak of SARS occurred in Taipei, Taiwan. We managed 167 patients at our hospital who had either suspected or probable SARS according to the WHO case definition (revised May 1, 2003).10 We designed this study to define the clinical course and laboratory findings in a subset of those patients in whom we were able to confirm infection with SARS-CoV, based on either laboratory evidence of the virus or the patient's involvement in a definite chain of transmission. Our purpose was to establish a clear description of the course of the disease in a set of patients in whom other diagnoses had been excluded.
Materials and Methods
Patients
From April 27 to June 16, 2003, 167 patients with probable SARS (71 patients) or suspected SARS (96 patients) according to the modified (May 1, 2003) WHO case definition (ie, high fever of > 38°C, plus cough or breathing difficulty, plus exposure history) were managed at Mackay Memorial Hospital.10 From among patients with both probable and suspected SARS, we selected 53 patients who had convincing evidence of SARS-CoV infection. The evidence consisted either of a positive finding for polymerase chain reaction (PCR) plus a typical clinical course or, in the absence of a positive PCR finding, a typical clinical course with a definite contact history and/or evidence that the patient transmitted the infection to someone else.
Clinical, Laboratory, and Microbiological Studies
The data collected included symptoms, underlying diseases, physical findings, and laboratory values. In order to define the chronologic progression, the first day of documented fever of > 38°C (FD) was designated as FD 1. (Acceptable documentation of the fever was a temperature recorded at a health-care facility, at a community checkpoint, or at home.) Serial chest radiographs were obtained once the patient was isolated in a negative-pressure room. O2 saturation also was recorded after admission to the hospital.
Blood tests consisted of consecutive hematologic examinations, including absolute lymphocyte and platelet counts, and serum biochemistry, including lactate dehydrogenase (LDH), creatine kinase (CK), aspartate aminotransferase (AST), alanine aminotransferase (ALT). These were collected during observation in the emergency department (ED) prior to the institution of our SARS treatment protocol.
To look for alternative diagnoses or possible coinfection, all patients were tested with bacterial blood cultures and serologic studies for the presence of Mycoplasma pneumoniae IgM antibodies, Chlamydia IgA, IgM, and IgG antibodies, the Widal test for Salmonella typhosa O and H antigens, Salmonella paratyposa type A and B antigens, Streptococcus pneumoniae antigen, Haemophilus influenzae antigen, hepatitis B surface antigen, and antibody to hepatitis C.
Reverse-Transcriptase PCR Specific for SARS-CoV
Early in the course of the outbreak, there were no specific diagnostic tests available. Once the reverse transcriptase (RT)-PCR test became available, either a throat or nasopharyngeal swab was obtained from patients with suspected or probable SARS for detection of SARS-CoV RNA.4 5 The extraction of viral RNA (TRIzol; Invitrogen; Carlsbad, CA) was performed in a laminar-flow cabinet in a biosafety level-3 laboratory. Total RNA was reverse-transcribed with random hexamers (ABgene; Epsom, Surrey, UK). The reactions contained 12.5 μL buffer concentrate, 3.6 mmol/L magnesium sulfate, 0.5 μL each primer, 0.5 μL RT/Taq DNA polymerase mixture, and 5 μL RNA in a total volume of 25 μL. The complementary DNA was amplified successively with three pairs of primers, including IN-6/IN-7, Cor-p-F2/Cor-p-R1, and Cor-p-F3/Cor-p-R2. First, a 440-nucleotide segment of open reading frame 1b of the CoV polymerase gene was amplified with the broadly reactive genus-specific primer pair IN-6 (+) 5′GGTTGGGACTATCCTAAGTGTGA3′ and IN-7 (-) 5′CCATCATCAGATAGAATCATCATA3′. The amplified complementary DNA then was subjected to nested PCR using the SARS-specific primer pair Cor-p-F2 (+) 5′CTAACATGCTTAGGATAATGG3′ and Cor-p-R1 (-) 5′CAGGTAAGCGTAAAACTCATC3′. The size of the nested product was 368 base pairs (bp). Drosten et al4 reported that the number of copies of SARS-CoV RNA in the throat was much lower than that in the sputum. Therefore, in order to further improve the sensitivity of nested RT-PCR for the throat samples, we amplified the nested products with a second nested PCR using the SARS-specific primer pair Cor-p-F3 (+) 5′GCCTCTCTTGTTCTTGCTCGC3′ and Cor-p-R2 (-) 5′CCTATTTCTATAGAGACACTC3′. The size of the final product was 348 bp. Thermal cycling was performed at 95°C for 30 s, 55°C for 30 s, 72°C for 45 s, and 40 cycles of 72°C for 7 min. The specificity of the RT-PCR reaction was confirmed by sequencing the positive RT-PCR-amplified products by agarose gel electrophoretic separation. This procedure required about 6 to 8 h, and the patient had to be isolated while awaiting the results. Given the large number of people in this category, it was clear that a more rapid procedure was needed.
Real-Time Quantitative RT-PCR Specific for SARS-CoV
Midway through the outbreak, real-time quantitative RT-PCR became available and took only 3 h to complete (AmpliTaq Gold DNA polymerase one-step RT-PCR kit; Applied Biosystems; Foster City, CA).4 The sequence of the TaqMan probe was 6FAM-ACTTGCGCACTCGTT with a reporter dye at the 5′ end and a quencher dye at the 3′ end. The 150-bp target fragment of SARS-CoV RNA was transcribed in vitro by using the SARS-specific forward primer SAR1S (+) 5′CCTCTCTTGTTCTTGCTCGCA3′ and the reverse primer SAR1AS (-) 5′TATAGTGAGCCGCCACACATG3′. Reactions contained 12.5 μL TaqMan universal buffer, 0.42 μL probe and each of the forward and reverse primers, 0.75 μL RT/Taq DNA polymerase mixture, and 5 μL RNA in a total volume of 25 μL. The reaction mixtures were thermal-cycled at 48°C for 30 min, followed by 45 cycles of 95°C for 10 min, and the 150-bp fragment of complementary DNA was amplified (ABI PRISM 7700 sequence detection system; Applied Biosystems). Plasmids with the target sequence were used to generate the standard curve. The fragment was cloned and transcribed into complementary DNA. An RNA standard transcribed in vitro was generated by amplification of the target region with primers SAR1S and SAR1AS. After optimization with the use of quantified RNA transcribed in vitro, the assay reliably detected 10 copies of RNA per reaction.
Treatment
As soon as the diagnosis of pneumonia or SARS was considered, the patient was placed in an isolation room in the ED under close observation and was treated with IV broad-spectrum antibiotics (ie, ceftriaxone, 500 mg q12h, or cefepime, 500 mg q12h) and oral fluoroquinolones (levofloxacin, 500 mg once daily, or moxifloxacin, 400 mg once daily). Once the clinical presentation fulfilled the case definition for either suspect or probable SARS, the patient was admitted to a negative-pressure isolation room, if available, or to an isolation room in the ICU. The SARS treatment protocol was begun with the oral administration of ribavirin (2,000 mg immediately and 600 mg twice daily for 10 days). If the patient did not improve following 2 days of ribavirin therapy, corticosteroids were administered, starting with IV methylprednisolone at a dose of 1 mg/kg every 8 h for 5 days, then every 12 h for 5 days, followed by oral prednisolone tapered over > 11 days.19 If fever persisted and lung infiltrates or oxygenation worsened after 2 days of standard methylprednisolone therapy, the patient was given pulse methylprednisolone, 500 mg twice daily for 3 days, and/or IV Ig, 1 mg/kg for 2 days. Therapy with oxygen administered by nasal cannula, a nonrebreathing mask, or invasive mechanical ventilation was used to maintain a pulse oxymetric saturation of > 95% or Pao 2 of > 80 mm Hg.
Statistical Analysis
The data are expressed as the mean ± SD. We used a statistical software package (SPSS, version 10.0; SPSS; Chicago, IL) for all analyses.
Results
The 53 patients studied included 18 men and 35 women. The mean age was 39.3 ± 18.1 years (age range, 5 to 91 years). Forty of these patients had a positive PCR finding accompanying a typical clinical course. The remaining 13 patients had a typical clinical course and were clearly linked in a chain of transmission by a history of close contact with a SARS patient and/or evidence of transmission to another patient in whom SARS was subsequently diagnosed. These 13 patients included 7 with a negative PCR finding and 6 others in whom PCR was not performed. The latter group included both staff and patients from the hospital in which significant local transmission initially occurred in Taiwan. No PCR test was available at that time. Thirteen of the 53 patients (25%) were health-care workers (HCWs), 21 patients (42%) had visited hospitals where SARS patients had been treated, 11 patients (21%) had community contact with SARS patients, 1 patient (2%) had traveled to Vietnam, and 7 patients (13%) had an unclear contact history. All patients in the last group had a typical clinical course, and most had a positive PCR finding. There were seven clusters involving family members of 17 patients. Four women were pregnant. Underlying diseases included diabetes (four patients), hypertension (three patients), congestive heart failure (one patient), COPD (one patient), rheumatoid arthritis (one patient), chronic hepatitis B (one patient), and end-stage renal disease requiring hemodialysis (one patient).
The mean incubation period from known exposure to the onset of fever was 6.0 ± 1.8 days. Admission to an isolation unit occurred at a mean of 3.1 ± 2.8 days after the onset of fever. All of the patients had fever as their initial symptom except for one 10-year-old girl. She was part of a family cluster and had a throat swab that yielded a positive PCR finding, despite a negative chest radiograph finding. The symptoms reported by the 53 patients at the time of isolation included chills (36 patients; 68%), general malaise (33 patients; 62%), myalgia (30 patients; 57%), headache (24 patients; 45%), dizziness (17 patients; 32%), and sore throat (13 patients; 25%) [Table 1 ]. Cough eventually developed in 74% of patients (39 of 53 patients). However, only two patients had respiratory symptoms on FD 1, one of whom had COPD and one of whom had congestive heart failure. Both patients had a preexisting history of cough, dyspnea on exertion, and sputum production. Respiratory symptoms, including cough and dyspnea, developed at a mean of FD 4.5 ± 1.9 (Fig 1 ). GI symptoms included diarrhea or loose stools (35 patients; 66%), nausea (6 patients; 11%), vomiting (5 patients; 9%), or abdominal tenderness (5 patients; 9%), but only 4 patients (8%) had diarrhea on FD 1. The onset of diarrhea varied considerably, with a mean of FD 6.0 ± 3.3. It lasted for a mean duration of 6.8 ± 5.1 days.
Table 1.
Symptoms and Signs in SARS Patients on Hospital Admission and During Hospitalization
| Variables | On Admission to Isolation* | During Hospitalization† |
|---|---|---|
| No./Total No./(%) | No./Total No./(%) | |
| Symptoms | ||
| Fever | 52/53/(98) | 52/53/(98) |
| Chills | 36/53/(68) | |
| Malaise | 33/53/(62) | |
| Myalgia | 30/53/(57) | |
| Headache | 24/53/(45) | |
| Dizziness | 17/53/(32) | |
| Sore throat | 13/53/(25) | |
| Respiratory symptoms | ||
| Cough | 36/53/(68) | 39/53/(74) |
| Nonproductive cough | 22/53/(42) | |
| Productive cough | 14/53/(26) | |
| Dyspnea | 21/53/(40) | |
| GI symptoms | ||
| Diarrhea | 19/53/(36) | 35/53/(66) |
| Nausea | 6/53/(11) | |
| Vomiting | 5/53/(9) | |
| Abdominal tenderness | 5/53/(9) | |
| Chest radiograph and O2 saturation | ||
| Infiltrate on chest radiograph | 31/53/(59) | 52/53/(98) |
| Oxygen saturation < 90% or Pao2 < 60 mm Hg breathing room air | 6/53/(11) | 27/53/(51) |
| Hematologic and biochemistry examinations‡ | ||
| Lymphopenia | 30/43/(70) | 40/42/(95) |
| Thrombocytopenia | 12/43/(28) | 16/40/(40) |
| LDH§ | 23/40/(58) | 35/40/(88) |
| CK§ | 7/39/(18) | 12/37/(32) |
| AST∥ | 11/41/(27) | 19/39/(49) |
| ALT∥ | 6/37/(16) | 15/35/(43) |
| SARS CoV assays¶ | ||
| Positive throat or nasopharyngeal swab RT-PCR finding for SARS CoV | 40/47/(85) |
Data were collected during the initial isolation and observation before the SARS treatment protocol with ribavirin and corticosteroid therapy was instituted.
Data were collected during the hospitalization while the patients were receiving the SARS treatment protocol with ribavirin and corticosteroids and/or IV Ig and/or pulse therapy.
Some data were excluded from the analysis in patients with underlying diseases, including uremia, sepsis, heart failure, and hepatitis B infection, and also in children.
Above upper limit of normal.
> 1.5 times upper limit of normal.
Six cases were managed early in the course of the outbreak before RT-PCR was available.
Figure 1.
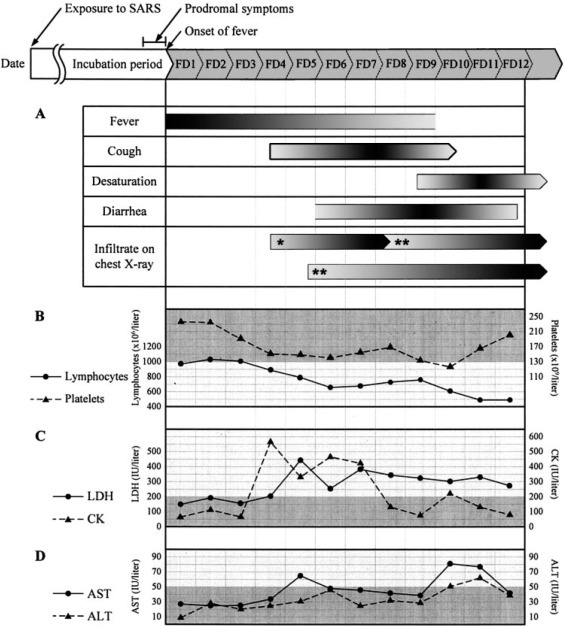
Initial symptoms and signs, and selected laboratory data for 53 patients with SARS-CoV infection at Mackay Memorial Hospital, Taipei, Taiwan. (Time of symptom onset after fever is given as the mean.) A fever of > 38°C occurred after a mean incubation period of 6.0 ± 1.8 days. Top, A: fever (> 38°C) persisted for 9 days, cough began at a mean of FD 4.5, desaturation occurred on FD 9.3, diarrhea began on FD 6.0 (lasting for 6.8 days), unifocal chest radiograph infiltrates were present in two thirds of patients beginning on FD 4.5 and progressed to multifocal involvement by FD 8.3, and one third of patients presented with multifocal infiltrates beginning on FD 5.8. Top middle, B: lymphopenia (absolute cell count, < 1,000 cells/μL) began at a mean of FD 4, and platelet counts were mildly decreased and then returned to normal during the hospital course. Bottom middle, C: LDH and CK levels became elevated beginning on FD 4. Bottom, D: slight initial elevations of AST and ALT levels. Half of the patients had elevated AST and ALT level during hospitalization. * = unifocal infiltrate; ** = multifocal infiltrates.
Slightly more than half of the patients (31 of 53 patients; 59%) had an abnormal chest radiograph finding on the day of hospital admission. All but 1 patient (ie, 52 of 53 patients; 98%) eventually had abnormal chest radiograph patterns that were consistent with pneumonia or respiratory distress syndrome (RDS) [Table 1]. On presentation, 14 patients already had diffuse infiltrates or RDS. Of the remaining 38 patients, two thirds (ie, 24 of 38 patients; 63%) initially (either on hospital admission or once the chest radiograph findings became abnormal) had unifocal airspace infiltrates, appearing at an average of FD 4.5 ± 2.1. The conditions of all but two of these patients progressed to having multifocal infiltrates at a mean of FD 8.3 ± 2.0. The remaining one third of patients (ie, 14 of 38 patients; 37%) had multifocal infiltrates as the first chest radiograph abnormality that we observed after hospital admission. These infiltrates appeared on average by FD 5.8 ± 1.3 and then worsened (Fig 2 ). No patients developed cavitation, pleural effusions, or lymphadenopathy on their radiographs.20
Figure 2.
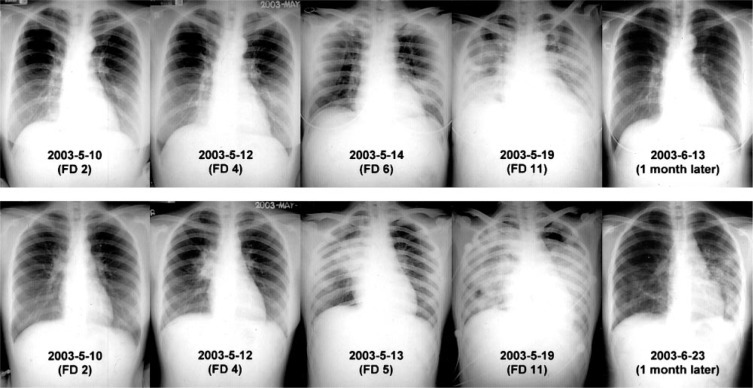
Chest radiograph progression in SARS. Two patients in a cluster, who had contact with the same index patient on May 4, 2003, and both with fever beginning on May 9, 2003. Top row: a 30-year-old woman, a nurse on our ED staff who had worn a complete PPE and had a negative RT-PCR finding for SARS-CoV. Multifocal infiltrates appeared on chest radiographs beginning on FD 6 and then progressed to RDS. One month later, the patient had a normal chest radiograph finding and normal pulmonary function test results. Bottom row: A 20-year-old woman sent to the ED for gastritis who contracted SARS while wearing a surgical mask. She had a nasopharyngeal swab RT-PCR finding that was positive for SARS-CoV. A unifocal infiltrate appeared on FD 4 in the right upper lobe, and then progressed to multifocal infiltrates and RDS. One month later, there were residual interstitial pulmonary lesions and a mild restrictive pulmonary defect with decreased diffusing capacity.
Six patients (11%) had arterial oxygen desaturation to < 90% or a Pao 2 of < 60 mm Hg while breathing room air on initial presentation (Table 1). Eventually, 27 patients (51%) developed desaturation at a mean of FD 9.3 ± 2.3 (Fig 1). Five patients (9%) developed pneumothorax or pneumomediastinum during hospitalization, three of whom died. Twelve patients (23%) had RDS requiring endotracheal intubation and mechanical ventilation. Eleven of these patients died, 8 with intractable hypoxia, and 1 each with arrhythmia, tension pneumothorax, and hyperosmolar nonketotic coma.
Lymphopenia (ie, absolute lymphocyte count, < 1,000 cells/μL) and thrombocytopenia (ie, platelet count, < 130,000 cells/μL) were common (Table 1). Two thirds of patients (ie, 30 of 43 patients; 70%) had lymphocytopenia on presentation, and eventually 95% became lymphopenic. The absolute lymphocyte count decreased to a level of < 1,000 cells/μL, usually after FD 4 (Fig 1). Thrombocytopenia was less common, being present in one third of patients (ie, 12 of 43 patients; 28%) on presentation and eventually occurring in 40% (ie, 16 of 40 patients). In most situations, the platelet counts were not so low as to cause bleeding, and they returned to normal levels during the hospital course.
Elevations of LDH, CK, AST, and ALT were common (Table 1). LDH was elevated in half of the patients (ie, 23 of 40 patients; 58%) on initial presentation and in most of the patients (ie, 35 of 40 patients; 88%) at some point in the hospital course. It increased as the disease progressed to a mean of around 200 IU/L at an average of FD 5 (Fig 1). An elevated CK level was present in one fifth of patients (ie, 7 of 39 patients; 18%) on initial presentation and in a total of one third of patients (ie, 12 of 37 patients; 32%) during hospitalization. AST levels were elevated in 27% of patients (11 of 41 patients) initially and eventually in 49% (19 of 39 patients). ALT levels were high in only 16% of patients (6 of 37 patients) on hospital admission but eventually increased to abnormal levels in nearly half (ie, 15 of 35 patients; 43%). AST or ALT levels were elevated in 27% of patients (11 of 41 patients) initially and in 62% (24 of 39 patients) eventually.
Throat or nasopharyngeal swabs for SARS-CoV RT-PCR and real-time quantitative-PCR were performed either in the ED or in isolation wards after hospital admission. Forty patients (ie, 40 of 47 patients; 85%) had a positive RT-PCR or real-time quantitative-PCR (Table 1). In seven patients, PCR findings remained negative, of whom four were HCWs. Six members of our staff became infected while caring for patients with SARS,21 although they were wearing full personal protective equipment (PPE) when in contact with patients.16 22 However, the other seven HCWs that we treated who were from the hospital and had nosocomial infections had not been wearing complete PPE, and they all had a positive RT-PCR finding.
Discussion
We have described the clinical course and findings in a set of patients in whom the diagnosis of SARS was fairly certain. Case series17 published during the outbreak most likely included some patients with diseases other than SARS. The disease pattern we have delineated in patients with confirmed SARS will be useful for comparison with other series of patients with confirmed SARS-CoV infection. In addition, it will allow us to compare the clinical presentation of SARS with that of other febrile respiratory illnesses to determine whether there are features that are helpful in making a distinction between different entities.
In our series, the mean incubation period between exposure to the index patient and the onset of fever of > 38°C was 6.0 ± 1.8 days (Fig 1). Most patients experienced minor symptoms for 1 to 2 days before that, including low-grade fever, general malaise, headache, dizziness, or loose stools. Once the fever increased, it remained high rather than resolving within a few days. All of our patients except one had fever as the initial specific manifestation of SARS except for one 10-year-old girl who was part of a family cluster. Others have also reported7 8 9 23 24 25 26 27 28 fever as an early sign in almost all patients with SARS. Although it has been noted that fever may be absent in some elderly patients,9 we did not observe this in any of our patients.
Although the most significant initial respiratory symptoms in our series were cough and dyspnea, only two patients had cough preceding their fevers. Both had histories of cough and dyspnea, one due to COPD and the other due to congestive heart failure. All of the other patients experienced several days of high fever before developing respiratory symptoms. This suggests that, in the absence of an underlying cardiopulmonary disease, patients presenting with a cough that precedes or is concurrent with a high fever are less likely to have SARS. Pharyngitis is a symptom that is common to other CoV infections.29 It occurred in one fourth of our patients. Other CoVs rarely have hepatic involvement,29 but elevated liver enzyme levels were present in half our patients, although without jaundice or serious decline in liver function. Abdominal complaints, including loose stools and pain, were also common (66% of patients). However, these symptoms began only after the onset of a high fever. Fever to this degree is less common in other viral infections that cause similar symptoms. Therefore, it appears that strict isolation may not be necessary for patients who do not have fever as the first symptom of a respiratory illness, assuming that they do not have an underlying disease that causes similar respiratory symptoms.
Although our data showed that HCWs were at significant risk for infection with the SARS virus,21 22 23 24 25 30 mortality among this group seems to be reduced by the use of proper personal protection.30 Six of our own staff and seven nurses from another hospital were among our patients. One of the latter had a tension pneumothorax and died of acute respiratory failure. None of our own staff died. The other hospital was the site of the first major local transmission of SARS on Taiwan. None of the seven nurses from that hospital had been wearing a complete PPE,16 22 in contrast to the six members of our staff who became infected. It may be that the use of protective equipment, including N95 masks, goggles, and gowns, lessened the viral load in the initial inoculum, perhaps accounting for the good outcome in our six staff members. This suggestion is further supported by the fact that four of our infected staff members had a negative PCR finding for SARS. Their clinical courses and chest radiograph findings, however, were totally consistent with SARS, and none had evidence of any other infection that could explain their illness. It is noteworthy that these four patients had experienced low-grade fevers for 1 or 2 days before the onset of high fever. Wearing full protective equipment, they continued to care for patients for that period, as they did not fulfill the criteria in use at that time for isolation.22 (They were immediately isolated when their temperatures rose to > 38°C.) There is no evidence that they transmitted SARS to anyone else, again suggesting that the protective equipment is successful in limiting the spread of the virus.
Eleven of the 12 patients receiving mechanical ventilation eventually died, although the immediate cause of death varied. It does suggest, however, that acute respiratory failure is an important factor in determining outcome. Children seem to have milder symptoms, fewer complications, and better outcomes than adults.27 We had four pediatric patients in two family clusters. One patient had positive throat swab PCR findings, and the other three had abnormal chest radiograph findings. All four patients recovered completely with supportive treatment.
Characteristic abnormal laboratory data in SARS include increased AST, ALT, LDH, and CK levels, and lymphopenia and thrombocytopenia beginning on FD 4.7 8 9 23 24 25 26 27 28 Chest radiographs were often normal in the first 3 days after the onset of fever, with unifocal infiltrates or mutifocal infiltrates appearing 4 or 5 days after fever onset.20 26 27 28 These findings are as nonspecific as the symptoms, however, and do not help to differentiate SARS from other atypical pneumonias on presentation. They are therefore not helpful in determining the need for isolation.
At present, RT-PCR on a nasopharyngeal or throat swab is the standard method for the diagnosis of SARS.10 In our series, it was positive in 85% of patients tested. We believe that the negative results in seven patients were false-negative results. The relatively low sensitivity could result from differences in viral load, sampling methods and accuracy, or timing. Once the results of antibody testing are available, we will be in a better position to assess the characteristics of PCR. It will also be important to review the course of the disease in other groups of patients with confirmed SARS to see whether a similar pattern can be discerned. We also need to compare this pattern of onset with other types of atypical pneumonia to determine whether there are features that will adequately distinguish SARS.
Should SARS reappear, it is clear that we need better methods to diagnose it rapidly, both to limit further spread and to minimize the use of scarce health-care resources. The modified WHO case definition is not sufficient to differentiate SARS from other similar illnesses on presentation, as there is too much overlap with other febrile respiratory syndromes.10 17 The results of our series suggest that it is important to time the appearance of other symptoms and signs in relation to the onset of a high fever. We believe that otherwise healthy individuals who develop a cough before or simultaneously with a high fever are less likely to have SARS.
ACKNOWLEDGMENT
We thank Dr. Chin-Yin Sheu, Chairman of the Radiology Department, Mackay Memorial Hospital, for reviewing the radiographs and Dr. Mary Jeanne Buttrey, Consulting Physician, Department of Internal Medicine, Mackay Memorial Hospital, for critical review and revision of the manuscript.
Footnotes
Drs. Liu and Lu are the principal coinvestigators who jointly wrote the report, and supervised the clinical and virologic components of the study.
This study was partly supported by the Taiwan National Science Council (grant No. NSC92–2751-B-195–001-Y) and the National SARS Research Program (grant No. SCLI01).
References
- 1.Ksiazek TG, Erdman D, Goldsmith CS. A novel coronavirus associated with severe acute respiratory syndrome. N Engl J Med. 2003;348:1953–1966. doi: 10.1056/NEJMoa030781. [DOI] [PubMed] [Google Scholar]
- 2.Peiris JSM, Lai ST, Poon LLM. Coronavirus as a possible cause of severe acute respiratory syndrome. Lancet. 2003;361:1319–1325. doi: 10.1016/S0140-6736(03)13077-2. [DOI] [PMC free article] [PubMed] [Google Scholar]
- 3.Ruan Y, Wei CL, Ee LA. Comparative full-length genome sequence analysis of 14 SARS coronavirus isolates and common mutations associated with putative origins of infection. Lancet. 2003;361:1779–1785. doi: 10.1016/S0140-6736(03)13414-9. [DOI] [PMC free article] [PubMed] [Google Scholar]
- 4.Drosten C, Gunther S, Preiser W. Identification of a novel coronavirus in patients with severe acute respiratory syndrome. N Engl J Med. 2003;348:1967–1976. doi: 10.1056/NEJMoa030747. [DOI] [PubMed] [Google Scholar]
- 5.Centers for Disease Control and Prevention SARS coronavirus sequencing. Available at: http://www.cdc.gov/ncidod/sars/sequence.htm Accessed July 13, 2004.
- 6.Kuiken T, Fouchier RAM, Schutten M. Newly discovered coronavirus as the primary cause of severe acute respiratory syndrome. Lancet. 2003;362:263–270. doi: 10.1016/S0140-6736(03)13967-0. [DOI] [PMC free article] [PubMed] [Google Scholar]
- 7.Lee N, Hui D, Wu A. A major outbreak of severe acute respiratory syndrome in Hong Kong. N Engl J Med. 2003;348:1986–1994. doi: 10.1056/NEJMoa030685. [DOI] [PubMed] [Google Scholar]
- 8.Poutanen SM, Low DE, Henry B. Identification of severe acute respiratory syndrome in Canada. N Engl J Med. 2003;348:1995–2005. doi: 10.1056/NEJMoa030634. [DOI] [PubMed] [Google Scholar]
- 9.Donnelly CA, Ghani AC, Leung GM. Epidemiological determinants of spread of causal agent of severe acute respiratory syndrome in Hong Kong. Lancet. 2003;361:1761–1766. doi: 10.1016/S0140-6736(03)13410-1. [DOI] [PMC free article] [PubMed] [Google Scholar]
- 10.World Health Organization Case definitions for surveillance of severe acute respiratory syndrome (SARS): revised 1 May 2003. Available at: http://www.who.int/csr/sars/casedefinition/en/ Accessed July 12, 2004.
- 11.Smyth A. Pneumonia due to viral and atypical organisms and their sequelae. Br Med Bull. 2002;61:247–262. doi: 10.1093/bmb/61.1.247. [DOI] [PubMed] [Google Scholar]
- 12.Reittner P, Ward S, Heyneman L. Pneumonia: high-resolution CT findings in 114 patients. Eur Radiol. 2003;13:515–521. doi: 10.1007/s00330-002-1490-3. [DOI] [PubMed] [Google Scholar]
- 13.Franquet T. Imaging of pneumonia: trends and algorithms. Eur Respir J. 2001;18:196–208. doi: 10.1183/09031936.01.00213501. [DOI] [PubMed] [Google Scholar]
- 14.Bohte R, van Furth R, van den Broek PJ. Aetiology of community-acquired pneumonia: a prospective study among adults requiring admission to hospital. Thorax. 1995;50:543–547. doi: 10.1136/thx.50.5.543. [DOI] [PMC free article] [PubMed] [Google Scholar]
- 15.Virkki R, Juven T, Rikalainen H. Differentiation of bacterial and viral pneumonia in children. Thorax. 2002;57:438–441. doi: 10.1136/thorax.57.5.438. [DOI] [PMC free article] [PubMed] [Google Scholar]
- 16.World Health Organization Hospital infection control guidance for severe acute respiratory syndrome (SARS): revised 24 April 2003. Available at: http://www.who.int/csr/sars/infectioncontrol/en/ Accessed July 12, 2004.
- 17.Hon KLE, Li AM, Cheng FWT. Personal view of SARS: confusing definition, confusing diagnoses. Lancet. 2003;361:1984–1985. doi: 10.1016/S0140-6736(03)13556-8. [DOI] [PMC free article] [PubMed] [Google Scholar]
- 18.Maunder R, Hunter J, Vincent L. The immediate psychological and occupational impact of the 2003 SARS outbreak in teaching hospital. Can Med Assoc J. 2003;168:1245–1251. [PMC free article] [PubMed] [Google Scholar]
- 19.So LKY, Lau ACW, Yam LYC. Development of a standard treatment protocol for severe acute respiratory syndrome. Lancet. 2003;361:1615–1617. doi: 10.1016/S0140-6736(03)13265-5. [DOI] [PMC free article] [PubMed] [Google Scholar]
- 20.Wong KT, Antonio GE, Hui DSC. Severe acute respiratory syndrome: radiographic appearances and pattern of progression in 138 patients. Radiology. 2003;228:401–406. doi: 10.1148/radiol.2282030593. [DOI] [PubMed] [Google Scholar]
- 21.Centers for Diseases Control and Prevention Cluster of severe acute respiratory syndrome cases among protected health-care workers: Toronto, Canada, April 2003. JAMA. 2003;289:2788–2789. doi: 10.1001/jama.289.21.2788. [DOI] [PubMed] [Google Scholar]
- 22.Centers for Diseases Control and Prevention Interim domestic guidance for management of exposures to severe acute respiratory syndrome (SARS) for health-care settings. Available at: http://www.cdc.gov/ncidod/sars/exposureguidance.htm Accessed July 12, 2004.
- 23.Avendano M, Derkach P, Swan S. Clinical course and management of SARS in health care workers in Toronto: a case series. Can Med Assoc J. 2003;168:1649–1660. [PMC free article] [PubMed] [Google Scholar]
- 24.Dwosh HA, Hong HHL, Austgarden D. Identification and containment of an outbreak of SARS in a community hospital. Can Med Assoc J. 2003;168:1415–1420. [PMC free article] [PubMed] [Google Scholar]
- 25.Varia M, Wilson S, Sarwal S. Investigation of a nosocomial outbreak of severe acute respiratory syndrome (SARS) in Toronto, Canada. Can Med Assoc J. 2003;169:285–292. [PMC free article] [PubMed] [Google Scholar]
- 26.Peiris JSM, Chu CM, Cheng VCC. Clinical progression and viral load in a community outbreak of coronavirus-associated SARS pneumonia: a prospective study. Lancet. 2003;361:1767–1772. doi: 10.1016/S0140-6736(03)13412-5. [DOI] [PMC free article] [PubMed] [Google Scholar]
- 27.Hon KLE, Leung CW, Cheng WTF. Clinical presentations and outcome of severe acute respiratory syndrome in children. Lancet. 2003;361:1701–1703. doi: 10.1016/S0140-6736(03)13364-8. [DOI] [PMC free article] [PubMed] [Google Scholar]
- 28.Booth CM, Matukas LM, Tomlinson GA. Clinical features and short-term outcomes of 144 patients with SARS in the greater Toronto area. JAMA. 2003;289:2801–2809. doi: 10.1001/jama.289.21.JOC30885. [DOI] [PubMed] [Google Scholar]
- 29.Vabret A, Mourez T, Gouarin S. An outbreak of coronavirus OC43 respiratory infection in Normandy, France. Clin Infect Dis. 2003;36:985–989. doi: 10.1086/374222. [DOI] [PMC free article] [PubMed] [Google Scholar]
- 30.Tsui PT, Kwok ML, Yuen H. Severe acute respiratory syndrome: clinical outcome and prognostic correlates. Emerg Infect Dis. 2003;9:1064–1069. doi: 10.3201/eid0909.030362. [DOI] [PMC free article] [PubMed] [Google Scholar]