

Abstract
In this article, we present an overview of the different strategies for sample preparation for identification by mass spectrometry (MS) of biomarkers from serum and/or plasma. We consider the effects of the variables involved in sample collection, handling and storage, and describe different approaches for removal of high abundance proteins and serum/plasma fractionation. We review the advantages and disadvantages of such techniques as centrifugal ultrafiltration, different formats for solid phase extraction, organic solvent extraction, gel and capillary electrophoresis, and liquid chromatography. We also discuss a variety of current proteomic methods and their main applications for biomarker-related studies.
Keywords: Biomarkers, Sample preparation, Mass spectrometry, Proteomics, Serum/plasma
1. Introduction
A handful of biomarkers, described by Adkins et al. [1] as “proteins that undergo a change in concentration or state in association with a biological process or disease”, are currently used routinely for population screening, disease diagnosis, prognosis, monitoring of therapy, and prediction of therapeutic response. Unfortunately, most of these biomarkers suffer from low sensitivity, specificity, and predictive value, particularly when applied to rare diseases in population screening programs [2]. In the past few years, the development and implementation of proteomic technologies to the field of protein biomarker discovery has undergone exponential growth. Most of these proteomic technology platforms are centered on the implementation of mass spectrometry in conjunction with several other analytical techniques, such as solid phase extraction, chromatography, and electrophoresis [3].
The biomarker-related proteomics studies carried out to date have focused on identifying a particular biomarker or a group of biomarkers able to distinguish between different states for a given disease, or on discovering the so-called “proteomic patterns” for disease diagnosis that can be observed within mass spectra. The seminal (but later controversial) study that generated excitement for the use of proteomic patterns as a tool for disease diagnosis was reported by Petricoin et al. [4]. In this study, mass spectra, or proteomic patterns, of serum samples from women with ovarian cancer and healthy, matched controls, were acquired using SELDI-TOF MS [5]. The inherent throughput of proteomic pattern technology enables the analysis of hundreds of clinical samples per day [5]. However, although mass spectrometric patterns may be very useful, it now seems clear that knowing the identity of the protein marker(s) is crucial in order to validate these biomarkers.
As described by Zolg and Langen [6], bringing a biomarker to market as a diagnostic tool generally involves three phases: (i) discovery, (ii) prototype marker development, and (iii) product development. Moreover, the discovery phase can be further split into three major stages: (i) identification of potential biomarkers, (ii) prioritization of identified biomarkers, and (iii) preliminary validation (qualification) of prioritized biomarkers [3]. Unfortunately, most of the studies carried out so far only deal with the discovery phase and within this, only with the identification of potential biomarkers. It seems clear that much more effort, especially in the validation stage, is needed before these biomarkers actually can be used for clinical purposes.
Serum and plasma potentially contain elements of all proteins produced in the body [7]. Many studies suggest that low molecular weight (LMW) protein/peptides in plasma or serum, such as peptide hormones or small secreted proteins, are correlated with pathological conditions and present opportunities for potential clinical utility for therapeutic intervention or as diagnostic or prognostic biomarkers [4], [8], [9], [10], [11], [12]. The technical challenge in the analysis of the serum/plasma proteome is that the serum/plasma proteins are present at unequal concentrations. A few are so dominant, such as serum albumin and immunoglobulins (almost 90% of total serum/plasma protein by weight), that they mask the detection of other proteins, especially low abundance proteins [13], [14]. Without fractionation, the complexity of serum and plasma can be overwhelming, and important biological information can be lost in the background noise [15]. Not surprisingly, sample preparation strategies including preliminary procedures for sampling, handling and storage, methods for removal of high abundance proteins, and fractionation approaches constitute an important field of study for scientists involved in biomarker-related projects.
Sample preparation remains one of the most time consuming, error prone aspects of analytical chemistry, so much so that it is increasingly being recognized as an important area of specialization in this field [16]. Standardizing sample preparation procedures for serum/plasma profiling is therefore critical for obtaining reliable biomarkers and especially for building biomarker patterns, since slight changes in a given sample preparation procedure can lead to very different protein profiles [17]. Standardizing a given procedure involves the following actions: (i) feasibility studies or examination of the literature, consultation with experts and selection of a few methods. (ii) Interlaboratory studies using the selected methods and reference materials. From the results, changes in the method to be used in the last step may be decided upon. (iii) Validation through interlaboratory studies, in which the participating laboratories receive samples for analysis following a strict protocol. The results thus obtained lead to either adopting the validated protocol or restarting the standardization process by reselecting methods in the light of the outcome of the failed attempt [16].
In this review, we attempt to present an overview of the state of the art of sample preparation for serum/plasma protein profiling and biomarker identification prior to MS. We review the effects of the variables involved in sample collection and handling, such as the type of collection tubes and anticoagulants, the clotting and the incubation times before the serum or the plasma is separated from the clot or the blood cells, respectively, and storage conditions. We also discuss different strategies used for removal of high abundance proteins, as well as fractionation techniques used either to generate several fractions or to selectively obtain a particular subset of proteins/peptides.
2. Sample collection, handling, and storage
Although the great impact that sample collection, handling and storage have on the sensitivity, selectivity, and reproducibility of any given analysis is well known, little has been done to address these effects on serum/plasma samples used in biomarker-related studies. A few studies have been carried out showing that sampling procedures had the greatest effects on proteome profiling, while handling procedures and storage conditions had relatively minor effects [18]. However, everyone agrees that standardized protocols for serum/plasma sampling, handling and storage are required since the issue is not about which procedure is better but rather about using standardized procedures to obtain comparable and reproducible results between different laboratories [19]. We comment below on the differences between serum and plasma, and the influences on their composition exerted by the type of collection tubes or anticoagulant used (if using plasma samples), the clotting and incubation times before separating the serum or plasma from the clot or the blood cells, respectively, and storage conditions.
2.1. Serum versus plasma
Plasma is the liquid component of blood, in which the blood cells are suspended. Plasma is the largest single component of blood, comprising about 55% of total blood volume. For any kind of hematological test, plasma is obtained from whole blood. To prevent clotting, an anticoagulant, such as citrate or heparine can be added to the blood immediately after it is obtained. The sample is then centrifuged to separate plasma from blood cells. For many biochemical laboratory tests, plasma and blood serum can be used interchangeably. Serum resembles plasma in composition but lacks the coagulation factors. It is obtained by letting a blood specimen clot prior to centrifugation. For this purpose, a serum-separating tube can be used which contains an inert catalyst (such as glass beads or powder) to facilitate clotting as well as a portion of gel with a density designed to sit between the liquid and cellular layers in the tube after centrifugation, making their separation more convenient.
Although serum is preferred for many tests because the anticoagulants in plasma can sometimes interfere with the results, plasma seems to be more stable than serum. It has been shown by many authors that protein profiles obtained from plasma and serum are very different [18], [20]. At this time, insufficient information is available to decide whether serum or plasma should be preferred in proteomic studies for biomarker discovery. While most studies have used serum, further research on this topic is required [21]. The ideal solution would be the use of both of them, although that would complicate data analysis and require longer processing times.
2.2. Collection tubes
Previous studies on the effects of blood collection on many other types of laboratory analyses [22], [23], [24] suggest that optimization and standardization of collection tubes is an important element in reliable analysis of serum or plasma proteins. Commercially available blood collection tubes contain multiple components that may appear as interfering or confounding peaks during the MS analysis. Silicones are commonly used as lubricants for stoppers or coatings for the internal surface of tubes. Polymeric surfactants, such as polyvinylpyrrolidones or polyethelene glycols may be added to influence surface wetting. Tubes may also contain either clot inhibitors or activators. Serum separator tubes contain polymeric gels with several constituents to adjust viscosity, density and other physical properties. Rubber stoppers and the plastics comprising tube walls may also shed some polymers [25]. Drake et al. [25] examined the shedding of components from several collection tubes commonly used. Instead of using serum or plasma, the study was carried out with an aqueous saline solution simulating typical contact times of blood components with the tube from collection to processing, thus avoiding the potential confusion of whether observed peaks represent peaks derived from the tubes or from the serum/plasma components. The study showed that seven out of 11 tubes tested added polymeric components detected as multiple signals in the m/z range 1000–3000. These peaks could potentially complicate and compromise the interpretation of MS spectra in the low molecular weight range [25], especially when using MALDI or SELDI, in which a broad spectrum of different components is measured in a single analysis.
In addition to the shedding of components from the tube, adsorption of serum/plasma proteins to the tube may occur, so different protein profiles from the same sample can be obtained depending on the kind of tube used. Actually, significant differences have been found when comparing red-top tubes (glass tubes containing no preservatives or anticoagulants) and tiger-top tubes (also known as serum separator tubes or SST) in different studies [18], [26].
2.3. Anticoagulants
In order to use plasma samples, clotting must be prevented by using anticoagulants immediately after the blood is collected. They can be added to the samples, although usually the anticoagulants are already in the collection tubes. Each of the anticoagulants used for preparation of plasma samples has inherent advantages and disadvantages. Although platelets are more stable in citrate anticoagulants, collecting tubes usually contain a liquid form that dilutes the plasma. Heparinized samples also appear to be relatively stable [27], but heparin, which acts by binding to, and enhancing the activity of, antithrombin III, also binds to a significant number of other proteins [28]. EDTA-treated blood is only slightly less stable, but over longer periods of time, marked changes appear as elapsed time before centrifugation increases [20]. Because the activity of many proteases requires metals, the chelating action of EDTA may help prevent coagulation [20]. Prominent changes to MS protein profiles have been observed after comparing different anticoagulants [29], [30]. Plasma protein profiles obtained by EDTA treatment were most divergent from those obtained by citrate or heparin treatment [18]. This may be due to the fact that EDTA causes platelet clumping and aggregation, which might change the protein contents of plasma [31].
2.4. Clotting time and time of incubation before plasma separation from blood cells
The effects of the clotting time on protein profiles obtained from serum and the incubation time before separation of plasma from blood cells have been extensively studied by Hsieh et al. [18]. Serum and plasma samples obtained from blood stored at either 4 °C or room temperature for 1, 12 or 24 h clotting or incubation time, respectively, were analyzed. Protein profiles from plasma samples changed as the time lag before separating plasma from blood cells increased at either 4 °C or room temperature, although protein profiles obtained under the same conditions among different individuals showed relative consistency. The authors attributed the changes observed to the continuous metabolism of blood cells, the alterations of cell membrane integrity resulting in continuous release of metabolites, and/or the release of degraded products from the clot [18]. Changes in protein profiles obtained from serum samples were also observed for the different clotting times at both 4 °C and room temperature [18]. These results are consistent with those obtained by other authors [26], [32]. Villanueva et al. [26] observed significant differences in MS protein/peptide peak intensities depending on the clotting time. Sometimes the intensity of the peaks diminished with the clotting time, but in other cases it increased. The authors explained this behavior as the degradation of plasma peptides or, on the other hand, the formation/accumulation of new peptides during and after the clotting process [26].
2.5. Storage conditions
The effects of short-term storage of serum and plasma and the storage temperature have been studied [18], [32]. Only minimal changes have been observed in the samples stored at room temperature within the first 6 h [18] or 4 h [32], while the changes became observable after 8 h, particularly for peaks in the m/z range <3000. These differences became even more pronounced after 24 h [33]. For serum and plasma stored up to 24 h at 4 °C, the profiles were quite similar. However, if the time was prolonged to 48 or 96 h, significant changes were observed [32].
For long-term storage of plasma/serum samples, no major differences have been observed at −20, −80 °C or using liquid nitrogen [19], [32]. However, there is some controversy as to whether freeze/thaw cycles may alter the serum/plasma composition. After repeated freezing at −80 °C and thawing on ice of serum/plasma samples up to 10 times, no detectable changes were observed [18]. Similar results have been reported by other authors [34], [35], [36], [37]. Noo et al. [37] observed small and consistent changes in protein profiles after increasing the number of freeze-thaw cycles, with the exception of a set of serum samples that were thawed only once but at room temperature instead of at 4 °C. However, it is still generally believed that freeze/thaw cycles will greatly change the serum/plasma composition most likely due to peptide aggregation, precipitation and adsorption to surfaces [26], [29] (Fig. 1 ). Hsieh et al. pointed out that this discrepancy could be attributed to variations in thawing procedures or in assay methods since the influence of freeze/thawing was measured on the basis of whole spectra [18] or several selected peaks [29].
Fig. 1.
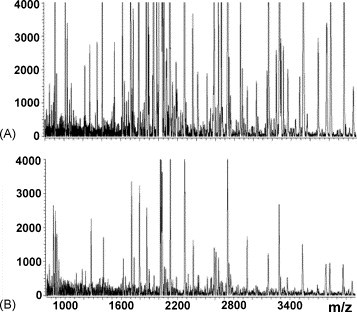
Effect of freeze-thaw cycles on serum peptide profiling using RP magnetic particles and MALDI-TOF MS. (A) Mass spectrum from serum subjected to two freeze-thaw cycles. (B) Mass spectrum from serum subjected to four freeze-thaw cycles. Reproduced from Villanueva et al. [26] by permission of the American Chemical Society.
3. Depletion of highly abundant proteins
As mentioned previously, comprehensive analyses of serum and plasma have proven to be difficult, especially for low molecular weight and low abundance proteins, because of the wide range of concentration with the 10 most abundant proteins constituting almost 90% of the serum proteome by mass. The different strategies and techniques for removal of high abundance proteins (see Table 1 ) are reviewed here.
Table 1.
Strategies used for depletion of highly abundant proteins
| Strategy | Advantages | Disadvantages |
|---|---|---|
| Centrifugal ultrafiltration | Fast | Potential loss of components binding to HMW proteins |
| Easy to operate | ||
| Inexpensive | ||
| Solid phase extraction | ||
| Columns | High selectivity | |
| High reproducibility | ||
| High sensitivity when using a series of different columns | High cost (especially antibody-based depletion columns) | |
| Low sample capacity | ||
| Disk plates | Highly suitable for automation | |
| Organic solvent extraction | Fast | Requires organic solvents |
| Easy to operate | Dilution of the sample | |
3.1. Centrifugal ultrafiltration
Centrifugal ultrafiltration is a variety of membrane filtration in which centrifugation forces a liquid against a semi-permeable membrane. Suspended solids and solutes of high molecular weight are retained, while the liquid and low molecular weight solutes pass through the membrane depending on the molecular weight cut off (MWCO) of the membrane used.
This simple technique has been extensively used for the removal of high molecular weight species for serum/plasma based biomarker discovery for clinical diagnosis of several diseases, such as lung tumors [38], ovarian cancer [39], hepatocellular carcinoma [40], etc. Different MWCO membranes ranging from 10 [41] to 30 kDa [42] and 50 kDa [43] and various centrifugation speeds between 3000 × g [44] and 4000 × g [43] have been used. Special solvent conditions are required to disrupt protein–protein/peptide interactions so that LMW components that may be bound to albumin or other larger species are released and are free to pass through the membrane [9]. The addition of acetonitrile to diluted serum or plasma to a final concentration of 20% [38] or 25% (v/v) [40] has been shown to have a drastic positive effect on the enrichment of LMW protein/peptides without affecting the ability of the procedure to remove larger proteins. A 15% increase of protein content in the ultrafiltrate was observed after adding acetonitrile to 25% final concentration [40]. However, a study by Georgiou et al. [45] reported that ultrafiltration failed to remove albumin and other high molecular weight proteins from human plasma. In this study the ultrafiltration was conducted at 12,000 × g and, as it was pointed out by Tirumalai et al. [9], it is possible that at this high centrifugal force the integrity of the membrane may be compromised, thus allowing high molecular weight components, such as albumin, to pass through. In addition, non-diluted plasma was used and the ultrafiltration was conducted under nondenaturing solvent conditions.
Based on these results, it seems that low speed centrifugation, use of diluted serum or plasma and use of denaturing conditions are key variables for successfully performing plasma/serum centrifugal ultrafiltration for removal of highly abundant proteins together with the enrichment of LMW protein/peptides.
3.2. Solid phase extraction
Solid phase extraction (SPE) is a separation technique that uses a solid phase to isolate one, or one type, of analyte from a solution. SPE is commonly used in serum/plasma samples as a clean-up step to remove high abundance proteins.
3.2.1. Solid phase extraction columns
Solid phase extraction columns are probably the approach most widely used for depletion of high abundance proteins in serum/plasma and they have been widely used as a first step in biomarker-related proteomic studies. Different types of SPE columns based on ion-exchange [46], [47], [48], metal-chelating [47], affinity ligands [49], dye-ligands [50], [51], [52], bacterial proteins [53], [54], antibodies [49], [55] or combinations of these [53] have been used. Several high abundance protein depletion kits have been marketed by companies, such as Agilent, GenWay Biotech, Bio-Rad, Sigma–Aldrich, Amersham Biosciences, Pierce and others [46], [48], [49], [55], [56]. Different chromatography formats are used, including columns or cartridges [53], microcolumns [47], [57] and spin columns [51].
Depletion strategies based on dye-ligands or ion-exchange are not protein specific. By comparison, biological affinity separation based on antibodies, proteins, peptides, nucleotides, lectins, etc. is much more selective for specific target proteins. Bacterial Protein A and Protein G, which specifically bind to the Fc region of immunoglobulin G (IgG), have been successfully used for specific separation of IgGs from serum and plasma [1], [58], and the antibody-based columns are the primary choice as they provided more efficient, selective and reproducible depletion of high abundance proteins [46], [49]. The major disadvantages of antibody-based depletion columns are those features inherent to working with antibodies, namely, relatively high cost and low sample capacity.
An interesting method by Guerrier et al. [59] employs a unimodal multidimensional concept to rapidly achieve an effective fractionation of human serum. The method is based on the use of a column composed of a superimposed sequence of sorbents. As the sample crosses the different adsorbent layers, proteins within are subsequently trapped according to the complementary properties vis-à-vis the sorbent. Once the loading and capturing is achieved, the sequence of columns is disassembled and each column, containing a different complement of proteins, is eluted separately in a single step and under optimal elution conditions. When compared to classical single-chemistry fractionation based on, for example, anion-exchange and pH stepwise elution, the new proposed approach showed much lower protein overlap between fractions, and therefore, greater resolution. Significantly higher sensitivity for low abundance species also was found as evidenced by spiking trials [59].
According to a study by Björhall et al. [49], the ProteoExtract™ albumin/IgG removal kit was the most selective and reproducible among the 5 common disposable (single-use) depletion columns they tested. Recently a method based on a mix of six polyclonal antibodies in a column to rapidly and efficiently deplete the six most abundant proteins from serum and plasma in a single purification step has been developed [60]. This approach is able to deplete 90–95% of the total serum proteins in serum/plasma, while, for example, the combination of a dye-ligand affinity column to remove albumin and Protein A column to remove Igs provided a depletion of only 70% of total serum proteins [53]. This multiple affinity removal system (MARS), also called multiple affinity removal columns (MARC) has been commercialized by Agilent Technologies [55]. The major advantage of the MARS antibody column is that it can efficiently deplete the six most highly abundant proteins including different molecular forms and many proteolytic products of these proteins with low nonspecific losses of other proteins, thus providing a larger number of detectable species (Fig. 2 ) [49] in complex samples, such as serum and plasma [61]. For example, Echan et al., [55] comparing different SPE columns, showed that while the most extensive losses occurred with all dye-based affinity columns, the MARS columns had the lowest losses of nontargeted proteins [55]. Moreover, antibodies are relatively robust proteins, so the columns last for many purification cycles (up to 200) if appropriate care is taken to minimize proteolysis and column clogging. It has been shown that the MARS system also works effectively in the spin column format, which allows parallel processing of multiple samples and does not require complex instrumentation. Two MARS columns have also been used in tandem to increase the loading capacity to 75 μL of plasma [62].
Fig. 2.

2DE protein profiles of crude (70 mg protein) and depleted (100 mg protein) serum samples. The multiple affinity removal column was used to deplete a total of six highly abundant proteins, namely albumin, IgG, IgA, a1-antitrypsin, transferrin, and haptoglobin. Removal of these proteins clearly improved the resolution in the area of the gel containing albumin and increased the intensity of low abundance proteins. Reproduced from Björhall et al. [49] by permission of WILEY-VCH Verlag GmbH & Co.
Although the MARS column has been shown to be the best SPE column for depleting the most abundant proteins from serum/plasma, even after depleting these six abundant proteins, the next most abundant ones rapidly become a problem for identifying low abundance proteins. Hence, ideally a highly selective column that could deplete at least 18–22 of the most abundant proteins, which comprise 98–99% of total serum protein content, would be desirable. Towards this end, a new column containing 12 polyclonal immunoglobulin yolk (IgY) antibodies, the Seppro™ mixed 12 spin column (Genway Biotech), may be a promising step [56]. The 12 IgY antibodies against the 12 most abundant proteins are covalently coupled to microbeads used to pack the column. High reproducibility and maintenance of the separation capacity over multiple cycles has been observed. Recycling of a spin column up to 135 times did not cause apparent loss of specificity or capacity [56].
3.2.2. Solid phase extraction disk plates
The underlying chemical principles of using SPE disk plates for high abundance protein removal from serum/plasma samples are the same as for using SPE columns. Different functionalities, such as ion-exchange [63], dye-ligand [50] and reverse phase [64], [65], [66] disks have been used. The main advantage associated with the use of SPE disk plates is the increased ability for automation. The disk plates are generally used in a 96-well plate format [67] allowing simultaneous processing of an elevated number of samples by using a robot [65], [66]. It is also common to use different elution/washing buffers that are applied sequentially to the disks in order to assure that all the adsorbed protein/peptides are eluted, or for fractionation [63].
3.3. Organic solvent extraction
The possibility of selectively removing large abundant proteins from serum by precipitating them with simultaneous extraction of peptides and low molecular weight proteins using organic solvents has been tested [42], [68]. The precipitation with organic solvents in the presence of ion-pairing agents dissociates peptides and smaller proteins from large abundant proteins, thereby facilitating their extraction. It has been shown that two volumes of acetonitrile added to serum/plasma samples efficiently precipitate large abundant proteins, such as albumin, while smaller proteins and peptides stay in solution and subsequently can be analyzed by MS [42], [68]. Chertov et al. [68] applied this procedure for preparation of mouse serum samples before analysis by SELDI MS, showing a significant improvement of the mass spectra. Some of the polypeptide signals present in the SELDI MS spectra of the extracted material were absent in the spectra of total serum. The observation of these peptides in the serum extract was crucial for the detection of the two markers that were of lower abundance in the serum extracts from the tumor bearing mice. The extraction procedure was also very reproducible. Analysis of 40 aliquots of human serum by MALDI MS provided practically identical spectra after extraction with acetonitrile containing 0.1% trifluoroacetic acid (TFA). Moreover, the extracted material had much less total protein, making it easier to purify and identify the potential markers [68].
4. Sample fractionation
Due to the high complexity of serum/plasma samples, different fractionation strategies have been used either to generate several fractions, such as gel and capillary electrophoresis and liquid chromatography, or to selectively obtain a particular subset of proteins/peptides with common features based on their similar affinity to a particular solid support. Both types of strategies are discussed here. We also include some strategies and applications that, although they have not been used yet for specific biomarker-related proteomic studies, show potential for future use in biomarker discovery (see Table 2 ).
Table 2.
Strategies used for serum/plasma fractionation
| Strategy | Advantages | Disadvantages |
|---|---|---|
| Solid phase extraction | ||
| Surface-derivatized chips (SELDI) | Raw samples directly analyzed | No identity of the m/z detected |
| Detection within a broad molecular mass region in a single analysis | Reproducible within but not between laboratories | |
| High throughput | ||
| Derivatized carrier materials (MELDI) | Detection of a larger number of peptides (as compared to SELDI) | Carrier materials have to be carefully chosen |
| Raw samples directly analyzed | Only highly porous, spherical and low μm size range particles can be used | |
| High throughput | ||
| Surface-derivatized magnetic beads | Possibility of automation | Potential lack of reproducibility between commercial batches of the same beads |
| Wide range of derivatized beads with different functional groups | ||
| Compatible with any kind of mass spectrometer | ||
| More sensitive than SELDI | ||
| Capture of glycoproteins/glycopeptides | High selectivity | Potential loss of information (non-glycosylated proteins) |
| Reduction of sample complexity | Increase in number of false positive proteins identifications | |
| Nanoporous substrates | Allow harvesting of distinct subsets of the proteome | Not enough studies |
| Electrophoresis | ||
| Gel electrophoresis | High separation power | Low throughput |
| Labor intensive | ||
| Capillary electrophoresis | High resolution | Requires concentration step |
| Only nanoliter sample volumes required | ||
| Liquid chromatography | High resolution | Requires clean-up step |
| Multidimensional LC systems can be used | Generates highly complex data sets | |
| Easy to automate | Often unsuitable for analyzing intact proteins | |
4.1. Solid phase extraction
As previously discussed, solid phase extraction is commonly used for the removal of high abundance proteins from serum/plasma samples. However, some SPE-based strategies have also been used to isolate a particular fraction of proteins/peptides within the original sample to be further analyzed.
4.1.1. Surface-derivatized chips
Surface-enhanced laser desorption/ionization (SELDI) is an affinity-based mass spectrometric method that combines sample fractionation with MS analysis. SELDI utilizes stainless steel or aluminum-based supports, or chips, engineered with chemical (hydrophilic, hydrophobic, pre-activated, normal-phase, immobilized metal affinity, and cationic or anionic) or biological (antibody, antigen binding fragments, such as scFv, DNA, enzyme, or receptor) bait surfaces of 1–2 mm in diameter to which a selected subset of proteins and peptides are adsorbed. One of the key aspects that lend power to this process is that raw biofluids, such as urine [69], synovial fluid [70], nipple fluid aspirant [71], hemodialysis fluid [72], serum/plasma [73], [74], [75], etc. and tissues [76], can be directly analyzed after their application to the chip surface. After a short incubation period, unbound proteins are removed from the surface using washing buffers. Thus, only proteins interacting with the chemistry of the array surface are retained for analysis. After washing, MALDI matrix is applied to the array as a final step before acquiring the MS spectra followed by the bioinformatics analysis (Fig. 3 ) [5]. This technology allows sensitive and high-throughput protein profiling of relatively complex biological specimens [77]. When multiple surfaces are employed with step-gradient style washing procedures, a single sample can readily be dispersed over many target spots. This limited fractionation allows detection of additional proteins in plasma/serum, increasing the number of peaks to the hundreds range [78].
Fig. 3.

General strategy for the acquisition of protein patterns by SELDI. A serum sample is applied to a protein chip, which contains one of several possible adsorbent surface chemistries. After a series of washing steps and the application of an energy-absorbing molecule, a mass spectral image of the species retained on the protein chip surface is acquired. Bioinformatic software is used to discover peaks within the mass spectral image that indicate the disease status (healthy or disease-affected) of the patient from which the serum was acquired. Reproduced from Conrads et al. [5] by permission of Adis.
SELDI was one of the earliest platforms used for finding proteomic patterns for disease diagnosis. Since the first study in 2002, where the authors obtained a proteomic pattern in serum for early detection of ovarian cancer [4], the number of publications describing the use of this technology has increased significantly in the past few years [79]. The study by Petricoin et al. [4] was followed by other reports [80] claiming to obtain protein patterns able to distinguish between patients with certain diseases, such as prostate [81], breast [82], ovarian [83], and renal cancer [84] and healthy patients, with a sensitivity and a specificity close to 100% in most cases. However, almost at the same time, criticisms and shortcomings related to the use of SELDI, especially including reproducibility issues [85], [86], [87], for building protein patterns were reported by other authors [88], [89], [90]. Diamandis [88] pointed out that the discriminatory peaks (i.e. peaks representing molecules that appear or disappear during the disease progression, or whose amounts differ in disease versus healthy patients) obtained by SELDI and reported in four papers studying prostate cancer by three different research groups were very different, even in the two papers published by the same group using the same experimental data but different analysis tools [90], [91]. These discrepancies suggested that serum/plasma proteomic patterns obtained by SELDI may not be reproducible and that the discriminatory peaks are not consistent within a group or among groups of investigators for the same type of cancer, even when the general analytical methods or datasets are the same. Furthermore, the reported diagnostic sensitivities and specificities differed substantially among the four reports. Another phenomenon associated with these data was that serum proteins that are known to distinguish patients with benign conditions from patients with malignancies were not identified by SELDI, raising serious questions about its analytical sensitivity [88].
In 2005, the Human Proteome Organization (HUPO) carried out an interlaboratory study in which eight different laboratories were involved in analyzing serum and plasma reference specimen using SELDI [92] in order to answer pertinent questions, including whether the proteins detected by SELDI are a major subset of the plasma/serum proteome, i.e. is this an information-rich fraction, and, can the SELDI analysis be done reproducibly for dozens or hundreds of samples in a single laboratory or across several laboratories so that large population-based studies can be reliably performed? The study [92] showed that the fraction of the proteome observable by SELDI was in fact able to establish differences between groups. Clear differences between serum and plasma and between plasma types were found using the SELDI platform, and these differences were consistent and were reproducibly found by all laboratories submitting qualified data. However, it also became clear that stringent steps must be taken to enable meaningful comparisons of interlaboratory data. This is in contrast to the relative ease and accuracy of differential profiling carried out on one instrument in one laboratory [92].
The original and most widely used SELDI MS instrument platform to acquire proteomic patterns is the ProteinChip™ Biomarker System II (PBS-II), manufactured by Ciphergen, Inc. [93]. As with any developing area of research, there have been significant advancements in this technology since its development [5], for example, the use of high-resolution mass spectrometers [94]. Conrads et al. demonstrated increased sensitivity and specificity for ovarian cancer markers in serum after using a Q-STAR as compared with the conventional SELDI-TOF [94].
Despite extensive discussion in the literature as to whether or not the use of SELDI MS for protein pattern discovery for disease diagnosis and/or prognosis is a good choice, it is a fact that a large number of researchers have chosen this platform for their biomarker projects. A great number of papers have been published since 2002 and it has been applied to an important group of diseases. Most of the studies using SELDI have focused on cancer, including breast [77], [95], [96], [97], prostate [98], [99], [100], [101], [102], [103], [104], ovarian [10], [105], [106], [107], [108], [109], [110], [111], [112], [113], [114], colorectal [115], [116], [117], [118], gastric [119], [120], endometrial [121], pancreatic [122], [123], [124], head and neck [125], [126] and lung cancer [127], neuroblastoma [128], [129], hepatocellular [130], [131], [132], renal cell [84], [133], [134] and nasopharyngeal carcinoma [135], metastatic pheochromocytoma [136], glioma [137], melanoma [138] and bone metastases [139]. Among other diseases that have been studied using this technique are severe acute respiratory syndrome (SARS) [140], [141], [142], acute myocardial infarction (AMI) and chronic heart disease [143], ischemic and hemorrhagic stroke [144], diabetes [145], liver cirrhosis [146], intra-amniotic infection [147], rheumatoid arthritis [148], sleep-disordered breathing in children [149], African trypanosomiasis (sleeping sickness) [150], arsenic and lead exposure [151], respiratory disease [152] and alcoholism [153]. Almost all these studies claim to provide MS patterns able to distinguish between subjects with and without a disease; however, SELDI-MS does not provide the identity of the biomarkers so it is not possible to know if the group of m/z values comprising the pattern actually corresponds to molecules directly related to the disease under study.
4.1.2. Derivatized carrier materials
Material-enhanced laser desorption/ionization (MELDI) is a new technique that uses various functionalized carrier materials for direct protein profiling employing a MALDI-MS instrument [154]. This approach is quite similar to SELDI, since the “protein-functionalized beads-suspension” is directly applied onto a MALDI-target, mixed with the appropriate matrix solution, and analyzed by MALDI-MS. However, MELDI uses particles with a higher surface area than the spots used in SELDI chips, so it allows detection of a larger number of peptides and proteins within a broad molecular mass range [155] and without prior albumin and immunoglobulin depletion, elution, and desalting steps that are mandatory for other MS-analysis techniques [154]. However, different studies have shown that the carrier material has to be carefully chosen to assure best results [156] and that particles with only certain properties, i.e. highly porous, spherical, and in the low μm size range, can be effectively used in MELDI [154], [155].
Iminodiacetic acid (IDA)-Cu2+ linked cellulose, silica, poly (glycidyl methacrylate-GMA/divinylbenzene-DVB) particles and diamond powder have been tested as carrier materials for serum protein profiling. The spectra recorded for each of these materials showed similar serum mass fingerprints with only minor intensity differences, which can be attributed to the variation resulting from sample preparation in suspension, application to the MALDI target, and matrix crystallization effects [155]. A detailed analysis of reproducibility and robustness of this approach recently has been reported, showing quite reproducible spectra for serum samples analyzed at different times over several weeks with either cellulose [154] or silica [156] particles. Two parameters, the time between sample preparation and MS analysis and the temperature, have been identified as potential sources of bias. Comparison of the spectra obtained from a cellulose-serum suspension showed the absence of some peptides when the MALDI target was stored at room temperature for 4 h before analysis compared with samples that were analyzed immediately after plate spotting. On the other hand, samples prepared at 4 and 21 °C yielded almost identical profiles but these were different from the profile of the sample prepared at 30 °C. In the latter case, the signal-to-noise ratio was decreased, resulting in difficulty distinguishing noise from true peaks [154].
Although no extensive studies of serum/plasma protein profiling for biomarker discovery have been reported using this approach, prostate and control serum samples were analyzed as a first attempt to demonstrate the capability of this strategy for detection and/or identification of new biomarkers [154]. The ongoing development of an automated MELDI technique employing liquid handling robotic devices for high throughput analysis represents a potentially key step towards multiplexed serum/plasma protein profiling for biomarker discovery [155].
4.1.3. Surface-derivatized magnetic beads
In recent decades, magnetic beads have emerged as a promising new platform in biomedical applications, particularly bioseparations [32], [157]. Functionalized magnetic beads are used for solid phase extraction of a specific subset of molecules from a liquid. The nature of the molecules retained depends directly on the kind of surface-derivatized beads used. This new technology was first applied for serum/plasma proteomic profiling to obtain a pattern of 274 peptide masses to distinguish between sera from brain tumor patients and sera from healthy people using reversed phase C8 beads [17].
The general operational protocol as originally described by Villanueva et al. [17] consists of: (i) Bead suspension: magnetic bead pellets are resuspended by pipetting up/down (in the automated protocol) or by vortexing (manually). (ii) Binding: a measured volume of bead suspension is transferred to a tube containing an aliquot of serum or plasma. The magnetic beads and the sample are mixed and the beads are pulled to the side by magnetic force, the supernatant is then removed and discarded. (iii) Washing: a washing solution is added and the beads are pulled from left to right over one or more magnets, resulting in a laterally jarring motion. Then, the beads are pulled to the side and the washing solution is removed. (iv) Beads pull-down: the beads are resuspended and then pulled to the tip of the tube by magnets positioned underneath followed by the careful removal of the supernatant. (v) Elution: a minimal volume of elution solvent is added to the bead pellet and mixed. The beads are then pulled to the side and the eluate is collected.
The first studies using magnetic beads related with proteomic profiling of serum/plasma for biomarker discovery using mass spectrometry were carried out with beads derivatized with reversed phased ligands, such as C1, C2, C3, C8, and C18 [17], [29], [158]. After the relative success of these trials, the magnetic bead product line has been expanded significantly, most notably by Bruker Daltonics, to include not only reversed phase bead types, but also weak anion (WAX) and weak cation (WCX) exchange beads; immobilized metal affinity capture (IMAC) beads with both copper and iron variants; and large-protein beads allowing retention of proteins up to several 100 kDa. Other magnetic beads include glyco-beads, offering multiple methods for glycoprotein enrichment, including both chemical capture or lectin-capture strategies thus allowing profiling of all glycosylated peptides, proteins or glycan-structures which can be very informative in cancer research, and antibody-capture beads for the specific enrichment of different protein groups with the same antigen specificity or even of specific proteins, thus giving access to low abundance proteins in serum/plasma.
This approach is intrinsically more sensitive than surface capture on chips, such as SELDI, since spherical particles have larger combined surface areas than small-diameter spots. Detection of 400 polypeptides (0.8–15 kDa range) in a single droplet (50 μl) of serum, and almost 2000 unique peptides in larger sample sets, have been reported using this strategy [17]. It is also amenable to robust automation, thus providing a scalable and reproducible approach. The cost of ClinProt magnetic bead arrays is quite low, according to Bruker Daltonics, thus allowing larger validation studies. The most significant problem associated with this technology was reported in a later study by the same authors who developed the strategy. They found that different batches of the same beads from the same company provided very different results (Fig. 4A) [26], although very reproducible profiles were obtained using the same batch of beads and the same sample on different days (Fig. 4B) [17]. This fact constitutes a major reproducibility issue, so potential batch-dependent differences should be verified by anyone using solid phase extraction for profiling purposes [26].
Fig. 4.
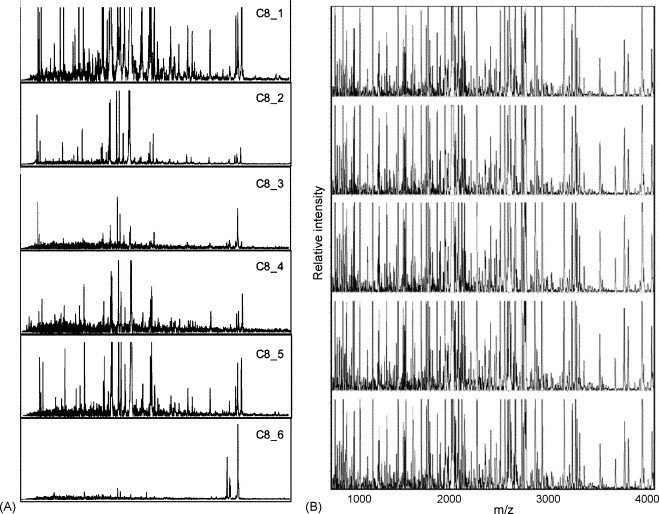
(A) Effect of different batches of C8/K magnetic particles on serum peptide profiling. (B) Reproducibility of serum peptide profiling by magnetic particle-assisted sample processing and MALDI-TOF MS. Reproduced from Villanueva et al. [17], [26] by permission of the American Chemical Society.
This strategy is compatible with any kind of mass spectrometer. However, most studies to date have been carried out using MALDI-TOF MS [37], [159]. The combination of solid phase extraction using magnetic beads with MALDI analysis has led to differential protein expression patterns associated with diseases like asthma [158] and thyroid cancer [26] using reversed phase C8-beads; and gastric cancer using antibody-conjugated magnetic nanoparticles [157], among others.
4.1.4. Capture of glycoproteins/glycopeptides
A new method based on the selective isolation of N-linked glycosylated peptides after proteolysis of serum proteins, followed by the analysis of the complex mixture of deglycosylated forms of these peptides by LC–MS/MS [160] or MALDI-MS/MS [161] has been reported. This approach has been found to be a powerful method for the analysis of the serum proteome [160] and for the detection of proteins or protein patterns that distinguish individuals in different physiological states [160], [162]. It is well known that cellular glycosylation profiles change significantly during oncogenesis [163], [164], [165] and other diseases [166], [167]. Prostate specific antigen (PSA), for example, is one of the best characterized secreted glycoproteins used in cancer diagnostics. By selectively isolating this subset of peptides, a significant reduction in sample and analysis complexity is achieved at two levels: first, a reduction of the total number of peptides due to the fact that every serum protein on average only contains a few N-linked glycosylation sites; and second, a reduction of pattern complexity by removing the oligosaccharides that contribute significantly to the peptide pattern heterogeneity [160]. Moreover, the most abundant serum protein (constituting almost 50% of total serum proteins), albumin, does not contain N-linked glycosylation motifs and therefore is effectively transparent to the analysis. In addition, this approach only selects peptides from the constant region of immunoglobulins and thus dramatically reduces the number of immunoglobulin-derived peptides. This is important since immunoglobulins constitute approximately 20% of total protein mass in serum [168] and comprise a population of an estimated 10 million different molecules [14]. However, although the reduction of peptide redundancy is beneficial for achieving higher coverage of the proteome per analysis, it is also apparent that it leads to the loss of some, potentially important information: (i) non-glycosylated proteins are missed in this approach. While it is believed that the majority of serum-specific proteins are glycosylated [169], intracellular proteins (typically non-glycosylated) that may represent a rich source of biomarkers if leaked into serum might go undetected. (ii) The availability of fewer peptides per protein may increase the number of false positive protein identifications. (iii) While this approach may reveal differences in protein level or glycosylation level, disease processes that alter other protein posttranslational modifications, including proteolytic processing, will not be detected on a glycopeptide level. (iv) Collapsing peptides modified by different oligosaccharide structures into a single signal will obscure potential disease markers that are due to alterations in oligosaccharide structure [160], [169].
A method based on the conjugation of serum glycoproteins to a resin using hydrazide chemistry was proposed by Zhang et al. [160], [170]. In this method, glycoprotein oxidation is carried out first in order to convert the cis-diol groups of carbohydrates to aldehydes. The aldehyde groups react with the hydrazide groups immobilized on the resin, forming covalent hydrazone bonds, and the immobilized glycoproteins are then proteolyzed on the solid support. Former N-glycopeptides are released from the solid support by PNGase F treatment and analyzed by MS [170]. It is also possible to isotopically label the glycosylated peptides before release from the solid support in order to allow quantitative results. This method was shown to be very reproducible, achieving increased analytical depth and higher throughput compared with analysis of samples without selective analyte enrichment. Furthermore, the authors demonstrated that the peptide patterns obtained were able to distinguish between serum samples from mice with carcinoma-induced skin cancer and samples from genetically identical, untreated mice [160]. Another approach reported recently [171] relies upon the use of lectins, a class of proteins found in plants, bacteria, fungi and animals that are known to bind specific oligosaccharide moieties [172], [173]. The most common approach for using lectins to capture serum glycoproteins has been to digest the serum with trypsin, isolate the glycopeptides with one or more lectins linked to a support resin, elute and deglycosylate the bound peptides with a PNGase. Drake et al. [171] showed how different lectins bound to agarose beads conferred selective enrichment of serum glycoproteins, and some overlap and redundancy in the captured proteins. Serial affinity capture strategies, in which different lectins are used in tandem, can increase the fractionation capabilities. Using this approach with fucose-specific lectins, an increase in the level of fucosylated glycoforms of glycoproteins in serum from individuals with hepatocellular carcinoma as compared with serum from healthy patients was observed [171], showing the ability of this strategy for finding diagnostic biomarkers.
4.1.5. Nanoporous substrates
As part of an ongoing trend aiming to translate the potential of nanotechnology to proteomics, the application of nanoporous silica particles to filter serum/plasma proteins with the goal of more effectively harvesting plasma LMW proteins has been studied [12], [174]. Silica particles [12], silicon wafers, and glass beads [174] have been tested to act as a carrier protein-like mimetic and to enrich for low molecular weight proteins within plasma/serum or other biological fluids. Nanoporous silicon wafers have been used to selectively deplete serum/plasma of a fraction of proteins [174], while silica particles and controlled-pore nanoporous glass beads have been used to harvest distinct subsets of the proteome from serum/plasma samples for subsequent elution and evaluation [12], [174]. The authors have shown that the characteristics of fractionation depend on the pore size of the material used. Additional pore sizes, surface modifications, and carrier protein (e.g. albumin) immobilization strategies must be tested to improve fractionation and purification of interesting low molecular weight species [174].
4.2. Electrophoresis
Electrophoresis is the movement of charged particles through a medium by using an electric field induced by electrodes. In proteomics, electrophoresis, specially gel electrophoresis, is still the cornerstone separation technique for complex protein mixtures, although alternatives based on chromatoghraphy and protein arrays are advancing to complement this technique [175]. Both gel and capillary electrophoresis have been used for serum/plasma fractionation for biomarker discovery before MS analysis.
4.2.1. Gel electrophoresis
Gel electrophoresis refers to the technique in which molecules are forced across a span of gel motivated by an electrical current. Activated electrodes at either end of the gel provide the driving force. The properties of the molecules, such as size, electric charge, structure, etc. determine how rapidly an electric field can move them through the gel. Two-dimensional gel electrophoresis (2DE) is widely used in proteomic studies due to its separation power. Proteins are initially separated according to their isoelectric point (pI) in the first dimension, followed by separation in the second dimension according to their molecular weight. The result is an array of spots detected by different staining procedures [7]. The resolution and sensitivity can be increased using strategies, such as immobilized pH gradients able to create a more complete picture of the actual protein content of the sample [176], [177]. However, applications of gel electrophoresis to biomarker discovery studies are rare due to the fact that the technique is not well suited to analyzing large series of samples, as it is quite work intensive and slow [175], [178]. It is also complicated by the typical abundance and dynamic range issues that afflict serum/plasma analyses; therefore, samples are usually depleted of albumin and immunoglobulins prior to 2DE [7], [46], [179]. After using gel electrophoresis, the proteins considered to be relevant as biomarkers are identified mostly according to standard proteomics protocols based on proteolytic in-gel digestion and MS analysis.
Despite the problems associated with the use of gel electrophoresis mentioned previously, a number of groups have performed comparative studies over the years and discovered some potential biomarkers [180], [181], [182], [183]. Using 2DE followed by MALDI MS analysis, potential biomarkers for acute myeloid leukemia [184], hepatocellular carcinoma [185], [186], liver toxicity or hypertrophy [187] and breast cancer [188], among others, have been reported. Agarose 2DE gels have been successfully used for the identification of potential biomarkers for prostate cancer by focusing on the high molecular weight (HMW) protein range. Proteins that were not previously reported in prostate cancer by using genomic or conventional 2DE based proteomic approaches were found to be potential biomarkers [189]. 2DE has also been used to complement SELDI [190] when searching for biomarkers for acute renal allograft rejection. While 2DE was superior for profiling at the protein level over a wide molecular weight range, SELDI was faster and more sensitive for the analysis of peptides and small proteins below 20 kDa [190]. Comunale et al. [191] proposed an approach based on the de-N-glycosylation of the polypeptides present in serum to simplify the serum proteome profiles obtained by 2DE. Several polypeptides, apparent only after de-N-glycosylation, were shown to correlate with the presence of hepatocellular carcinoma. Although the results were preliminary and the identities of all the putative biomarkers not yet known, the data suggested that de-N-glycosylation offers a method to enhance the resolution of serum protein profiles [191].
Although the studies described above used conventional staining procedure for protein detection [192], [193], more subtle changes may be observed with the use of differential gel electrophoresis (DIGE). DIGE constitutes the proteomic equivalent to gene expression analysis by DNA microarrays. Even minor differences of protein expression can be detected across multiple samples simultaneously with statistical confidence [194]. The comparison of spot intensities using the DIGE approach and DeCyder software [195], [196] is more objective than the approach based on the comparison of the brightness of gel images obtained by conventional staining [197]. DIGE has been used after depletion of high abundance proteins from serum by immunoaffinity depletion columns for the identification of potential biomarkers for pancreatic [179] and breast cancer [198].
4.2.2. Capillary electrophoresis
Introduced in the 1960s, the technique of capillary electrophoresis (CE) was designed to separate molecular species based on their size to charge ratio inside a small capillary (20–100 μm inner-diameter) of glass, silica or other material filled with an electrolyte. Isoelectric focusing (IEF) and gel electrophoresis occur within the capillary itself. CE has been used in proteomics both to analyze and to fractionate samples before MS analysis and 2DE [199]. The high resolution of CE and the nanoliter sample volumes used are especially advantageous when serially fractionating small clinical samples; however, the number of actual molecules of a low abundance protein that are present in these minute samples needs to be kept in mind. Without a prior concentration or enrichment step, proteins or peptides at low concentration may be entirely overlooked [7]. This is probably the reason why most studies for biomarker discovery using CE-MS have been carried out in urine [200] and only a few with serum/plasma samples [201], [202].
Centrifugal ultrafiltration has been used prior to CE to remove high abundance proteins from serum/plasma, since large proteins are fairly insoluble, and would result in the appearance of precipitate in the capillary [44], [203]. Kaiser et al. [44] detected approximately 500 polypeptides with molecular weights from 800 to 12000 Da in plasma after ultrafiltration. Also, approximately 500 components were detected using an automated CE-MS approach. The authors analyzed low molecular weight peptides in serum after ultrafiltration using a CE-MS method that incorporates a transient isotachophoresis for in-line preconcentration and a sheathless CE-MS electrospray interface [203].
Another promising approach, in which plasma samples are directly injected into the CE capillary without any sample pretreatment, is based in the use of a fused silica capillary coated with polybrene to avoid hydrophobic interaction with the capillary wall and to obtain a strong reversed electroosmotic flow (EOF). Using anodic separation, the proteins migrate against the EOF, and the lower (positively) charged proteins in the background of acetic acid-based electrolyte enter the detector first. This approach provides two advantages: (1) the proteins are completely desalted, because the small cations migrate in the other direction and never reach the detector, and (2) modified proteins, such as glycosylated forms, are separated from non-modified forms because of their lower positive charge due to non-charge-bearing groups or negatively charged modifications. Smaller and modified (glycosylated) proteins are separated from the predominant serum protein albumin. The high resolution and high mass accuracy provided by modern mass spectrometry technology is suitable for a tentative identification of the proteins and for monitoring mass changes on the level of the intact protein for diagnostic purposes [204]. However, as far as we know, no biomarker discovery studies have been reported using this approach.
4.3. Liquid chromatography
Chromatographic processes can be defined as separation techniques involving mass-transfer between stationary and mobile phases. Liquid chromatography (LC) is the most widely used mode of analytical chromatography and uses a liquid mobile phase to separate the components of a mixture. These components (or analytes) are present in a liquid phase or dissolved in a solvent, and then forced to flow through a chromatographic column usually under high pressure (HPLC). In the column, the mixture is resolved into its components. The degree of resolution depends on the extent of interaction between the solute components and the stationary phase, which is defined as the immobile packing material in the column. The interaction of the solute with mobile and stationary phases can be manipulated through different choices of both solvents and stationary phases. As a result, LC acquires a high degree of versatility not found in other chromatographic systems and it has the ability to easily separate a wide variety of chemical mixtures.
It is important to mention that although the principles of liquid chromatography and solid phase extraction are similar, and the two techniques are often confused especially when using solid phase extraction columns, they are used for different purposes. In serum/plasma treatments, while SPE is commonly used to selectively extract either undesirable high abundance proteins (clean-up/purification) or a specific subset of proteins with similar characteristic, such as in the glycoprotein capture strategy described above, LC is a separation/fractionation technique where many serum/plasma fractions can be generated. There are several SPE devices, such as the SPE disk plates, the MARS affinity columns or the SPE columns connected in series that can provide some fractionation of samples. However, the separation obtained (typically less than 10 fractions) is low as compared to LC where the resolution is greater and the number of fractions that can be collected is only limited by the time during which the chromatographic run is carried out. Also, there are important differences between these two techniques in the operational protocols and in the solid sorbents used, such as in the particle size, especially in high pressure liquid chromatography (HPLC).
LC in combination with MS is primarily performed in the reversed phase mode for the analysis of peptides from natural sources or generated by proteolytic digestion of larger proteins, since the mobile phase is directly compatible with the requirements for ionization at atmospheric pressure. In the case of serum/plasma sample processing for biomarker discovery, LC can be used as a last step for separation of peptides immediately before MS analysis and after using almost any of the other sample preparation techniques described above, or as the main fractionation approach for serum/plasma proteins/peptides. In the latter case, multidimensional LC systems are usually chosen to separate serum/plasma samples into different fractions based on different principles, such as pI or hydrophobicity, thus decreasing the complexity of the samples with the subsequent increase in the probability of identifying biomarkers at lower concentrations. Our interest in this study is focused on LC as a fractionation approach for serum/plasma samples since the use of LC–MS as a last step for identification of proteins is widely used in many kinds of proteomics studies and requires little or no innovation or modification for use in biomarker-related studies.
Application of LC–MS to biomarker discovery is not yet very widespread partly because the method generates large and highly complex data sets that require powerful algorithms and software tools to handle and analyze them [175], [205]. However, some attempts have been carried out recently, although they have not always been focused on biomarker discovery. Low abundance proteins have been observed in serum/plasma proteome investigations, suggesting LC–MS is a promising platform for biomarker discovery. Protein fractionation based on 2D-LC using weak anion-exchange (WAX) and weak cation exchange (WCX) columns connected in series has been used for the investigation of the mouse serum proteome [206]. After loading the serum samples, the columns were disconnected and the captured proteins were eluted from the two columns using multistep salt gradients and collected in fractions every minute. After fractionation, 4567 unique proteins were identified from 12389 unique peptides. Proteins from all functional classes and localizations were detected, and numerous low abundance proteins were identified without the need for prior removal of albumin or Igs. This analysis established the basis for the detection of potential biomarkers in mouse models to determine the presence or absence of various molecular species in control and experimental animals [206]. A similar strategy based on the use of immunoaffinity chromatography to remove the most abundant serum proteins, followed by sequential anion-exchange and size-exclusion chromatography, has been used for the study of the human serum proteome [207]. This approach combined with 2DE succeeded in resolving approximately 3700 distinct proteins including proteins present in serum at <10 ng ml−1 concentrations, such as interleukin-6, cathepsins, and peptides hormones [207].
LC is often unsuitable for analyzing intact proteins since proteins tend to denature under reversed phase conditions (low pH and high organic solvent concentration), making their quantitative elution rather difficult. However, Qin et al. [13] used the Beckman Coulter ProteomeLab PF 2-D HPLC system to separate serum proteins by anion displacement LC. Serum fractions were collected at pH intervals of 0.3 and further resolved by DIGE [13]. Serum samples from patients with prostate cancer and patients with benign prostate hyperplasia (BPH) were studied. Chromatofocusing appeared as a reliable and reproducible method for separating protein and peptides, and 72% of the serum proteins were recovered in fractions between pH 4.0 and 6.4 (Fig. 5 ). The profiles obtained were able to distinguish between BPH and prostate cancer. The reproducibility of the serum fractionation approach was reported to be quite good, with no significant differences between chromatograms from different samples, thus demonstrating the potential of chromatofocusing to reproducibly separate a desired population of serum/plasma proteins on the basis of their pI [13]. Moreover, comparing profiles obtained from fractionated serum and profiles from unfractionated serum demonstrated that more total and unique proteins were identified following fractionation. Especially important was the presence of several low abundance proteins in fractionated samples [13]. 2D-LC has also been applied to make comparative proteomic analyses of plasma samples from an individual prior to and 9 h after lipopolysaccharide (LPS) administration. Using a strong cation exchange (SCX) chromatography column coupled off-line to a reverse-phase column, a total of 32 proteins were observed to be significantly increased in concentration following LPS administration, including several known inflammatory response or acute-phase mediators, thus constituting potential biomarkers for inflammatory response [208]. Sheng et al. [209] also used the commercial instrument PF2D from Beckman Coulter to separate serum proteins in the first dimension using chromatofocusing followed in-line by reversed phase chromatography in the second dimension, thereby separating intact proteins based on pI and hydrophobicity. The PF2D system successfully identified both high and low abundance proteins. The addition of 20% isopropanol to the first dimension buffer enhanced the elution of proteins at or near their theoretical pI. The authors reported that 150 non-redundant serum proteins (excluding all immunoglobins and albumin and considering a minimum of two peptides matches with acceptable Mascot scores) were unambiguously identified, of which 81 had not been identified previously in serum [209].
Fig. 5.
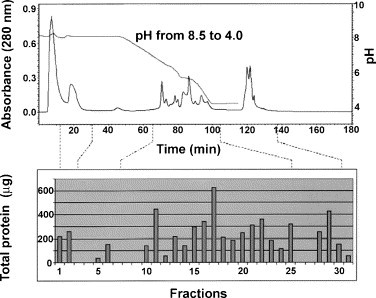
Typical elution and retention profile for serum fractionation. Absorbance at 280 nm illustrates protein concentration at various pHs and elution times. Protein concentration for each of the fractions is shown in the bar graph below. Reproduced from Qin et al. [13] by permission of WILEY-VCH Verlag GmbH & Co.
5. Conclusions
We have discussed many different strategies used for sample preparation of serum/plasma for biomarker discovery using mass spectrometry, from well established approaches, such as gel electrophoresis or ultrafiltration to relatively new strategies, such as glycoprotein/glycopeptides capture or the use of nanoporous susbtrates. We have attempted to present the advantages and shortcomings of each, as well as many of the applications reported so far in biomarker-related proteomic studies.
As demonstrated by the large number of papers that have been published in the past few years, the discovery rate of potential biomarkers and drug targets has already greatly exceeded the rate of preliminary validation, and the gap is expected to increase [210]. Hence, one of the first steps required is the standardization of sample preparation protocols in order to obtain reproducible results between laboratories that can lead to the establishment of these potential biomarkers as valid tests for clinical purposes. Further investigation is especially needed for new sample preparation strategies that have already provided particularly promising results, such as the multiple affinity removal systems, multidimensional liquid chromatography and use of nanoporous solid phases.
Acknowledgments
We acknowledge support from NIH NCI grant 2P30CA016087-239025 and the 100 Women in Hedge Funds Foundation to T.A.N, and the Consejeria de Educacion y Ciencia (Junta de Andalucia, Spain) for support to J.L.L.-G.
References
- 1.Adkins J.N., Varnum S.M., Auberry K.J., Moore R.J., Angell N.H., Smith R.D., Springer D.L., Pounds J.G. Mol. Cell. Proteomics. 2002;1:947. doi: 10.1074/mcp.m200066-mcp200. [DOI] [PubMed] [Google Scholar]
- 2.Diamandis E.P. Clin. Chem. 2004;50:793. doi: 10.1373/clinchem.2004.032177. [DOI] [PubMed] [Google Scholar]
- 3.Gao J., Garulacan L.A., Storm S.M., Opiteck G.J., Dubaquie Y., Hefta S.A., Dambach D.M., Dongre A.R. Methods. 2005;35:291. doi: 10.1016/j.ymeth.2004.08.020. [DOI] [PubMed] [Google Scholar]
- 4.Petricoin E.F., Ardekani A.M., Hitt B.A., Levine P.J., Fusaro V.A., Steinberg S.M., Mills G.B., Simone C., Fishman D.A., Kohn E.C., Liotta L.A. Lancet. 2002;359:572. doi: 10.1016/S0140-6736(02)07746-2. [DOI] [PubMed] [Google Scholar]
- 5.Conrads T.P., Hood B.L., Issaq H.J., Veenstra T.D. Mol. Diagn. 2004;8:77. doi: 10.1007/BF03260049. [DOI] [PubMed] [Google Scholar]
- 6.Zolg J.W., Langen H. Mol. Cell. Proteomics. 2004;3:345. doi: 10.1074/mcp.M400007-MCP200. [DOI] [PubMed] [Google Scholar]
- 7.Lathrop J.T., Hayes T.K., Carrick K., Hammond D.J. Expert Rev. Proteomics. 2005;2:393. doi: 10.1586/14789450.2.3.393. [DOI] [PubMed] [Google Scholar]
- 8.Welsh J.B., Sapinoso L.M., Kern S.G., Brown D.A., Liu T., Bauskin A.R., Ward R.L., Hawkins N.J., Quinn D.I., Russell P.J., Sutherland R.L., Breit S.N., Moskaluk C.A., Frierson H.F., Jr., Hampton G.M. Proc. Natl. Acad. Sci. USA. 2003;100:3410. doi: 10.1073/pnas.0530278100. [DOI] [PMC free article] [PubMed] [Google Scholar]
- 9.Tirumalai R.S., Chan K.C., Prieto D.A., Issaq H.J., Conrads T.P., Veenstra T.D. Mol. Cell. Proteomics. 2003;2:1096. doi: 10.1074/mcp.M300031-MCP200. [DOI] [PubMed] [Google Scholar]
- 10.Zhang Z., Bast R.C., Jr., Yu Y., Li J., Sokoll L.J., Rai A.J., Rosenzweig J.M., Cameron B., Wang Y.Y., Meng X.Y., Berchuck A., Van Haaften-Day C., Hacker N.F., de Bruijn H.W., van der Zee A.G., Jacobs I.J., Fung E.T., Chan D.W. Cancer Res. 2004;64:5882. doi: 10.1158/0008-5472.CAN-04-0746. [DOI] [PubMed] [Google Scholar]
- 11.Mian S., Ugurel S., Parkinson E., Schlenzka I., Dryden I., Lancashire L., Ball G., Creaser C., Rees R., Schadendorf D. J. Clin. Oncol. 2005;23:5088. doi: 10.1200/JCO.2005.03.164. [DOI] [PubMed] [Google Scholar]
- 12.Terracciano R., Gaspari M., Testa F., Pasqua L., Tagliaferri P., Cheng M.M., Nijdam A.J., Petricoin E.F., Liotta L.A., Cuda G., Ferrari M., Venuta S. Proteomics. 2006;6:3243. doi: 10.1002/pmic.200500614. [DOI] [PubMed] [Google Scholar]
- 13.Qin S., Ferdinand A.S., Richie J.P., O’Leary M.P., Mok S.C., Liu B.C. Proteomics. 2005;5:3183. doi: 10.1002/pmic.200401137. [DOI] [PubMed] [Google Scholar]
- 14.Anderson N.L., Anderson N.G. Mol. Cell. Proteomics. 2002;1:845. doi: 10.1074/mcp.r200007-mcp200. [DOI] [PubMed] [Google Scholar]
- 15.Bodovitz S., Joos T. Trends Biotechnol. 2004;22:4. doi: 10.1016/j.tibtech.2003.10.013. [DOI] [PubMed] [Google Scholar]
- 16.Luque de Castro M.D., Luque-Garcia J.L. Elsevier; Amsterdam: 2002. Acceleration and Automation of Solid Sample Treatment. [Google Scholar]
- 17.Villanueva J., Philip J., Entenberg D., Chaparro C.A., Tanwar M.K., Holland E.C., Tempst P. Anal. Chem. 2004;76:1560. doi: 10.1021/ac0352171. [DOI] [PubMed] [Google Scholar]
- 18.Hsieh S.Y., Chen R.K., Pan Y.H., Lee H.L. Proteomics. 2006;6:3189. doi: 10.1002/pmic.200500535. [DOI] [PubMed] [Google Scholar]
- 19.Rai A.J., Gelfand C.A., Haywood B.C., Warunek D.J., Yi J., Schuchard M.D., Mehigh R.J., Cockrill S.L., Scott G.B., Tammen H., Schulz-Knappe P., Speicher D.W., Vitzthum F., Haab B.B., Siest G., Chan D.W. Proteomics. 2005;5:3262. doi: 10.1002/pmic.200401245. [DOI] [PubMed] [Google Scholar]
- 20.Banks R.E., Stanley A.J., Cairns D.A., Barrett J.H., Clarke P., Thompson D., Selby P.J. Clin. Chem. 2005;51:1637. doi: 10.1373/clinchem.2005.051417. [DOI] [PubMed] [Google Scholar]
- 21.Bons J.A., Wodzig W.K., van Dieijen-Visser M.P. Clin. Chem. Lab. Med. 2005;43:1281. doi: 10.1515/CCLM.2005.222. [DOI] [PubMed] [Google Scholar]
- 22.Wickus G.G., Mordan R.J., Mathews E.A. Clin. Chem. 1992;38:2347. [PubMed] [Google Scholar]
- 23.Hill B.M., Laessig R.H., Koch D.D., Hassemer D.J. Clin. Chem. 1992;38:1474. [PubMed] [Google Scholar]
- 24.Sampson M., Ruddel M., Albright S., Elin R.J. Clin. Chem. 1997;43:675. [PubMed] [Google Scholar]
- 25.Drake S.K., Bowen R.A., Remaley A.T., Hortin G.L. Clin. Chem. 2004;50:2398. doi: 10.1373/clinchem.2004.040303. [DOI] [PubMed] [Google Scholar]
- 26.Villanueva J., Philip J., Chaparro C.A., Li Y., Toledo-Crow R., DeNoyer L., Fleisher M., Robbins R.J., Tempst P. J. Proteome Res. 2005;4:1060. doi: 10.1021/pr050034b. [DOI] [PMC free article] [PubMed] [Google Scholar]
- 27.Dammann C.E., Meyer M., Dammann O., von Neuhoff N. Biol. Neonate. 2006;89:126. doi: 10.1159/000088716. [DOI] [PubMed] [Google Scholar]
- 28.Capila I., Linhardt R.J. Angew. Chem. Int. Ed. Engl. 2002;41:391. doi: 10.1002/1521-3773(20020201)41:3<390::aid-anie390>3.0.co;2-b. [DOI] [PubMed] [Google Scholar]
- 29.Baumann S., Ceglarek U., Fiedler G.M., Lembcke J., Leichtle A., Thiery J. Clin. Chem. 2005;51:973. doi: 10.1373/clinchem.2004.047308. [DOI] [PubMed] [Google Scholar]
- 30.Spencer K. Ann. Clin. Biochem. 2003;40:166. doi: 10.1258/000456303763046102. [DOI] [PubMed] [Google Scholar]
- 31.White J.G. Platelets. 2000;11:49. doi: 10.1080/09537100075805. [DOI] [PubMed] [Google Scholar]
- 32.West-Nielsen M., Hogdall E.V., Marchiori E., Hogdall C.K., Schou C., Heegaard N.H. Anal. Chem. 2005;77:5114. doi: 10.1021/ac050253g. [DOI] [PubMed] [Google Scholar]
- 33.Marshall J., Kupchak P., Zhu W., Yantha J., Vrees T., Furesz S., Jacks K., Smith C., Kireeva I., Zhang R., Takahashi M., Stanton E., Jackowski G. J. Proteome Res. 2003;2:361. doi: 10.1021/pr030003l. [DOI] [PubMed] [Google Scholar]
- 34.Hogdall E.V., Johansen J.S., Kjaer S.K., Price P.A., Blaakjaer J., Hogdall C.K. Scand. J. Clin. Lab. Invest. 2000;60:247. doi: 10.1080/00365510050184886. [DOI] [PubMed] [Google Scholar]
- 35.Hogdall E.V., Hogdall C.K., Kjaer S.K., Xu F., Yu Y., Bast R.C., Blaakaer J., Jacobs I.J. Clin. Chem. 1999;45:692. [PubMed] [Google Scholar]
- 36.Riisbro R., Christensen I.J., Hogdall C., Brunner N., Hogdall E. Int. J. Biol. Markers. 2001;16:233. doi: 10.1177/172460080101600402. [DOI] [PubMed] [Google Scholar]
- 37.de Noo M.E., Tollenaar R.A., Ozalp A., Kuppen P.J., Bladergroen M.R., Eilers P.H., Deelder A.M. Anal. Chem. 2005;77:7232. doi: 10.1021/ac050571f. [DOI] [PubMed] [Google Scholar]
- 38.Hood B.L., Lucas D.A., Kim G., Chan K.C., Blonder J., Issaq H.J., Veenstra T.D., Conrads T.P., Pollet I., Karsan A. J. Am. Soc. Mass Spectrom. 2005;16:1221. doi: 10.1016/j.jasms.2005.02.005. [DOI] [PubMed] [Google Scholar]
- 39.Bergen H.R., 3rd, Vasmatzis G., Cliby W.A., Johnson K.L., Oberg A.L., Muddiman D.C. Dis. Markers. 2003;19:239. doi: 10.1155/2004/797204. [DOI] [PMC free article] [PubMed] [Google Scholar]
- 40.Orvisky E., Drake S.K., Martin B.M., Abdel-Hamid M., Ressom H.W., Varghese R.S., An Y., Saha D., Hortin G.L., Loffredo C.A., Goldman R. Proteomics. 2006;6:2895. doi: 10.1002/pmic.200500443. [DOI] [PubMed] [Google Scholar]
- 41.Johnson K.L., Mason C.J., Muddiman D.C., Eckel J.E. Anal. Chem. 2004;76:5097. doi: 10.1021/ac0497003. [DOI] [PubMed] [Google Scholar]
- 42.Merrell K., Southwick K., Graves S.W., Esplin M.S., Lewis N.E., Thulin C.D. J. Biomol. Tech. 2004;15:238. [PMC free article] [PubMed] [Google Scholar]
- 43.Tammen H., Schulte I., Hess R., Menzel C., Kellmann M., Mohring T., Schulz-Knappe P. Proteomics. 2005;5:3414. doi: 10.1002/pmic.200401219. [DOI] [PubMed] [Google Scholar]
- 44.Kaiser T., Wittke S., Just I., Krebs R., Bartel S., Fliser D., Mischak H., Weissinger E.M. Electrophoresis. 2004;25:2044. doi: 10.1002/elps.200305788. [DOI] [PubMed] [Google Scholar]
- 45.Georgiou H.M., Rice G.E., Baker M.S. Proteomics. 2001;1:1503. doi: 10.1002/1615-9861(200111)1:12<1503::aid-prot1503>3.0.co;2-m. [DOI] [PubMed] [Google Scholar]
- 46.Chromy B.A., Gonzales A.D., Perkins J., Choi M.W., Corzett M.H., Chang B.C., Corzett C.H., McCutchen-Maloney S.L. J. Proteome Res. 2004;3:1120. doi: 10.1021/pr049921p. [DOI] [PubMed] [Google Scholar]
- 47.Zhang R., Barker L., Pinchev D., Marshall J., Rasamoelisolo M., Smith C., Kupchak P., Kireeva I., Ingratta L., Jackowski G. Proteomics. 2004;4:244. doi: 10.1002/pmic.200300495. [DOI] [PubMed] [Google Scholar]
- 48.Ramstrom M., Hagman C., Mitchell J.K., Derrick P.J., Hakansson P., Bergquist J. J. Proteome Res. 2005;4:410. doi: 10.1021/pr049812a. [DOI] [PubMed] [Google Scholar]
- 49.Björhall K., Miliotis T., Davidsson P. Proteomics. 2005;5:307. doi: 10.1002/pmic.200400900. [DOI] [PubMed] [Google Scholar]
- 50.Lopez M.F., Mikulskis A., Kuzdzal S., Bennett D.A., Kelly J., Golenko E., DiCesare J., Denoyer E., Patton W.F., Ediger R., Sapp L., Ziegert T., Lynch C., Kramer S., Whiteley G.R., Wall M.R., Mannion D.P., Della Cioppa G., Rakitan J.S., Wolfe G.M. Clin. Chem. 2005;51:1946. doi: 10.1373/clinchem.2005.053090. [DOI] [PubMed] [Google Scholar]
- 51.Zolotarjova N., Martosella J., Nicol G., Bailey J., Boyes B.E., Barrett W.C. Proteomics. 2005;5:3304. doi: 10.1002/pmic.200402021. [DOI] [PubMed] [Google Scholar]
- 52.Ahmed N., Barker G., Oliva K.T., Hoffmann P., Riley C., Reeve S., Smith A.I., Kemp B.E., Quinn M.A., Rice G.E. Br. J. Cancer. 2004;91:129. doi: 10.1038/sj.bjc.6601882. [DOI] [PMC free article] [PubMed] [Google Scholar]
- 53.Govorukhina N.I., Reijmers T.H., Nyangoma S.O., van der Zee A.G., Jansen R.C., Bischoff R. J. Chromatogr. A. 2006;1120:142. doi: 10.1016/j.chroma.2006.02.088. [DOI] [PubMed] [Google Scholar]
- 54.Bhat V.B., Choi M.H., Wishnok J.S., Tannenbaum S.R. J. Proteome Res. 2005;4:1814. doi: 10.1021/pr0501463. [DOI] [PubMed] [Google Scholar]
- 55.Echan L.A., Tang H.Y., Ali-Khan N., Lee K., Speicher D.W. Proteomics. 2005;5:3292. doi: 10.1002/pmic.200401228. [DOI] [PubMed] [Google Scholar]
- 56.Huang L., Harvie G., Feitelson J.S., Gramatikoff K., Herold D.A., Allen D.L., Amunngama R., Hagler R.A., Pisano M.R., Zhang W.W., Fang X. Proteomics. 2005;5:3314. doi: 10.1002/pmic.200401277. [DOI] [PubMed] [Google Scholar]
- 57.Callesen A.K., Mohammed S., Bunkenborg J., Kruse T.A., Cold S., Mogensen O., Christensen R., Vach W., Jorgensen P.E., Jensen O.N. Rapid Commun. Mass Spectrom. 2005;19:1578. doi: 10.1002/rcm.1960. [DOI] [PubMed] [Google Scholar]
- 58.Vesterberg O., Anundi H. Appl. Theor. Electrophor. 1991;2:159. [PubMed] [Google Scholar]
- 59.Guerrier L., Lomas L., Boschetti E. J. Chromatogr. A. 2005;1073:25. doi: 10.1016/j.chroma.2004.10.002. [DOI] [PubMed] [Google Scholar]
- 60.Pieper R., Su Q., Gatlin C.L., Huang S.T., Anderson N.L., Steiner S. Proteomics. 2003;3:422. doi: 10.1002/pmic.200390057. [DOI] [PubMed] [Google Scholar]
- 61.Cho S.Y., Lee E.Y., Lee J.S., Kim H.Y., Park J.M., Kwon M.S., Park Y.K., Lee H.J., Kang M.J., Kim J.Y., Yoo J.S., Park S.J., Cho J.W., Kim H.S., Paik Y.K. Proteomics. 2005;5:3386. doi: 10.1002/pmic.200401310. [DOI] [PubMed] [Google Scholar]
- 62.Misek D.E., Kuick R., Wang H., Galchev V., Deng B., Zhao R., Tra J., Pisano M.R., Amunugama R., Allen D., Walker A.K., Strahler J.R., Andrews P., Omenn G.S., Hanash S.M. Proteomics. 2005;5:3343. doi: 10.1002/pmic.200500103. [DOI] [PubMed] [Google Scholar]
- 63.Solassol J., Marin P., Demettre E., Rouanet P., Bockaert J., Maudelonde T., Mange A. Anal. Biochem. 2005;338:26. doi: 10.1016/j.ab.2004.11.031. [DOI] [PubMed] [Google Scholar]
- 64.Koomen J.M., Zhao H., Li D., Abbruzzese J., Baggerly K., Kobayashi R. Rapid Commun. Mass Spectrom. 2004;18:2537. doi: 10.1002/rcm.1657. [DOI] [PubMed] [Google Scholar]
- 65.Koomen J.M., Zhao H., Li D., Nasser W., Hawke D.H., Abbruzzese J.L., Baggerly K.A., Kobayashi R. Rapid Commun. Mass Spectrom. 2005;19:1624. doi: 10.1002/rcm.1963. [DOI] [PubMed] [Google Scholar]
- 66.Koomen J.M., Li D., Xiao L.C., Liu T.C., Coombes K.R., Abbruzzese J., Kobayashi R. J. Proteome Res. 2005;4:972. doi: 10.1021/pr050046x. [DOI] [PubMed] [Google Scholar]
- 67.Koomen J.M., Shih L.N., Coombes K.R., Li D., Xiao L.C., Fidler I.J., Abbruzzese J.L., Kobayashi R. Clin. Cancer Res. 2005;11:1110. [PubMed] [Google Scholar]
- 68.Chertov O., Biragyn A., Kwak L.W., Simpson J.T., Boronina T., Hoang V.M., Prieto D.A., Conrads T.P., Veenstra T.D., Fisher R.J. Proteomics. 2004;4:1195. doi: 10.1002/pmic.200300677. [DOI] [PubMed] [Google Scholar]
- 69.Rogers M.A., Clarke P., Noble J., Munro N.P., Paul A., Selby P.J., Banks R.E. Cancer Res. 2003;63:6971. [PubMed] [Google Scholar]
- 70.Uchida T., Fukawa A., Uchida M., Fujita K., Saito K. J. Proteome Res. 2002;1:495. doi: 10.1021/pr025531w. [DOI] [PubMed] [Google Scholar]
- 71.Petricoin E.E., Paweletz C.P., Liotta L.A. J. Mammary Gland Biol. Neoplasia. 2002;7:433. doi: 10.1023/a:1024042200521. [DOI] [PubMed] [Google Scholar]
- 72.Molina H., Bunkenborg J., Reddy G.H., Muthusamy B., Scheel P.J., Pandey A. Mol. Cell. Proteomics. 2005;4:637. doi: 10.1074/mcp.M500042-MCP200. [DOI] [PubMed] [Google Scholar]
- 73.Petricoin E.F., Liotta L.A. Curr. Opin. Biotechnol. 2004;15:24. doi: 10.1016/j.copbio.2004.01.005. [DOI] [PubMed] [Google Scholar]
- 74.Liggett W.S., Barker P.E., Semmes O.J., Cazares L.H. Dis. Markers. 2004;20:295. doi: 10.1155/2004/726517. [DOI] [PMC free article] [PubMed] [Google Scholar]
- 75.Gericke B., Koebnick C., Reimann M., Forterre S., Franz Zunft H.J., Schweigert F.J. Maturitas. 2005;51:334. doi: 10.1016/j.maturitas.2004.08.016. [DOI] [PubMed] [Google Scholar]
- 76.Yang E.C., Guo J., Diehl G., DeSouza L., Rodrigues M.J., Romaschin A.D., Colgan T.J., Siu K.W. J. Proteome Res. 2004;3:636. doi: 10.1021/pr049975z. [DOI] [PubMed] [Google Scholar]
- 77.Li J., Zhang Z., Rosenzweig J., Wang Y.Y., Chan D.W. Clin. Chem. 2002;48:1296. [PubMed] [Google Scholar]
- 78.Merchant M., Weinberger S.R. Electrophoresis. 2000;21:1164. doi: 10.1002/(SICI)1522-2683(20000401)21:6<1164::AID-ELPS1164>3.0.CO;2-0. [DOI] [PubMed] [Google Scholar]
- 79.Xiao Z., Prieto D., Conrads T.P., Veenstra T.D., Issaq H.J. Mol. Cell. Endocrinol. 2005;230:95. doi: 10.1016/j.mce.2004.10.010. [DOI] [PubMed] [Google Scholar]
- 80.Issaq H.J., Veenstra T.D., Conrads T.P., Felschow D. Biochem. Biophys. Res. Commun. 2002;292:587. doi: 10.1006/bbrc.2002.6678. [DOI] [PubMed] [Google Scholar]
- 81.Qu Y., Adam B.L., Yasui Y., Ward M.D., Cazares L.H., Schellhammer P.F., Feng Z., Semmes O.J., Wright G.L., Jr. Clin. Chem. 2002;48:1835. [PubMed] [Google Scholar]
- 82.Vlahou A., Laronga C., Wilson L., Gregory B., Fournier K., McGaughey D., Perry R.R., Wright G.L., Jr., Semmes O.J. Clin. Breast Cancer. 2003;4:203. doi: 10.3816/cbc.2003.n.026. [DOI] [PubMed] [Google Scholar]
- 83.Kozak K.R., Amneus M.W., Pusey S.M., Su F., Luong M.N., Luong S.A., Reddy S.T., Farias-Eisner R. Proc. Natl. Acad. Sci. USA. 2003;100:12343. doi: 10.1073/pnas.2033602100. [DOI] [PMC free article] [PubMed] [Google Scholar]
- 84.Won Y., Song H.J., Kang T.W., Kim J.J., Han B.D., Lee S.W. Proteomics. 2003;3:2310. doi: 10.1002/pmic.200300590. [DOI] [PubMed] [Google Scholar]
- 85.Baggerly K.A., Morris J.S., Coombes K.R. Bioinformatics. 2004;20:777. doi: 10.1093/bioinformatics/btg484. [DOI] [PubMed] [Google Scholar]
- 86.Check E. Nature. 2004;429:496. doi: 10.1038/429496a. [DOI] [PubMed] [Google Scholar]
- 87.Diamandis E.P. Mol. Cell. Proteomics. 2004;3:367. doi: 10.1074/mcp.R400007-MCP200. [DOI] [PubMed] [Google Scholar]
- 88.Diamandis E.P. J. Natl. Cancer Inst. 2004;96:353. doi: 10.1093/jnci/djh056. [DOI] [PubMed] [Google Scholar]
- 89.Sorace J.M., Zhan M. BMC Bioinform. 2003;4:24. doi: 10.1186/1471-2105-4-24. [DOI] [PMC free article] [PubMed] [Google Scholar]
- 90.Diamandis E.P. Clin. Chem. 2003;49:1272. doi: 10.1373/49.8.1272. [DOI] [PubMed] [Google Scholar]
- 91.Diamandis E.P. J. Urol. 2004;171:1244. doi: 10.1097/01.ju.0000112784.51142.bd. [DOI] [PubMed] [Google Scholar]
- 92.Rai A.J., Stemmer P.M., Zhang Z., Adam B.L., Morgan W.T., Caffrey R.E., Podust V.N., Patel M., Lim L.Y., Shipulina N.V., Chan D.W., Semmes O.J., Leung H.C. Proteomics. 2005;5:3467. doi: 10.1002/pmic.200401320. [DOI] [PubMed] [Google Scholar]
- 93.Chapman K. Biochem. Soc. Trans. 2002;30:82. doi: 10.1042/. [DOI] [PubMed] [Google Scholar]
- 94.Conrads T.P., Fusaro V.A., Ross S., Johann D., Rajapakse V., Hitt B.A., Steinberg S.M., Kohn E.C., Fishman D.A., Whitely G., Barrett J.C., Liotta L.A., Petricoin E.F., 3rd, Veenstra T.D. Endocr. Relat. Cancer. 2004;11:163. doi: 10.1677/erc.0.0110163. [DOI] [PubMed] [Google Scholar]
- 95.Laronga C., Becker S., Watson P., Gregory B., Cazares L., Lynch H., Perry R.R., Wright G.L., Jr., Drake R.R., Semmes O.J. Dis. Markers. 2003;19:229. doi: 10.1155/2004/759530. [DOI] [PMC free article] [PubMed] [Google Scholar]
- 96.Hu Y., Zhang S., Yu J., Liu J., Zheng S. Breast. 2005;14:250. doi: 10.1016/j.breast.2005.01.008. [DOI] [PubMed] [Google Scholar]
- 97.Abramovitz M., Leyland-Jones B. Proteome Sci. 2006;4:5. doi: 10.1186/1477-5956-4-5. [DOI] [PMC free article] [PubMed] [Google Scholar]
- 98.Hlavaty J.J., Partin A.W., Shue M.J., Mangold L.A., Derby J., Javier T., Kelley S., Stieg A., Briggman J.V., Hass G.M., Wu Y.J. Urology. 2003;61:1261. doi: 10.1016/s0090-4295(03)00036-0. [DOI] [PubMed] [Google Scholar]
- 99.Banez L.L., Prasanna P., Sun L., Ali A., Zou Z., Adam B.L., McLeod D.G., Moul J.W., Srivastava S. J. Urol. 2003;170:442. doi: 10.1097/01.ju.0000069431.95404.56. [DOI] [PubMed] [Google Scholar]
- 100.Malik G., Ward M.D., Gupta S.K., Trosset M.W., Grizzle W.E., Adam B.L., Diaz J.I., Semmes O.J. Clin. Cancer Res. 2005;11:1073. [PubMed] [Google Scholar]
- 101.Li J., White N., Zhang Z., Rosenzweig J., Mangold L.A., Partin A.W., Chan D.W. J. Urol. 2004;171:1782. doi: 10.1097/01.ju.0000119823.86393.49. [DOI] [PubMed] [Google Scholar]
- 102.Pan Y.Z., Xiao X.Y., Zhao D., Zhang L., Ji G.Y., Li Y., Yang B.X., He D.C., Zhao X.J. Asian J. Androl. 2006;8:45. doi: 10.1111/j.1745-7262.2006.00103.x. [DOI] [PubMed] [Google Scholar]
- 103.Banez L.L., Srivastava S., Moul J.W. Curr. Opin. Urol. 2005;15:151. doi: 10.1097/01.mou.0000165547.48922.12. [DOI] [PubMed] [Google Scholar]
- 104.Adam B.L., Qu Y., Davis J.W., Ward M.D., Clements M.A., Cazares L.H., Semmes O.J., Schellhammer P.F., Yasui Y., Feng Z., Wright G.L., Jr. Cancer Res. 2002;62:3609. [PubMed] [Google Scholar]
- 105.Ye B., Cramer D.W., Skates S.J., Gygi S.P., Pratomo V., Fu L., Horick N.K., Licklider L.J., Schorge J.O., Berkowitz R.S., Mok S.C. Clin. Cancer Res. 2003;9:2904. [PubMed] [Google Scholar]
- 106.Zhang H., Kong B., Qu X., Jia L., Deng B., Yang Q. Gynecol. Oncol. 2006;102:61. doi: 10.1016/j.ygyno.2005.11.029. [DOI] [PubMed] [Google Scholar]
- 107.Fung E.T., Yip T.T., Lomas L., Wang Z., Yip C., Meng X.Y., Lin S., Zhang F., Zhang Z., Chan D.W., Weinberger S.R. Int. J. Cancer. 2005;115:783. doi: 10.1002/ijc.20928. [DOI] [PubMed] [Google Scholar]
- 108.Boyce E.A., Kohn E.C. Int. J. Gynecol. Cancer. 2005;15(Suppl. 3):266. doi: 10.1111/j.1525-1438.2005.00434.x. [DOI] [PubMed] [Google Scholar]
- 109.Lin Y.W., Lin C.Y., Lai H.C., Chiou J.Y., Chang C.C., Yu M.H., Chu T.Y. Int. J. Gynecol. Cancer. 2006;16(Suppl. 1):139. doi: 10.1111/j.1525-1438.2006.00475.x. [DOI] [PubMed] [Google Scholar]
- 110.Woong-Shick A., Sung-Pil P., Su-Mi B., Joon-Mo L., Sung-Eun N., Gye-Hyun N., Young-Lae C., Ho-Sun C., Heung-Jae J., Chong-Kook K., Young-Wan K., Byoung-Don H., Hyun-Sun J. Cancer Sci. 2005;96:197. doi: 10.1111/j.1349-7006.2005.00029.x. [DOI] [PMC free article] [PubMed] [Google Scholar]
- 111.Moshkovskii S.A., Serebryakova M.V., Kuteykin-Teplyakov K.B., Tikhonova O.V., Goufman E.I., Zgoda V.G., Taranets I.N., Makarov O.V., Archakov A.I. Proteomics. 2005;5:3790. doi: 10.1002/pmic.200401205. [DOI] [PubMed] [Google Scholar]
- 112.Kozak K.R., Su F., Whitelegge J.P., Faull K., Reddy S., Farias-Eisner R. Proteomics. 2005;5:4589. doi: 10.1002/pmic.200500093. [DOI] [PubMed] [Google Scholar]
- 113.Rai A.J., Zhang Z., Rosenzweig J., Shih Ie M., Pham T., Fung E.T., Sokoll L.J., Chan D.W. Arch. Pathol. Lab. Med. 2002;126:1518. doi: 10.5858/2002-126-1518-PATTMD. [DOI] [PubMed] [Google Scholar]
- 114.Jacobs I.J., Menon U. Mol. Cell. Proteomics. 2004;3:355. doi: 10.1074/mcp.R400006-MCP200. [DOI] [PubMed] [Google Scholar]
- 115.Chen Y.D., Zheng S., Yu J.K., Hu X. Clin. Cancer Res. 2004;10:8380. doi: 10.1158/1078-0432.CCR-1162-03. [DOI] [PubMed] [Google Scholar]
- 116.Yu J.K., Chen Y.D., Zheng S. World J. Gastroenterol. 2004;10:3127. doi: 10.3748/wjg.v10.i21.3127. [DOI] [PMC free article] [PubMed] [Google Scholar]
- 117.Engwegen J.Y., Helgason H.H., Cats A., Harris N., Bonfrer J.M., Schellens J.H., Beijnen J.H. World J. Gastroenterol. 2006;12:1536. doi: 10.3748/wjg.v12.i10.1536. [DOI] [PMC free article] [PubMed] [Google Scholar]
- 118.Albrethsen J., Bogebo R., Gammeltoft S., Olsen J., Winther B., Raskov H. BMC Cancer. 2005;5:8. doi: 10.1186/1471-2407-5-8. [DOI] [PMC free article] [PubMed] [Google Scholar]
- 119.Poon T.C., Sung J.J., Chow S.M., Ng E.K., Yu A.C., Chu E.S., Hui A.M., Leung W.K. Gastroenterology. 2006;130:1858. doi: 10.1053/j.gastro.2006.02.011. [DOI] [PubMed] [Google Scholar]
- 120.Qian H.G., Shen J., Ma H., Ma H.C., Su Y.H., Hao C.Y., Xing B.C., Huang X.F., Shou C.C. World J. Gastroenterol. 2005;11:6249. doi: 10.3748/wjg.v11.i40.6249. [DOI] [PMC free article] [PubMed] [Google Scholar]
- 121.Zhu L.R., Zhang W.Y., Yu L., Zheng Y.H., Zhang J.Z., Liao Q.P. Int. J. Gynecol. Cancer. 2006;16:1374. doi: 10.1111/j.1525-1438.2006.00561.x. [DOI] [PubMed] [Google Scholar]
- 122.Rosty C., Goggins M. Methods Mol. Med. 2005;103:189. doi: 10.1385/1-59259-780-7:189. [DOI] [PubMed] [Google Scholar]
- 123.Bhattacharyya S., Siegel E.R., Petersen G.M., Chari S.T., Suva L.J., Haun R.S. Neoplasia. 2004;6:674. doi: 10.1593/neo.04262. [DOI] [PMC free article] [PubMed] [Google Scholar]
- 124.Yu Y., Chen S., Wang L.S., Chen W.L., Guo W.J., Yan H., Zhang W.H., Peng C.H., Zhang S.D., Li H.W., Chen G.Q. Oncology. 2005;68:79. doi: 10.1159/000084824. [DOI] [PubMed] [Google Scholar]
- 125.Wadsworth J.T., Somers K.D., Cazares L.H., Malik G., Adam B.L., Stack B.C., Jr., Wright G.L., Jr., Semmes O.J. Clin. Cancer Res. 2004;10:1625. doi: 10.1158/1078-0432.ccr-0297-3. [DOI] [PubMed] [Google Scholar]
- 126.Wadsworth J.T., Somers K.D., Stack B.C., Jr., Cazares L., Malik G., Adam B.L., Wright G.L., Jr., Semmes O.J. Arch. Otolaryngol. Head Neck Surg. 2004;130:98. doi: 10.1001/archotol.130.1.98. [DOI] [PubMed] [Google Scholar]
- 127.Yang S.Y., Xiao X.Y., Zhang W.G., Zhang L.J., Zhang W., Zhou B., Chen G., He D.C. BMC Cancer. 2005;5:83. doi: 10.1186/1471-2407-5-83. [DOI] [PMC free article] [PubMed] [Google Scholar]
- 128.Sandoval J.A., Dobrolecki L.E., Huang J., Grosfeld J.L., Hickey R.J., Malkas L.H. J. Pediatr. Surg. 2006;41:639. doi: 10.1016/j.jpedsurg.2005.12.037. [DOI] [PubMed] [Google Scholar]
- 129.Combaret V., Bergeron C., Brejon S., Iacono I., Perol D., Negrier S., Puisieux A. Cancer Lett. 2005;228:91. doi: 10.1016/j.canlet.2004.12.053. [DOI] [PubMed] [Google Scholar]
- 130.Schwegler E.E., Cazares L., Steel L.F., Adam B.L., Johnson D.A., Semmes O.J., Block T.M., Marrero J.A., Drake R.R. Hepatology. 2005;41:634. doi: 10.1002/hep.20577. [DOI] [PubMed] [Google Scholar]
- 131.Paradis V., Degos F., Dargere D., Pham N., Belghiti J., Degott C., Janeau J.L., Bezeaud A., Delforge D., Cubizolles M., Laurendeau I., Bedossa P. Hepatology. 2005;41:40. doi: 10.1002/hep.20505. [DOI] [PubMed] [Google Scholar]
- 132.Wang J.X., Zhang B., Yu J.K., Liu J., Yang M.Q., Zheng S. Chin. Med. J. (Engl.) 2005;118:1278. [PubMed] [Google Scholar]
- 133.Tolson J., Bogumil R., Brunst E., Beck H., Elsner R., Humeny A., Kratzin H., Deeg M., Kuczyk M., Mueller G.A., Mueller C.A., Flad T. Lab. Invest. 2004;84:845. doi: 10.1038/labinvest.3700097. [DOI] [PubMed] [Google Scholar]
- 134.Hara T., Honda K., Ono M., Naito K., Hirohashi S., Yamada T. J. Urol. 2005;174:1213. doi: 10.1097/01.ju.0000173915.83164.87. [DOI] [PubMed] [Google Scholar]
- 135.Ho D.W., Yang Z.F., Wong B.Y., Kwong D.L., Sham J.S., Wei W.I., Yuen A.P. Cancer. 2006;107:99. doi: 10.1002/cncr.21970. [DOI] [PubMed] [Google Scholar]
- 136.Brouwers F.M., Petricoin E.F., 3rd, Ksinantova L., Breza J., Rajapakse V., Ross S., Johann D., Mannelli M., Shulkin B.L., Kvetnansky R., Eisenhofer G., Walther M.M., Hitt B.A., Conrads T.P., Veenstra T.D., Mannion D.P., Wall M.R., Wolfe G.M., Fusaro V.A., Liotta L.A., Pacak K. Endocr. Relat. Cancer. 2005;12:263. doi: 10.1677/erc.1.00913. [DOI] [PubMed] [Google Scholar]
- 137.Liu J., Zheng S., Yu J.K., Zhang J.M., Chen Z. J. Zhejiang Univ. Sci. B. 2005;6:4. doi: 10.1631/jzus.2005.B0004. [DOI] [PMC free article] [PubMed] [Google Scholar]
- 138.Wilson L.L., Tran L., Morton D.L., Hoon D.S. Ann. N. Y. Acad. Sci. 2004;1022:317. doi: 10.1196/annals.1318.047. [DOI] [PubMed] [Google Scholar]
- 139.Le L., Chi K., Tyldesley S., Flibotte S., Diamond D.L., Kuzyk M.A., Sadar M.D. Clin. Chem. 2005;51:695. doi: 10.1373/clinchem.2004.041087. [DOI] [PubMed] [Google Scholar]
- 140.Kang X., Xu Y., Wu X., Liang Y., Wang C., Guo J., Wang Y., Chen M., Wu D., Wang Y., Bi S., Qiu Y., Lu P., Cheng J., Xiao B., Hu L., Gao X., Liu J., Wang Y., Song Y., Zhang L., Suo F., Chen T., Huang Z., Zhao Y., Lu H., Pan C., Tang H. Clin. Chem. 2005;51:56. doi: 10.1373/clinchem.2004.032458. [DOI] [PMC free article] [PubMed] [Google Scholar]
- 141.Yip T.T., Chan J.W., Cho W.C., Yip T.T., Wang Z., Kwan T.L., Law S.C., Tsang D.N., Chan J.K., Lee K.C., Cheng W.W., Ma V.W., Yip C., Lim C.K., Ngan R.K., Au J.S., Chan A., Lim W.W. Clin. Chem. 2005;51:47. doi: 10.1373/clinchem.2004.031229. [DOI] [PMC free article] [PubMed] [Google Scholar]
- 142.Pang R.T., Poon T.C., Chan K.C., Lee N.L., Chiu R.W., Tong Y.K., Wong R.M., Chim S.S., Ngai S.M., Sung J.J., Lo Y.M. Clin. Chem. 2006;52:421. doi: 10.1373/clinchem.2005.061689. [DOI] [PMC free article] [PubMed] [Google Scholar]
- 143.Stanley B.A., Gundry R.L., Cotter R.J., Van Eyk J.E. Dis. Markers. 2004;20:167. doi: 10.1155/2004/965261. [DOI] [PMC free article] [PubMed] [Google Scholar]
- 144.Allard L., Lescuyer P., Burgess J., Leung K.Y., Ward M., Walter N., Burkhard P.R., Corthals G., Hochstrasser D.F., Sanchez J.C. Proteomics. 2004;4:2242. doi: 10.1002/pmic.200300809. [DOI] [PubMed] [Google Scholar]
- 145.Cho W.C., Yip T.T., Chung W.S., Leung A.W., Cheng C.H., Yue K.K. J. Cell Biochem. 2006 doi: 10.1002/jcb.20923. [DOI] [PubMed] [Google Scholar]
- 146.Zhu X.D., Zhang W.H., Li C.L., Xu Y., Liang W.J., Tien P. World J. Gastroenterol. 2004;10:2327. doi: 10.3748/wjg.v10.i16.2327. [DOI] [PMC free article] [PubMed] [Google Scholar]
- 147.Gravett M.G., Novy M.J., Rosenfeld R.G., Reddy A.P., Jacob T., Turner M., McCormack A., Lapidus J.A., Hitti J., Eschenbach D.A., Roberts C.T., Jr., Nagalla S.R. JAMA. 2004;292:462. doi: 10.1001/jama.292.4.462. [DOI] [PubMed] [Google Scholar]
- 148.de Seny D., Fillet M., Meuwis M.A., Geurts P., Lutteri L., Ribbens C., Bours V., Wehenkel L., Piette J., Malaise M., Merville M.P. Arthritis Rheum. 2005;52:3801. doi: 10.1002/art.21607. [DOI] [PubMed] [Google Scholar]
- 149.Shah Z.A., Jortani S.A., Tauman R., Valdes R., Jr., Gozal D. Pediatr. Res. 2006;59:466. doi: 10.1203/01.pdr.0000198817.35627.fc. [DOI] [PubMed] [Google Scholar]
- 150.Papadopoulos M.C., Abel P.M., Agranoff D., Stich A., Tarelli E., Bell B.A., Planche T., Loosemore A., Saadoun S., Wilkins P., Krishna S. Lancet. 2004;363:1358. doi: 10.1016/S0140-6736(04)16046-7. [DOI] [PubMed] [Google Scholar]
- 151.Zhai R., Su S., Lu X., Liao R., Ge X., He M., Huang Y., Mai S., Lu X., Christiani D. Biometals. 2005;18:603. doi: 10.1007/s10534-005-3001-x. [DOI] [PubMed] [Google Scholar]
- 152.Boggs S.E. Expert Rev. Proteomics. 2004;1:29. doi: 10.1586/14789450.1.1.29. [DOI] [PubMed] [Google Scholar]
- 153.Nomura F., Tomonaga T., Sogawa K., Ohashi T., Nezu M., Sunaga M., Kondo N., Iyo M., Shimada H., Ochiai T. Proteomics. 2004;4:1187. doi: 10.1002/pmic.200300674. [DOI] [PubMed] [Google Scholar]
- 154.Feuerstein I., Rainer M., Bernardo K., Stecher G., Huck C.W., Kofler K., Pelzer A., Horninger W., Klocker H., Bartsch G., Bonn G.K. J. Proteome Res. 2005;4:2320. doi: 10.1021/pr050227z. [DOI] [PubMed] [Google Scholar]
- 155.Feuerstein I., Najam-Ul-Haq M., Rainer M., Trojer L., Bakry R., Aprilita N.H., Stecher G., Huck C.W., Bonn G.K., Klocker H., Bartsch G., Guttman A. J. Am. Soc. Mass Spectrom. 2006 doi: 10.1016/j.jasms.2006.04.032. [DOI] [PubMed] [Google Scholar]
- 156.Trojer L., Stecher G., Feuerstein I., Bonn G.K. Rapid Commun. Mass Spectrom. 2005;19:3398. doi: 10.1002/rcm.2205. [DOI] [PubMed] [Google Scholar]
- 157.Chou P.H., Chen S.H., Liao H.K., Lin P.C., Her G.R., Lai A.C., Chen J.H., Lin C.C., Chen Y.J. Anal. Chem. 2005;77:5990. doi: 10.1021/ac050655o. [DOI] [PubMed] [Google Scholar]
- 158.Zhang X., Leung S.M., Morris C.R., Shigenaga M.K. J. Biomol. Tech. 2004;15:167. [PMC free article] [PubMed] [Google Scholar]
- 159.Tummala R., Limbach P.A. Anal. Chim. Acta. 2005;551:137. [Google Scholar]
- 160.Zhang H., Yi E.C., Li X.J., Mallick P., Kelly-Spratt K.S., Masselon C.D., Camp D.G., 2nd, Smith R.D., Kemp C.J., Aebersold R. Mol. Cell. Proteomics. 2005;4:144. doi: 10.1074/mcp.M400090-MCP200. [DOI] [PubMed] [Google Scholar]
- 161.Pan S., Zhang H., Rush J., Eng J., Zhang N., Patterson D., Comb M.J., Aebersold R. Mol. Cell. Proteomics. 2005;4:182. doi: 10.1074/mcp.M400161-MCP200. [DOI] [PubMed] [Google Scholar]
- 162.Morelle W., Flahaut C., Michalski J.C., Louvet A., Mathurin P., Klein A. Glycobiology. 2006;16:281. doi: 10.1093/glycob/cwj067. [DOI] [PubMed] [Google Scholar]
- 163.Hakomori S. Cancer Res. 1996;56:5309. [PubMed] [Google Scholar]
- 164.Kobata A. Glycoconj. J. 1998;15:323. doi: 10.1023/a:1006961532182. [DOI] [PubMed] [Google Scholar]
- 165.Butler M., Quelhas D., Critchley A.J., Carchon H., Hebestreit H.F., Hibbert R.G., Vilarinho L., Teles E., Matthijs G., Schollen E., Argibay P., Harvey D.J., Dwek R.A., Jaeken J., Rudd P.M. Glycobiology. 2003;13:601. doi: 10.1093/glycob/cwg079. [DOI] [PubMed] [Google Scholar]
- 166.Ryden I., Pahlsson P., Lindgren S. Clin. Chem. 2002;48:2195. [PubMed] [Google Scholar]
- 167.Flahaut C., Michalski J.C., Danel T., Humbert M.H., Klein A. Glycobiology. 2003;13:191. doi: 10.1093/glycob/cwg016. [DOI] [PubMed] [Google Scholar]
- 168.Putnam F. second ed. Academic Press; New York: 1975. The Plasma Proteins: Structure, Function and Genetic Control. [Google Scholar]
- 169.Durand G., Seta N. Clin. Chem. 2000;46:795. [PubMed] [Google Scholar]
- 170.Zhang H., Li X.J., Martin D.B., Aebersold R. Nat. Biotechnol. 2003;21:660. doi: 10.1038/nbt827. [DOI] [PubMed] [Google Scholar]
- 171.Drake R.R., Schwegler E.E., Malik G., Diaz J.I., Block T., Mehta A., Semmes O.J. Mol. Cell. Proteomics. 2006 doi: 10.1074/mcp.M600176-MCP200. [DOI] [PubMed] [Google Scholar]
- 172.Goldstein I.J. J. Agric. Food Chem. 2002;50:6583. doi: 10.1021/jf0201879. [DOI] [PubMed] [Google Scholar]
- 173.Hirabayashi J. Glycoconj. J. 2004;21:35. doi: 10.1023/B:GLYC.0000043745.18988.a1. [DOI] [PubMed] [Google Scholar]
- 174.Geho D., Cheng M.M., Killian K., Lowenthal M., Ross S., Frogale K., Nijdam J., Lahar N., Johann D., Herrmann P., Whiteley G., Ferrari M., Petricoin E., Liotta L. Bioconjug. Chem. 2006;17:654. doi: 10.1021/bc0503364. [DOI] [PubMed] [Google Scholar]
- 175.Bischoff R., Luider T.M. J. Chromatogr. B Anal. Technol. Biomed. Life Sci. 2004;803:27. doi: 10.1016/j.jchromb.2003.09.004. [DOI] [PubMed] [Google Scholar]
- 176.Righetti P.G., Castagna A., Herbert B., Reymond F., Rossier J.S. Proteomics. 2003;3:1397. doi: 10.1002/pmic.200300472. [DOI] [PubMed] [Google Scholar]
- 177.Zuo X., Speicher D.W. Proteomics. 2002;2:58. [PubMed] [Google Scholar]
- 178.Rodland K.D. Clin. Biochem. 2004;37:579. doi: 10.1016/j.clinbiochem.2004.05.011. [DOI] [PubMed] [Google Scholar]
- 179.Yu K.H., Rustgi A.K., Blair I.A. J. Proteome Res. 2005;4:1742. doi: 10.1021/pr050174l. [DOI] [PubMed] [Google Scholar]
- 180.Zimmermann-Ivol C.G., Burkhard P.R., Le Floch-Rohr J., Allard L., Hochstrasser D.F., Sanchez J.C. Mol. Cell. Proteomics. 2004;3:66. doi: 10.1074/mcp.M300066-MCP200. [DOI] [PubMed] [Google Scholar]
- 181.van den Bemd G.J., Krijgsveld J., Luider T.M., van Rijswijk A.L., Demmers J.A., Jenster G. Mol. Cell. Proteomics. 2006 doi: 10.1074/mcp.M500371-MCP200. [DOI] [PubMed] [Google Scholar]
- 182.Drake R.R., Cazare L.H., Semmes O.J., Wadsworth J.T. Expert Rev. Mol. Diagn. 2005;5:93. doi: 10.1586/14737159.5.1.93. [DOI] [PubMed] [Google Scholar]
- 183.Huang X., Wei Y., Li L., Wen Y., Yang J., Liu B., Song X., Zhao J. Oral Oncol. 2006;42:26. doi: 10.1016/j.oraloncology.2005.06.005. [DOI] [PubMed] [Google Scholar]
- 184.Kwak J.Y., Ma T.Z., Yoo M.J., Choi B.H., Kim H.G., Kim S.R., Yim C.Y., Kwak Y.G. Exp. Hematol. 2004;32:836. doi: 10.1016/j.exphem.2004.06.006. [DOI] [PubMed] [Google Scholar]
- 185.Feng J.T., Liu Y.K., Song H.Y., Dai Z., Qin L.X., Almofti M.R., Fang C.Y., Lu H.J., Yang P.Y., Tang Z.Y. Proteomics. 2005;5:4581. doi: 10.1002/pmic.200401309. [DOI] [PubMed] [Google Scholar]
- 186.Kawakami T., Hoshida Y., Kanai F., Tanaka Y., Tateishi K., Ikenoue T., Obi S., Sato S., Teratani T., Shiina S., Kawabe T., Suzuki T., Hatano N., Taniguchi H., Omata M. Proteomics. 2005;5:4287. doi: 10.1002/pmic.200401287. [DOI] [PubMed] [Google Scholar]
- 187.Amacher D.E., Adler R., Herath A., Townsend R.R. Clin. Chem. 2005;51:1796. doi: 10.1373/clinchem.2005.049908. [DOI] [PubMed] [Google Scholar]
- 188.Rui Z., Jian-Guo J., Yuan-Peng T., Hai P., Bing-Gen R. Proteomics. 2003;3:433. doi: 10.1002/pmic.200390058. [DOI] [PubMed] [Google Scholar]
- 189.Kuruma H., Egawa S., Oh-Ishi M., Kodera Y., Satoh M., Chen W., Okusa H., Matsumoto K., Maeda T., Baba S. Proteomics. 2005;5:1097. doi: 10.1002/pmic.200401115. [DOI] [PubMed] [Google Scholar]
- 190.Voshol H., Brendlen N., Muller D., Inverardi B., Augustin A., Pally C., Wieczorek G., Morris R.E., Raulf F., van Oostrum J. J. Proteome Res. 2005;4:1192. doi: 10.1021/pr050060+. [DOI] [PubMed] [Google Scholar]
- 191.Comunale M.A., Mattu T.S., Lowman M.A., Evans A.A., London W.T., Semmes O.J., Ward M., Drake R., Romano P.R., Steel L.F., Block T.M., Mehta A. Proteomics. 2004;4:826. doi: 10.1002/pmic.200300625. [DOI] [PubMed] [Google Scholar]
- 192.Pawlik T.M., Kuerer H.M. Int. J. Fertil. Womens Med. 2005;50:212. [PubMed] [Google Scholar]
- 193.Juan H.F., Chen J.H., Hsu W.T., Huang S.C., Chen S.T., Yi-Chung Lin J., Chang Y.W., Chiang C.Y., Wen L.L., Chan D.C., Liu Y.C., Chen Y.J. Proteomics. 2004;4:2766. doi: 10.1002/pmic.200400785. [DOI] [PubMed] [Google Scholar]
- 194.Alfonso P., Nunez A., Madoz-Gurpide J., Lombardia L., Sanchez L., Casal J.I. Proteomics. 2005;5:2602. doi: 10.1002/pmic.200401196. [DOI] [PubMed] [Google Scholar]
- 195.Alban A., David S.O., Bjorkesten L., Andersson C., Sloge E., Lewis S., Currie I. Proteomics. 2003;3:36. doi: 10.1002/pmic.200390006. [DOI] [PubMed] [Google Scholar]
- 196.Van den Bergh G., Arckens L. Curr. Opin. Biotechnol. 2004;15:38. doi: 10.1016/j.copbio.2003.12.001. [DOI] [PubMed] [Google Scholar]
- 197.Zhou G., Li H., DeCamp D., Chen S., Shu H., Gong Y., Flaig M., Gillespie J.W., Hu N., Taylor P.R., Emmert-Buck M.R., Liotta L.A., Petricoin E.F., 3rd, Zhao Y. Mol. Cell. Proteomics. 2002;1:117. doi: 10.1074/mcp.m100015-mcp200. [DOI] [PubMed] [Google Scholar]
- 198.Huang H.L., Stasyk T., Morandell S., Dieplinger H., Falkensammer G., Griesmacher A., Mogg M., Schreiber M., Feuerstein I., Huck C.W., Stecher G., Bonn G.K., Huber L.A. Electrophoresis. 2006;27:1641. doi: 10.1002/elps.200500857. [DOI] [PubMed] [Google Scholar]
- 199.Reif O.W., Lausch R., Scheper T., Freitag R. Anal. Chem. 1994;66:4027. doi: 10.1021/ac00094a027. [DOI] [PubMed] [Google Scholar]
- 200.Fliser D., Wittke S., Mischak H. Electrophoresis. 2005;26:2708. doi: 10.1002/elps.200500187. [DOI] [PubMed] [Google Scholar]
- 201.Servais A.C., Crommen J., Fillet M. Electrophoresis. 2006;27:2616. doi: 10.1002/elps.200500934. [DOI] [PubMed] [Google Scholar]
- 202.Weissinger E.M., Hertenstein B., Mischak H., Ganser A. Expert Rev. Proteomics. 2005;2:639. doi: 10.1586/14789450.2.5.639. [DOI] [PubMed] [Google Scholar]
- 203.Sassi A.P., Andel F., 3rd, Bitter H.M., Brown M.P., Chapman R.G., Espiritu J., Greenquist A.C., Guyon I., Horchi-Alegre M., Stults K.L., Wainright A., Heller J.C., Stults J.T. Electrophoresis. 2005;26:1500. doi: 10.1002/elps.200410127. [DOI] [PubMed] [Google Scholar]
- 204.Kolch W., Neususs C., Pelzing M., Mischak H. Mass Spectrom. Rev. 2005;24:959. doi: 10.1002/mas.20051. [DOI] [PubMed] [Google Scholar]
- 205.Radulovic D., Jelveh S., Ryu S., Hamilton T.G., Foss E., Mao Y., Emili A. Mol. Cell. Proteomics. 2004;3:984. doi: 10.1074/mcp.M400061-MCP200. [DOI] [PubMed] [Google Scholar]
- 206.Hood B.L., Zhou M., Chan K.C., Lucas D.A., Kim G.J., Issaq H.J., Veenstra T.D., Conrads T.P. J. Proteome Res. 2005;4:1561. doi: 10.1021/pr050107r. [DOI] [PubMed] [Google Scholar]
- 207.Pieper R., Gatlin C.L., Makusky A.J., Russo P.S., Schatz C.R., Miller S.S., Su Q., McGrath A.M., Estock M.A., Parmar P.P., Zhao M., Huang S.T., Zhou J., Wang F., Esquer-Blasco R., Anderson N.L., Taylor J., Steiner S. Proteomics. 2003;3:1345. doi: 10.1002/pmic.200300449. [DOI] [PubMed] [Google Scholar]
- 208.Qian W.J., Jacobs J.M., Camp D.G., 2nd, Monroe M.E., Moore R.J., Gritsenko M.A., Calvano S.E., Lowry S.F., Xiao W., Moldawer L.L., Davis R.W., Tompkins R.G., Smith R.D. Proteomics. 2005;5:572. doi: 10.1002/pmic.200400942. [DOI] [PMC free article] [PubMed] [Google Scholar]
- 209.Sheng S., Chen D., Van Eyk J.E. Mol. Cell. Proteomics. 2006;5:26. doi: 10.1074/mcp.T500019-MCP200. [DOI] [PubMed] [Google Scholar]
- 210.Young M.M., Tang N., Hempel J.C., Oshiro C.M., Taylor E.W., Kuntz I.D., Gibson B.W., Dollinger G. Proc. Natl. Acad. Sci. USA. 2000;97:5802. doi: 10.1073/pnas.090099097. [DOI] [PMC free article] [PubMed] [Google Scholar]