

Abstract
Background
Health-care workers are concerned about the risk of acquiring contagious diseases such as severe acute respiratory syndrome and avian influenza after recent outbreaks. We studied exhaled air and particle dispersion through an oronasal mask attached to a human-patient simulator (HPS) during noninvasive positive-pressure ventilation (NPPV).
Methods
Airflow was marked with intrapulmonary smoke for visualization. Therapy with inspiratory positive airway pressure (IPAP) was started at 10 cm H2O and gradually increased to 18 cm H2O, whereas expiratory positive airway pressure was maintained at 4 cm H2O. A leakage jet plume was revealed by a laser light sheet and images captured by video. Smoke concentration in the plume was estimated from the light scattered by smoke particles.
Findings
A jet plume of air leaked through the mask exhaust holes to a radial distance of 0.25 m from the mask during the application of IPAP at 10 cm H2O with some leakage from the nasal bridge. The leakage plume exposure probability was highest about 60 to 80 mm lateral to the median sagittal plane of the HPS. Without nasal bridge leakage, the jet plume from the exhaust holes increased to a 0.40-m radius from the mask, whereas exposure probability was highest about 0.28 m above the patient. When IPAP was increased to 18 cm H2O, the vertical plume extended to 0.45 m above the patient with some horizontal spreading along the ward ceiling.
Conclusion
Substantial exposure to exhaled air occurs within a 0.5-m radius of patients receiving NPPV. Medical wards should be designed with an architectural aerodynamics approach and knowledge of air/particle dispersion from common mechanical ventilatory techniques.
Keywords: air and particle dispersion, influenza, noninvasive positive-pressure ventilation
Abbreviations
- CAP
community-acquired pneumonia
- EPAP
expiratory positive airway pressure
- HCW
health-care worker
- HPS
human-patient simulator
- IPAP
inspiratory positive airway pressure
- NPPV
noninvasive positive-pressure ventilation
- SARS
severe acute respiratory syndrome
- VPAP
variable positive airway pressure
Noninvasive positive-pressure ventilation (NPPV) has become an established method in the treatment of various causes of respiratory failure.1 A commonly used method of providing NPPV utilizes an orofacial mask and a single-arm delivery circuit driven by a high-gas flow-generating ventilator. This system requires a method to discharge excess gas flow and pressure to the environment through a bleeding port.2
NPPV is effective in the treatment of patients with respiratory failure due to COPD and acute cardiogenic pulmonary edema, and of immunocompromised patients with pneumonia.1 Anecdotal reports have indicated that NPPV applied via a single circuit was effective in treating patients with respiratory failure due to severe acute respiratory syndrome (SARS), and might reduce the need for intubation.3, 4, 5 An influenza pandemic will place extra demand on mechanical ventilatory support, and the safe use of NPPV would greatly enhance potential therapeutic options. However, deliberate gas leakage via exhalation ports may disperse infectious particles to the environment.
Viral pneumonia is potentially infectious to health-care workers (HCWs) and other patients. The outbreak several years ago of the SARS virus with high infectivity,6, 7 and its potential to spread by airborne transmission8, 9, 10, 11 highlighted the risk of viral pneumonia. The reemergence of avian H5N1 infection with a high rate of respiratory failure in humans since 2004 in Asia has highlighted the potential need for providing mechanical ventilation in environments that are safe for HCWs.12, 13 The US pandemic influenza plan14 has recommended airborne precautions for HCWs when managing pandemic influenza with increased transmissibility and during procedures that may generate small aerosol particles of respiratory secretions.
It is not known how exhaled air and particles may disperse during NPPV in clinical settings because there is no reliable marker that can be safely introduced to the patients. We therefore assessed the risks of single-circuit NPPV in spreading infectious particles through the bleeding port and the orofacial mask interface using a high-fidelity human patient simulator (HPS). Knowledge about the extent and direction of mask leakage is essential in preparation for an influenza pandemic to reduce the risk of nosocomial transmission during the application of NPPV to high-risk patients.
MATERIALS AND METHODS
The study was undertaken by a multidisciplinary team of investigators consisting of physicians, intensivists, anesthetists, architects, and an aeronautical engineer. The study was conducted in a quiet laboratory room, which measured 7.1 × 8.5 m with a height of 2.7 m. The room ventilation was temporarily suspended during the experiment to avoid potentially confounding environmental factors.
NPPV and the Lung Model
We studied the mask interface leakage and deliberate leakage from the exhaust holes of an oronasal mask (Ultra Mirage Medium; ResMed; North Ryde, NSW, Australia) firmly attached to a high-fidelity HPS (HPS 6.1; Medical Education Technologies Inc; Sarasota, FL) [Figure 1 ]. The HPS is a realistic representation of human respiration. It contains a realistic airway and a lung model that undergoes gas exchange (ie, it removes oxygen and adds carbon dioxide to the system). The lung compliance and airway resistance also respond in a realistic manner to relevant challenges. In addition, the HPS produces an airflow pattern that is close to the in vivo human situation and has been applied in previous studies15, 16, 17, 18, 19 to simulate human respiration.
Figure 1.
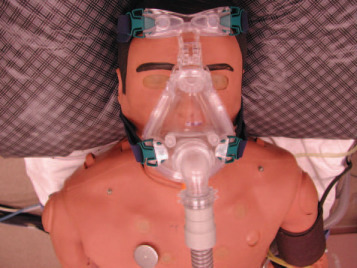
NPPV applied via an oronasal mask (Ultra Mirage Medium; ResMed) that is firmly attached to a high-fidelity HPS. The six small exhaust holes are located on the nasal bridge of the mask. The simulator represented a 70-kg adult man sitting on a hospital bed inclined 45° and was programmed to breathe spontaneously. Lung compliance was set at 35 mL/cm H2O, and the oxygen uptake to 350 mL/min. Tidal volume and respiratory rate were regulated so that a respiratory exchange ratio of 0.8 was maintained during measurements. Typically, this was achieved with a tidal volume of 500 mL at a rate of 14 breaths/min. These conditions represent a patient with mild lung injury.
NPPV was applied using a bilevel positive airway pressure device (VPAP III ST; ResMed) via the oronasal mask. The inspiratory positive airway pressure (IPAP) was initially set at 10 cm H2O, and gradually increased to 18 cm H2O. The expiratory positive airway pressure (EPAP) was maintained at 4 cm H2O throughout this study.
Flow Visualization
The visualization of airflow around the oronasal mask was facilitated by marking the air with smoke particles produced by an M-6000 smoke generator (model N19; DS Electronics; Tempe, AZ). The oil-based smoke particles measured < 1 μm in diameter.20 The smoke was introduced continuously to the right main bronchus of the HPS, mixed with alveolar gas, and then exhaled through the airway. Sections through the leakage jet plume were then revealed by a thin laser light sheet created by an Nd:YVO4 Q-switched, frequency-doubled laser device (OEM T20-BL 10–106Q; Spectra-Physic; Mountain View, CA), with custom cylindrical optics for two-dimensional laser light sheet generation (Figure 2 , top, A).
Figure 2.
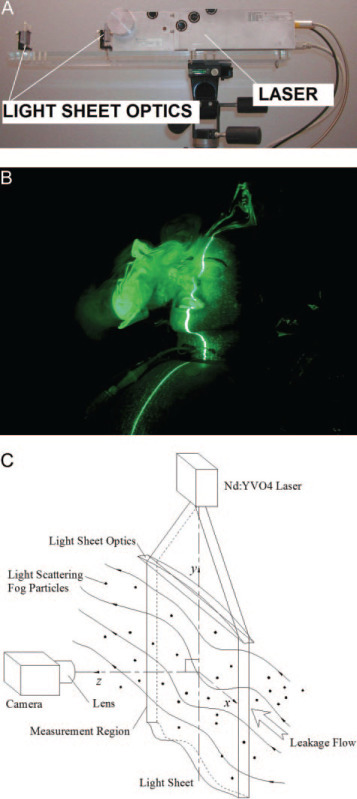
Top, A: laser and optical system for generation of a two-dimensional laser light sheet. Middle, B: Nd-YAG 527-nm laser light sheet aligned on the patient's median sagittal plane. Bottom, C: laser light sheet, particles, and perpendicular scattered light.
The experiments were recorded with a three-charge-coupled device 30-Hz DV video system with ×48 zoom (Sony; Tokyo, Japan). The laser light sheet (green, 527-nm wavelength, transverse electromagnetic mode 00) was adjusted to encompass the cross-section of the entire leakage jet plume. The light sheet was initially positioned in the median sagittal plane of the HPS and was subsequently shifted to the paramedian planes (Figure 2, middle, B). This allowed us to investigate the regions directly above and lateral to the mask and the patient.
Image Analysis
We estimated the normalized smoke concentration of the mask leakage jet plume from the light scattered by the smoke particles. This extended the laser flow visualization and provided a useful quantitative method for understanding the range and shape of the leakage jet plumes. This analysis technique was previously developed for turbulent, two-phase air-particle flows and was shown to be reliable compared to isokinetic sampling21 and particle image velocimetry.22
The laser light sheet illuminated the smoke particles in the mask airflow leakage. We assumed the intensity of the laser light sheet was constant (Figure 2, middle, B) because the mask was positioned relatively far from the optics. Scattered laser light perpendicular to the light sheet was collected and integrated by the video camera charge-coupled device element (Figure 2, bottom, C). For a small region, the number of smoke particles within the region (or the particle concentration) is proportional to the total scattered light intensity in that small region if each particle scatters an equal intensity of light. This is true when particles are monodisperse, as scattering is dependent on particle size.23 For most types of smoke, the particles are essentially monodisperse with a tight size distribution.20, 24 This analysis was based on the scattered light intensity being proportional to the particle concentration under the special conditions of constant-intensity laser light sheet illumination and monodisperse small (submicrometer) particles.
Image Capture and Frame Extraction
The motion video of several breathing cycles for a given variable positive airway pressure (VPAP) setting was captured by a computer, and individual frames were extracted as gray-scale bitmap images for intensity analysis. Frames were extracted at times corresponding to the beginning of the HPS breath inhalation and the VPAP maximum pressure to generate an ensemble average for the corresponding instant of the respiratory cycle.
Intensity Averaging and Concentration Normalization
All gray-scale frames were read into a program that was specifically developed for this study (MathCad 8.0 2000; MathSoft Inc; Cambridge, MA)25 along with background intensity images that were obtained with the laser switched off. The background intensity was subtracted from each frame, pixel by pixel, to remove any stray background light, and the pixel intensity values were averaged over all frames to determine the ensemble-averaged intensity. The resulting image showed the total intensity of light scattered perpendicular to the light sheet by the smoke particles, which was directly proportional to the particle concentration. The image was normalized against the highest intensity found within the leakage jet plume to generate normalized particle concentration contours.
As smoke particles marked air that originated from the airways of the HPS before leaking from the mask, the concentration contours effectively represent the probability of encountering air around the patient that has come from within the mask and/or the patient's respiratory system. The probability contours are made up of data collected from 10 breaths. We assigned a contour value of 1 to indicate a region that consisted of the entire amount of air leaked after exhalation by the patient, where there is a 100% chance of exposure to the exhaled air. A value near 0 indicates no measurable air leakage in the region and a negligible chance of exposure.
Magnification Factor and Image Distortion Correction
The final analysis step scaled the contour image to the dimensions of the measurement region (Figure 2, bottom, C) and corrected the optical distortions introduced by the camera and lens. Scaling and image distortion correction mapped the image in pixel coordinates back into the actual measurement region coordinates (in millimeters). Nonlinear mapping functions were determined by experimentally “testing” the camera and lens system. An accurate target grid placed in the measurement region was imaged, and image coordinates were compared to those on the grid to calculate third-order polynomial mapping functions using a least-squares method.26, 27 Previous work by Hall21 has shown this approach to be reliable, with a variance on probability contours not exceeding 5%, but often at < 3%. The maximum error on the x-y position from image distortion correction was ± 4 mm for this study.
RESULTS
The results are presented predominantly with reference to the median sagittal plane, whereas the data taken from the paramedian planes are otherwise specified.
IPAP 10 cm H2O and EPAP 4 cm H2O With Leakage Around the Nasal Bridge
The first scenario was conducted with the VPAP machine set at an IPAP of 10 cm H2O and an EPAP of 4 cm H2O. The probability contours of the air leakage distribution around the patient and mask in the median sagittal plane are shown in Figure 3 , top, A. The vertical leakage plume jet from the mask exhaust holes was evident, along with a smaller leakage plume from the nasal bridge. The leakage plume from the six exhaust holes (each with a diameter of approximately 1.8 mm) was narrow and propagated well above the patient. Inclining the HPS to a 45° position oriented the exhaust holes such that the jet became almost vertical, potentially creating a maximum spread of particles.
Figure 3.
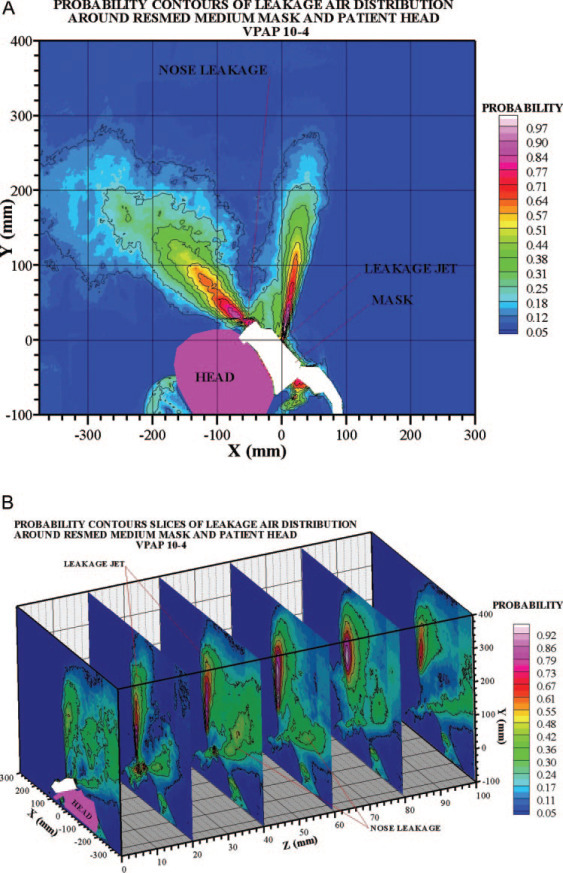
Top, A: IPAP 10 cm H2O/EPAP 4 cm H2O with leakage from the nasal bridge (sagittal plane). In general, there would be a < 10% probability of exposure if the HCW was standing outside the light blue contour regions. Similarly, if the HCW was standing outside a radial distance of approximately 0.25 m from the mask, there would be < 10% chance of exposure to exhaled air. Bottom, B: sagittal plane and paramedian planes parallel to the sagittal plane. This panel shows that the laterally directed exhaust holes create jet plumes that tend to “reinforce” each other about 60 to 80 mm laterally from the mask. This shows that the highest probability of encountering the patient's exhaled air is not directly above the mask in the sagittal plane, but to the “side,” where an HCW may typically stand.
The leakage plume from the nasal bridge was broader than that from the exhaust holes, indicating that the nasal bridge leakage was occurring through a gap that was actually greater in area than the mask exhaust holes. The nasal bridge plume was directed above the patient's head toward the head of the bed at about 45° to the horizontal.
We have identified several zones of safety with less than a given probability of the HCW being exposed to the patient's exhaled air (Figure 3, top, A). Figure 3, bottom, B, shows the leakage jet plume from the right side of the mask, where the particles were illuminated along the median sagittal plane and five other paramedian planes. The median sagittal plane is located at Z = 0, where the patient's head is shown (purple). The plume of the mask exhaust holes was directed vertically upward, and there was some leakage from around the nasal bridge. The leakage jet plume was actually most extensive about 60 to 80 mm lateral to the median sagittal plane. This is attributable to the fact that the six deliberate exhaust holes on the mask were positioned lateral to the median sagittal plane (Figure 1).
IPAP 10 cm H2O and EPAP 4 cm H2O With the Oronasal Mask Perfectly Sealed
After tightening the mask-strap on the HPS, air leakage from the nasal bridge was eliminated (Figure 4 ). Again, the leakage jet plume from the mask exhaust holes was near vertical, but it had risen by 0.15 m because there was no longer a pressure drop from nasal bridge leakage. The plume was widened and pronounced at a distance between 0.1 and 0.4 m above the mask, but the jet directly from the exhaust holes was not strongly indicated. This is because the mask exhaust holes are not aligned on the sagittal plane. As the laser light sheet was focused on the sagittal plane, it did not detect the jet plume until it widened sufficiently to enter the light sheet, some distance above the mask. Based on both panels of Figure 4, we can identify the zones of safety for the probability of exposure to the patient's exhaled air in this scenario.
Figure 4.
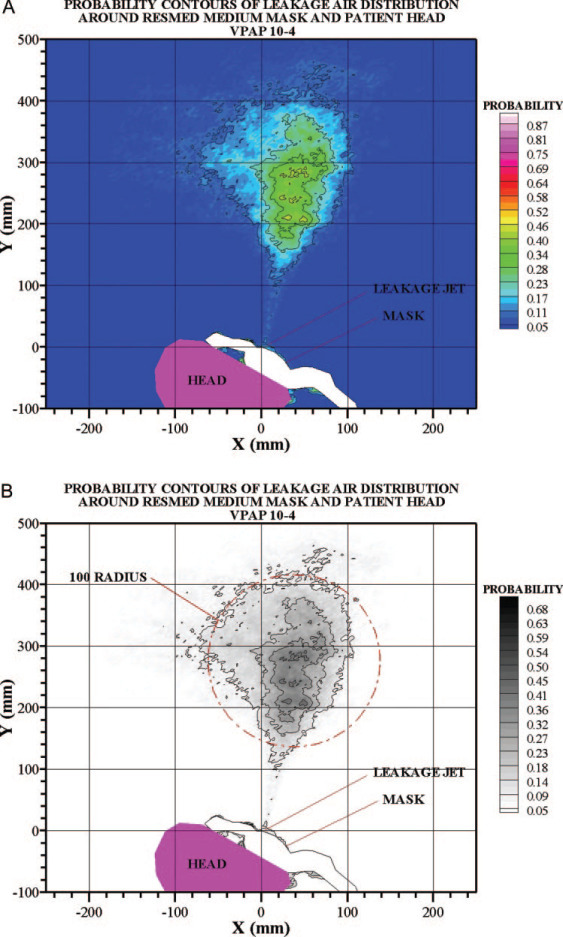
Top, A: IPAP 10 cm H2O/EPAP 4 cm H2O without leakage from the nasal bridge (sagittal plane). There would be < 10% probability of exposure if the HCW was standing outside the light-blue contour regions. Similarly, if the HCW was standing outside a radial distance of approximately 0.4 m from the mask itself, he would have a < 10% chance of exposure. Bottom, B: IPAP 10 cm H2O/EPAP 4 cm H2O without leakage from the nasal bridge (sagittal plane). A circle of radius 100 mm substantially encompasses the leakage plume, so there is generally a < 10% probability of exposure outside of this circle.
IPAP Values of 14 and 18 cm H2O With the Oronasal Mask Perfectly Sealed
The vertical plume extended 0.42 and 0.45 m, respectively, above the patient and the mask during the application of IPAP at 14 cm H2O (Figure 5 , top, A) and 18 cm H2O (Figure 5, bottom, B). Interestingly, there was a distinct horizontal spreading of the body of the jet plume in both IPAP settings, but this was more obvious at approximately 0.5 m above the mask in the high-pressure scenario (Figure 5, bottom, B). As the ward ceiling was approximately 1.8 m above the mask, it is probable that the roof boundary influenced the airflow, spreading the jet plume sideways.
Figure 5.
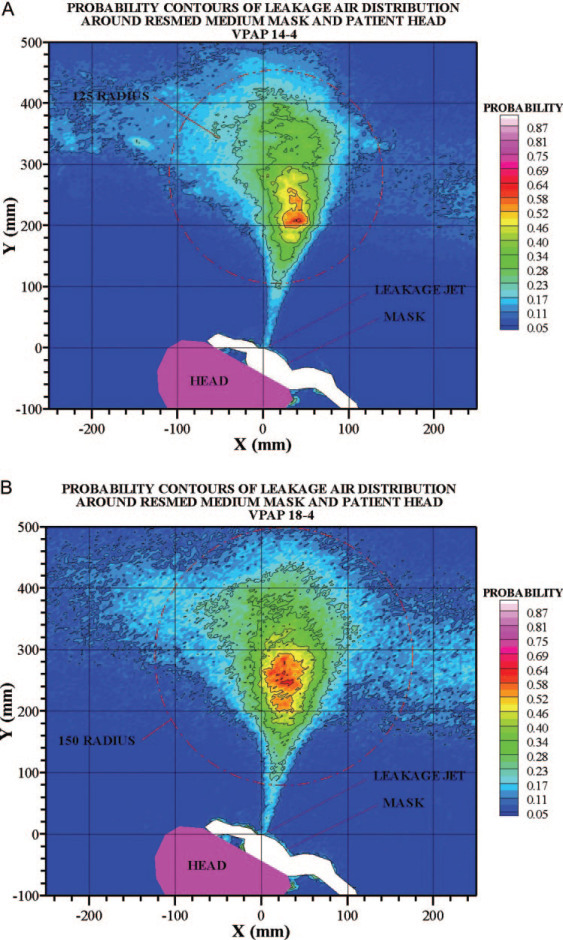
Top, A: IPAP 14 cm H2O/EPAP 4 cm H2O without leakage from the nasal bridge (sagittal plane). A circle of radius 125 mm, centered at approximately 300 mm on the y-axis, substantially encompasses the leakage plume, so there is generally a < 10% probability of exposure outside this circle. Bottom, B: IPAP 18 cm H2O/EPAP 4 cm H2O without leakage from the nasal bridge (sagittal plane). A circle of radius 150 mm, centered at approximately 300 mm on the y-axis, substantially encompasses the leakage plume, so there is generally a < 10% probability of exposure outside this circle.
A profile horizontally across the contours at approximately 300 mm above the mask is shown in Figure 6 , showing the profile of concentration probability for each of the three IPAP settings. The probability is greatest above the mask for the higher pressure IPAP of 18 cm H2O.
Figure 6.
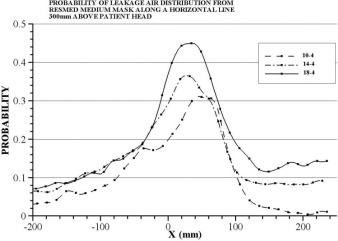
The profile of concentration probability along a line 300 mm above the mask (y = 0 mm on contours and x is the horizontal coordinate, exactly as in the contour plots) is plotted for each of the three IPAP settings (ie, 10, 14, and 18 cm H2O), whereas EPAP was maintained at 4 cm H2O. The variation in the shapes represented a turbulent jet flow, which was highly variable.
DISCUSSION
This study shows that air marked with smoke particles can be emitted through deliberate mask leakage to a radial distance of approximately 0.25 m from an oronasal mask during the application of IPAP at 10 cm H2O and EPAP at 4 cm H2O. The leakage jet plume was most significant at approximately 60 to 80 mm lateral to the median sagittal plane. Despite what initially appeared to be a reasonably well-fitted mask, there was still leakage detected at the nasal bridge. With the elimination of this nasal bridge leakage, the jet plume radial distance from the mask increased to 0.4 m, whereas exposure probability was highest at approximately 0.28 m above the patient and the mask. When IPAP was increased to 14 cm H2O and then to 18 cm H2O, the vertical plume extended to 0.42 and 0.45 m, respectively, above the patient and the mask, with some horizontal spreading along the ceiling. These findings have important clinical implications for HCWs, who often nurse their patients at a close distance, especially during NPPV support for respiratory failure at a stage when the viral loads of the patients may reach peak levels. Our study emphasizes the importance of medical ward design in terms of a ventilated, aerodynamic space and the need for an “architectural aerodynamics” approach in order to minimize the risk of nosocomial infection. Air-conditioning or extraction systems will need to target the circular region that is above the mask rather than at the actual mask level.
It is controversial whether patients with respiratory failure due to severe community-acquired pneumonia (CAP) would benefit from NPPV. NPPV lowered the intubation rate, the length of stay in the ICU, and the 2-month mortality rate in patients with severe CAP, but these beneficial actions were confined to those patients with underlying COPD.28 In a prospective observational study29 that excluded patients with underlying COPD, NPPV improved oxygenation and respiratory rate in 22 of the 24 patients with CAP during the initial trial, but 16 patients subsequently needed intubation after an average time of 1.3 days, mainly because of worsening respiratory failure.
During the global outbreak of SARS, ARDS developed in 13 to 26% of patients, necessitating invasive ventilatory support at a time when a very high viral load was being reached; thus, HCWs were particularly prone to infection while caring for their patients.6, 30, 31, 32 The relative risk of developing SARS was 13-fold for HCWs who were involved in intubating SARS patients compared to those who were not, whereas NPPV was not associated with a statistically significant risk for the HCWs.7 This was probably because tracheal suctioning was not generally performed for patients who were receiving ventilation with NPPV.7 However, a retrospective study by Xiao et al33 described NPPV exposure as being associated with clinical SARS infection in two HCWs.
Due to the fear of leakage from the mask interface with subsequent nosocomial transmission of SARS, the usage of NPPV was low. Nevertheless, individual reports3, 4, 5 have shown that single-circuit NPPV might provide life-saving treatment for patients who were in respiratory failure as a result of the infection. Treatment with NPPV was applied via oronasal masks to 20 SARS patients without COPD in whom severe hypoxemic respiratory failure developed in a hospital ward environment with efficient room air exchange, stringent infection control measures, full personal protective equipment, and the addition of a viral-bacterial filter to the exhalation port of the NPPV device.5 Endotracheal intubation was avoided in 14 patients (70%) who had a much shorter ICU LOS than those who were intubated. Clinical evidence of SARS did not develop in any of the 105 HCWs involved in the management of the 20 patients, whereas 102 HCWs (97%) had negative SARS serology findings.5 As there were still three HCWs who had refused to undergo blood testing, one cannot entirely eliminate the possibility of subclinical SARS infection related to use of NPPV, although it seemed highly unlikely.30 Subclinical SARS infection did occur in other HCWs who cared for SARS patients.34, 35
The reemergence of avian influenza H5N1 in humans in Asia and the recent spread to the Middle East is of grave concern.12, 13, 36, 37 The infectivity potential for human-to-human transmission may increase with time after the mutation or genetic reassortment of viruses.38 Most of the human patients with H5N1 infection have presented with severe pneumonia complicated by ARDS and multiorgan dysfunction syndrome, and have a high mortality rate.12, 13, 36, 37 The evidence for the use of NPPV as ventilatory support for patients with ARDS is weak, especially in the presence of multiorgan dysfunction syndrome and the lack of data from a controlled trial.39, 40 However, treatment with NPPV may play a role in reducing the need for endotracheal intubation among those patients with acute lung injury in an influenza pandemic, if it is applied with caution.
NPPV should be applied in patients with severe viral pneumonia only if there is adequate protection for HCWs because of the potential risk of viral transmission via deliberate or accidental mask interface leakage and flow compensation causing the dispersion of a contaminated aerosol.30 In patients with chronic respiratory failure who are receiving NPPV via nasal masks, air leakage through the mouth or other routes besides the exhalation valve can occur.2 In clinical practice, pressure necrosis often develops at the skin around the nasal bridge if the mask is applied tightly for a prolonged period of time. Many patients loosen the mask strap to relieve discomfort, and air leakage from the nasal bridge is definitely a potential source for the transmission of viral infections. Careful mask fitting is important for the successful and safe application of NPPV. The addition of a viral-bacterial filter to the NPPV breathing system between the mask and the exhalation port3, 5 or the use of a dual-circuit NPPV device may reduce the risk of the nosocomial transmission of viral infection. However, the use of viral-bacterial filters was difficult due to blockage by moist secretions and could be applied only in some cases.3, 5 In view of our observation that higher ventilator pressures result in a wider dispersion of exhaled air and a higher concentration of air leakage, we recommend starting NPPV with low IPAP level (ie, 8 to 10 cm H2O) and gradually increasing the level as necessary, instead of starting high and titrating downward if the patient is intolerant.41
There are several limitations to this study. First, smoke particles were used as markers for exhaled air, but they might not fully reflect the risk of droplet transmission. Our results indicate the spatial extent of the airflow leakage jet plumes but do not directly indicate the behavior of potentially infected droplets themselves. It is known that droplets generated by coughing, sneezing, talking, and breathing range from 0.5 to 12 μm in diameter42, 43 with a density similar to that of water. As these droplets are generally much larger than smoke particles (ie, they have a higher Stokes number), they will not follow the jet plume airflow perfectly but will slip relative to air streamlines under the influence of Stokes drag and gravitational forces. Stokes drag carries droplets with the airflow of the jet plume, but inertia causes droplets to lag behind the airflow and fall short of the full extent of the air jet plume. Conversely, gravitational force causes droplets to follow trajectories that are vertically below the air jet plume. We would therefore expect droplets to extend somewhat vertically below the contours given here but less than the contours given in directions vertically above and to the sides of the jet plume. The contours and safe distances suggested here are likely the “upper-bound” conservative estimates for droplet spread above and to the sides of the mask. Using the laser visualization method, we have shown that during the delivery of oxygen at a rate of 4 L/min via a Hudson mask to the HPS, the exhaled air at the peak of simulated exhalation could reach a distance of approximately 0.40 m.44 Last, we tested only one type of NPPV machine and one oronasal mask without supplemental oxygen, and did not test a nasal mask due to limited resources. Nevertheless, oronasal masks are generally preferred in the application of NPPV for acute respiratory failure as nasal masks are poorly tolerated in the acute setting due to mouth breathing.45 Further studies are needed to assess the safety of different respiratory therapies such as the addition of viral filters in the circuit, the use of supplemental oxygen, the use of a humidifier, and the use of different ward airflow settings, and to determine how the medical ward environment should be designed to protect HCWs from acquiring nosocomial pneumonia.
In conclusion, substantial exposure to exhaled air is likely to occur within 0.5 m from patients receiving NPPV. Higher ventilator pressures result in a wider distribution of exhaled air. HCWs should be aware of the potential risks of viral transmission during NPPV, and should take stringent contact and droplet precaution plus wear full personal protective equipment.
Footnotes
Reproduction of this article is prohibited without written permission from the American College of Chest Physicians (www.chestjournal.org/misc/reprints.shtml).
This research was supported by the Research Fund for the Control of Infectious Diseases (Health, Welfare and Food Bureau, Hong Kong Special Administrative Region).
The authors have reported to the ACCP that no significant conflicts of interest exist with any companies/organizations whose products or services may be discussed in this article.
REFERENCES
- 1.Mehta S, Hill NS. Noninvasive ventilation. Am J Respir Crit Care Med. 2001;163:540–577. doi: 10.1164/ajrccm.163.2.9906116. [DOI] [PubMed] [Google Scholar]
- 2.Hill NS, Carlisle C, Kramer NR. Effect of a nonrebreathing exhalation valve on long-term nasal ventilation using a bilevel device. Chest. 2002;122:84–91. doi: 10.1378/chest.122.1.84. [DOI] [PubMed] [Google Scholar]
- 3.Han F, Jiang YY, Zheng JH. Noninvasive positive pressure ventilation treatment for acute respiratory failure in SARS. Sleep Breath. 2004;8:97–106. doi: 10.1007/s11325-004-0097-0. [DOI] [PMC free article] [PubMed] [Google Scholar]
- 4.So LK, Lau AC, Yam LY. Development of a standard treatment protocol for severe acute respiratory syndrome. Lancet. 2003;361:1615–1617. doi: 10.1016/S0140-6736(03)13265-5. [DOI] [PMC free article] [PubMed] [Google Scholar]
- 5.Cheung TM, Yam LY, So LK. Effectiveness of noninvasive positive pressure ventilation in the treatment of acute respiratory failure in severe acute respiratory syndrome. Chest. 2004;126:845–850. doi: 10.1378/chest.126.3.845. [DOI] [PMC free article] [PubMed] [Google Scholar]
- 6.Lee N, Hui DS, Wu A. A major outbreak of severe acute respiratory syndrome in Hong Kong. N Engl J Med. 2003;348:1986–1994. doi: 10.1056/NEJMoa030685. [DOI] [PubMed] [Google Scholar]
- 7.Fowler RA, Guest CB, Lapinsky SE. Transmission of severe acute respiratory syndrome during intubation and mechanical ventilation. Am J Respir Crit Care Med. 2004;169:1198–1202. doi: 10.1164/rccm.200305-715OC. [DOI] [PubMed] [Google Scholar]
- 8.Yu IT, Li Y, Wong TW. Evidence of airborne transmission of the severe acute respiratory syndrome virus. N Engl J Med. 2004;350:1731–1739. doi: 10.1056/NEJMoa032867. [DOI] [PubMed] [Google Scholar]
- 9.Booth TF, Kournikakis B, Bastien N. Detection of airborne severe acute respiratory syndrome (SARS) coronavirus and environmental contamination in SARS outbreak units. J Infect Dis. 2005;191:1472–1477. doi: 10.1086/429634. [DOI] [PMC free article] [PubMed] [Google Scholar]
- 10.Chu CM, Cheng VC, Hung IF. Viral load distribution in SARS outbreak. Emerg Infect Dis. 2005;11:1882–1886. doi: 10.3201/eid1112.040949. [DOI] [PMC free article] [PubMed] [Google Scholar]
- 11.Yu IT, Wong TW, Chiu YL. Temporal-spatial analysis of severe acute respiratory syndrome among hospital inpatients. Clin Infect Dis. 2005;40:1237–1243. doi: 10.1086/428735. [DOI] [PMC free article] [PubMed] [Google Scholar]
- 12.Tran TH, Nguyen TL, Nguyen TD. World Health Organization International Avian Influenza Investigative Team: avian influenza A (H5N1) in 10 patients in Vietnam. N Engl J Med. 2004;350:1179–1188. doi: 10.1056/NEJMoa040419. [DOI] [PubMed] [Google Scholar]
- 13.Chotpitayasunondh T, Ungchusak K, Hanshaoworakul W. Human disease from influenza A (H5N1), Thailand, 2004. Emerg Infect Dis. 2005;11:201–209. doi: 10.3201/eid1102.041061. [DOI] [PMC free article] [PubMed] [Google Scholar]
- 14.US Department of Health and Human Services. Pandemic influenza plan Nov 2005 http://www.hhs.gov/pandemicflu/plan/ Available at: Accessed March 28, 2006.
- 15.Good ML. Patient simulation for training basic and advanced clinical skills. Med Educ. 2003;37:14–21. doi: 10.1046/j.1365-2923.37.s1.6.x. [DOI] [PubMed] [Google Scholar]
- 16.Meka VV, van Oostrom JH. Bellows-less lung system for the human patient simulator. Med Biol Eng Comput. 2004;42:413–418. doi: 10.1007/BF02344718. [DOI] [PubMed] [Google Scholar]
- 17.So CY, Gomersall CD, Chui PT. Performance of an oxygen delivery device for weaning potentially infectious critically ill patients. Anaesthesia. 2004;59:710–714. doi: 10.1111/j.1365-2044.2004.03802.x. [DOI] [PubMed] [Google Scholar]
- 18.Goodwin JA, van Meurs WL, Sa Couto CD. A model for educational simulation of infant cardiovascular physiology. Anesth Analg. 2004;99:1655–1664. doi: 10.1213/01.ANE.0000134797.52793.AF. [DOI] [PubMed] [Google Scholar]
- 19.Lampotang S, Lizdas DE, Gravenstein N. An audible indication of exhalation increases delivered tidal volume during bag valve mask ventilation of a patient simulator. Anesth Analg. 2006;102:168–171. doi: 10.1213/01.ANE.0000181833.23904.4E. [DOI] [PubMed] [Google Scholar]
- 20.Soo SL. Blaisdell Publishing Company; Toronto, ON, Canada: 1967. (Fluid dynamics of multiphase systems). [Google Scholar]
- 21.Hall SD. An investigation of the turbulent backward facing step flow with the addition of a charged particle phase and electrostatic forces. PhD dissertation. 2001 The University of New South Wales. Sydney, NSW, Australia: [Google Scholar]
- 22.Hall SD, Behnia M, Fletcher CAJ. Investigation of the secondary corner vortex in a benchmark turbulent backward-facing step using cross-correlation particle image velocimetry. Experiments Fluids. 2003;35:139–151. [Google Scholar]
- 23.Bohren CF, Huffman DR. John Wiley and Sons; New York, NY: 1983. (Absorption and scattering of light by small particles). [Google Scholar]
- 24.Langer G, Radnik JL. Development and preliminary testing of a device for electrostatic classification of submicron airborne particles. J Appl Physics. 1961;32:955–957. [Google Scholar]
- 25.MathSoft Inc. Mathcad 8.0 for windows, users guide. 2000 MathSoft Inc. Cambridge, MA: [Google Scholar]
- 26.Raffel M, Willert C, Kompenhans J. Springer-Verlag; Berlin, Germany: 1998. (Particle image velocimetry). [Google Scholar]
- 27.Huang H. Verlag Koster; Berlin, Germany: 1994. (Limitations of and improvements to PIV and its application to a backward-facing step flow). [Google Scholar]
- 28.Confalonieri M, Potena A, Carbone G. Acute respiratory failure in patients with severe community-acquired pneumonia: a prospective randomized evaluation of noninvasive ventilation. Am J Respir Crit Care Med. 1999;160:1585–1591. doi: 10.1164/ajrccm.160.5.9903015. [DOI] [PubMed] [Google Scholar]
- 29.Jolliet P, Abajo B, Pasquina P. Non-invasive pressure support ventilation in severe community-acquired pneumonia. Intensive Care Med. 2001;27:812–821. doi: 10.1007/s001340100869. [DOI] [PMC free article] [PubMed] [Google Scholar]
- 30.Hui DS, Sung JJ. Treatment of severe acute respiratory syndrome. Chest. 2004;126:670–674. doi: 10.1378/chest.126.3.670. [DOI] [PMC free article] [PubMed] [Google Scholar]
- 31.Peiris JS, Chu CM, Cheng VC. Clinical progression and viral load in a community outbreak of coronavirus-associated SARS pneumonia: a prospective study. Lancet. 2003;361:1767–1772. doi: 10.1016/S0140-6736(03)13412-5. [DOI] [PMC free article] [PubMed] [Google Scholar]
- 32.Cheng PK, Wong DA, Tong LK. Viral shedding patterns of coronavirus in patients with probable severe acute respiratory syndrome. Lancet. 2004;363:1699–1700. doi: 10.1016/S0140-6736(04)16255-7. [DOI] [PMC free article] [PubMed] [Google Scholar]
- 33.Xiao Z, Li Y, Chen RC. A retrospective study of 78 patients with severe acute respiratory syndrome. Chin Med J (Engl) 2003;116:805–810. [PubMed] [Google Scholar]
- 34.Ip M, Chan PK, Lee N. Seroprevalence of antibody to severe acute respiratory syndrome (SARS)-associated coronavirus among health care workers in SARS and non-SARS medical wards. Clin Infect Dis. 2004;38:e116–e118. doi: 10.1086/421019. [DOI] [PMC free article] [PubMed] [Google Scholar]
- 35.Wilder-Smith A, Teleman MD, Heng BH. Asymptomatic SARS coronavirus infection among healthcare workers, Singapore. Emerg Infect Dis. 2005;11:1142–1145. doi: 10.3201/eid1107.041165. [DOI] [PMC free article] [PubMed] [Google Scholar]
- 36.Beigel JH, Farrar J, Han AM. Avian influenza A (H5N1) infection in humans. N Engl J Med. 2005;353:1374–1385. doi: 10.1056/NEJMra052211. [DOI] [PubMed] [Google Scholar]
- 37.World Health Organization. Cumulative number of confirmed human cases of avian influenza A/(H5N1) reported to WHO http://www.who.int/csr/disease/avian_influenza/country/cases_table_2006_03_24/en/index.html Available at: Accessed March 28, 2006.
- 38.Li KS, Guan Y, Wang J. Genesis of a highly pathogenic and potentially pandemic H5N1 influenza virus in eastern Asia. Nature. 2004;430:209–213. doi: 10.1038/nature02746. [DOI] [PubMed] [Google Scholar]
- 39.Rocker GM, Mackenzie MG, Williams B. Noninvasive positive pressure ventilation: successful outcome in patients with acute lung injury/ARDS. Chest. 1999;115:173–177. doi: 10.1378/chest.115.1.173. [DOI] [PubMed] [Google Scholar]
- 40.Liesching T, Kwok H, Hill NS. Acute applications of noninvasive positive pressure ventilation. Chest. 2003;124:699–713. doi: 10.1378/chest.124.2.699. [DOI] [PubMed] [Google Scholar]
- 41.Meduri GU, Turner RE, Abou-Shala N. Noninvasive positive pressure ventilation via face mask: first-line intervention in patients with acute hypercapnic and hypoxemic respiratory failure. Chest. 1996;109:179–193. doi: 10.1378/chest.109.1.179. [DOI] [PubMed] [Google Scholar]
- 42.Cole EC, Cook CE. Characterization of infectious aerosols in health care facilities: an aid to effective engineering controls and preventive strategies. Am J Infect Control. 1998;26:453–464. doi: 10.1016/S0196-6553(98)70046-X. [DOI] [PMC free article] [PubMed] [Google Scholar]
- 43.Fennelly KP, Martyny JW, Fulton KE. Cough-generated aerosols of Mycobacterium tuberculosis: a new method to study infectiousness. Am J Respir Crit Care Med. 2004;169:604–609. doi: 10.1164/rccm.200308-1101OC. [DOI] [PubMed] [Google Scholar]
- 44.Hui DS, Ip M, Tang JW. Airflows around oxygen masks: a potential source of infection? Chest. 2006;130:822–826. doi: 10.1378/chest.130.3.822. [DOI] [PMC free article] [PubMed] [Google Scholar]
- 45.Kwok H, Mc Cormack J, Cece R. Controlled trial of oronasal versus nasal mask ventilation in the treatment of acute respiratory failure. Crit Care Med. 2003;31:468–473. doi: 10.1097/01.CCM.0000045563.64187.20. [DOI] [PubMed] [Google Scholar]