

Abstract
Background
Pneumonia viruses such as influenza may potentially spread by airborne transmission. We studied the dispersion of exhaled air through a simple oxygen mask applied to a human patient simulator (HPS) during the delivery of different oxygen flow in a room free of air currents.
Methods
The HPS represented a 70-kg adult male individual in a semi-sitting position on a hospital bed inclined at 45°. A simple oxygen mask was fitted to the HPS in the normal fashion. The head, neck, and internal airways of the HPS were configured to allow realistic airflow modeling in the airways and around the face. The HPS was programmed to breathe at a respiratory rate of 14 breaths/min with a tidal volume of 0.5 L. Airflow was marked with intrapulmonary smoke for visualization. A leakage jet plume was revealed by a laser light-sheet, and images were captured by high-resolution video. Smoke concentration in the exhaled plume was estimated from the total light intensity scattered by smoke particles.
Findings
A jet plume of air leaked through the side vents of the simple oxygen mask to lateral distances of 0.2, 0.22, 0.3, and 0.4 m from the sagittal plane during the delivery of oxygen at 4, 6, 8, and 10 L/min, respectively. Coughing could extend the dispersion distance beyond 0.4 m.
Conclusion
Substantial exposure to exhaled air occurs generally within 0.4 m from patients receiving supplemental oxygen via a simple mask. Health-care workers should take precautions when managing patients with community-acquired pneumonia of unknown etiology that is complicated by respiratory failure.
Key words: dispersion, exhaled air, influenza, oxygen therapy, severe acute respiratory syndrome
Abbreviations: CAP, community-acquired pneumonia; HPS, human patient simulator; NPPV, noninvasive positive-pressure ventilation; SARS, severe acute respiratory syndrome
Community -acquired pneumonia (CAP) is a common disorder with significant morbidity and mortality. Confusion, uremia, tachypnea, hypotension, and age > 65 years are some of the clinical indications for managing patients with CAP in the hospital setting.1 2 Various modalities of respiratory support are often required by patients with CAP, and these include supplemental oxygen delivered via either nasal cannula or different types of face masks, noninvasive positive-pressure ventilation (NPPV), and invasive mechanical ventilation.
There is a strong association among ventilation, air movement in buildings, and the transmission of infectious diseases such as measles, tuberculosis, chickenpox, influenza, smallpox, and severe acute respiratory syndrome (SARS).3 In patients who are hospitalized with viral pneumonia, there is a potential risk that the respiratory therapy itself may generate and disperse infective aerosols, resulting in a superspreading event. The use of a nebulizer in an overcrowded medical ward with inadequate ventilation was thought to be the cause of a major nosocomial outbreak of SARS in our hospital in 2003.4 5 6
Influenza virus A/H5N1 has become the major emerging infectious disease of global concern since late 2003. The widespread occurrence of the H5N1 avian influenza infection in poultry and birds on several continents has increased the risk of human exposure to avian influenza. Respiratory failure is the major complication in patients who are hospitalized with influenza A/H5N1 infection, and many patients progress rapidly to ARDS and multiorgan failure.7 As part of our influenza pandemic preparedness, we studied the safety of oxygen therapy by examining exhaled air dispersion from a simple oxygen mask attached to a human patient simulator (HPS) during the delivery of oxygen at different levels of flow.
Materials and Methods
This study was conducted in a quiet laboratory room that was 7.1 × 8.5 m in size with a height of 2.7 m. The room ventilation was temporarily suspended during the experiment to avoid potentially confounding environmental factors, such as ventilation air currents. The experimental design and method of data analysis have been described in detail in our previous study8 on exhaled air dispersion related to NPPV.
Simple Oxygen Mask and the Lung Model
We studied the air particle leakage from the side vents of a simple oxygen mask (HS-3031; Hsiner; Taichung Hsien, Taiwan) applied to a high-fidelity HPS (HPS 6.1; Medical Education Technologies Inc; Sarasota, FL) [Fig 1 ]. The HPS contains a realistic airway and a lung model that undergoes gas exchange (ie, it removes oxygen and adds carbon dioxide to the system). The lung compliance and airway resistance also respond in a realistic manner to relevant challenges. In addition, the HPS produces an airflow pattern that is close to the in vivo human situation and has been applied in previous studies9 10 11 12 13 to simulate human respiration. In this study, we set the lung compliance and oxygen consumption of the HPS to 35 mL/cm H2O and 350 mL/min, respectively. This represented a patient with mild lung injury.14 15 Tidal volume and respiratory rate were regulated so that a respiratory exchange ratio of 0.8 was maintained during the measurements. In this setting, the HPS breathed at a respiratory rate of 14 breaths/min with a tidal volume of 0.5 L. Oxygen flow was delivered to the HPS via the simple mask at 4 L/min initially, which was gradually increased to 6, 8, and 10 L/min during the study.
Figure 1.
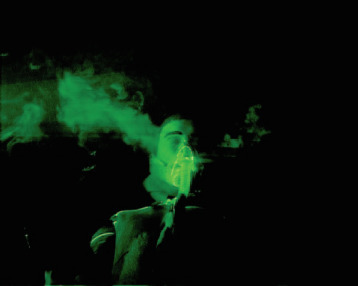
A simple oxygen mask attached to a high-fidelity HPS with a laser light-sheet on the right side. The simulator represented a 70-kg adult male sitting on a hospital bed inclined to 45° and was programmed to breathe spontaneously. The lung compliance was set as 35 mL/cm H2O, and the oxygen consumption to 350 mL/min. Tidal volume and respiratory rate were regulated so that a respiratory exchange ratio of 0.8 was maintained during measurements. Typically, this was achieved with a tidal volume of 500 mL at a rate of 14 breaths/min. These conditions represent a patient with mild lung injury.
While the HPS was breathing oxygen at 6 L/min, cough was produced by a short burst (2 s, 400 L/min) of air (marked by smoke) generated by a jet ventilator (Monsoon; Acutronic Medical Systems; Baar, Switzerland) connected to the proximal trachea. This represented cough efforts in patients with mild lung injury.16
Flow Visualization
The visualization of airflow around the simple oxygen mask was facilitated by marking air with smoke particles produced by a smoke generator (M-6000 N19; DS Electronics; Tempe, AZ).8 The oil-based smoke particles, which measured < 1 μm in diameter, are known to follow the airflow pattern precisely with negligible slip.17 The smoke was introduced continuously to the right main bronchus of the HPS. It mixed with alveolar gas and then was exhaled through the airway. Jet plume leakage in sections was then revealed using a thin laser light-sheet that was created by an Nd:YVO4 Q-switched, frequency-doubled laser (OEM T20-BL 10–106Q; Spectra Physics, Inc; Mountain View, CA) with custom-made cylindrical optics for two-dimensional laser light-sheet generation.8
The experiments were recorded with a video system (DV video system [3 charge-coupled device, ×48 zoom, 30-Hz]; Sony; Tokyo, Japan). The laser light-sheet (green, 527-nm wavelength, in TEM00 mode) was adjusted to encompass the largest cross-section of the entire leakage jet plume. The light-sheet was initially positioned in the median sagittal plane of the HPS and was subsequently shifted to the paramedian planes. This allowed us to investigate the regions directly above and lateral to the mask and the patient.8
Image Analysis
We estimated the normalized smoke concentration of the oxygen mask leakage jet plume from the light scattered by the smoke particles.8 This extended the laser flow visualization and provided a useful quantitative method for understanding the range and shape of the leakage jet plumes. This analysis technique was previously developed for turbulent two-phase, air-particle flows and was as reliable as the isokinetic sampling18 or particle image velocimetry that was used in a previous study.19
The laser light-sheet illuminated the smoke particles around the oxygen mask. We assumed that the intensity of the laser light-sheet was near constant because the oxygen mask was positioned relatively far from the light-sheet optics (ie, the point of divergence). The laser light scattered by the smoke particles was then collected and integrated by the video camera charge-coupled device elements. For a small region, the number of smoke particles within the region (or particle concentration) is proportional to the total scattered light intensity in that corresponding region. This is true as the smoke particles are monodisperse.17 20 21
Image Capture and Frame Extraction
The motion video of several breathing cycles for a given oxygen flow rate setting was captured by a computer, and individual frames were extracted as grayscale bitmap images for intensity analysis. Frames were extracted at times relative to the beginning of inspiration (at a given oxygen flow rate) to generate an ensemble average for the corresponding instant of the respiratory cycle.8 The largest spread of contours from the mask was chosen, and this was found to be at approximately the mid-point of the respiratory cycle.
Intensity Averaging and Concentration Normalization
All grayscale frames were read into a program that was specifically developed for this study (MathCad, version 8.0; Parametric Technology Corp; Needham, MA)22 along with background intensity images taken with the laser switched off. The background intensity image was subtracted from each frame, pixel by pixel to remove any stray background light, and the pixel intensity values were averaged over all frames to determine the ensemble-averaged intensity. The resulting image was the total intensity of light scattered perpendicular to the light-sheet by the smoke particles and is directly proportional to the smoke concentration. The image was normalized against the highest intensity found within the leakage jet plume to generate normalized particle concentration contours.
As the smoke particles marked air that originated from the airways of the HPS, before leaking from the mask, the concentration contours effectively represent the probability of encountering air around the patient that has come from within the mask and/or the patient's respiratory system. The probability contours are made up of data collected from 10 breaths. A contour value of 1 indicates a region that consists entirely of air leaked after exhalation by the patient; where there is a 100% chance of exposure to the exhaled air, such as at the oxygen mask side vent. A value near 0 indicates no measurable air leakage in the region and a small chance of exposure to exhaled air.8
Magnification Factor and Image Distortion Correction
The final analysis step scaled the contour image to the dimensions of the measurement region and corrected any optical distortions introduced by the camera and lens. Scaling and image distortion correction mapped the image in pixel coordinates back into the actual measurement region coordinates (in millimeters). Nonlinear mapping functions were determined by experimentally “testing” the camera and lens system. An accurate target grid placed in the measurement region was imaged, and the image coordinates were compared to those on the grid to calculate third-order polynomial mapping functions using a least squares method.23 24 Previous work by Hall18 has shown this approach to be reliable, with a variance on contours not exceeding 5%, but often < 3%. The maximum error on the x-y position from image distortion correction was ± 4 mm for this study. The study received nonionizing radiation and biological/chemical safety approval by the Chinese University of Hong Kong.
Results
The results of air particle dispersion distances are presented with reference to the median sagittal plane.
Oxygen Flow at 4 L/min
The first scenario was conducted with the oxygen flow delivered at 4 L/min. Probability contours of air leakage distribution around the patient and oxygen mask in the median sagittal plane are shown in Figure 2 , top left, A. The 20% probability contour line (green/blue contour boundary) was taken as an arbitrary boundary that was representative of the exhaled air plume, and all distances were estimated to be outside of this boundary. Outside this boundary, the probability of exposure to the patient's exhaled air was < 20%. The leakage plume from the side vent of the simple mask was noted to a distance of 0.2 m lateral to the median sagittal plane for contours of > 20%.
Figure 2.
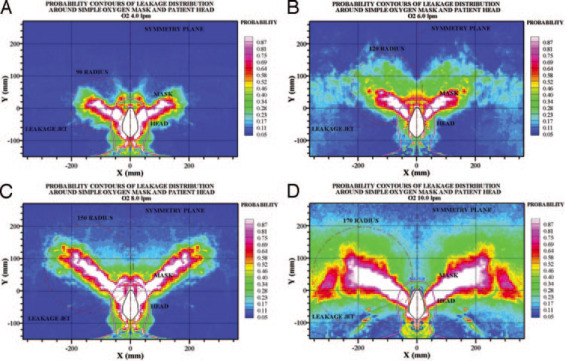
Top left, A: oxygen was delivered at 4 L/min to the HPS. Within dispersal distances of 0.2 and 0.16 m from the mask, the corresponding chances of exposure to the patient's exhaled air are significantly > 20% and > 60%, respectively. Top right, B: oxygen was delivered at 6 L/min to the HPS. Within dispersal distances of 0.22 and 0.17 m from the mask, the corresponding chances of exposure to the patient's exhaled air are significantly > 20% and > 60%, respectively. Bottom left, C: oxygen was delivered at 8 L/min to the HPS. Within dispersal distances of 0.3 and 0.25 m from the mask, the corresponding chances of exposure to the patient's exhaled air are significantly > 20% and > 60%, respectively. Bottom right, D: oxygen was delivered at 10 L/min to the HPS. Within dispersal distances of 0.4 and 0.35 m from the mask, the corresponding chances of exposure to the patient's exhaled air are significantly > 20% and > 60%, respectively.
Oxygen Flow at 6 to 10 L/min
Probability contours of air leakage distribution around the HPS and oxygen mask in the median sagittal plane when oxygen was delivered at 6, 8, and 10 L/min are shown in Figure 2, top right, B, to bottom right, D. The leakage plume through the side vent of the simple mask, for contours of > 20%, was noted at a distance of 0.22, 0.3, and 0.4 m from the median sagittal plane when oxygen was delivered at higher flows of 6, 8, and 10 L/min respectively.
The relationships between different oxygen flows and the resultant leakage plume distances are shown in Figure 3 . Although the data are not correlated in a linear fashion, it is obvious that the higher the oxygen flow, the higher the leakage distances.
Figure 3.
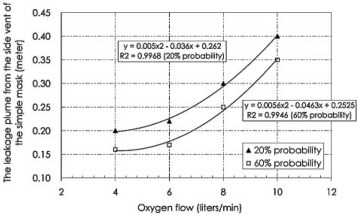
The relationship between exhaled air distances (vertical axis) and oxygen flow (horizontal axis) is shown. Although the data are not correlated in a linear fashion, it is obvious that the higher the oxygen flow, the higher the leakage distances.
Effect of Coughing
The effect of coughing on the exhaled air dispersion distance while the HPS was receiving 6 L/min of oxygen via the simple mask is shown in Figure 4 . The leakage plume through the side vent of the simple mask was noted to stretch to distances of 0.4 and 0.2 m lateral to the median sagittal plane for contours of > 25% and > 60%, respectively.
Figure 4.
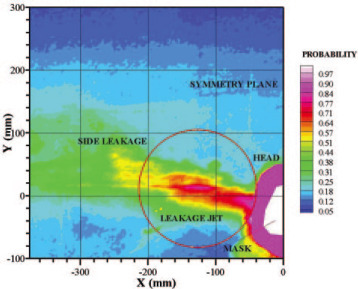
Exhaled air dispersion during coughing. While the HPS was breathing oxygen at 6 L/min, cough was produced by a short burst (2 s, 400 L/min) of air (marked by smoke) generated by a jet ventilator connected to the proximal trachea. This represented cough efforts in a patient with mild lung injury.16 Although the video camera was not able to capture the maximum dispersion distance beyond 0.4 m for contours of > 20%, the leakage plume through the side vent of the simple mask was noted to stretch to distances of 0.4 and 0.2 m lateral to the median sagittal plane for contours of > 25% and > 60%, respectively.
Discussion
This study was a “worse-case” scenario using the breathing patterns of a healthy man, in a room that was free of air currents, and an extremely fine-particle tracer in order to demonstrate the maximum distribution of exhaled air. Using laser smoke visualization methods, we have shown that exhaled air dispersed at maximal distances of 0.2, 0.22, 0.3, and 0.4 m (for contours of > 20%) lateral to the median sagittal line of the HPS when oxygen was delivered via a simple Hudson mask at increasing flows of 4, 6, 8, and 10 L/min respectively. Within these dispersal distances from the mask, the chance of exposure to the patient's exhaled air is significantly > 20%. The closer to the patient, the higher the chance of exposure to the patient's exhaled air. Thus, within dispersal distances of 0.16, 0.17, 0.25, and 0.35 m, there was at least a 60% chance of exposure to the exhaled air at oxygen flows of 4, 6, 8, and 10 L/min, respectively. Coughing increased the air dispersion distance from 0.17 m (without coughing in Fig 2, top right, B) to 0.2 m while the HPS was receiving 6 L/min of oxygen with at least a 60% chance of exposure within that distance. These findings have important clinical implications for the health-care workers who often manage patients with respiratory failure due to CAP of unknown etiology at a short distance. It is important to provide adequate respiratory protection for the health-care workers, in addition to applying standard, contact, and droplet precautions in order to prevent nosocomial infections.
During the major outbreak of SARS in 2003, respiratory failure was the major complication in the second week of the illness, when about half of the patients required supplemental oxygen in order to maintain satisfactory oxygenation.25 Health-care workers were particularly vulnerable to SARS as the viral load of SARS coronavirus in patients increased to peak level on day 10 of the illness.26 A case-control study27 involving 124 medical wards in 26 hospitals in Guangzhou and Hong Kong has identified SARS patients requiring oxygen therapy or NPPV as independent risk factors for superspreading nosocomial outbreaks of SARS. While the major routes for the transmission of SARS were related to infected droplets and fomites, as is usually the case in patients with viral pneumonia,28 there was evidence that SARS might have been spread by airborne transmission.29 30 31 32 It was not entirely clear whether different modalities of respiratory support had contributed to the nosocomial outbreaks of SARS through the generation of infective aerosols, but our previous study8 showed that substantial exposure to exhaled air occurs within a 0.5-m radius of patients who are receiving NPPV.
Few studies have assessed the potential risk of oxygen therapy in spreading respiratory infection. Using an aerosolized 3% hypertonic saline solution and photographic techniques, Somogyi et al33 demonstrated that throughout exhalation both the nonrebreathing and Venturi-type of oxygen masks could produce potentially infectious plumes of exhaled air that could be inhaled by health-care workers, whereas the addition of an expiratory port and a filter to an oxygen mask (Hi-Ox80; VIASYS Healthcare; Yorba Linda, CA) could reduce aerosol production.33 Using a laser visualization technique and a mathematical model that was different from the one used in the current study for data analysis, we have previously shown a maximal dispersion distance of approximately 0.4 m during the application of oxygen at 4 L/min via a simple mask to the HPS, which was programmed at a respiratory rate of 12 breaths/min and a tidal volume of 0.5 L.34 Our previous study8 relied on image-processing techniques to define the edge of the visible smoke boundary from the captured digital video images, which represented the “peak” of simulated exhalation during one breath cycle by the HPS.34 The current study, which is based on our previous work on the safety of NPPV,8 has the advantage of allowing the smoke concentration in the exhaled plume to be estimated from the light scattered by smoke particles, whereas the probability contours were made up of data collected from at least 10 breaths. Outside the boundary contour of 20%, the probability of exposure to a patient's exhaled air was < 20% in this study.
This study was limited by the use of smoke particles as markers for exhaled air. The inertia and weight of larger droplets in an air-droplet, two-phase flow would certainly cause them to have less horizontal dispersion than the continuous air carrier phase in which they traveled. However, the evaporation of water content in some droplets during oxygen therapy may produce droplet nuclei that are suspended in air, whereas the larger droplets will fall to the ground in a trajectory pathway. As the smoke particles in this study mark the continuous air phase, our data contours refer to exhaled air. Our results would represent the “upper bound” estimates for the dispersion of droplets that would be expected to follow a shorter trajectory than the air jet due to gravitational effects, but would not fully reflect the risk of droplet transmission.8 Second, the room airflow was switched off during the experiment in order to reveal the maximum distribution of exhaled air without interference by external factors. Further work is needed to assess the interaction between ward ventilation and the dispersion distances related to oxygen therapy. Last, we were unable to capture the maximum dispersion distance during coughing due to the limitation of the equipment used in this study. A higher speed camera with a wider laser beam will be required in future studies to detect the full range of dispersion distances during maneuvers such as coughing and sneezing.
A recent review3 has demonstrated a strong association among ventilation, air movements in buildings, and the transmission/spread of infectious diseases such as measles, tuberculosis, influenza, and SARS, but there are insufficient data to specify and quantify the minimum ventilation requirements in hospitals and isolation rooms in relation to the spread of infectious diseases via the airborne route. In a study of the dispersion characteristics of polydispersed droplets in a general hospital ward equipped with a ceiling-mixing type of ventilation system, the small droplets or droplet nuclei (initial size, ≤ 45 μm) behaved as airborne-transmittable particles (ie, staying airborne for > 360 s) and the dispersions were strongly affected by the ward ventilation airflow pattern, with the expiratory droplets exhibiting an initial rapid dispersion followed by slower dispersion in the subsequent stage.35 In contrast, large droplets (initial sizes, 87.5 and 137.5 μm) were subjected to gravitational effects and stayed airborne for < 30 s, demonstrating the upper-bound reasoning that was discussed previously in this article.35 Thus, the location of exhaust air vents on the medical ward has a significant impact on the dispersion pattern of expiratory droplets.
In conclusion, we have shown in a worst-case scenario that substantial exposure to exhaled air occurs within 0.4 m of patients receiving supplemental oxygen via a simple oxygen mask but that coughing can extend the dispersion distance further. Health-care workers must take precautions when managing patients with CAP of unknown etiology that is complicated by respiratory failure. In addition to maintaining contact, droplet, and standard precautions among the health-care workers when providing routine care to patients infected with H5N1 influenza, the World Health Organization recommends airborne precautions in health-care facilities including placing patients with suspected and confirmed H5N1 influenza in isolation rooms with at least 12 air exchanges per hour (if available) during aerosol-generating procedures due to the high lethality of the disease and the uncertainty about the mode of human-to-human transmission.36 While other investigators have examined the filtration capacity of different surgical and N95 masks in protecting health-care workers from viral infection,37 38 39 further studies are needed to examine the dispersion of exhaled air from common respiratory therapy devices in relation to the air exchange rate and airflow patterns on the medical ward in the control of airborne viral infections.
ACKNOWLEDGMENT
We thank the Research Fund for the Control of Infectious Diseases (Health, Welfare and Food Bureau, HKSAR) for the support of this study.
Footnotes
This research was funded by the Research Fund for the Control of Infectious Diseases (Health, Welfare and Food Bureau, HKSAR).
The authors have reported to the ACCP that no significant conflicts of interest exist with any companies/organizations whose products or services may be discussed in this article.
References
- 1.Lim WS, van der Eerden MM, Laing R. Defining community acquired pneumonia severity on presentation to hospital: an international derivation and validation study. Thorax. 2003;58:377–382. doi: 10.1136/thorax.58.5.377. [DOI] [PMC free article] [PubMed] [Google Scholar]
- 2.Man SY, Lee N, Ip M. Prospective comparison of three predictive rules for assessing severity of community acquired pneumonia in Hong Kong. Thorax. 2007;62:348–353. doi: 10.1136/thx.2006.069740. [DOI] [PMC free article] [PubMed] [Google Scholar]
- 3.Li Y, Leung GM, Tang JW. Role of ventilation in airborne transmission of infectious agents in the built environment: a multidisciplinary systematic review. Indoor Air. 2007;17:2–18. doi: 10.1111/j.1600-0668.2006.00445.x. [DOI] [PubMed] [Google Scholar]
- 4.Lee N, Hui DS, Wu A. A major outbreak of severe acute respiratory syndrome in Hong Kong. N Engl J Med. 2003;348:1986–1994. doi: 10.1056/NEJMoa030685. [DOI] [PubMed] [Google Scholar]
- 5.Wong RS, Hui DS. Index patient and SARS outbreak in Hong Kong. Emerg Infect Dis. 2004;10:339–341. doi: 10.3201/eid1002.030645. [DOI] [PMC free article] [PubMed] [Google Scholar]
- 6.Tomlinson B, Cockram CS. SARS: experience at Prince of Wales Hospital, Hong Kong. Lancet. 2003;361:1486–1487. doi: 10.1016/S0140-6736(03)13218-7. [DOI] [PMC free article] [PubMed] [Google Scholar]
- 7.Beigel JH, Farrar J, Han AM. Avian influenza A (H5N1) infection in humans. N Engl J Med. 2005;353:1374–1385. doi: 10.1056/NEJMra052211. [DOI] [PubMed] [Google Scholar]
- 8.Hui DS, Hall SD, Chan MT. Non-invasive positive pressure ventilation: an experimental model to assess air and particle dispersion. Chest. 2006;130:730–740. doi: 10.1378/chest.130.3.730. [DOI] [PMC free article] [PubMed] [Google Scholar]
- 9.Good ML. Patient simulation for training basic and advanced clinical skills. Med Educ. 2003;37(suppl):14–21. doi: 10.1046/j.1365-2923.37.s1.6.x. [DOI] [PubMed] [Google Scholar]
- 10.Meka VV, van Oostrom JH. Bellows-less lung system for the human patient simulator. Med Biol Eng Comput. 2004;42:413–418. doi: 10.1007/BF02344718. [DOI] [PubMed] [Google Scholar]
- 11.So CY, Gomersall CD, Chui PT. Performance of an oxygen delivery device for weaning potentially infectious critically ill patients. Anaesthesia. 2004;59:710–714. doi: 10.1111/j.1365-2044.2004.03802.x. [DOI] [PubMed] [Google Scholar]
- 12.Goodwin JA, van Meurs WL, Sa Couto CD. A model for educational simulation of infant cardiovascular physiology. Anesth Analg. 2004;99:1655–1664. doi: 10.1213/01.ANE.0000134797.52793.AF. [DOI] [PubMed] [Google Scholar]
- 13.Lampotang S, Lizdas DE, Gravenstein N. An audible indication of exhalation increases delivered tidal volume during bag valve mask ventilation of a patient simulator. Anesth Analg. 2006;102:168–171. doi: 10.1213/01.ANE.0000181833.23904.4E. [DOI] [PubMed] [Google Scholar]
- 14.Kuhlen R, Max M, Dembinski R. Breathing pattern and workload during automatic tube compensation, pressure support and T-piece trials in weaning patients. Eur J Anaesthesiol. 2003;20:10–16. doi: 10.1017/s0265021503000024. [DOI] [PubMed] [Google Scholar]
- 15.Light RB. Pulmonary pathophysiology of pneumococcal pneumonia. Semin Respir Infect. 1999;14:218–226. [PubMed] [Google Scholar]
- 16.Sancho J, Servera E, Díaz J. Comparison of peak cough flows measured by pneumotachograph and a portable peak flow meter. Am J Phys Med Rehabil. 2004;83:608–612. doi: 10.1097/01.phm.0000133431.70907.a2. [DOI] [PubMed] [Google Scholar]
- 17.Soo SL. Fluid dynamics of multiphase systems. Blaisdell Publishing Company; Toronto, ON, Canada: 1967. [Google Scholar]
- 18.Hall SD. An investigation of the turbulent backward facing step flow with the addition of a charged particle phase and electrostatic forces. PhD Thesis. The University of New South Wales; Sydney, NSW, Australia: 2001. [Google Scholar]
- 19.Hall SD, Behnia M, Fletcher CAJ. Investigation of the secondary corner vortex in a benchmark turbulent backward-facing step using cross-correlation particle image velocimetry. Exp Fluids. 2003;35:139–151. [Google Scholar]
- 20.Bohren CF, Huffman DR. Absorption and scattering of light by small particles. John Wiley and Sons; New York, NY: 1983. [Google Scholar]
- 21.Langer G, Radnik JL. Development and preliminary testing of a device for electrostatic classification of submicron airborne particles. J Appl Phys. 1961;32:955–957. [Google Scholar]
- 22.MathSoft Inc . Mathcad 8.0 for Windows, users guide. MathSoft Inc; Cambridge MA: 2000. [Google Scholar]
- 23.Raffel M, Willert C, Kompenhans J. Particle image velocimetry. Springer-Verlag; Berlin, Germany: 1998. [Google Scholar]
- 24.Huang H. Limitations of and improvements to PIV and its application to a backward-facing step flow. Verlag Koster; Berlin, Germany: 1994. [Google Scholar]
- 25.Hui DS, Wong KT, Antonio GE. Severe acute respiratory syndrome (SARS): correlation of clinical outcome and radiological features. Radiology. 2004;233:579–585. doi: 10.1148/radiol.2332031649. [DOI] [PubMed] [Google Scholar]
- 26.Peiris JS, Chu CM, Cheng VC. Clinical progression and viral load in a community outbreak of coronavirus-associated SARS pneumonia: a prospective study. Lancet. 2003;361:1767–1772. doi: 10.1016/S0140-6736(03)13412-5. [DOI] [PMC free article] [PubMed] [Google Scholar]
- 27.Yu IT, Xie ZH, Tsoi KK. Why did outbreaks of severe acute respiratory syndrome occur in some hospital wards but not in others? Clin Infect Dis. 2007;44:1017–1025. doi: 10.1086/512819. [DOI] [PMC free article] [PubMed] [Google Scholar]
- 28.Peiris JS, Yuen KY, Osterhaus AD. The severe acute respiratory syndrome. N Engl J Med. 2003;349:2431–2441. doi: 10.1056/NEJMra032498. [DOI] [PubMed] [Google Scholar]
- 29.Yu IT, Li Y, Wong TW. Evidence of airborne transmission of the severe acute respiratory syndrome virus. N Engl J Med. 2004;350:1731–1739. doi: 10.1056/NEJMoa032867. [DOI] [PubMed] [Google Scholar]
- 30.Booth TF, Kournikakis B, Bastien N. Detection of airborne severe acute respiratory syndrome (SARS) coronavirus and environmental contamination in SARS outbreak units. J Infect Dis. 2005;191:1472–1477. doi: 10.1086/429634. [DOI] [PMC free article] [PubMed] [Google Scholar]
- 31.Chu CM, Cheng VC, Hung IF. Viral load distribution in SARS outbreak. Emerg Infect Dis. 2005;11:1882–1886. doi: 10.3201/eid1112.040949. [DOI] [PMC free article] [PubMed] [Google Scholar]
- 32.Yu IT, Wong TW, Chiu YL. Temporal-spatial analysis of severe acute respiratory syndrome among hospital inpatients. Clin Infect Dis. 2005;40:1237–1243. doi: 10.1086/428735. [DOI] [PMC free article] [PubMed] [Google Scholar]
- 33.Somogyi R, Vesely AE, Azami T. Dispersal of respiratory droplets with open vs closed oxygen delivery masks: implications for the transmission of severe acute respiratory syndrome. Chest. 2004;125:1155–1157. doi: 10.1378/chest.125.3.1155. [DOI] [PMC free article] [PubMed] [Google Scholar]
- 34.Hui DS, Ip M, Tang JW. Airflows around oxygen masks: a potential source of infection? Chest. 2006;130:822–826. doi: 10.1378/chest.130.3.822. [DOI] [PMC free article] [PubMed] [Google Scholar]
- 35.Wan MP, Chao CY, Mg YD. Dispersion of expiratory droplets in a general hospital ward with ceiling mixing type mechanical ventilation system. Aerosol Sci Technol. 2007;41:244–258. [Google Scholar]
- 36.World Health Organization Avian influenza, including influenza A (H5N1), in humans: WHO interim infection control guideline for health care facilities. Available at: http://www.who.int/csr/disease/avian_influenza/guidelines/infectioncontrol1/en/index.html Accessed February 22, 2007.
- 37.Derrick JL, Gomersall CD. Protecting healthcare staff from severe acute respiratory syndrome: filtration capacity of multiple surgical masks. J Hosp Infect. 2005;59:365–368. doi: 10.1016/j.jhin.2004.10.013. [DOI] [PMC free article] [PubMed] [Google Scholar]
- 38.Derrick JL, Li PT, Tang SP. Protecting staff against airborne viral particles: in vivo efficiency of laser masks. J Hosp Infect. 2006;64:278–281. doi: 10.1016/j.jhin.2006.06.021. [DOI] [PubMed] [Google Scholar]
- 39.Mardimae A, Slessarev M, Han J. Modified N95 masks delivers high inspired oxygen concentrations while effectively filtering aerosolized microparticles. Ann Emerg Med. 2006;48:391–399. doi: 10.1016/j.annemergmed.2006.06.039. [DOI] [PMC free article] [PubMed] [Google Scholar]