

Abstract
Introduction
Viral respiratory infections may precipitate acute exacerbations of COPD (AECOPD). However, little is known about viral etiology related to AECOPD in Asia. We aimed to study the viral etiology of AECOPD in Hong Kong.
Methods
Patients admitted to an acute hospital in Hong Kong with AECOPD were recruited prospectively from May 1, 2004, to April 30, 2005. Nasopharyngeal aspirate was collected and assessed by polymerase chain reaction (PCR) and viral culture. Spirometry was performed in the stable phase at 2 to 3 months after hospital discharge.
Results
There were 262 episodes of AECOPD among 196 patients (mean age, 75.7 ± 7.7 years [± SD]; 160 men). Mean FEV1 was 39.6 ± 18.9% of predicted normal, and FEV1/FVC ratio was 58.0 ± 15.2%. Fifty-eight episodes (22.1%) yielded positive viral PCR results. The viruses identified were influenza A (7.3%), coronavirus OC43 (4.6%), rhinovirus (3.1%), influenza B (2.7%), and respiratory syncytial virus (2.3%). The diagnostic yield of viral identification by PCR was 2.7 times higher than that based on conventional viral culture. The rates of identifying a positive viral etiology by PCR were similar among the subjects with FEV1 ≥ 50%, ≥ 30 to 50%, and < 30% of predicted normal. Viral infection appeared to have no effect on subsequent readmissions or mortality rate over a study period of 1 year
Conclusion
Influenza A and two less-attended viruses, coronavirus OC43 and rhinovirus, were the common etiologic agents in patients hospitalized with AECOPD in Hong Kong. These should be considered in developing diagnostic and intervening strategies pertaining to AECOPD.
Key words: acute exacerbation, COPD, viruses
Abbreviations: AECOPD, acute exacerbations of COPD; CXR, chest radiograph; GOLD, Global Initiative for Chronic Obstructive Lung Disease; MDCK, Mardin Darby canine kidney; NPA, nasopharyngeal aspirate; NPPV, noninvasive positive pressure ventilation; PCR, polymerase chain reaction; RSV, respiratory syncytial virus
Acute exacerbations of COPD (AECOPD) lead to significant morbidity and mortality worldwide.1 Previous studies2 3 have shown that pulmonary function and quality of life were adversely affected by frequent exacerbations, particularly in active smokers. In Hong Kong, COPD was the fifth-leading cause of death, and accounted for at least 4% of all public hospital acute admissions in 2003. We have previously shown that in patients hospitalized with AECOPD, the 1-year readmission rate was 2.2 episodes, whereas the 1-year mortality rate was 14%.4
Common etiologic factors of AECOPD include infections,5 6 air pollution,7 withdrawal of medications,8 or change in temperature.9 Etiologic agents may vary in different geographic locations. We previously conducted a 1-year prospective study10 on the infectious etiology related to AECOPD in Hong Kong, with identification of viruses based on viral culture of the nasopharyngeal aspirate (NPA) and blood serology. However, these methods lack sensitivity in comparison to the newer technique of polymerase chain reaction (PCR) for virus identification.
The aim of this study was to assess prospectively the viral etiology of subjects hospitalized for AECOPD using the PCR method on the NPA specimen. In addition, we explored any relationship between viral identification and clinical parameters, such as the length of stay in hospital, need for noninvasive positive pressure ventilation (NPPV), readmissions, and mortality over the subsequent 12 months, lung function on recovery, and influenza vaccination in the preceding year.
Materials and Methods
Subject Recruitment
Patients who had been admitted to the Prince of Wales Hospital with AECOPD between May 1, 2004, and April 30, 2005, were recruited for this study on every alternate day. AECOPD was defined when a patient with background COPD11 presented with at least two major symptoms (increased dyspnea, increased sputum purulence, increased sputum volume) or one major and one minor symptom (nasal discharge/congestion, wheeze, sore throat, cough) for at least 2 consecutive days.2 12 Informed written consent was obtained from each subject, and the study was approved by the research ethics committee of the Chinese University of Hong Kong.
Demographic Data and Management in Hospital
Demographic data and length of hospital stay of patients with AECOPD were recorded. Comorbid conditions were noted and scored by the Charlson index.13 Scoring of the Charlson index ranged from 0 to 33, with a higher score indicating more in number and severity of the coexisting illnesses. In addition, chest radiographs (CXRs) were assessed by the investigators (respiratory physicians). Only those without pneumonic changes on their CXRs were included for analysis in this study. The use of NPPV, invasive mechanical ventilation, and ICU admissions were recorded.
Microbiological Examination
NPA was obtained by catheter aspiration from the posterior nasal pharyngeal space via the nostril with the patient in the sitting position, as described on our previous study.10
Viral Culture
NPA was collected in 3 mL of viral transport medium containing gentamycin (4 mg/mL), penicillin/streptomycin (50,000 IU/50,000 μg/mL), and fungizone (1 mg/mL), and was processed (usually within 12 h) for viral culture and PCR assay. Briefly, the aspirate was centrifuged at 2,000/min for 5 min, and the cell pellet washed with phosphate-buffered saline solution and coated onto glass slides. The supernatant was inoculated onto rhesus monkey kidney (LLC-MK2), human laryngeal carcinoma (HEp-2), Mardin Darby canine kidney (MDCK), and human embryonic lung fibroblast cell monolayers. All cell cultures were incubated at 37°C, except for MDCK, which was incubated at 33°C. Cell monolayers were examined daily for cytopathic effect. After 14 days of incubation, a hemadsorption test for LLC-MK2 and MDCK monolayers was performed. When suspicious cytopathic effect was observed or when the hemadsorption test result was positive, the presence of virus growth was confirmed by immunofluorescence staining using specific monoclonal antibodies.
PCR
Five groups of nested multiplex PCR assays targeting 17 respiratory viruses and three bacteria were applied. The five groups of viruses and the outer and inner sets of primer sequences, and the amplicon sizes are listed in Table 1 . Primers were designed based on modifying published primer sequences14 15 16 17 18 19 20 21 22 or constructed from the consensus regions, as obtained from GenBank.
Table 1.
Primers Used in Nested Multiplex PCR*
| Virus | Forward and Reverse Primers, Sequence (5′ → 3′) | Product Length, Base-Pair |
|---|---|---|
| Primers used in the first round of multiplex nested PCR | ||
| Group 1 | ||
| Influenza A | TYGAGGCTCTCATGGARTGGCTAAAG | 412 |
| GCTGGCCARMACCATTCTGTTYTCAT | ||
| Influenza A H1 | CCCAGGRTATTTCKCCGAYTATGAGG | 760 |
| TACCATTCCAGTCCACCCCCCTTCA | ||
| Influenza A H3 | ATGGGACCTTTTTRTYGAACGCAGCA | 519 |
| CCCCKAGGAGCAATTAGATTCCCTGT | ||
| Influenza A H5 | ATCAAACAGATTAGTCCTTGCG | 265 |
| GGCCTCAAACTGAGTGTTCATT | ||
| Influenza B | AGGAAGRGCAATGGCAGAYAGAGG | 883 |
| TGCTGTGTCCCTCCCAAAGAAGAAA | ||
| Group 2 | ||
| Parainfluenza 1 | TCTGGATCCACCACAATTTCAG | 848 |
| WACCAGTTGCAGTCTKGGTTTC | ||
| Parainfluenza 2 | CTTGCAGCATTTTCTGGGGAACTCC | 716 |
| GCATCATCATCCTGGGAGCCTCTGT | ||
| Parainfluenza 3 | GATTTTTGGAGATGCACGTCTG | 1118 |
| GAGAGTGTTYTGTTTCGGATGG | ||
| Parainfluenza 4 | AYGGATGCATTCGAATTCCATCATTC | 432 |
| TCCRTRAGRCCYCCATACAARGG | ||
| Group 3 | ||
| Human RCV A | CAGCTCCGTTATCACATCTCTAGGAGCC | 576 |
| TGGGTTGTCTATGAGCAGATAKKAAACCA | ||
| Human RSV B | CGGGCCAGAAGAGAAGCACCACAGTA | 673 |
| TGATCCTTCTTTGATGTTGGTGGTGCA | ||
| Human rhinovirus | CACTTCTGTTTCCCCGGAGCGAG | 388 |
| GAAACACGGACACCCAAAGTAGTCGGT | ||
| Human enterovirus | CTGCGYTGGCGGCCYMCC | 281 |
| CCGGATGGCCAATCCAATAACTATATGGT | ||
| Group 4 | ||
| Human coronavirus OC43 | CGGTTACACTGTTCAGCCAATYGCA | 793 |
| CCAACCCAAAAATGCTTGTGGTYG | ||
| Human SARS-CoV | CACCGTTTCTACAGGTTAGCTAACGA | 310 |
| AAATGTTTACGCAGGTAAGCGTAAAA | ||
| Human coronavirus 229E | TCACCCATTTGAAGAATTGGAATTTTGG | 566 |
| TCGTACGTAGAAAACCCAGCCTGTGC | ||
| Human metapneumovirus | CAATATGGTTCCCTTTGTTTCAGGCCA | 462 |
| TGGTCTGCTTCACTGCTTATWGCAGCTT | ||
| Group 5 | ||
| Mycoplasma pneumonia | GACCATTCCACCCAGCCCCAGC | 343 |
| GTTCAGCGAGTGGGGTGCGTACAATA | ||
| Chlamydia pneumoniae | TGCGCTACTTGGTGCGACGCTA | 571 |
| CGCCTTTATAGCCCTTGGGTTTRTTT | ||
| L egionella | CGCTCAATTGGCTTTAACCGAACAG | 425 |
| CGCTRCGTGGRCCATATGCARGAC | ||
| Adenovirus | TACATGCACATCKCSGGVCAGGA | 983 |
| CCRGCCARHACHCCCATRTTDCCHGT | ||
| Primers used in second round of multiplex nested PCR | ||
| Group 1 | ||
| Influenza A | AAGACCAATCCTGTCACCTCTGA | 73 |
| CAAAGCGTCTACGCTGCAGTCC | ||
| Influenza A H1 | TCGCCGACTATGAGGAACTGAGGGA | 431 |
| TTGTATCCCCGGGTTCCAGCAGAGT | ||
| Influenza A H3 | CCCTTATGATGTGCCGGATTATGCC | 259 |
| GGTGGTGAACCCCCCAAATGTACAA | ||
| Influenza A H5 | TGCGACTGGRCTCAGAAATA | 172 |
| GGATTCTTTGTCTGCAGCGT | ||
| Influenza B | AAAACAARTGCTCTGCRCCYCAAC | 516 |
| CRTCTCCACCTACTTCRTTYCCCCC | ||
| Group 2 | ||
| Parainfluenza 1 | AATTGGTGATGCAATATATGCKTATTC | 600 |
| TCGACAACAATYTTTGGCCTATC | ||
| Parainfluenza 2 | AGGACAGCAGAGGACCTCGGCATG | 343 |
| ACCTGATGTTCTTTGCGGTATGGGG | ||
| Parainfluenza 3 | CAACTGTGTTCRACTCCCAAAG | 717 |
| TGGGTTYACTCTCGATTTTTGY | ||
| Parainfluenza 4 | GACGGATGYYTRCKGWATTGTGT | 231 |
| CCRTRAGRCCYCCATACAARGGAA | ||
| Group 3 | ||
| Human RSV A | TGACCCATTAGTGTTCCCCTCTGATGAAT | 228 |
| CTTCTGGCCTTRCAGTATARGAGCAGT | ||
| Human RSV B | GTCGCATCTCCAACA TTGRAAC | 336 |
| TGGTGCATAGAGGTG ATGTGTG | ||
| Human rhinovirus | CACTTCTGTTTCCCCGGAGCGAGG | 283 |
| CCGCATTCAGGGGCCGGAG | ||
| Human enterovirus | CCTCCGGCCCCTGAATGCG | 106 |
| CCAAAGTAGTCGGTTCCGCYRCRGA | ||
| Group 4 | ||
| Human coronavirus OC43 | CKGTGCCCTCTCCATTAAATTGGG | 635 |
| GACCCGAACAGTGCTCACCTATGCC | ||
| Human SARS-CoV | AGTGAGATGGTCATGTGTGG | 210 |
| CACTCATAGAGCCTGTGTTG | ||
| Human coronavirus 229E | TTGGGATTCTAATTGGGCCTTTGTTGC | 361 |
| GCTCGGCACGGCAACTGTCATGTAT | ||
| Human metapneumovirus | CCCTTTGTTTCAGGCCAAYACACCACC | 431 |
| GCAGCTTCAACAGTRGCTGATTCACTCTC | ||
| Group 5 | ||
| M pneumonia | AGGGGGTTCTTCAGGCTCAGGTCAA | 160 |
| CCCCACCACATCATTCCCCGTATTA | ||
| C pneumoniae | RCCTACWGGATCCGCTRCTGCRAA | 317 |
| GCRCCTACGCTCCAAGMRAAAGWRG | ||
| Legionella | TGAAAACAAAAACAAGCCAGGCGTTG | 232 |
| TGGCATCAATTGYAAAGCYTCTGTCC | ||
| Adenovirus | TGGCYWSCACNTWCTTTGACATYMG | 463 |
| GCRWAWGAHCCRTARCAKGGYTDCAT |
SARS-CoV = severe acute respiratory syndrome coronavirus. Degenerate primer abbreviations: M:A/C, R:A/G, W:A/T, S:C/G, Y:C/T, K:G/T, V:A/C/G, H:A/C/T, D:A/G/T, N:A/C/G/T.
A 200-μL aliquot of the cell-free supernatant of spun nasopharyngeal aspirate was used for extraction of RNA and DNA (QIAamp MinElute Virus Spin Kit; Qiagen; Hong Kong). PCRs were performed using a “fast” thermal cycler (Applied Biosystems; Foster City, CA) with DNA polymerase (Fast PCR Master Mix, GeneAmp; Applied Biosystems). Both first-round and second-round PCRs were conducted in a 20-μL reaction with 2 μL of complementary DNA as template, and 0.2-μL aliquot of the first-round PCR product in the first-round and second-round PCRs, respectively. The cycling conditions for both rounds of PCRs were an initial denaturation at 95°C for 10 s, then 30 cycles of denaturation at 95°C for 1 s and annealing/extension at 64°C for 40 s, followed by a final extension at 72°C for 10 s. For adenovirus detection, 35 cycles of denaturation at 95°C for 5 s were used instead. Cultured stocks of the target pathogens were used as positive controls; and when cultured stocks are not available, clinical specimens known to contain the target agents were used.
Follow-up of Patients After Discharge
Spirometry before and after bronchodilation (Vitalograph; Buckingham, UK) was performed at 2 to 3 months after discharge from the hospital (ie, stable COPD) according to the American Thoracic Society standard.23 Updated predicted spirometry values for Hong Kong Chinese were adopted.24 The patients were contacted by telephone, and their medical records were reviewed 12 months later to check for any deaths or hospital readmissions.
Statistical Analysis
Data were analyzed using statistical software (SPSS, version 11.5; SPSS; Chicago, IL). Associations between the identification of a virus in the NPA during an episode of AECOPD and the lung function and clinical outcomes of patients (such as mortality, NPPV, use and length of hospital stay) were assessed by Mann Whitney U test, χ2 test, and Fisher exact test as appropriate. Data are presented as mean ± SD, and p < 0.05 was considered significant.
Results
Altogether 350 episodes of AECOPD were screened for this study. Cases (n = 76) with pneumonic changes on CXR or predominantly congestive heart failure were excluded. Among those cases that fitted the inclusion criteria, 12 patients refused to consent for the study. Finally, 262 episodes of AECOPD were included for analysis among 196 patients. Only 165 subjects had returned for lung function tests at 117.88 ± 92.6 days after discharge from the hospital for AECOPD. Thirteen subjects died (either as inpatients or after discharge) before lung function test could be arranged, whereas 18 subjects defaulted follow-up. Among those who died or defaulted follow-up, lung function data obtained at stable state within 1 year prior to the admission for AECOPD were taken for statistical analysis (data available for 11 deceased subjects and 8 defaulters).
The majority of our subjects were men (81.6%), and the length of stay in the acute care hospital was 5.8 ± 3.0 days. After the first episode of hospitalization for AECOPD, 25 patients died, whereas 121 patients were readmitted to the hospital with another episode of AECOPD within 12 months. Among all the episodes of AECOPD, 23 episodes (8.8%) required NPPV support. Neither ICU admission nor invasive mechanical ventilation was required by our subjects. Demographic data of the subjects are presented in Table 2 .
Table 2.
Demographic Characteristics of the Patients (n = 196) Admitted to the Hospital With AECOPD Who Had NPA Saved for Assessment*
| Characteristics | Data |
|---|---|
| Age, yr | 75.7 ± 7.7 |
| Male gender | 160 (81.6) |
| Body mass index, kg/m2 | 21.2 ± 4.34 |
| Prebronchodilator FEV1, L† | 0.71 ± 0.36 |
| Prebronchodilator FVC, L† | 1.23 ± 0.55 |
| Postbronchodilator FEV1, L† | 0.76 ± 0.37 |
| Postbronchodilator FVC, L† | 1.36 ± 0.61 |
| Postbronchodilator FEV1/FVC ratio† | 0.58 ± 0.15 |
| Postbronchodilator FEV1 % predicted normal, %† | 39.58 ± 18.92 |
| Postbronchodilator FVC % predicted normal, %† | 50.19 ± 20.26 |
| Premorbid status | |
| Chair bound | 7 (3.6) |
| Home bound | 20 (10.2) |
| Could walk on level ground | 52 (26.5) |
| Could walk up at least one flight of stairs | 117 (59.7) |
| Smoking status | |
| Nonsmoker | 2 (1.0) |
| Ex-smoker | 161 (82.1) |
| Current smoker | 33 (16.8) |
| Home oxygen use | 33 (16.8) |
| Inhaled corticosteroids | 102 (52.0) |
| Oral theophylline | 72 (36.7) |
| Influenza vaccination over the past 12 mo | 79 (40.3) |
| Charlson index | 1.50 ± 0.93 |
Data are presented as mean ± SD or No. (%).
Score of Charlson index ranged from 0 to 33 with a higher score indicating having more in number and seriousness of the coexisting illnesses.13
Among those with NPA specimens collected, 58 subjects (22.1%) had positive viral PCR results. The most common virus identified was influenza A (19 of 58 patients, 7.3%), followed by coronavirus OC43 (12 of 58 patients, 4.6%), rhinovirus (8 of 58 patients, 3.1%), influenza B (7 of 58 patients, 2.7%), and respiratory syncytial virus (RSV) [6 of 58 patients, 2.3%]. Results of the viral etiology based on PCR assay are shown in Figure 1 . All the influenza A belonged to the H3 subtype, with neither H1 nor H5 subtypes identified. There were four cases of parainfluenza viruses detected, with one case for each of the following strains identified: parainfluenza type 1, 2, 3, and 4. Table 3 shows PCR results of the NPA in relation to the lung function of the subjects. The rates of identifying a positive viral etiology by PCR were similar among the subjects with FEV1 ≥ 50%, ≥ 30 to 50%, and < 30% of predicted normal.
Figure 1.
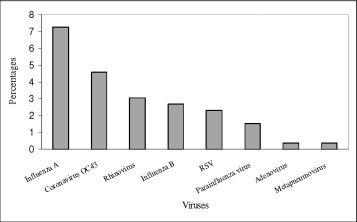
Viruses as detected by PCR method in the nasopharyngeal aspirates of patients (n = 262).
Table 3.
Summary of the NPA PCR Results in Relation to COPD GOLD Stages*
| NPA Findings |
All Cases (n = 245) |
GOLD Stage |
||
|---|---|---|---|---|
| Stage 1–2, FEV1 ≥ 50% of Predicted (n = 49) | Stage 3, FEV1 ≥ 30 to 50% of Predicted (n = 101) | Stage 4, FEV1 < 30% of Predicted (n = 95) | ||
| Negative | 191 (77.9) | 37 (75.5) | 80 (79.2) | 74 (77.8) |
| Influenza A | 18 (7.3) | 3 (6.1) | 8 (7.9) | 7 (7.3) |
| Coronavirus OC43 | 12 (4.9) | 2 (4.1) | 4 (4.0) | 6 (6.3) |
| Rhinovirus | 8 (3.3) | 4 (8.2) | 2 (2.0) | 2 (2.1) |
| Influenza B | 6 (2.4) | 2 (4.1) | 1 (1.0) | 3 (3.2) |
| RSV | 6 (2.4) | 0 (0) | 3 (3.0) | 3 (3.2) |
| Adenovirus | 1 (0.4) | 0 (0) | 1 (1.0) | 0 (0) |
| Metapneumovirus | 1 (0.4) | 0 (0) | 1 (1.0) | 0 (0) |
| Parainfluenza type 1 | 1 (0.4) | 0 (0) | 0 (0) | 0 (0) |
| Parainfluenza type 2 | 1 (0.4) | 0 (0) | 1 (1.0) | 0 (0) |
| Parainfluenza type 3 | 1 (0.4) | 0 (0) | 0 (0) | 1 (1.1) |
| Parainfluenza type 4 | 1 (0.4) | 0 (0) | 0 (0) | 1 (1.1) |
Data are presented as No. (%).
The seasonal pattern of the viruses is illustrated in Figure 2 . The rates of positive virus identification by PCR method in the NPA peaked in July to September of the year. Among our subjects admitted with AECOPD, 41.8% had received influenza vaccination within the past 12 months, but there was no difference in the detection rates of influenza A or B in the NPA when compared to those without influenza vaccination (11.1% vs 9.0%, p = 0.58). The relationship between influenza vaccination and the detection rates of influenza viruses in NPA by PCR method is shown in Table 4 .
Figure 2.
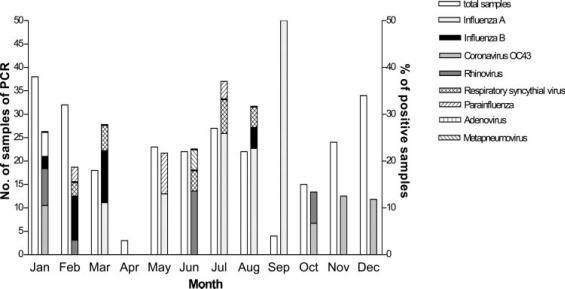
Seasonal pattern of viruses for patients admitted with acute exacerbation of COPD.
Table 4.
Effect on Influenza Vaccination of Influenza A and B NPA PCR Results
| Influenza Vaccination |
Total Cases, No. |
Identification of Influenza A or B, No. (%) |
|
|---|---|---|---|
| Yes | No | ||
| Yes | 117 | 13 (11.1) | 104 (88.9) |
| No | 144 | 13 (9.0) | 131 (91.0) |
Altogether, 244 episodes of AECOPD had both PCR and conventional viral culture performed for viral identification in the NPA, whereas viral culture was not performed in 18 patients. In comparison to conventional viral culture, the overall diagnostic yield of PCR was approximately three times higher. Comparisons of PCR and conventional viral culture in the NPA specimen are shown in Table 5 . The NPA PCR-positive and viral culture-positive cases (n = 15) had a longer length of hospital stay than the cases (n = 40) with positive PCR and negative viral culture results (7.73 ± 5.16 days vs 4.93 ± 1.64 days, p = 0.03). However, lung function (FEV1 percentage of predicted value) between the two groups did not show any significant difference (34.5 ± 15.1% vs 40.8 ± 19.5%, p = 0.269).
Table 5.
Comparison of PCR Results Against Conventional Viral Culture*
| NPA Viral Identification by PCR |
NPA Viral Identification by Viral Culture |
|
|---|---|---|
| Positive | Negative | |
| Positive | ||
| Any (n = 55) | 15 (27.3) | 40 (73.7) |
| Influenza A | 10 | 9 |
| Coronavirus OC43 | 0 | 12 |
| Rhinovirus | 0 | 7 |
| Influenza B | 1 | 5 |
| RSV | 4 | 2 |
| Adenovirus | 0 | 1 |
| Metapneumovirus | 0 | 1 |
| Parainfluenza type 1 | 0 | 1 |
| Parainfluenza type 2 | 0 | 1 |
| Parainfluenza type 3 | 0 | 1 |
| Parainfluenza type 4 | 1 | 0 |
| Negative (n = 189) | 4 (2.1) | 185 (97.9) |
| Influenza A | 2 | |
| Coronavirus OC43 | 0 | |
| Rhinovirus | 0 | |
| Influenza B | 1 | |
| RSV | 0 | |
| Adenovirus | 0 | |
| Metapneumovirus | 0 | |
| Parainfluenza type 1 | 0 | |
| Parainfluenza type 2 | 0 | |
| Parainfluenza type 3 | 1 | |
| Parainfluenza type 4 | 0 | |
Data are presented as No. (%) or No.
Episodes of AECOPD with positive viral identification were compared to those without, but the length of hospital stay was similar (median, 5 days; interquartile range, 4 to 6 days; and 5 days; interquartile range, 4 to 7 days) for virus-positive and virus-negative groups, respectively (p = 0.39). There were no significant differences in the rates of hospital readmissions between the virus-positive and virus-negative groups on their initial admission (virus-positive group, 56.0%; virus negative group, 63.7%; p = 0.33). One-year mortality rates in the virus-positive vs virus-negative groups were also similar (virus-positive group, 8.0%; virus-negative group, 14.4%; p = 0.24). Furthermore, there was no difference in the rates of NPPV usage between the virus-positive and virus-negative groups (6.9% vs 9.3%, respectively; p = 0.57).
Discussion
To the best of our knowledge, this was the first large-scale prospective study conducted in Asia on the viral etiology of patients hospitalized with AECOPD using the sensitive technique of PCR on respiratory specimens. Influenza A, coronavirus OC43, and rhinovirus were the common viruses identified in our subjects, whereas the PCR technique for viral identification based on NPA specimens had a diagnostic yield 2.7 times higher than that of conventional viral culture.
In comparisons to other studies,25 26 our diagnostic yield of viruses using the same PCR technique was relatively lower, and this might be due to geographic differences in the viral etiology of AECOPD and the different sites where the respiratory specimens were collected. Respiratory viruses were identified in the nasal samples in 39% of the East London COPD cohort with AECOPD, which was managed in the outpatient setting.25 In a study26 of German patients with more severe AECOPD requiring hospitalizations, respiratory viruses were detected in the nasal samples in 31%, whereas the diagnostic yield from induced sputum was even higher at 47%. In a recent study27 of patients with very severe exacerbations that necessitated intubation and mechanical ventilation, viral agents were identified in 43% from respiratory specimens obtained via the endotracheal tube. In a study28 of the viral etiology among 17 patients hospitalized with near-fatal asthma (from endotracheal aspiration), 29 patients with acute asthma (from induced sputum), and 14 patients with COPD (from induced sputum) in Singapore, influenza virus was identified in 36% of the subjects hospitalized with AECOPD. Further studies using sputum PCR will improve our knowledge of the viral etiology of AECOPD in our locality. Ambient air pollution29 30 may also lead to AECOPD, but this was not assessed in this study.
Although rhinovirus was detected in only 3.1% of episodes of hospitalization in this study, it is the most common viral pathogen identified in other studies of AECOPD. Rhinovirus is a major cause of common cold in the community.25 31 As there is increasing evidence that rhinovirus may directly infect the lower airway in patients with COPD,32 33 34 sampling lower airway secretions in addition to the upper airway may lead to a higher diagnostic yield of viruses. In our study, the most common virus identified was influenza virus. This might be due to the relatively low influenza vaccination rate of 40.3% in this study as compared to 74% in the East London cohort.25 In Hong Kong, H1N1 has been the predominant circulating strain of influenza in recent years,35 36 but all our patients with AECOPD and proven influenza A infection in this study had H3 strain identified. Previous studies37 38 in the United States have reported that H3N2 was more virulent than H1N1, and hospital admissions for chest infection and related deaths were significantly higher when H3N2 influenza was prevalent.
Similar to our study, other studies of AECOPD have also identified rhinovirus, coronavirus, influenza B virus, parainfluenza virus, RSV, and adenovirus in their subjects, although the percentages varied in different studies.25 39 40 Human metapneumovirus was identified in only one episode (0.4%) of AECOPD in this study, whereas other studies have reported low detection rates of 2.3% and 6% from induced sputum41 and NPA samples,42 respectively. We have found no evidence of M pneumoniae and C pneumoniae infection, and this observation was consistent with previous studies.25 43
It appeared that patients with positive NPA PCR and positive viral culture results had more severe exacerbations, as evidenced by a longer length of stay in hospital, than those with positive NPA PCR and negative viral culture results. The results might suggest that the viruses in the NPA of patients with positive NPA PCR and viral culture results were “active” and “replicating,” and thus resulted in more severe AECOPD and a longer hospital stay.
We noted two peaks of respiratory viral (Fig 2) infections in our COPD patients over a study period of 1 year. The observation of influenza season in the spring/winter period was consistent with other overseas studies9 40 and another local study.44 A second peak of influenza-like illness in summer in this current study of AECOPD patients requiring hospitalization was also in line with the seasonality of influenza in the general community in Hong Kong.36
There was no significant difference in the rates of positive PCR results from NPA between COPD patients who had received influenza vaccination over the past 12 months and those who had not. Wongsurakiat et al45 previously showed that AECOPD (defined by symptoms in their study) and influenza-related acute respiratory illness (confirmed by serology test or viral culture from respiratory secretions) requiring hospitalization could not be decreased by influenza vaccination. It is currently recommended by the Global Initiative for Chronic Obstructive Lung Disease (GOLD) guideline that annual influenza vaccination be offered to COPD patients.1 In elderly subjects in the general community (not specific for COPD subjects), some studies have found that influenza vaccine could halve the incidence of serologic and clinical influenza46 and reduce utilization of hospital resources.47 However, not all subjects who have received influenza vaccination could have a protective antibody response.45 In the study by Wongsurakiat et al,45 approximately 80% and 50% of the subjects had an antibody response to influenza A and influenza B, respectively. Further studies are needed to assess the efficacy of annual influenza vaccination and any role for a booster dose for COPD patients.
The limitation of this study was that this was a single-center study, although our hospital served a large population of 0.6 million. Due to limited resources, patients were recruited every alternate day, although the demographics of these patients were representative of the whole group when compared to our previous study.10 In addition, no patients with a stable state of COPD were recruited as control subjects, and it was thus not sure whether the viruses identified in the NPA were true pathogens or represented “colonization” or “chronic infection.” Previous studies25 26 48 using the PCR technique could identify some viruses (including piconavirus, influenza A and B virus, parainfluenaza 3, and RSV) in the respiratory specimens of stable COPD patients. As the rate of viruses identification in patients with stable-state COPD was much lower than that during AECOPD and most RSV infections in patients with COPD were associated with symptomatic respiratory illness together with measurable immune responses,48 it is highly likely that viral infections play an important role in triggering AECOPD.
In conclusion, we have identified viruses with the PCR technique on NPA specimens in 22.1% of AECOPD episodes requiring hospitalization. The common viruses were influenza A, coronavirus OC43, and rhinovirus. Viral infections appeared to have no effect on subsequent readmission rates or mortality rate over a study period of 1 year, and there was no difference in the rates of viral infections among COPD patients in different GOLD stages. In recent years, there is growing epidemiologic evidence linking viruses to AECOPD.49 It is worth noting that coronavirus OC43 and rhinovirus are both fastidious to growth, and are not covered by the routine diagnostic spectrum in most service laboratories. Our data have shown that coronavirus OC43 and rhinovirus could also exacerbate COPD. Further studies on the diagnostics, therapeutics, and vaccines for these “trivial” viruses are needed in addition to exploring the mechanisms of how viruses may induce AECOPD.
ACKNOWLEDGMENT
We thank Miss Doris Chan for helping with statistical analysis and Miss Mabel Tong for performing spirometry.
Footnotes
The authors have no conflicts of interest to disclose.
References
- 1.Global Initiative for Chronic Obstructive Lung Disease: global strategy for the diagnosis, management and prevention of chronic obstructive pulmonary disease; updated 2006. National Heart, Lung, and Blood Institute, World Health Organization; Bethesda, MD: 2006. [Google Scholar]
- 2.Seemungal TA, Donaldson GC, Paul EA. Effect of exacerbation on quality of life in patients with chronic obstructive pulmonary disease. Am J Respir Crit Care Med. 1998;157:1418–1422. doi: 10.1164/ajrccm.157.5.9709032. [DOI] [PubMed] [Google Scholar]
- 3.Donaldson GC, Seemungal TA, Bhowmik A. Relationship between exacerbation frequency and lung function decline in chronic obstructive pulmonary disease. Thorax. 2002;57:847–852. doi: 10.1136/thorax.57.10.847. [DOI] [PMC free article] [PubMed] [Google Scholar]
- 4.Ko FW, Ng TK, Li TS. Sputum bacteriology in patients with acute exacerbations of COPD in Hong Kong. Respir Med. 2005;99:454–460. doi: 10.1016/j.rmed.2004.09.011. [DOI] [PubMed] [Google Scholar]
- 5.Sethi S. Bacteria in exacerbations of chronic obstructive pulmonary disease: phenomenon or epiphenomenon? Proc Am Thorac Soc. 2004;1:109–114. doi: 10.1513/pats.2306029. [DOI] [PubMed] [Google Scholar]
- 6.Wedzicha JA. Role of viruses in exacerbations of chronic obstructive pulmonary disease. Proc Am Thorac Soc. 2004;1:115–120. doi: 10.1513/pats.2306030. [DOI] [PubMed] [Google Scholar]
- 7.Anderson HR, Spix C, Medina S. Air pollution and daily admissions for chronic obstructive pulmonary disease in 6 European cities: results from the APHEA project. Eur Respir J. 1997;10:1064–1071. doi: 10.1183/09031936.97.10051064. [DOI] [PubMed] [Google Scholar]
- 8.Wouters EF, Postma DS, Fokkens B. Withdrawal of fluticasone propionate from combined salmeterol/fluticasone treatment in patients with COPD causes immediate and sustained disease deterioration: a randomised controlled trial. Thorax. 2005;60:480–487. doi: 10.1136/thx.2004.034280. [DOI] [PMC free article] [PubMed] [Google Scholar]
- 9.Donaldson GC, Seemungal T, Jeffries DJ. Effect of temperature on lung function and symptoms in chronic obstructive pulmonary disease. Eur Respir J. 1999;13:844–849. doi: 10.1034/j.1399-3003.1999.13d25.x. [DOI] [PubMed] [Google Scholar]
- 10.Ko FW, Ip M, Chan PK. A 1-year prospective study of the infectious etiology in patients hospitalized with acute exacerbations of COPD. Chest. 2007;131:44–52. doi: 10.1378/chest.06-1355. [DOI] [PubMed] [Google Scholar]
- 11.Global Initiative for Chronic Obstructive Lung Disease: global strategy for the diagnosis, management and prevention of chronic obstructive pulmonary disease; updated 2004. National Heart, Lung, and Blood Institute, World Health Organization; Bethesda, MD: 2004. [Google Scholar]
- 12.Patel IS, Seemungal TA, Wilks M. Relationship between bacterial colonisation and the frequency, character, and severity of COPD exacerbations. Thorax. 2002;57:759–764. doi: 10.1136/thorax.57.9.759. [DOI] [PMC free article] [PubMed] [Google Scholar]
- 13.Charlson ME, Pompei P, Ales KL. A new method of classifying prognostic comorbidity in longitudinal studies: development and validation. J Chronic Dis. 1987;40:373–383. doi: 10.1016/0021-9681(87)90171-8. [DOI] [PubMed] [Google Scholar]
- 14.Bellau-Pujol S, Vabret A, Legrand L. Development of three multiplex RT-PCR assays for the detection of 12 respiratory RNA viruses. J Virol Methods. 2005;126:53–63. doi: 10.1016/j.jviromet.2005.01.020. [DOI] [PMC free article] [PubMed] [Google Scholar]
- 15.Billaud G, Peny S, Legay V. Detection of rhinovirus and enterovirus in upper respiratory tract samples using a multiplex nested PCR. J Virol Methods. 2003;108:223–228. doi: 10.1016/s0166-0934(03)00038-7. [DOI] [PubMed] [Google Scholar]
- 16.Coiras MT, Aguilar JC, Garcia ML. Simultaneous detection of fourteen respiratory viruses in clinical specimens by two multiplex reverse transcription nested-PCR assays. J Med Virol. 2004;72:484–495. doi: 10.1002/jmv.20008. [DOI] [PMC free article] [PubMed] [Google Scholar]
- 17.Cote S, Abed Y, Boivin G. Comparative evaluation of real-time PCR assays for detection of the human metapneumovirus. J Clin Microbiol. 2003;41:3631–3635. doi: 10.1128/JCM.41.8.3631-3635.2003. [DOI] [PMC free article] [PubMed] [Google Scholar]
- 18.Grondahl B, Puppe W, Hoppe A. Rapid identification of nine microorganisms causing acute respiratory tract infections by single-tube multiplex reverse transcription-PCR: feasibility study. J Clin Microbiol. 1999;37:1–7. doi: 10.1128/jcm.37.1.1-7.1999. [DOI] [PMC free article] [PubMed] [Google Scholar]
- 19.Templeton KE, Scheltinga SA, Beersma MF. Rapid and sensitive method using multiplex real-time PCR for diagnosis of infections by influenza a and influenza B viruses, respiratory syncytial virus, and parainfluenza viruses 1, 2, 3, and 4. J Clin Microbiol. 2004;42:1564–1569. doi: 10.1128/JCM.42.4.1564-1569.2004. [DOI] [PMC free article] [PubMed] [Google Scholar]
- 20.Vijgen L, Keyaerts E, Moes E. Development of one-step, real-time, quantitative reverse transcriptase PCR assays for absolute quantitation of human coronaviruses OC43 and 229E. J Clin Microbiol. 2005;43:5452–5456. doi: 10.1128/JCM.43.11.5452-5456.2005. [DOI] [PMC free article] [PubMed] [Google Scholar]
- 21.Xu W, McDonough MC, Erdman DD. Species-specific identification of human adenoviruses by a multiplex PCR assay. J Clin Microbiol. 2000;38:4114–4120. doi: 10.1128/jcm.38.11.4114-4120.2000. [DOI] [PMC free article] [PubMed] [Google Scholar]
- 22.Xu W, Erdman DD. Type-specific identification of human adenovirus 3, 7, and 21 by a multiplex PCR assay. J Med Virol. 2001;64:537–542. doi: 10.1002/jmv.1083. [DOI] [PubMed] [Google Scholar]
- 23.American Thoracic Society Standardization of spirometry, 1994 update. Am J Respir Crit Care Med. 1995;152:1107–1136. doi: 10.1164/ajrccm.152.3.7663792. [DOI] [PubMed] [Google Scholar]
- 24.Ip MS, Ko FW, Lau AC. Updated spirometric reference values for adult Chinese in Hong Kong and implications on clinical utilization. Chest. 2006;129:384–392. doi: 10.1378/chest.129.2.384. [DOI] [PubMed] [Google Scholar]
- 25.Seemungal T, Harper-Owen R, Bhowmik A. Respiratory viruses, symptoms, and inflammatory markers in acute exacerbations and stable chronic obstructive pulmonary disease. Am J Respir Crit Care Med. 2001;164:1618–1623. doi: 10.1164/ajrccm.164.9.2105011. [DOI] [PubMed] [Google Scholar]
- 26.Rohde G, Wiethege A, Borg I. Respiratory viruses in exacerbations of chronic obstructive pulmonary disease requiring hospitalisation: a case-control study. Thorax. 2003;58:37–42. doi: 10.1136/thorax.58.1.37. [DOI] [PMC free article] [PubMed] [Google Scholar]
- 27.Cameron RJ, de Wit D, Welsh TN. Virus infection in exacerbations of chronic obstructive pulmonary disease requiring ventilation. Intensive Care Med. 2006;32:1022–1029. doi: 10.1007/s00134-006-0202-x. [DOI] [PMC free article] [PubMed] [Google Scholar]
- 28.Tan WC, Xiang X, Qiu D. Epidemiology of respiratory viruses in patients hospitalized with near-fatal asthma, acute exacerbations of asthma, or chronic obstructive pulmonary disease. Am J Med. 2003;115:272–277. doi: 10.1016/s0002-9343(03)00353-x. [DOI] [PubMed] [Google Scholar]
- 29.Dominici F, Peng RD, Bell ML. Fine particulate air pollution and hospital admission for cardiovascular and respiratory diseases. JAMA. 2006;295:1127–1134. doi: 10.1001/jama.295.10.1127. [DOI] [PMC free article] [PubMed] [Google Scholar]
- 30.Medina-Ramon M, Zanobetti A, Schwartz J. The effect of ozone and PM10 on hospital admissions for pneumonia and chronic obstructive pulmonary disease: a national multicity study. Am J Epidemiol. 2006;163:579–588. doi: 10.1093/aje/kwj078. [DOI] [PubMed] [Google Scholar]
- 31.Wilkinson TM, Hurst JR, Perera WR. Effect of interactions between lower airway bacterial and rhinoviral infection in exacerbations of COPD. Chest. 2006;129:317–324. doi: 10.1378/chest.129.2.317. [DOI] [PMC free article] [PubMed] [Google Scholar]
- 32.Gern JE, Galagan DM, Jarjour NN. Detection of rhinovirus RNA in lower airway cells during experimentally induced infection. Am J Respir Crit Care Med. 1997;155:1159–1161. doi: 10.1164/ajrccm.155.3.9117003. [DOI] [PubMed] [Google Scholar]
- 33.Fleming HE, Little FF, Schnurr D. Rhinovirus-16 colds in healthy and in asthmatic subjects: similar changes in upper and lower airways. Am J Respir Crit Care Med. 1999;160:100–108. doi: 10.1164/ajrccm.160.1.9808074. [DOI] [PubMed] [Google Scholar]
- 34.Papadopoulos NG, Bates PJ, Bardin PG. Rhinoviruses infect the lower airways. J Infect Dis. 2000;181:1875–1884. doi: 10.1086/315513. [DOI] [PubMed] [Google Scholar]
- 35.Center for Health Protection, Government of the Hong Kong Special Administrative Region. Monthly summary tables of influenza virus isolation 2006. Available at: http://www.chp.gov.hk/data.asp?lang=en & cat=5&dns_sumlD=223&id=292&pid=44&ppid=26. Accessed July 25, 2007
- 36.Center for Health Protection, Government of Hong Kong Special Administration Region. Monthly consultation rates of influenza-like illness reported by general out-patient clinics and general practitioners 2006. Available at: http://www.chp.gov.hk/data.asp?lang=en&cat=5 & dns_sumlD=215 & id=292&pid=44&ppid=26. Accessed July 25, 2007
- 37.Thompson WW, Shay DK, Weintraub E. Influenza-associated hospitalizations in the United States. JAMA. 2004;292:1333–1340. doi: 10.1001/jama.292.11.1333. [DOI] [PubMed] [Google Scholar]
- 38.Thompson WW, Shay DK, Weintraub E. Mortality associated with influenza and respiratory syncytial virus in the United States. JAMA. 2003;289:179–186. doi: 10.1001/jama.289.2.179. [DOI] [PubMed] [Google Scholar]
- 39.Beckham JD, Cadena A, Lin J. Respiratory viral infections in patients with chronic, obstructive pulmonary disease. J Infect. 2005;50:322–330. doi: 10.1016/j.jinf.2004.07.011. [DOI] [PMC free article] [PubMed] [Google Scholar]
- 40.Greenberg SB, Allen M, Wilson J. Respiratory viral infections in adults with and without chronic obstructive pulmonary disease. Am J Respir Crit Care Med. 2000;162:167–173. doi: 10.1164/ajrccm.162.1.9911019. [DOI] [PubMed] [Google Scholar]
- 41.Rohde G, Borg I, Arinir U. Relevance of human metapneumovirus in exacerbations of COPD. Respir Res. 2005;6:150. doi: 10.1186/1465-9921-6-150. [DOI] [PMC free article] [PubMed] [Google Scholar]
- 42.Martinello RA, Esper F, Weibel C. Human metapneumovirus and exacerbations of chronic obstructive pulmonary disease. J Infect. 2006;53:248–254. doi: 10.1016/j.jinf.2005.11.010. [DOI] [PMC free article] [PubMed] [Google Scholar]
- 43.Smith CB, Golden CA, Kanner RE. Association of viral andMycoplasma pneumoniaeinfections with acute respiratory illness in patients with chronic obstructive pulmonary diseases. Am Rev Respir Dis. 1980;121:225–232. doi: 10.1164/arrd.1980.121.2.225. [DOI] [PubMed] [Google Scholar]
- 44.Yap FH, Ho PL, Lam KF. Excess hospital admissions for pneumonia, chronic obstructive pulmonary disease, and heart failure during influenza seasons in Hong Kong. J Med Virol. 2004;73:617–623. doi: 10.1002/jmv.20135. [DOI] [PubMed] [Google Scholar]
- 45.Wongsurakiat P, Maranetra KN, Wasi C. Acute respiratory illness in patients with COPD and the effectiveness of influenza vaccination: a randomized controlled study. Chest. 2004;125:2011–2020. doi: 10.1378/chest.125.6.2011. [DOI] [PubMed] [Google Scholar]
- 46.Govaert TM, Thijs CT, Masurel N. The efficacy of influenza vaccination in elderly individuals: a randomized double-blind placebo-controlled trial. JAMA. 1994;272:1661–1665. [PubMed] [Google Scholar]
- 47.Nichol KL, Margolis KL, Wuorenma J. The efficacy and cost effectiveness of vaccination against influenza among elderly persons living in the community. N Engl J Med. 1994;331:778–784. doi: 10.1056/NEJM199409223311206. [DOI] [PubMed] [Google Scholar]
- 48.Falsey AR, Formica MA, Hennessey PA. Detection of respiratory syncytial virus in adults with chronic obstructive pulmonary disease. Am J Respir Crit Care Med. 2006;173:639–643. doi: 10.1164/rccm.200510-1681OC. [DOI] [PMC free article] [PubMed] [Google Scholar]
- 49.Mallia P, Johnston SL. How viral infections cause exacerbation of airway diseases. Chest. 2006;130:1203–1210. doi: 10.1378/chest.130.4.1203. [DOI] [PMC free article] [PubMed] [Google Scholar]