Abstract
Oncogenes are commonly amplified on extrachromosomal DNA particles (ecDNA) in cancer1,2, but our understanding of the structure of ecDNA and its impact on gene regulation is limited. We integrated ultrastructural imaging, long range-optical mapping, and computational analysis of whole genome sequencing, demonstrating circular ecDNA. Pan-cancer analyses reveal that oncogenes encoded on ecDNA are among the most highly expressed genes in the tumours’ transcriptome, linking elevated copy with high transcription levels. Quantitative assessment of chromatin state reveals that while ecDNA is chromatinized with intact domain structure, it lacks higher order compaction typical of chromosomes and displays significantly enhanced chromatin accessibility. ecDNA is further shown to have significantly enhanced ultra-long-range active chromatin contacts, providing new insight into how circular ecDNA structure impacts oncogene function, bridging ecDNA biology with modern cancer genomics and epigenetics.
DNA encodes information not only in its sequence, but also in its shape. The human genome is segmented into chromosomes that are made of chromatin fibres folded into dynamic, hierarchical structures3,4. This spatial architecture, including numerous loops of chromatin, brings distant elements into proximity and organizes transcriptional activities into distinct compartments, restricting DNA’s accessibility to the regulatory and transcriptional machinery. In cancer, this chromatin landscape is profoundly altered5,6. Extrachromosomal DNA (ecDNA) carrying amplified oncogenes was recently shown to be widespread in cancer1, complementing the diversity of non-chromosomal DNA elements7,8. ecDNA differs from the kilobase size circular DNA found in healthy somatic tissues2,7,8, because ecDNA are 100–1,000 times larger and are highly amplified, raising challenging questions about ecDNA topology and how it might affect transcriptional and epigenetic regulation in cancer.
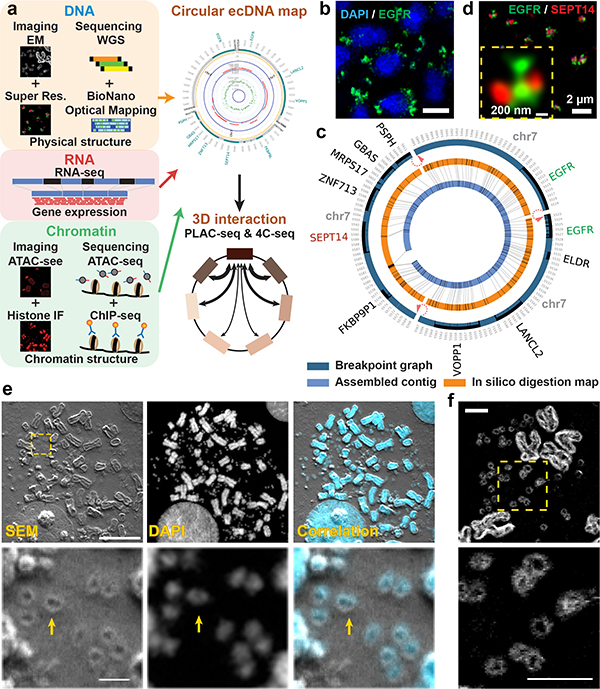
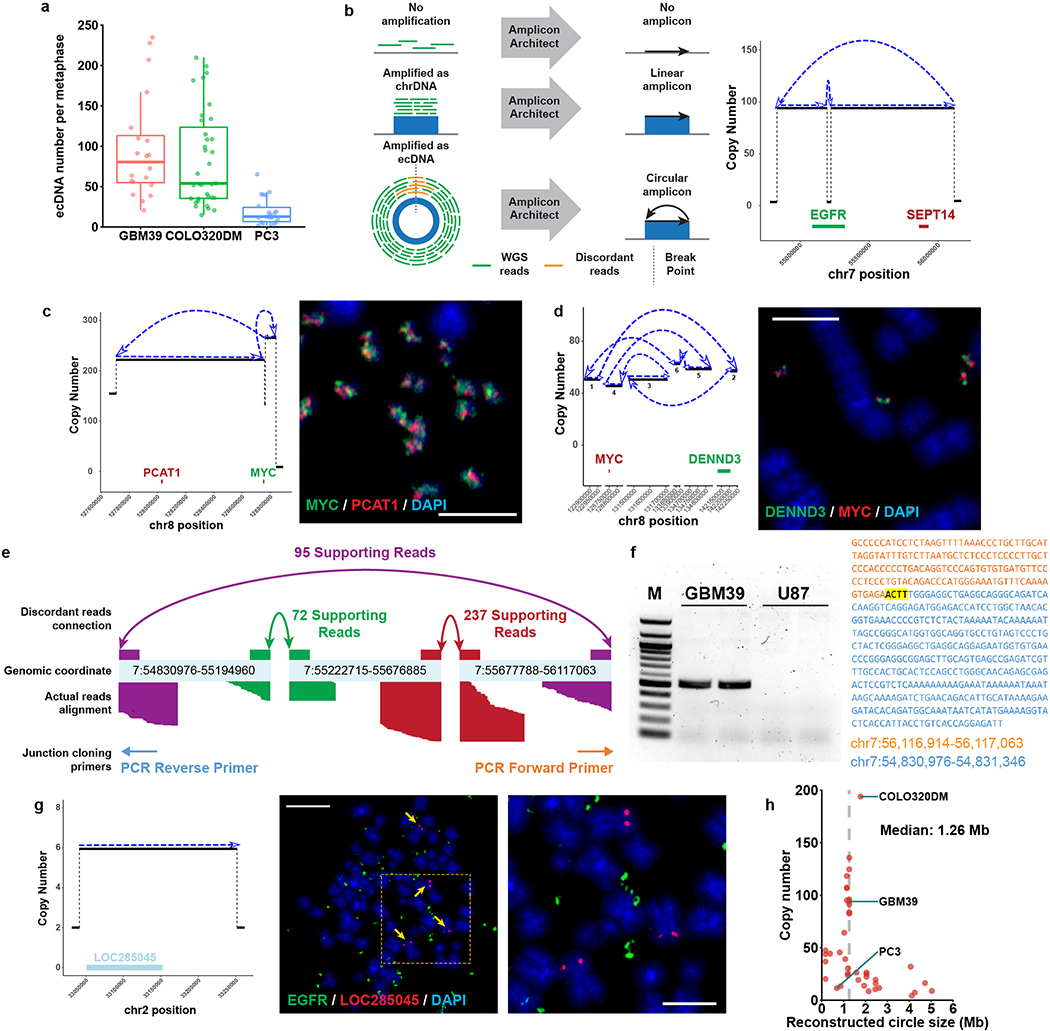
To understand ecDNA structure, transcription and chromatin organization, we studied three human cancer cell lines (Extended Data Fig. 1a) and clinical tumour samples from The Cancer Genome Atlas (TCGA), by integrating imaging and sequencing approaches (Fig. 1a). Previously, we used whole genome sequencing (WGS) to resolve ecDNA structure, deploying a computational tool, AmpliconArchitect (AA)1,9, that classifies amplicons as circular or linear (Supplementary table 1). Circular amplicons in GBM39 cells detected by this approach were confirmed to be extrachromosomal by fluorescence in situ hybridization (FISH) of tumour cells in metaphase (Fig. 1b, Extended Data Fig. 1b–d). The reconstructed circular amplicon structure was supported by many paired-end discordant junctional reads and validated by Sanger sequencing (Extended Data Fig 1e–f). Genes detected on linear amplicons were found on chromosomal DNA (chrDNA; Extended Data Fig. 1g). Reconstruction of 41 circular amplicons from 37 human cancer cell lines1 revealed amplicon sizes ranged from 168 Kb to 5 Mb, with a median of 1.26 Mb (Extended Data Fig. 1h).
Figure 1 |. ecDNA physical structure is circular.
a, Global workflow to characterize the structure and function of ecDNA.
b, Representative EGFR FISH in GBM39 cells (scale bar: 5 μm).
c, Composite breakpoint graph generated by AmpliconArchitect, in silico digestion map and the assembled contig from BioNano optical mapping of GBM39 ecDNA. Red arrows indicate breakpoints connected by discordant paired-end WGS reads.
d, Double FISH of EGFR and SEPT14 identified from c.
e, Correlated SEM and confocal light microscopy of chromosomal and ecDNA in COLO320DM cells (scale bar: upper, 10 μm; lower: 1 μm).
f, SEM back scatter in COLO320DM cells (scale bar: 2 μm).
All imaging experiments were repeated at least for 3 times, with each replicate showing similar results.
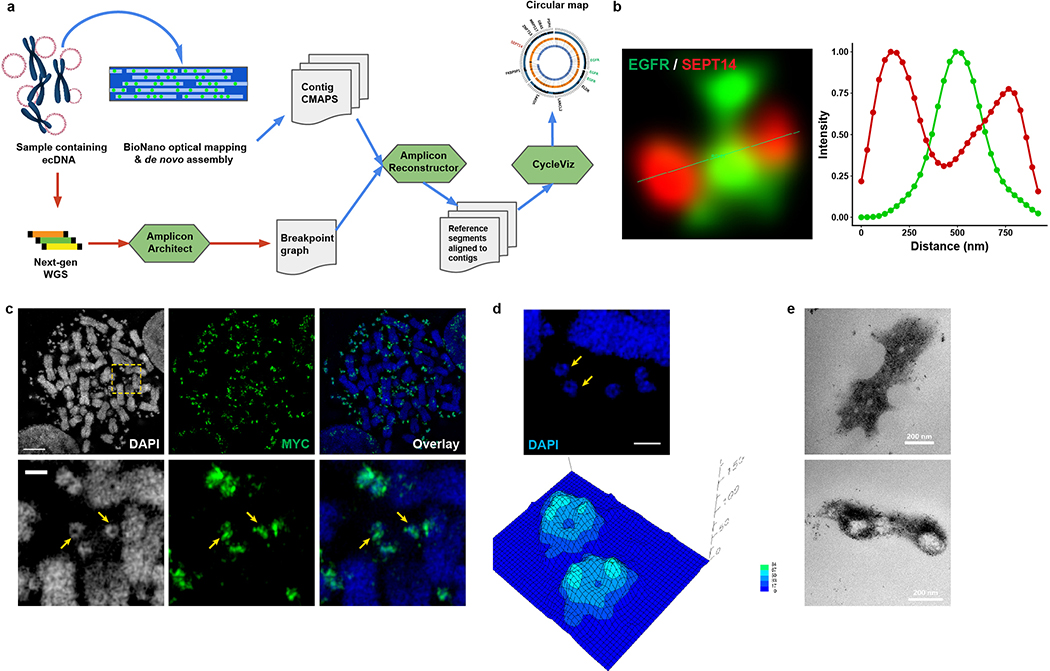
AA infers a shape based on computational reconstruction of short, paired-end reads (100–200 bp), but does not unambiguously place large duplications in the structure. To augment our understanding of ecDNA shape based on its sequence, we integrated optical mapping of long-range reads (~160,000 bp) of DNA, using the BioNano technology platform, which permits the development of a physical map based on long contiguous pieces of DNA10,11. We developed a new tool, AmpliconReconstructor, to integrate the optical mapping contigs with AA based WGS-reconstructions, resolving a 1.3 MB circular, contiguous ecDNA molecule in GBM39 cells (Fig. 1c, Extended Data Fig. 2a). Individual genes on the amplicon were visualized by super resolution (SR) confocal microscopy (Fig. 1e, Extended Data Fig. 2b).
To directly visualize ecDNA architecture, we captured images of COLO320DM cells containing MYC ecDNA (Extended Data Fig. 2c), using SR 3D structured illumination microscopy (3D-SIM)12, revealing circular ecDNA particles (Extended Data Fig. 2d). To obtain more definitive evidence, we performed scanning and transmission electron microscopy (SEM and TEM). Correlative Light and Electron Microscopy analysis of COLO320DM cells, whose larger size ecDNA (Extended Data Fig. 1h) was advantageous for visualization, demonstrated that DAPI (4′,6-diamidino-2-phenylindole) stained ecDNAs are circular (Fig. 1e–f). TEM analysis in GBM39 cells independently confirmed circular ecDNAs, including classical double minutes13,14 (Extended Data Fig. 2e). Taken together, these results using DNA sequencing, optical mapping, super resolution 3D-SIM, SEM, and TEM demonstrate that these ecDNAs studied here are circular.
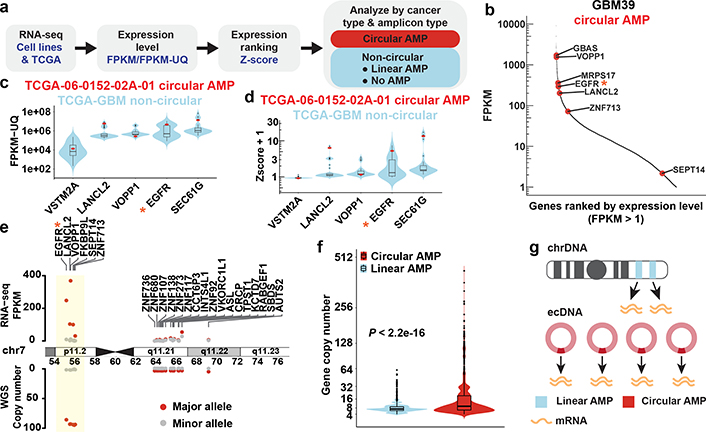
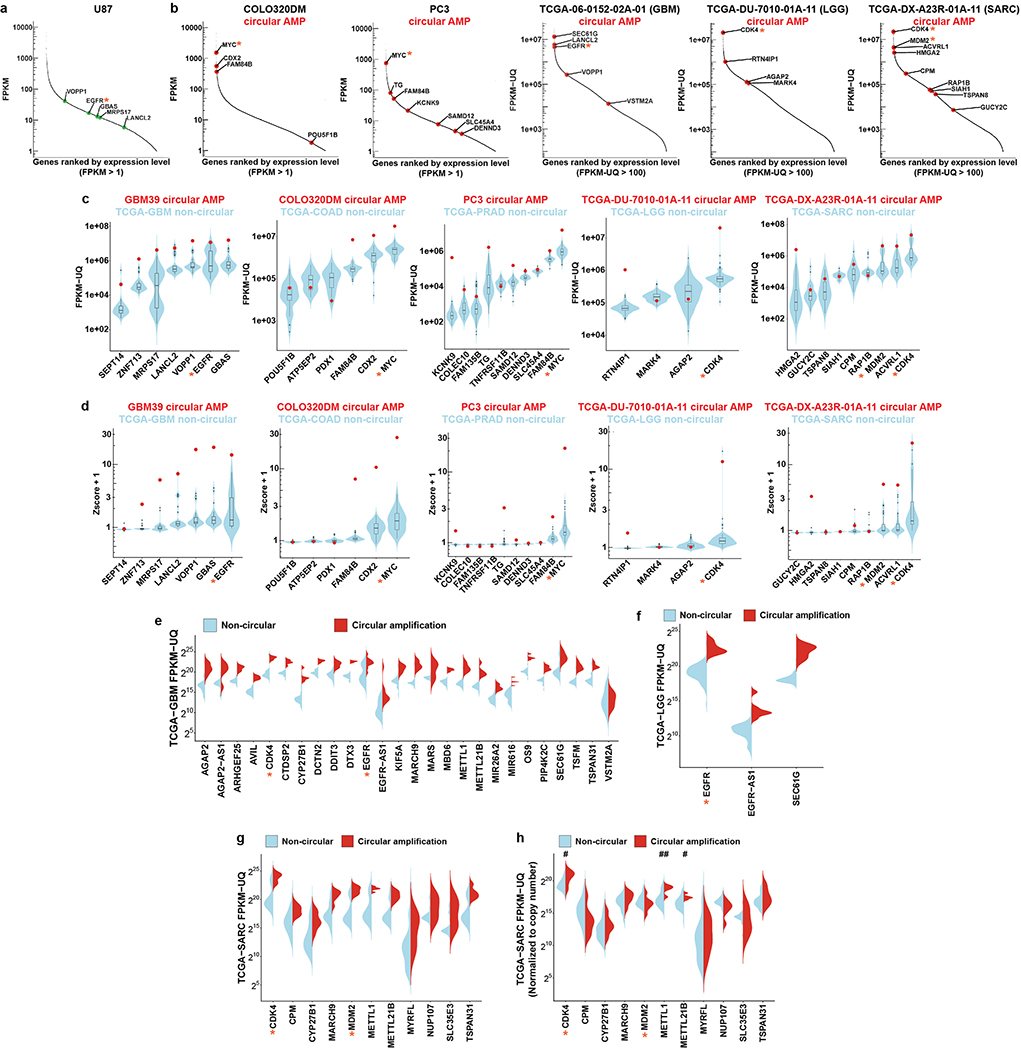
To determine the impact on transcription, we integrated RNA-seq with WGS from cancer cell lines and from TCGA clinical tumour samples of diverse histological types, revealing that genes encoded on ecDNA, particularly bona fide oncogenes, are among the most highly expressed genes in cancer genomes (Fig. 2a–b, Extended Data Fig. 3a–b). Using our AA-based approach to determine if specific genes are amplified on circular ecDNA, we found that in cancer cell lines and clinical tumour samples, oncogenes amplified on ecDNA have significantly increased transcription compared to the same genes when they are not amplified by circularization (Fig. 2c–d, Extended Data Fig. 3c–g). We searched for single nucleotide polymorphisms in the WGS and RNA-seq data that permitted us to distinguish between transcription from genes on ecDNA and from their native chromosomal loci, revealing massively elevated transcription from genes encoded on ecDNAs (Fig. 2e). In fact, oncogenes encoded on ecDNA, including EGFR, MYC, CDK4 and MDM2, are among the top 1% of genes expressed in the cancer genomes (Fig. 2b, Supplementary table 2).
Figure 2 |. ecDNA drives high levels of RNA expression.
a, Workflow of RNA-seq data analysis.
b, ecDNA gene expression within the transcriptome of GBM39 cells. Red dots: genes on ecDNA (circular amplification).
c, ecDNA gene expression in one TCGA-GBM sample (red data points) compared to non-circular genes in the TCGA-GBM cohort (violin and box plot distribution, N = 36 biologically independent samples).
d, Z-score of the gene expression plotted in c. Z-scores plotted as +1.
e, Allele-specific gene copy number and mRNA expression level in GBM39 cells. Circular amplified region (ecDNA) was highlighted.
f, Gene copy number comparing circular and linear amplifications (8068 circular and 6247 linear amplified genes from 77 samples, two-sided Wilcoxon test).
g, Depiction of the mechanism of massive transcript levels from ecDNA.
* indicates key oncogenes. Violin plots show the overall distribution of data points. Boxplots show median, upper and lower quartiles; whiskers indicate 1.5x interquartile range, and black points are the outliers.
The amount of RNA transcribed can be related to the amount of available DNA template. We hypothesized that the massively elevated oncogene transcription on ecDNA is likely driven by their increased DNA copy number15 (Extended Data Fig. 3g–h). Accordingly, oncogenes amplified on ecDNA were shown to achieve far higher copy number than the same genes amplified on linear structures (Fig. 2f–g). However, the amount of DNA template is not the only factor that determines gene transcription. Chromatin organization influences DNA’s accessibility to the regulatory machinery of transcription4,16. In some cases, oncogenes on ecDNA produced more transcripts, even when normalized to gene copy number (Extended Data Fig. 3g–h). We initiated a deeper examination of other chromatin structural features that may contribute to the massively elevated expression of oncogenes amplified on ecDNA.
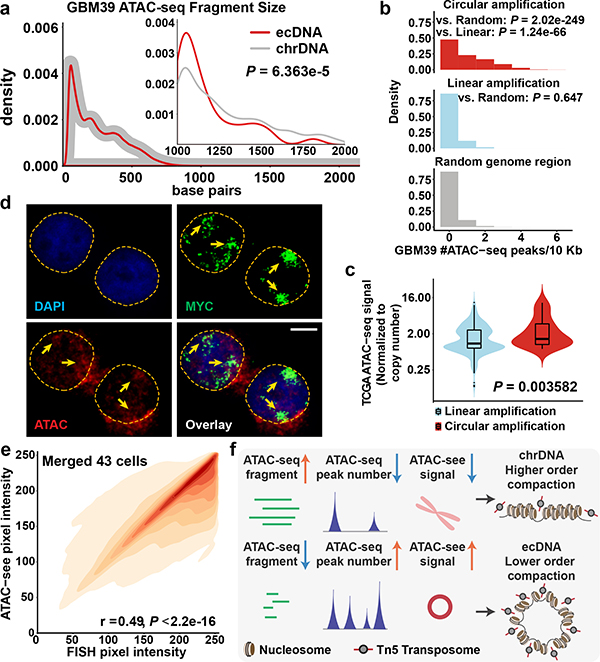
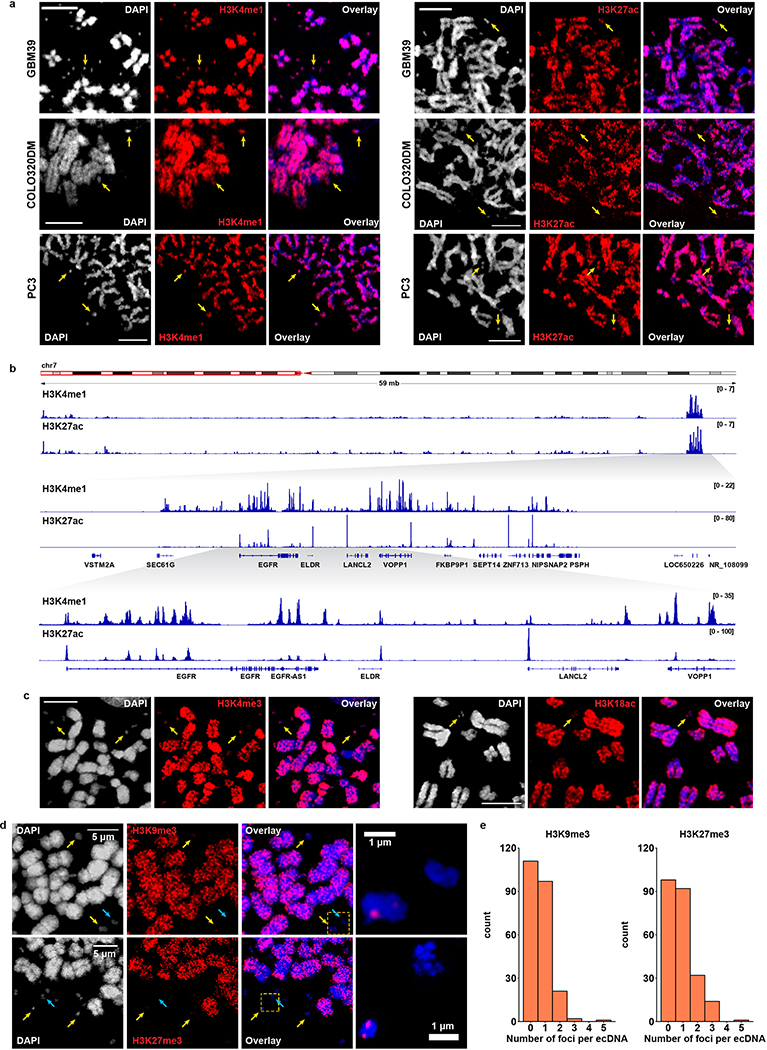
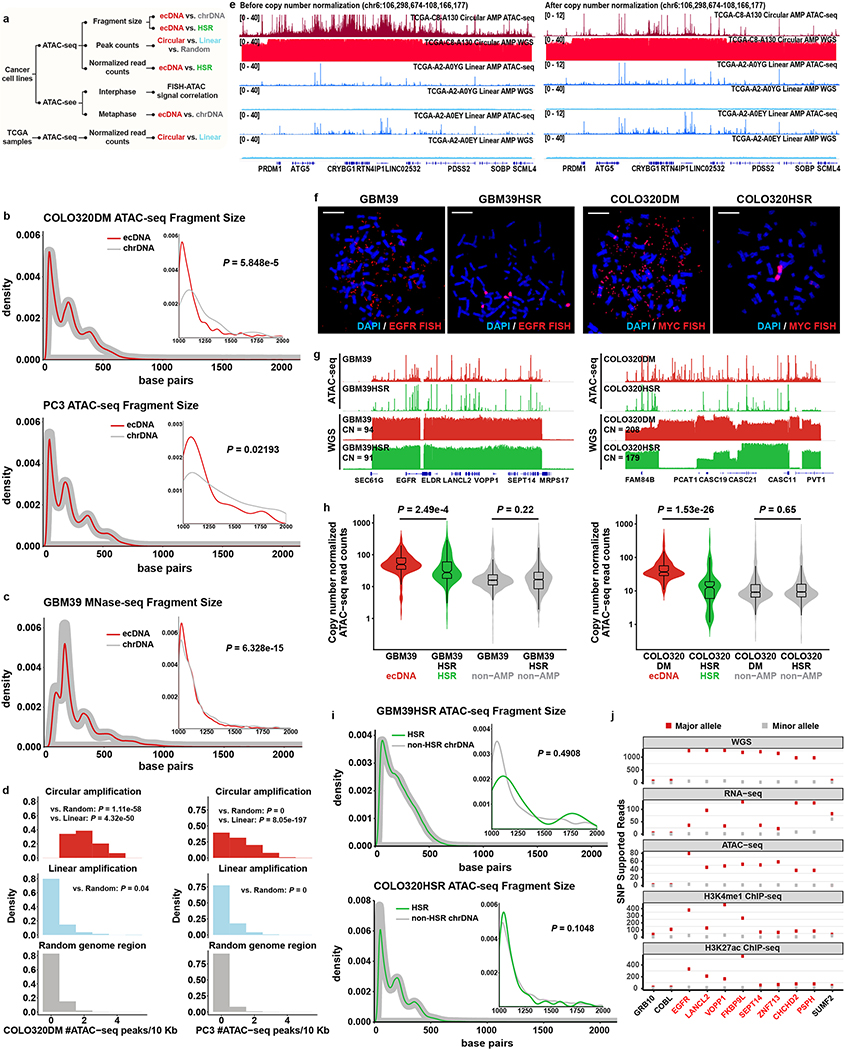
Most of the human genome is not transcribed in a given cell because it is tightly wound around histone octamers which in turn are packed into complex hierarchical structures, rendering the DNA inaccessible to transcription factors and the transcription machinery17,18. We used complementary approaches to resolve the ecDNA chromatin landscape. First, we analyzed active and repressive histone marks by immunofluorescence analysis of cancer cells in metaphase and also performed H3K4me1/H3K27ac ChIP-seq analyses of actively cycling GBM39 cells, revealing the presence of active histone marks on ecDNA19 (Extended Data Fig. 4a–c), and a concomitant paucity of repressive histone mark on GBM39 ecDNA (Extended Data Fig. 4d–e). Second, we deployed the Assay for Transposase Accessible Chromatin using sequencing (ATAC-seq) and Micrococcal Nuclease digestion and sequencing (MNase-seq) to assess chromatin accessibility and to map nucleosome positions. Finally, we employed ATAC-see to directly visualize accessible chromatin20 (Extended Data Fig. 5a). The periodic lengths distribution of DNA fragments generated by ATAC-seq and MNase-seq, demonstrated that ecDNA is chromatinized, comprised of nucleosome units (Fig. 3a, Extended Data Fig. 5b–c). However, ecDNA displayed a significant deficit in the number of long fragments (>1200 bp) from ATAC-seq and MNase-seq, indicative of compacted nucleosomal arrays (Fig. 3a and Extended Data Fig. 5b–c), and a significantly increased number of ATAC-seq peaks (Fig. 3b and Extended Fig. 5d), suggesting that the ecDNA chromatin landscape is more accessible than chrDNA, because its nucleosomal organization is less compacted.
Figure 3 |. The chromatin landscape of ecDNA.
a, Global and long (> 1 Kb) ATAC-seq fragment size distribution of ecDNA and chrDNA (110 ecDNA and 1,571 chrDNA long fragments. Two-sided KS test. N = 2 biologically independent samples, showing 1 of the representative result.).
b, ATAC-seq peak number per 10 Kb in GBM39 cells (Circular, 714 windows; Linear, 268 windows; Random, 313,762 windows. N = 2 biologically independent samples. Kruskal-Wallis test.).
c, TCGA ATAC-seq read counts normalized by copy number (Z-test; Circular: 8 samples, 33 amplicons; Linear: 7 samples, 476 amplicons). Violin plots show the overall distribution of data points. Boxplots show median, upper and lower quartiles; whiskers indicate 1.5x interquartile range, and black points are the outliers.
d, ATAC-see and FISH signal co-localisation in interphase cell nuclei in COLO320DM cells (scale bar: 5 μm).
e, Pearson correlation of FISH and ATAC-see signal pixel intensity, merged from 43 COLO320DM single cells in interphase.
f, Depiction and interpretation of integrated technologies to assess chromatin compaction.
The recent landmark study deciphering the chromatin accessibility landscape in primary cancer samples5 enabled us to examine chromatin accessibility in authentic clinical samples. By integrating ATAC-seq profiles with WGS data analyzed by AA, we found a significantly higher ATAC-seq signal in the DNA with predicted circular amplicons in clinical tumour samples, even after normalizing for DNA copy number (Fig. 3c, Extended Data Fig. 5e). Even in isogenic cell lines, ecDNA is more accessible compared to the same locus amplified as homogeneous staining region (HSR)21 on chromosomes (Extended Data Fig. 5f–h). Notably, the HSR region did not show a deficit in number of long ATAC-seq fragments as compared to ecDNA (Extended Data Fig. 5i). We further validated that both the enhanced chromatin accessibility and active chromatin states are linked to the elevated transcription from the allele contained on highly amplified ecDNA (Extended Data Fig. 5j).
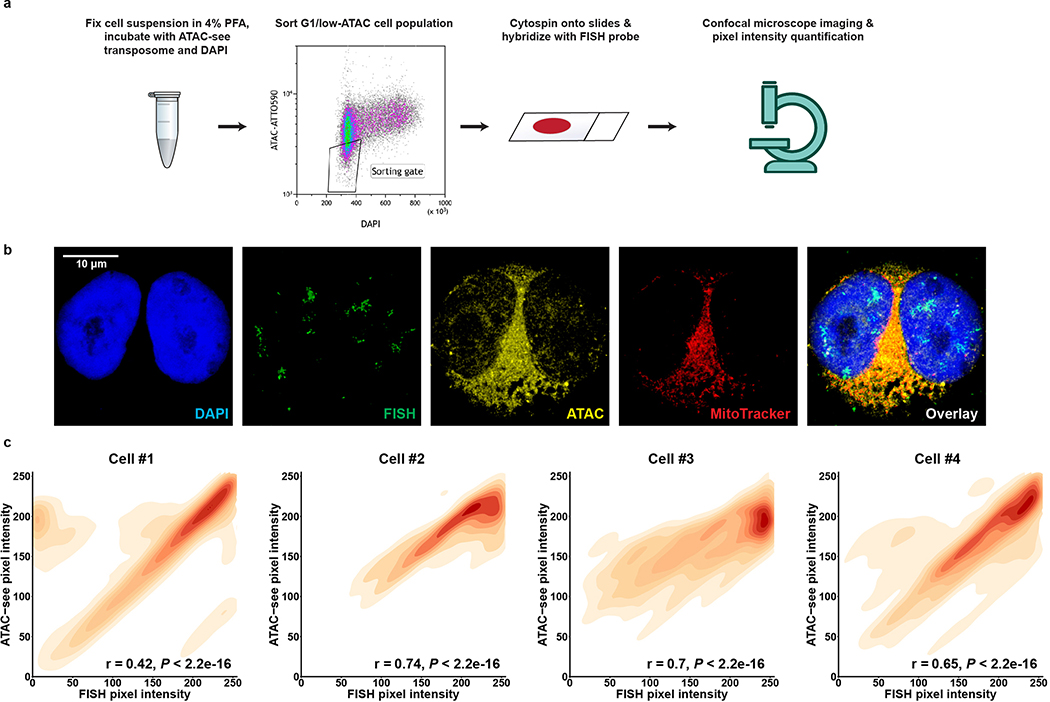
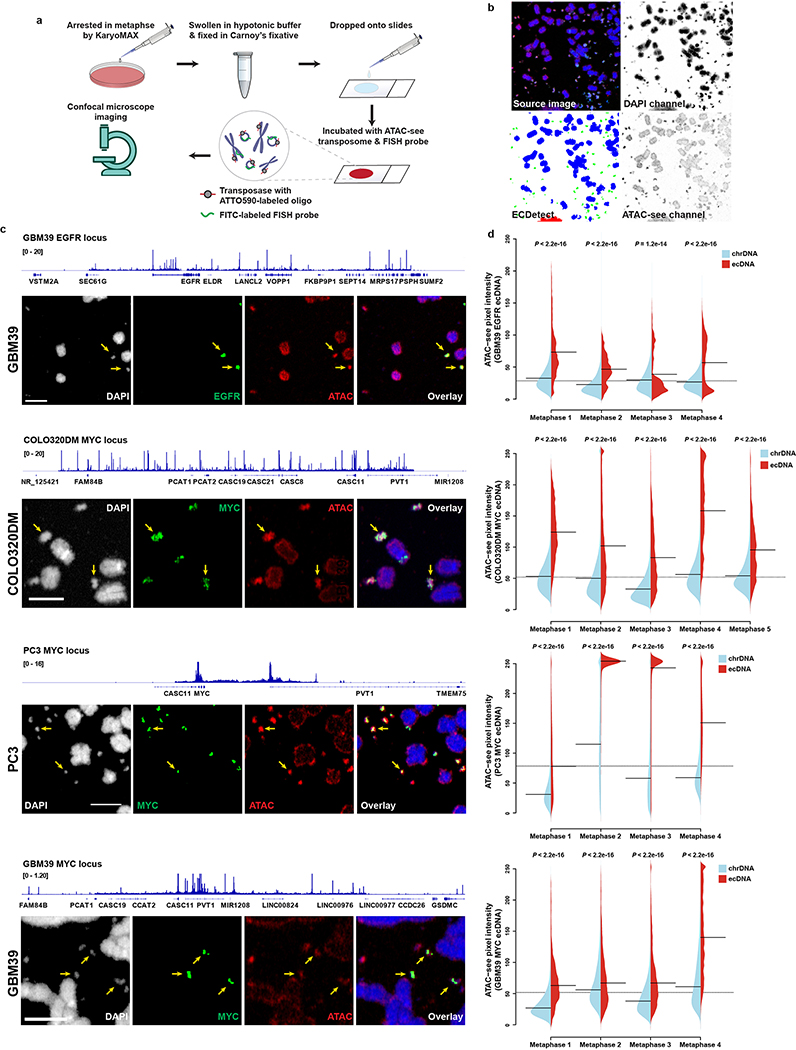
We then applied the ATAC-see technology to analyze accessible chromatin in actively cycling cells in interphase by staining COLO320DM cells with ATAC-see and DAPI to label accessible chromatin and DNA, respectively, and to permit sorting of tumor cells in early G1 phase20, followed by MYC-FISH to label ecDNAs. A striking positive correlation between ecDNA-containing MYC FISH signal and ATAC-see signal was seen, demonstrating highly accessible chromatin of ecDNA at single cell resolution (Fig. 3d–e, Extended Data Fig. 6a–c). ecDNA remained similarly accessible during metaphase (Extended Data Fig. 7a–d). Together, these data demonstrated that some of the most accessible chromatin in the genome of cancer cells resides on ecDNA, possibly due to the lower level of chromatin compaction (Fig. 3f). In fact, ATAC-see enabled us to identify unanticipated MYC ecDNAs in GBM39 cells because of their high signal, which was subsequently confirmed by ATAC-seq and WGS (Extended Data Fig. 7c, Supplementary table 1).
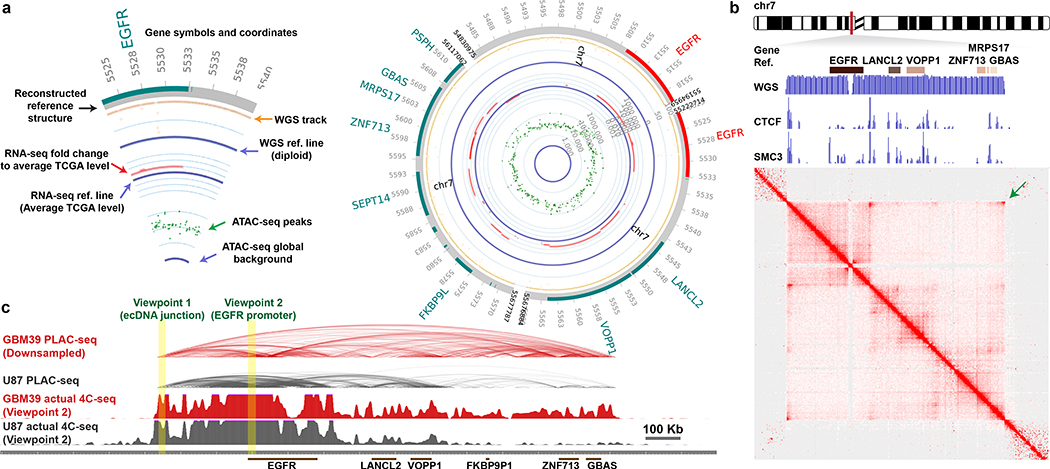
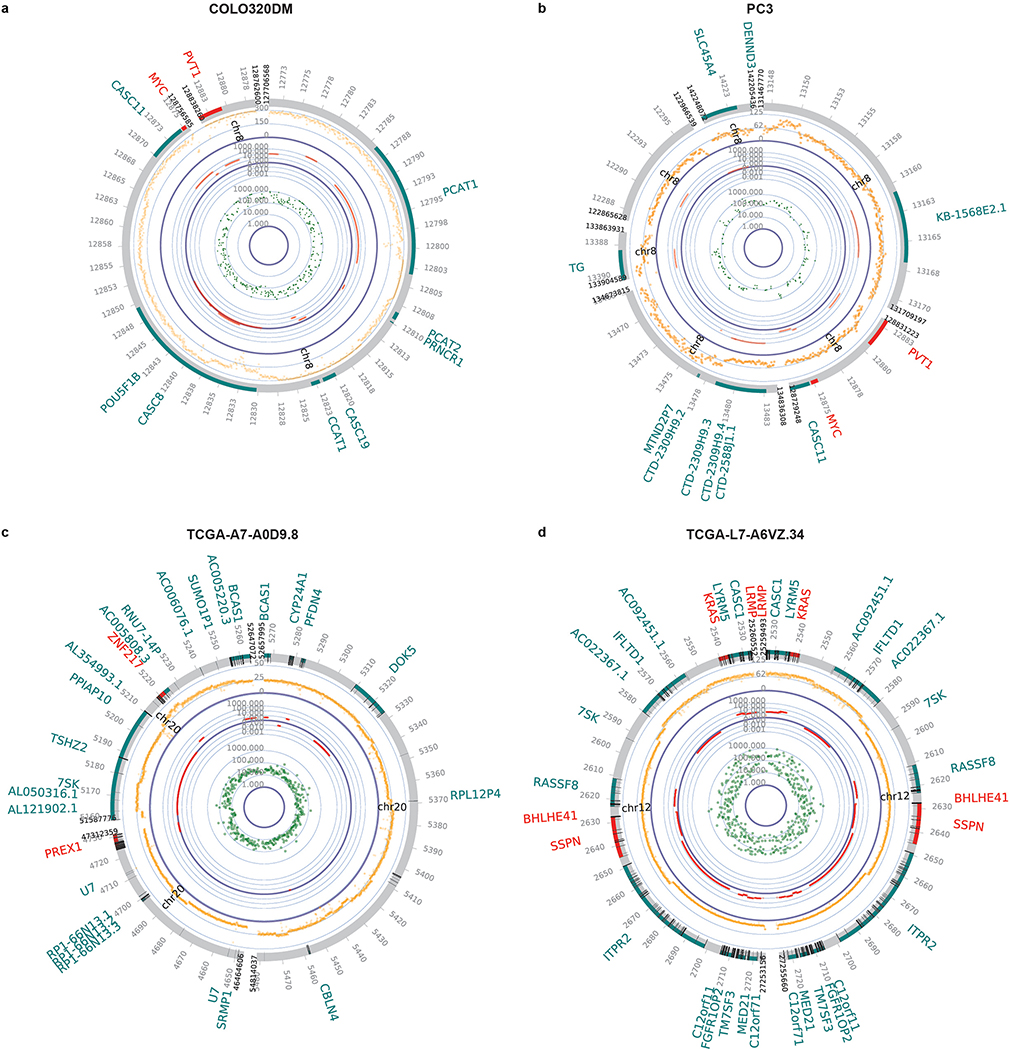
To contextualize these genetic, transcriptional, and epigenetic features, we generated circular maps of ecDNA in cancer cell lines and primary tumour samples (Fig. 4a, Extended Data Fig. 8). These topologically informed maps highlighted the high DNA copy, high levels of transcription particularly of its constituent oncogenes, and high accessibility of its chromatin, bridging ecDNA circular structure with biological function. ecDNAs within a tumour can also vary in the size and composition (i.e. sequence), even when they contain the same oncogene. In GBM39 cells, the structure of EGFR-containing ecDNAs are uniform (Extended Data Fig. 9). Consequently, the WGS trace in its circular map is relatively uniform (Fig. 4a). In contrast, COLO320DM and PC3 cells contain diverse MYC-containing ecDNA populations, resulting in a more heterogenous WGS trace in the circular ecDNA plots (Extended Data Fig. 8a,b & 9).
Figure 4 |. Circularization of ecDNA enables distal DNA interaction.
a, Circular plot of ecDNA structure in GBM39 cells. Plot legend (left).
b, H3K27ac anchored active chromatin interaction heatmap by PLAC-seq/HiChIP in GBM39 cells. WGS depicts the ecDNA amplicon. ChIP-seq demonstrates CTCF and SMC3 binding to ecDNA. Arrow indicates the increased corner reads in ecDNA junction.
c, Composite view of PLAC-seq/HiChIP and actual 4C-seq. Virtual and actual 4C-seq viewpoints were highlighted.
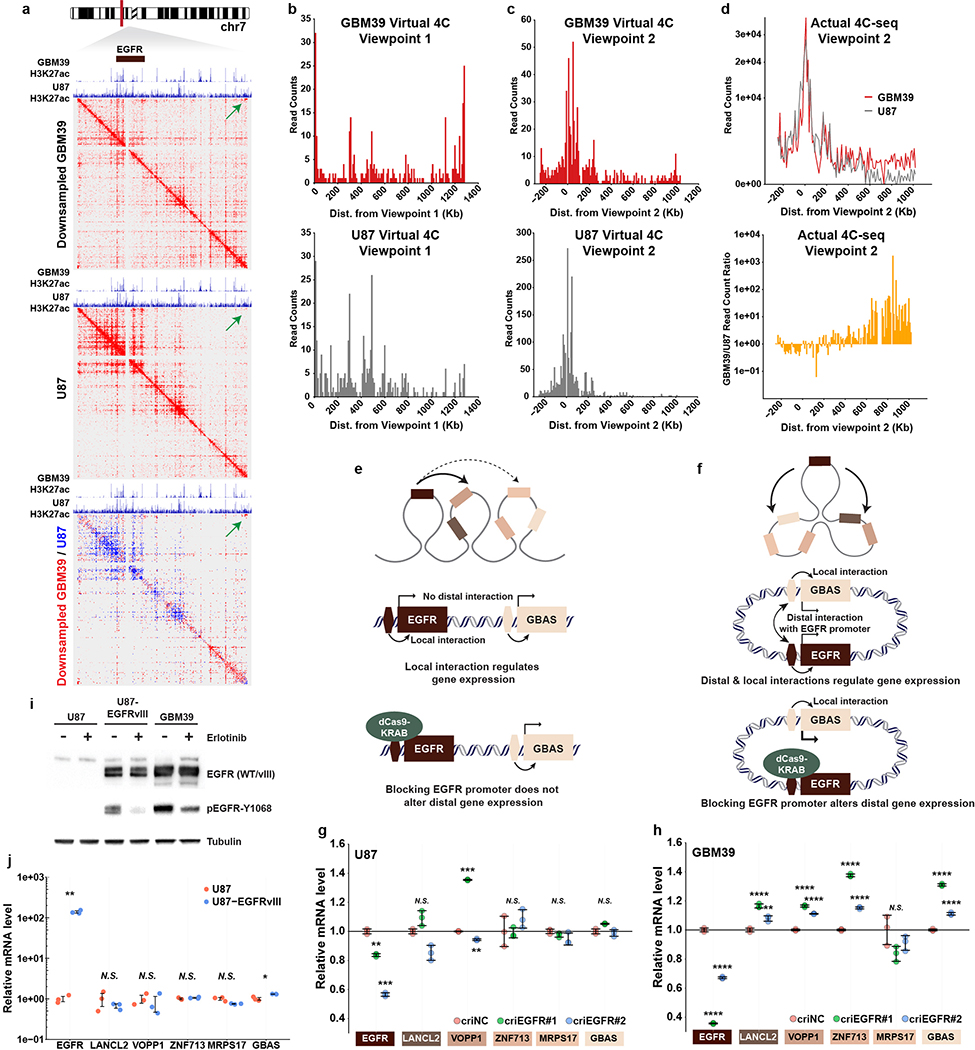
We performed Proximity Ligation-Assisted ChIP-seq22 (PLAC-seq, a.k.a. HiChIP23) to map the chromatin 3D interactions genome-wide anchored at DNA bound by histone with H3K27ac modification in GBM39 cells. We also conducted Circular Chromosome Conformation Capture combined with high-throughput sequencing (4C-seq) to provide an independent assessment of chromatin contacts in GBM39 cells. Together with CTCF and cohesin subunit protein SMC3 ChIP-seq to examine the locations of factors important for chromatin domain organization24, these data revealed: 1) the massive increase of diagonal corner reads on the heatmaps, and the rebound of the virtual 4C signal from ecDNA junction viewpoint, further provide orthogonal evidence to indicate that ecDNA is circular; 2)the binding of CTCF and cohesin demonstrate that ecDNA chromatin is well-organized, indicative of topologically associating domains; 3) downsampling the PLAC-seq/HiChIP reads from the GBM39 ecDNA region to a level comparable to the same region in U87 cells that lack ecDNA, still demonstrated notably increased distal interactions in active chromatin on ecDNA (Fig. 4b–c; Extended Data Fig. 10a–b). Using the EGFR promoter as bait, the virtual 4C and actual 4C-seq independently demonstrated ultra-long-range chromatin contacts that can occur on ecDNA (Extended Data Fig. 10c–d), which could potentially have some effect on distal gene expression, as suggested by CRISPR interference targeting catalytically inactive Cas9 (dCas9) fused to the Krüppel-associated box (KRAB) transcriptional repressor domain to mask the EGFR promoter (Extended Data Fig. 10e–j).
Oncogene amplification on ecDNA is surprisingly prevalent in cancer1,25, and it can dramatically elevate oncogene copy number and drive intratumoural genetic heterogeneity because it lacks centromeres and is subject to unequal segregation1,26. These results demonstrate that ecDNA promotes massively elevated transcription of the oncogenes studied here, due to its elevated DNA copy numbers and in association with enhanced chromatin accessibility, highlighting a new mechanism by which ecDNA contributes to cancer pathogenesis, by altering the shape of its chromatin.
In bacteria, small circular plasmids represent a prevalent and powerful mechanism for rapidly gaining selective advantage 27. We speculate that oncogene-containing circular ecDNA in human cancers represents the conceptual equivalent, highlighting critical gene variants and mechanisms for oncogenesis and therapeutic resistance28–30.
Methods
Cell culture
Human prostate cancer cell line PC3, colon cancer cell line COLO320DM and glioblastoma cell line U87 were purchased from ATCC and cultured in DMEM/F12 with 10% FBS. Human glioblastoma GBM39 tumor spheroid was derived from patient tissue, and cultured in DMEM/F12 with GlutaMAX, B27, 20 ng/ml EGF, 20 ng/ml FGF and 5 μg/ml heparin. All cell-lines were tested negative for mycoplasma.
Metaphase chromosome spread
Cells in metaphase were obtained by KaryoMAX (Gibco) treatment at 0.1 μg/ml for 3 hr (PC3 and COLO320DM) or overnight (GBM39). Cells were washed with PBS and single cells were suspended in 75 mM KCl for 15–30 min. Samples were then fixed by Carnoy’s fixative (3:1 methanol:glacial acetic acid, v/v) and washed an additional three times with fixative before being dropped onto humidified glass coverslips.
FISH
Coverslips containing fixed cells in metaphase were aged overnight, briefly equilibrated by submerging in 2× SSC buffer, followed by dehydration in ascending ethanol series (70%, 85%, 100%) for 2 minutes each. Pre-warmed FISH probes (Empire Genomics) were added onto a slide, and the coverslip was applied and sealed with rubber cement. The FISH probe and sample were co-denatured on a 75°C hotplate for 3 minutes, and hybridization was carried out overnight at 37°C in a humidified chamber. The coverslips were removed and washed in 0.4× SSC at 72°C, followed by a final wash in 2× SSC/ 0.05% Tween-20, 2 minutes each. DNA was stained with DAPI (1 μg/mL; 2 minutes), washed with 2× SSC, mounting medium (VectaShield) was applied and the coverslip was mounted onto a glass slide.
Immunofluorescence on metaphase chromosome
Metaphase cells were obtained similarly by KaryoMAX treatment and KCl swelling. Unfixed cells (2.5–4×10⁴) were spread onto a slide by Cytospin cytocentrifuge (Thermo Scientific). After aging overnight at 4°C, 100 μl primary and secondary antibodies in antibody diluent (DAKO) were applied sequentially onto the samples, with gentle washing by 2× SSC buffer with 0.1% Tween-20. Samples were then fixed by 4% paraformaldehyde in PBS, rinsed and mounted with ProLong Gold antifade mounting media with DAPI (Invitrogen). The primary antibodies are: anti-H3K4me1 (CST 5326), anti-H3K27ac (CST 8173), anti-H3K4me3 (Diagenode C15410003), anti-H3K18ac (Diagenode C15410139), anti-H3K9me3 (Active Motif 39765), anti-H3K27me3 (Active Motif 39155)
Correlative light and electron microscopy
Fixed cells in metaphase were dropped onto Zeiss coverslips with fiducial markings. Images of DAPI-stained cells were captured with a Zeiss 880 Airyscan confocal microscope, and the locations of select cells were stored using the Shuttle and Find feature of the ZEN Black software. To correlate SEM with the DAPI-stained acquired images, the coverslip was briefly washed with ddH2O and stained with 2% uranyl acetate for 2 minutes. The coverslip and holder were then loaded into the SEM and the same previously imaged DAPI-stained cells in metaphase were located using Shuttle and Find with ZEN Blue software. Images were captured using a Zeiss Sigma VP Scanning Electron Microscope and correlated with light microscope images.
Structured illumination microscopy
Cells in metaphase were prepared and dropped onto a glass coverslip. FISH was carried out as described, and images were captured with a GE (formerly Applied Precision) DeltaVision OMX V2 Structured Illumination microscope with a 100x Olympus PlanApo 1.4 NA objective and EMCCD 10MHz camera mode. Structured Illumination reconstructions were performed using Softworx version 6.5.2, Wiener filter for 442 channel was set to 0.0060. Volume renderings were also done with Softworx version 6.5.2 software via the RGB Opacity method preset, and then these were used to generate 3D intensity plots of ecDNA.
Transmission electron microscopy
Cells in metaphase were dropped onto a glass coverslip and fixed in 2% glutaraldehyde / 0.1 M cacodylate buffer. The sample was then stained in a 1% osmium tetroxide in 0.15M cacodylate buffer for 1 hour on ice, followed by 3 washes in 0.1 M cacodylate buffer for 15 minutes each. Cells were then immersed in 2% uranyl acetate in water for 1 hour on ice and dehydrated in a graded series of ethanol (20%, 50%, 70%, 90%, 100%) on ice for 15 minutes each. The sample was then embedded in Durcupan resin and polymerized overnight in a 60°C oven, sectioned at 50–60 nm on a Leica UCT7 ultramicrotome, and picked up on a Formvar and carbon-coated copper grid. Sections were post-stained with 2% uranyl acetate for 5 minutes and Sato’s lead stain for 1 minute. Images were captured at 25 kX using a Jeol 1400Plus TEM equipped with a 16 megapixel Gatan OneView camera.
Confocal microscopy
Immunofluorescence and ATAC-see images were acquired by Zeiss LSM880 Airyscan confocal microscope, using 63× Plan-APOChromat NA 1.4 oil lens. 20–30 Z-stacks (4.78 depth) were taken from each visual field, and Fast Airyscan processing was done by ZEN Black software in 3D mode at default settings [Wiener filter was 3.3, 3.9 and 4.2 for ATAC-see (Red), MYC FISH (Green), and DAPI (Blue), respectively]. Representative images were selected from the Z-stack with best brightness. The gain was 745, 785, and 700 for the Red, Green, and DAPI channels, respectively. The pinhole was automatically opened by the software for Fast Airyscan acquisition, and the pixel dwell time was 0.93 μs with no averaging. Double FISH images were captured with the Leica TCS SP8 confocal microscope. Image processing for highest resolution were obtained by using Leica Lightning Imaging Information Extraction Software. We used the proprietary Adaptive algorithm included in the Lightning software, including the following parameters: the pinhole was set to 0.5 Airy Units, with no cut-off, and 4 iterations were obtained per channel. The effective resolution achieved was 118 nm and was calculated using the half-width at half-max method, and measured from a single FISH signal.
Whole genome sequencing
Genomic DNA was extracted from cells using Qiagen kits. Sequencing libraries were prepared using TruSeq adapters (Illumina) and the KAPA HyperPlus kit, according to manufacturer’s instructions (Kapa Biosystems). Briefly, 250 ng of DNA was used as input and enzyme-fragmented for 12 minutes to obtain mode fragment lengths of 350 bp. KAPA Pure Beads were used for double-sided size selection of 250–450 bp. DNA libraries were pooled and paired-end DNA sequencing (150 cycles) was performed on the NovaSeq S4.
AmpliconArchitect
After the fastq files were aligned to the reference genome using bwa mem with default parameters, AmpliconArchitect (AA) was run on the aligned reads using all regions with copy number greater than 5 as seeds. Default parameters were used as described in the documentation (https://github.com/virajbdeshpande/AmpliconArchitect). Given mapped reads, AA automatically searches for other intervals participating in the amplicon, and then uses a carefully calibrated combination of Copy Number Variant (CNV) analysis and Structural Variant (SV) analysis. AA uses SV signatures (e.g. discordant paired-end reads and CNV boundaries) to partition all intervals into segments and build an amplicon graph. It assigns copy numbers to the segments by optimizing a balanced flow on the graph. As short reads do not span long repeated segments, they cannot disambiguate between multiple alternative structures. Therefore, high molecular weight DNA was used to generate optical mapping reads. The optical map reads were used to scaffold and disambiguate the graph, as described below.
Gene Classification
To predict putative ecDNA structures, a depth-first search algorithm was used to traverse the amplicon graph and identify cycles. Genes that lay on any cycle in the graph were designated as circular. Otherwise, they were designated as linear.
Isolation of high molecular weight (HMW) DNA for optical mapping
HMW DNA was extracted from GBM39 cells following manufacturer’s instructions (BioNano Genomics #30026) with some modifications. The initial step in the procedure calls for the generation of agarose plugs containing the cell equivalent of ~3 μg - 9 μg of DNA (~ 0.5 – 1.5 million diploid human cells), which is a critical step for recovering good quality HMW DNA. As GBM39 cells contain a roughly tetraploid amount of DNA with numerous extrachromosomal DNA1, optimization of the DNA concentration was carried out as follows: Approximately 4.5 million GBM39 cells were spun down at 300 g for 10 minutes, washed twice with 0.5 mL cold Cell Buffer (BioNano #30026), and resuspended in 450 μL cold Cell Buffer. This solution was then split into three different tubes to approximate 9 μg of DNA (~0.75 million cells), 6 μg of DNA (~0.5 million cells), or 3 μg of DNA (~0.25 million cells), spun down at 300 g for 5 minutes, and resuspended in Cell Buffer to reach a final volume of 66 μL. 40 μL of 2% agarose (BioRad CleanCut Agarose #170–3594) was added to the cells and incubated at 4°C for 15 minutes to generate the agarose plugs. Within the plugs, the cells were lysed and digested with Proteinase K (Puregene #158920) and RNase A (Puregene #158922) per manufacturer’s instructions. To stabilize, recover and clean the DNA, plugs were treated according to the manufacturer’s instructions (BioNano Genomics #30026). Following dialysis, the DNA was homogenized and mechanically sheared by slowly pipetting the entire volume up and down with a non-filtered 200 μL tip until the sample reached an even consistency. The DNA was then equilibrated at room temperature for 3 days. Using a 2 μL aliquot, the DNA was diluted in Qubit BR buffer, sonicated for 10 minutes, and quantified using the Qubit dsDNA BR Assay kit (Invitrogen #Q32850). The sample obtained from the plug with ~0.5 million cells yielded the best results with a mean DNA concentration of 61 ng/μL and a coefficient variation of 6.7% and was used for the nicking, labeling, repairing, staining (NLRS) reactions.
Optimization of the NLRS reactions and DNA loading onto IrysChip
The 2× nicking reaction (utilizing Nt.BspQI) and 1× labeling, repairing and staining reactions were performed as per manufacturer’s instructions (BioNano Genomics #30024) using the recommended NEB reagents. Using a 2 μL aliquot, the DNA was sonicated for 20 minutes and the final DNA concentration was determined to be 3 ng/μL by Qubit dsDNA HS Assay kit (Life Technologies #Q32854). A total of 16 μL of nicked, labeled, repaired, and stained DNA was loaded onto the IrysChip (BioNano #FC-020–01) and run conditions were optimized on the Irys system to ensure efficient DNA loading onto the nanochannels using the Irys User Guide (BioNano Genomics #30047).
BioNano data analysis
13 rounds of data (each round containing 30 cycles of data generation) were collected on the Irys platform to reach 0.791× reference coverage with molecules. Raw images were processed, and long DNA molecules were detected and digitized by BioNano image-processing and analysis software AutoDetect31. Optical maps were generated by transforming the raw images into raw BNX files using the IrysView software system. The BNX files output from the BioNano instrument were then assembled into optical map contigs using the BioNano Irys assembly pipeline (v5122, default parameters). The segments discovered by Amplicon Architect were converted to an in-silico CMAP reference file and it was aligned to the assembled optical map contigs using AmpliconReconstructor (https://github.com/jluebeck/AmpliconReconstructor). Alignment results were also confirmed using the BioNano RefAligner (v5122, default parameters). We produced a visualization of the resulting alignment using CycleViz (https://github.com/jluebeck/CycleViz).
RNA-seq
One microgram RNA extracted by RNeasy mini kit (QIAGEN) was prepared for sequencing with TruSeq RNA Library Prep Kit v2 (Illumina) according to the manufacturer’s instruction. Briefly, after poly-A selection and fragmentation of the total RNA, first and second strand cDNA was synthesized and ligated with sequencing adapter. Products were then amplified for paired-end sequencing. Data were processed following the TCGA mRNA analysis pipeline. Expression level of mRNA was computed as fragments per kilobase of transcript per million mapped reads (FPKM) for cell line samples, or as upper quartile FPKM (FPKM-UQ) for both cell line and TCGA samples. Z score for FPKM-UQ was calculated as Z-score = (X - μ)/σ, where X is the FPKM-UQ of a given gene, μ and σ are the global mean and standard deviation of FPKM-UQ of a given sample’s transcriptome respectively.
ChIP-seq
Formaldehyde crosslinked chromatin from 5 million cells per ChIP was sheared to small fragments by Covaris M220 Focused-ultrasonicator. The following antibodies were used for chromatin pull-down in RIPA buffer with protease inhibitor cocktail: anti-H3K27ac (Active Motif 39685, 5 μg), anti-H3K4me1 (Active Motif 39297, 10 μl), anti-CTCF (Abcam ab70303, 5 μg), anti-SMC3 (Abcam ab9263, 5 μg). After capturing by Protein A/G magnetic beads, chromatin was washed 6 times and reverse-crosslinked for 3 hr with RNase A and Proteinase K. ChIP DNA library was constructed by NEBNext Ultra II DNA Library Prep kit for paired-end sequencing.
MNase-seq
One million cells were washed by calcium-free PBS and resuspended in 1 ml lysis buffer (10 mM pH 7.5 Tris-HCl, 10 mM NaCl, 3 mM MgCl2, 0.5% IGEPAL CA-630, 0.15 mM spermine, 0.5 mM spermidine, with Roche EDTA-free complete protease inhibitor cocktail) on ice for 5 min. After centrifugation, cell pellets were resuspended in 160 μl digestion buffer (10 mM pH 7.5 Tris-HCl, 15 mM NaCl, 60 mM KCl, 0.15 mM spermine, 0.5 mM spermidine, with protease inhibitor cocktail) on ice. 0.004 Unit of micrococcal nuclease (NEB) in 40 μl digestion buffer (with 5 mM CaCl2) was added to the suspension and incubated at room temperature for 10 min. Digestion was halted by 200 μl stop buffer (20 mM EDTA, 20 mM EGTA, 1% SDS). DNA was then extracted, repaired by Fast DNA End Repair Kit (Thermo Scientific), adenylated by Klenow fragment (NEB), ligated with TruSeq adapters (Illumina) and amplified to make paired-end sequencing library.
ATAC-seq
Protocol was adapted from previous report32. Briefly, 100–500K cell nuclei were extracted by NPB buffer (5% BSA, 0.2% IGEPAL-CA630, 1 mM DTT, EDTA-free protease, in PBS) at 4°C for 10 min. Tagmentation was done in TB buffer (33 mM Tris-acetate pH 7.8, 66 mM K-acetate, 11 mM Mg-acetate, 16% DMF) with Tn5 transposase (Illumina), at 37°C for 30 min. DNA samples were then extracted and DNA libraries were generated by PCR. To compare ATAC-seq signal between circular and linear amplicons of TCGA samples, the normalized read counts were further normalized by segment length, DNA copy number, and the normalized read counts of the same length from a set of merged normal tissue controls.
ATAC-see
ATAC-see on interphase cells was performed as previous described20 and applied FISH afterward. We sorted the low ATAC-see signal population in G1 phase by flow cytometry for confocal imaging. Protocol was modified to apply ATAC-see on metaphase chromosome spreads. Briefly, metaphase sample was prepared as described onto a 1-mm coverslip and incubated with 50 nM of ATTO-590 transposome under 37°C for 30 min in the dark. After washed twice by 2× SSC with 0.01% SDS for 15 min, and once by 2× SSC with 0.2% Tween-20 for 15 min, sample was subjected to FISH procedures, and finally stained by 1 μg/ml DAPI and mount with VECTASHIELD antifade mounting media (Vector Laboratories).
ATAC-see image analysis pipeline
For ATAC-see on interphase cell images, ImageJ was used to generate the surface plot for each colour channel, to document the pixel intensity and XY coordinate for Pearson correlation analysis. For ATAC-see on metaphase chromosome spreads, a software called ECdetect1 was further developed to analyze high resolution images and semantically segment DAPI-stained nuclei, chromosomes, and ecDNA. For each image, the ATAC-see intensity at each pixel location was captured by reading the pixel values. The pixel values were then grouped based on whether they belong to ecDNA, chromosomes, or nuclei, based on the semantic segmentation information from ECdetect. This was done by comparing the pixel locations of the ATAC-see intensities with the pixel locations of the segmentations.
PLAC-seq
Long-range chromatin interaction was probed by PLAC-seq as previous described22,23 using H3K27ac as the anchor (Diagenode C15200184–50), and applied MAPS pipeline33 for the downstream data analysis. After removing PCR duplicates from the valid mapped reads, we kept all intra-chromosomal reads > 1 Kb to quantify protein-mediated long-range chromatin interactions, and all intra-chromosomal reads <= 1 Kb on different strands to quantify ChIP enrichment level. Finally, we merged two replicates of the same cell type, resulting in ~240 million and ~218 million paired-end reads for GMB39 and U87 cells, respectively. To visualize chromatin interaction frequency at the EGFR locus, we first selected all paired-end reads within the ~1.3 Mb region (chr7:54,830,975–56,117,062), and removed any reads overlapped with two deletion regions (chr7:55,194,960–55,222,713, chr7:55,676,885–55,677,786) in GBM39 cells. Because this region is highly amplified as ecDNA in GBM39 cells, resulting much more reads, we downsampled reads in GBM39 sample to match the total number of reads at the same locus in U87 cells. Virtual 4C was generated at 10 Kb resolution.
4C-seq
Five million cells were cross-linked with 2% formaldehyde for 10 min at room temperature and quenched by 125 mM glycine for 5 min. Nuclei were isolated and digested with Csp6I (Thermo Scientific) overnight. Enzyme was inactivated by heating at 65°C for 20 min and the digested chromatin was subjected for ligation by T4 ligase (Life Technologies) for 16 h. DNA was then purified with before the second digestion with DpnII (NEB) overnight. After enzyme inactivation, a second round of ligation was performed, and DNA was purified. 4.8 μg of DNA in total was used for PCR amplification (primer information in Supplementary Table 3). 4C-seq data was analyzed using 4C-ker34. Reads were mapped to a reduced genome of unique 22 bp sequences flanking Csp6I sites in the hg19 genome.
CRISPR interference
Small guide RNAs (sgRNAs) targeting EGFR promoter within the 4C viewpoint were cloned into pLV-hU6-sgRNA-hUbC-dCas9-KRAB-T2a-Puro (Addgene plasmid #71236)35 and lentivirus were produced by transfecting 293T cells (sgRNAs sequence in Supplementary Table 3). GBM39 cells were then infected by lentivirus (MOI 3) for 4 days and subjected to RNA extraction and qPCR (qPCR primers in Supplementary Table 4).
Immunoblotting
After transferring whole cell lysates to nitrocellulose membrane, the following antibodies were applied: Anti-EGFR at 1:5000 (EMD Millipore # 06–847), anti-phospho-EGFR at 1:1000 (CST #3777S), anti-Tubulin at 1:2000 (CST # 2125S), and secondary anti-rabbit IgG antibody at 1:2000 (CST #7074S).
Statistics
All sample size and statistical methods were indicated in the corresponding figure legends. If the data were normally distributed (by Shapiro–Wilk test) and homoscedastic (by Bartlett’s test), Student’s t-test (for two groups) and One-way ANOVA (>2 groups) were used to test the mean difference. Otherwise, Wilcoxon rank sum test (for two groups) and Kruskal-Wallis rank sum test (for >2 groups) were applied. For ATAC-seq long fragment size distribution data, Kolmogorov–Smirnov test (KS test) was used. For ATAC-see signal intensity data set, which have at least 3500 pixels sampled for ecDNA or chrDNA per image, Z-test was used to test the mean difference according to the central limit theorem. All statistical tests are two-sided. All boxplots are shown with median, upper and lower quartiles; whiskers indicate 1.5x interquartile range, and points as outliers.
Extended Data
Extended Data Figure 1 |. Characterization of ecDNA structure by whole genome sequencing.
a, ecDNA number per metaphase in GBM39, COLO320DM and PC3 cell line. Boxplots show median, upper and lower quartiles; whiskers indicate 1.5x interquartile range (At least 20 metaphase spreads from 3 biologically independent samples were counted).
b, Depiction of amplification status classified by AmpliconArchitect (left). Representative AmpliconArchitect of the EGFR circular amplicon in GBM39 cells (right). Arrows represent the orientation of the assembled contig.
c, Circular amplicon in COLO320DM cells and double FISH of MYC and PCAT1 validating the amplicon structure (scale bar: 5 μm).
d, Circular amplicon in PC3 cells and double FISH validating the structure and co-existence of DENND3 and MYC in the same ecDNA (scale bar: 5 μm).
e, A detailed AmpliconArchitect-reconstructed schema showing the junctions and hg19 coordinates of ecDNA in GBM39 cells, and the number of paired-end discordant reads to support the reconstruction.
f, PCR cloning and Sanger sequencing validation of the ecDNA circular junction in GBM39 cells using the primers in d. Exact sequence and BLAT result were shown on the right. The highlighted 4 bp nucleotides were overlaps of the two DNA segments. An ecDNA-free GBM cell line U87 was used as a negative control (M: 100 bp DNA ladder. One representative result from 3 repeats. See Supplementary Figure 1 for source data.).
g, Representative linear amplicon breakpoint graph in GBM39 cells (left), with FISH validation of its chromosomal loci (scale bar: left, 10 μm; right, 5 μm).
h, Size and copy number of 41 reconstructed circular structures in 37 cancer cell lines.
All imaging experiments were repeated at least for 3 times, with each replicate showing similar results.
Extended Data Figure 2 |. Characterization of ecDNA structure by optical mapping and imaging.
a, Pipeline to integrate whole genome sequencing and BioNano optical mapping.
b, Intensity profile plot of the double FISH ecDNA in GBM39 cells.
c, FISH validating MYC-containing ecDNA in COLO320DM cells visualized by SIM (scale bar: upper, 5 μm; lower, 1 μm).
d, 3D reconstruction showing the circular structure of two individual ecDNA structures from SIM (arrows). The height in the contour map indicates the signal intensity of DAPI (scale bar: 1 μm).
e, TEM of GBM39 ecDNA (scale bar: 200 nm).
All imaging experiments were repeated at least for 3 times, with each replicate showing similar results.
Extended Data Figure 3 |. Genes on ecDNA are highly expressed.
a, Transcriptome in the U87 GBM cell line, which lacks ecDNA. Green data points represent the same genes that are found on ecDNA in the GBM39 cell line.
b, ecDNA gene expression levels within the transcriptome of COLO320DM and PC3 cells, and selected TCGA samples. Red dots represent genes located on ecDNA (circular amplification genes). FPKM: fragments per kilobase of transcript per million mapped reads.
c, ecDNA gene expression (red data points) in GBM39, COLO320DM, PC3 cells, one TCGA-LGG sample (TCGA-DU-7010–01A-11) and one TCGA-SARC sample (TCGA-DX-A23R-01A-11), compared to non-circular genes in the TCGA-GBM (N = 36 biologically independent samples), TCGA-COAD (N = 52 biologically independent samples), TCGA-PRAD (N = 120 biologically independent samples), TCGA-LGG (N = 96 biologically independent samples) and TCGA-SARC (N = 36 biologically independent samples) cohorts, respectively.
d, Z-score of the gene expression values plotted in b. All Z-scores were plotted as +1 to avoid negative values during log10 transformation. For TCGA samples in b-c, genes on circular amplicons were highlighted as red data points.
e-g, Expression of circular amplified and non-circular genes in TCGA-GBM, TCGA-LGG and TCGA-SARC cohorts.
h, Normalized gene expression by copy number in TCGA-SARC cohort (CDK4, P < 0.028; METTL1, P = 0.007; METTL21B, P = 0.024, by two-sided Wilcoxon rank sum test).
* indicates key oncogenes. Violin plots show the overall distribution of data points. Boxplots show median, upper and lower quartiles; whiskers indicate 1.5x interquartile range, and black points are the outliers. Every gene in each amplicon type was analyzed from at least 5 biologically independent samples in e-h.
Extended Data Figure 4 |. Histone modifications on ecDNA.
a, Active histone marks H3K4me1 and H3K27ac immunofluorescence staining on cells in metaphase (scale bar: 5 μm).
b, H3K4me1 and H3K27ac ChIP-seq in cycling GBM39 cells. Zoom-in demonstrates the ecDNA region.
c, Active histone marks H3K4me3 and H3K18ac immunofluorescence staining on GBM39 cells in metaphase (scale bar: 5 μm).
d, Inactive histone marks H3K9me3 and H3K27me3 immunofluorescence staining on GBM39 cells in metaphase. Yellow arrows indicate positive foci and blue arrows indicate ecDNA without foci.
e, Quantification of H3K9me3 and H3K27me3 foci per ecDNA in GBM39 cells in metaphase.
All imaging experiments were repeated at least for 3 times, with each replicate showing similar results.
Extended Data Figure 5 |. ecDNA chromatin compaction.
a, The workflow to characterize the chromatin accessibility of ecDNA.
b, Global and long (> 1 Kb) ATAC-seq read length distribution comparing ecDNA vs. chrDNA in COLO320DM (88 ecDNA and 987 chrDNA long fragments) and PC3 (39 ecDNA and 108 chrDNA long fragments) cells (N = 2 biologically independent samples, showing 1 of the representative result. Two-sided KS test).
c, Global and long (> 1 Kb) MNase-seq fragment length distribution in GBM39 cells (2,699 ecDNA and 18,942 chrDNA long fragments. N = 2 biologically independent samples, showing 1 of the representative result. Two-sided KS test).
d, ATAC-seq peak number per 10 Kb comparing random genome regions (313,762 windows in COLO320DM and PC3), linear amplification (470 windows in COLO320DM, 15,186 windows in PC3), and circular amplification regions (44 windows in COLO320DM, 510 windows in PC3, Kruskal-Wallis rank sum test. N = 2 biologically independent samples.).
e, ATAC-seq and WGS tracks of TCGA samples comparing circular and linear amplified regions, before (left) and after (right) normalized to copy number.
f, Representative FISH from 3 replicates showing amplicon location in GBM39/GBM39HSR and COLO320DM/COLO320HSR cells in metaphase (scale bar: 10 μm).
g, ATAC-seq and WGS tracks of the amplified region in GBM39/GBM39HSR and COLO320DM/COLO320HSR cells (CN: copy number).
h, Normalized ATAC-seq read counts (10 Kb bin) by copy number comparing ecDNA and HSR regions (Two-sided Dunn’s test. GBM39/HSR amplicon, 134 windows; COLO320DM/HSR amplicon, 157 windows; Non-amplicon, 1,000 windows). Violin plots show the overall distribution of data points. Boxplots show median, upper and lower quartiles; whiskers indicate 1.5x interquartile range.
i, Global and long (> 1 Kb) ATAC-seq read length distribution comparing HSR vs. non-HSR chrDNA in GBM39HSR (15 ecDNA and 640 chrDNA long fragments) and COLO320HSR (102 ecDNA and 4,554 chrDNA long fragments) cells (N = 2 biologically independent samples, showing 1 of the representative result. Two-sided KS test).
j, Number of SNP supported reads from the major allele (containing ecDNA) and minor allele in GBM39 cells from multiple sequencing technologies. Circular amplified region (ecDNA) is marked in red.
Extended Data Figure 6 |. ecDNA is highly accessible in early interphase chromatin.
a, The workflow to evaluate the accessibility of ecDNA in interphase cells.
b, Representative images of FISH, ATAC-see and MitoTracker Deep Red FM signal colocalization in COLO320DM cells.
c, Pearson correlation of FISH signal pixel intensity and ATAC-see signal pixel intensity in 4 representative single cells. At least 27,000 pixels for each cell were analyzed.
Extended Data Figure 7 |. ATAC-see visualization of ecDNA accessibility in metaphase chromatin.
a, The strategy of applying ATAC-see to DNA in cells in metaphase.
b, Image analysis pipeline, showing ecDNA and chrDNA segmentation of the DAPI channel. The pixel intensity of ATAC-see channel was measured.
c, ATAC-seq tracks and corresponding representative images of FISH and ATAC-see (scale bar: 5 μm).
d, Quantification of ATAC-see pixel intensity of ecDNA vs. chrDNA from at least 4 independent metaphase spreads. Violin plots show the overall distribution of data points. The dashed line across the plot indicates the global mean value. The solid black lines inside each split violin plot indicate the mean of each data set (Two-sided Z test).
Extended Data Figure 8 |. Circular plots for ecDNA.
a-d, Composite circular plots displaying WGS, RNA-seq and ATAC-seq of ecDNA. For COLO320DM and PC3 cells with multiple versions of reconstructed structures, only one representative structure was shown. For TCGA samples (c, TCGA-A7-A0D9, breast invasive carcinoma; d, TCGA-L7-A6VZ, esophageal carcinoma), the ATAC-seq data point represents the highest signal within a 1 kb window.
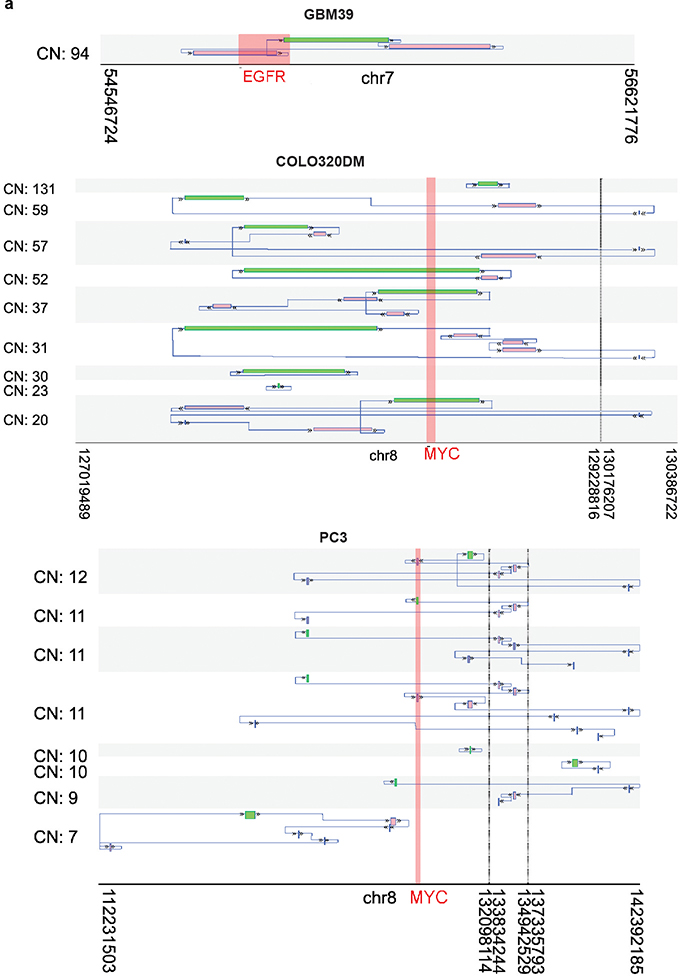
Extended Data Figure 9 |. Reconstructed ecDNA structures.
a, Examples of selected potential amplicons reconstructed from AmpliconArchitect in GBM39, COLO320DM, and PC3 cells. For each potential amplicon, the average copy number (CN) of the segments is listed. The starting segment of the structure is outlined in green. From the starting segment, the structure can be traced by following the arrows to find the next genomic segment of the structure. Some structures have a circular path (i.e., can return to the starting segment by following the arrows) which represents potential ecDNA structure.
Extended Data Figure 10 |. Circularization of ecDNA enables novel DNA interaction.
a, Chromatin interaction heatmaps comparing GBM39 with U87 cells, generated from PLAC-seq/HiChIP analyses using H3K27ac as the anchor. GBM39 ecDNA region was downsampled to a comparable level of U87 to normalize for copy number. Contrast heatmap shows the differential interaction. Green arrows indicate the increased corner reads in GBM39 ecDNA junctional region but not in U87 chrDNA locus, demonstrating ecDNA circularity.
b-c, Virtual 4C read counts from viewpoint 1 (ecDNA junction) and 2 (EGFR promoter), respectively.
d, Actual 4C-seq read counts, and the read count ratio of GBM39 over U87 from the viewpoint 2.
e-f, Models depicting local and distal interactions with EGFR promoter and proposed model for CRISPRi masking of EGFR promoter.
g-h, qPCR quantification of gene expression in regions proximal and distal to EGFR. Data are mean ± s.e.m.; n = 3; each data point represents three technical replicates from one representative result (criNC: CRISPRi negative control; One-way ANOVA; N.S, not significant; **, P < 0.01; ***, P < 0.001; ****, P < 0.0001)
i, Exogenous expression of EGFRvIII in U87 cells (U87-EGFRvIII) and the activation of EGFR signaling was confirmed by western blot. Experiment was repeated for 3 times, with each replicate showing similar results. See Supplementary Figure 1 for source data.).
j, qPCR quantification of EGFR-neighboring gene expression in U87 cells, with and without ectopic EGFRvIII overepxression. Data are mean ± s.e.m.; n = 3; each data point represents three technical replicates from one representative result (Welch’s t-test; N.S, not significant; GBAS, P = 0.038; EGFR, P = 0.003).
Supplementary Material
Acknowledgements
The authors thank members of the Mischel laboratory, Dr. Marilyn Farquhar for the use of the UCSD/CMM electron microscopy facility, Timothy Merloo and Ying Jones for electron microscopy sample preparation, UCSD Neuroscience Microscopy Shared Facility (NS047101) for providing imaging support, and the Ecker lab at the Salk Institute for Biological Studies for use of the Irys instrument for Bionano mapping. This work was supported by the Ludwig Institute for Cancer Research (P.S.M., B.R., F.B.F.), Defeat GBM Program of the National Brain Tumor Society (P.S.M., F.B.F.), NVIDIA Foundation, Compute for the Cure (P.S.M.), The Ben and Catherine Ivy Foundation (P.S.M.), generous donations from the Ziering Family Foundation in memory of Sigi Ziering (P.S.M.), and Ruth L. Kirschstein National Research Service Award NIH/NCI T32 CA009523 (R.R.). This work was also supported by the following NIH grants: NS73831 (P.S.M.), R35CA209919 (H.Y.C.), RM1-HG007735 (H.Y.C.), GM114362 (V.B.), NS80939 (F.B.F.), and NSF grants: NSF-IIS-1318386 and NSF-DBI-1458557 (V.B.). The TEM facility is supported in part by NIH Award number S10OD023527. Work in the Law lab was supported by a Salk Innovation Grant and by the Rita Allen Foundation Scholars Program. H.Y.C. is an Investigator of the Howard Hughes Medical Institute.
Footnotes
Competing Interests
P.S.M., H.Y.C. and R.G.W.V. are co-founders of Boundless Bio, Inc. (BB), and serve as consultants. V.B. is a co-founder, and has equity interest in Boundless Bio, inc. (BB) and Digital Proteomics, LLC (DP), and receives income from DP. The terms of this arrangement have been reviewed and approved by the University of California, San Diego in accordance with its conflict of interest policies. BB and DP were not involved in the research presented here.
Data Availability. Whole genome-, RNA-, ATAC-, MNase-, ChIP-, PLAC-Seq data are deposited in the NCBI Sequence Read Archive (BioProject: PRJNA506071). The source data files of the pixel quantification of ATAC-see on metaphase chromosome spread images to create Extended Data Figure 7d are available on Figshare (https://doi.org/10.6084/m9.figshare.9826115.v1).
Code Accessibility. The following are available for use online: AmpliconArchitect (https://github.com/virajbdeshpande/AmpliconArchitect), AmpliconReconstructor (https://github.com/jluebeck/AmpliconReconstructor), and CycleViz (https://github.com/jluebeck/CycleViz)
References
- 1.Turner KM et al. Extrachromosomal oncogene amplification drives tumour evolution and genetic heterogeneity. Nature 543, 122–125, doi: 10.1038/nature21356 (2017). [DOI] [PMC free article] [PubMed] [Google Scholar]
- 2.Verhaak RGW, Bafna V & Mischel PS Extrachromosomal oncogene amplification in tumour pathogenesis and evolution. Nature reviews. Cancer 19, 283–288, doi: 10.1038/s41568-019-0128-6 (2019). [DOI] [PMC free article] [PubMed] [Google Scholar]
- 3.Gibcus JH & Dekker J The hierarchy of the 3D genome. Mol Cell 49, 773–782, doi: 10.1016/j.molcel.2013.02.011 (2013). [DOI] [PMC free article] [PubMed] [Google Scholar]
- 4.Dixon JR, Gorkin DU & Ren B Chromatin Domains: The Unit of Chromosome Organization. Mol Cell 62, 668–680, doi: 10.1016/j.molcel.2016.05.018 (2016). [DOI] [PMC free article] [PubMed] [Google Scholar]
- 5.Corces MR et al. The chromatin accessibility landscape of primary human cancers. Science 362, doi: 10.1126/science.aav1898 (2018). [DOI] [PMC free article] [PubMed] [Google Scholar]
- 6.Hnisz D et al. Activation of proto-oncogenes by disruption of chromosome neighborhoods. Science 351, 1454–1458, doi: 10.1126/science.aad9024 (2016). [DOI] [PMC free article] [PubMed] [Google Scholar]
- 7.Moller HD et al. Circular DNA elements of chromosomal origin are common in healthy human somatic tissue. Nat Commun 9, 1069, doi: 10.1038/s41467-018-03369-8 (2018). [DOI] [PMC free article] [PubMed] [Google Scholar]
- 8.Shibata Y et al. Extrachromosomal microDNAs and chromosomal microdeletions in normal tissues. Science 336, 82–86, doi: 10.1126/science.1213307 (2012). [DOI] [PMC free article] [PubMed] [Google Scholar]
- 9.Deshpande V et al. Exploring the landscape of focal amplifications in cancer using AmpliconArchitect. Nat Commun 10, 392, doi: 10.1038/s41467-018-08200-y (2019). [DOI] [PMC free article] [PubMed] [Google Scholar]
- 10.Mendelowitz L & Pop M Computational methods for optical mapping. Gigascience 3, 33, doi: 10.1186/2047-217X-3-33 (2014). [DOI] [PMC free article] [PubMed] [Google Scholar]
- 11.Mak AC et al. Genome-Wide Structural Variation Detection by Genome Mapping on Nanochannel Arrays. Genetics 202, 351–362, doi: 10.1534/genetics.115.183483 (2016). [DOI] [PMC free article] [PubMed] [Google Scholar]
- 12.Demmerle J et al. Strategic and practical guidelines for successful structured illumination microscopy. Nat Protoc 12, 988–1010, doi: 10.1038/nprot.2017.019 (2017). [DOI] [PubMed] [Google Scholar]
- 13.Schimke RT Gene amplification in cultured animal cells. Cell 37, 705–713, doi: 10.1016/0092-8674(84)90406-9 (1984). [DOI] [PubMed] [Google Scholar]
- 14.Storlazzi CT et al. Gene amplification as double minutes or homogeneously staining regions in solid tumors: origin and structure. Genome Res 20, 1198–1206, doi: 10.1101/gr.106252.110 (2010). [DOI] [PMC free article] [PubMed] [Google Scholar]
- 15.A LA et al. MYC-containing amplicons in acute myeloid leukemia: genomic structures, evolution, and transcriptional consequences. Leukemia 32, 2152–2166, doi: 10.1038/s41375-018-0033-0 (2018). [DOI] [PMC free article] [PubMed] [Google Scholar]
- 16.Baylin SB & Jones PA Epigenetic Determinants of Cancer. Cold Spring Harb Perspect Biol 8, doi: 10.1101/cshperspect.a019505 (2016). [DOI] [PMC free article] [PubMed] [Google Scholar]
- 17.Lee DY, Hayes JJ, Pruss D & Wolffe AP A positive role for histone acetylation in transcription factor access to nucleosomal DNA. Cell 72, 73–84 (1993). [DOI] [PubMed] [Google Scholar]
- 18.Luger K, Mader AW, Richmond RK, Sargent DF & Richmond TJ Crystal structure of the nucleosome core particle at 2.8 A resolution. Nature 389, 251–260, doi: 10.1038/38444 (1997). [DOI] [PubMed] [Google Scholar]
- 19.Smith G et al. c-Myc-induced extrachromosomal elements carry active chromatin. Neoplasia 5, 110–120, doi: 10.1016/s1476-5586(03)80002-7 (2003). [DOI] [PMC free article] [PubMed] [Google Scholar]
- 20.Chen X et al. ATAC-see reveals the accessible genome by transposase-mediated imaging and sequencing. Nat Methods 13, 1013–1020, doi: 10.1038/nmeth.4031 (2016). [DOI] [PMC free article] [PubMed] [Google Scholar]
- 21.Solovei I et al. Topology of double minutes (dmins) and homogeneously staining regions (HSRs) in nuclei of human neuroblastoma cell lines. Genes Chromosomes Cancer 29, 297–308 (2000). [DOI] [PubMed] [Google Scholar]
- 22.Fang R et al. Mapping of long-range chromatin interactions by proximity ligation-assisted ChIP-seq. Cell Res 26, 1345–1348, doi: 10.1038/cr.2016.137 (2016). [DOI] [PMC free article] [PubMed] [Google Scholar]
- 23.Mumbach MR et al. HiChIP: efficient and sensitive analysis of protein-directed genome architecture. Nat Methods 13, 919–922, doi: 10.1038/nmeth.3999 (2016). [DOI] [PMC free article] [PubMed] [Google Scholar]
- 24.Rowley MJ & Corces VG Organizational principles of 3D genome architecture. Nat Rev Genet 19, 789–800, doi: 10.1038/s41576-018-0060-8 (2018). [DOI] [PMC free article] [PubMed] [Google Scholar]
- 25.Bailey MH et al. Comprehensive Characterization of Cancer Driver Genes and Mutations. Cell 173, 371–385 e318, doi: 10.1016/j.cell.2018.02.060 (2018). [DOI] [PMC free article] [PubMed] [Google Scholar]
- 26.deCarvalho AC et al. Discordant inheritance of chromosomal and extrachromosomal DNA elements contributes to dynamic disease evolution in glioblastoma. Nat Genet 50, 708–717, doi: 10.1038/s41588-018-0105-0 (2018). [DOI] [PMC free article] [PubMed] [Google Scholar]
- 27.Lederberg J Cell genetics and hereditary symbiosis. Physiol Rev 32, 403–430, doi: 10.1152/physrev.1952.32.4.403 (1952). [DOI] [PubMed] [Google Scholar]
- 28.Nathanson DA et al. Targeted therapy resistance mediated by dynamic regulation of extrachromosomal mutant EGFR DNA. Science 343, 72–76, doi: 10.1126/science.1241328 (2014). [DOI] [PMC free article] [PubMed] [Google Scholar]
- 29.McGranahan N & Swanton C Clonal Heterogeneity and Tumor Evolution: Past, Present, and the Future. Cell 168, 613–628, doi: 10.1016/j.cell.2017.01.018 (2017). [DOI] [PubMed] [Google Scholar]
- 30.Xu K et al. Structure and evolution of double minutes in diagnosis and relapse brain tumors. Acta Neuropathol 137, 123–137, doi: 10.1007/s00401-018-1912-1 (2019). [DOI] [PMC free article] [PubMed] [Google Scholar]
Additional Reference
- 31.Cao H et al. Rapid detection of structural variation in a human genome using nanochannel-based genome mapping technology. Gigascience 3, 34, doi: 10.1186/2047-217X-3-34 (2014). [DOI] [PMC free article] [PubMed] [Google Scholar]
- 32.Corces MR et al. An improved ATAC-seq protocol reduces background and enables interrogation of frozen tissues. Nat Methods 14, 959–962, doi: 10.1038/nmeth.4396 (2017). [DOI] [PMC free article] [PubMed] [Google Scholar]
- 33.Juric I et al. MAPS: Model-based analysis of long-range chromatin interactions from PLAC-seq and HiChIP experiments. PLoS Comput Biol 15, e1006982, doi: 10.1371/journal.pcbi.1006982 (2019). [DOI] [PMC free article] [PubMed] [Google Scholar]
- 34.Raviram R et al. 4C-ker: A Method to Reproducibly Identify Genome-Wide Interactions Captured by 4C-Seq Experiments. PLoS Comput Biol 12, e1004780, doi: 10.1371/journal.pcbi.1004780 (2016). [DOI] [PMC free article] [PubMed] [Google Scholar]
- 35.Thakore PI et al. Highly specific epigenome editing by CRISPR-Cas9 repressors for silencing of distal regulatory elements. Nat Methods 12, 1143–1149, doi: 10.1038/nmeth.3630 (2015). [DOI] [PMC free article] [PubMed] [Google Scholar]
Associated Data
This section collects any data citations, data availability statements, or supplementary materials included in this article.


