

Abstract
Hepatitis C virus (HCV) infection is common and can accelerate chronic kidney disease (CKD) progression. Direct-acting antiviral (DAA) therapies against hepatitis C have consistently shown rates of sustained viral remission. However, the effect on kidney function is unknown. In a retrospective observational cohort study of HCV-infected patients receiving DAA therapies from 2013 to 2017, the slopes of estimated glomerular filtration rate (eGFR) decline were compared in the three years before DAA therapy to the slope after therapy. Pre- and post-treatment albuminuria values were also compared. In all, 1,178 patients were included; mean age of 56, 64% male, 71% white, 21% were diabetic, and 42% with cirrhosis. In patients with eGFR less than 60ml/min per 1.73m2, the annual decline in eGFR in the three years prior to treatment was −5.98 ml/min per year (95% confidence interval −7.30 to −4.67) and improved to −1.32 ml/min per year (95% confidence interval −4.50 to 1.88) after DAA therapy. In patients with eGFR greater than 60ml/min per 1.73m2 the annual decline in eGFR in the three years prior to treatment was −1.43 ml/min per year (95% confidence interval −1.78 to −1.08) and after DAA therapy was −2.32 ml/min per year (95% confidence interval −3.36 to −1.03). Albuminuria improved significantly in patients without diabetes, but not in those with diabetes. Predictors of eGFR improvement included having CKD at baseline and being non-diabetic. Events of acute kidney injury were rare, occurring in 29 patients, and unrelated to antiviral therapy in 76% of cases. Thus, DAA therapy for HCVs infection may slow CKD progression.
Keywords: antiviral therapy, chronic kidney disease, glomerulonephritis, hepatitis C virus
Hepatitis C virus (HCV) infection is one of the most common chronic viral infections worldwide and in many cases leads to end-stage liver disease, liver transplantation, or death. HCV infection is also associated with the development of several extrahepatic manifestations, including chronic kidney disease (CKD).1 Multiple studies have suggested that HCV infection leads to accelerated CKD progression and increased incidence of end-stage renal disease.2–7
Over the last 5 years HCV has been transformed into a curable illness with the development of direct-acting antiviral (DAA) therapies. DAAs directly target viral proteins critical to HCV’s replicative machinery and, when used in combination, produce cure rates of >97%.8–10 In spite of recent advances, little is known about the effect of HCV treatment with DAAs on short- or long-term kidney function. Whether or not the association of HCV with rapid CKD progression can be mitigated by HCV treatment has not yet been evaluated in the era of DAA therapies for HCV infection. Furthermore, there remains equipoise about whether sofosbuvir, a commonly used DAA medication, is nephrotoxic.11 The purpose of this study was to determine the effect of treating HCV with DAAs on kidney function by evaluating the rate of decline of estimated glomerular filtration rate (eGFR) before and after DAAs to determine what baseline patient characteristics predict significant improvement in kidney function after treatment with DAAs and to define the rates of acute kidney injury (AKI) (defined by serum creatinine changes) while on DAAs.
RESULTS
Patient characteristics
A total of 2319 patients received prescriptions for DAAs during the study period (Figure 1). Patients were excluded if they did not begin DAAs because of insurance denial or noncompliance (n = 219), were treated with DAAs but their exact start date could not be confirmed (n = 144), were already on dialysis (n = 23), were recipients of a solid organ transplant (n = 124), or did not have a baseline creatinine within the 12 months before starting DAAs (n = 219).
Figure 1 |.
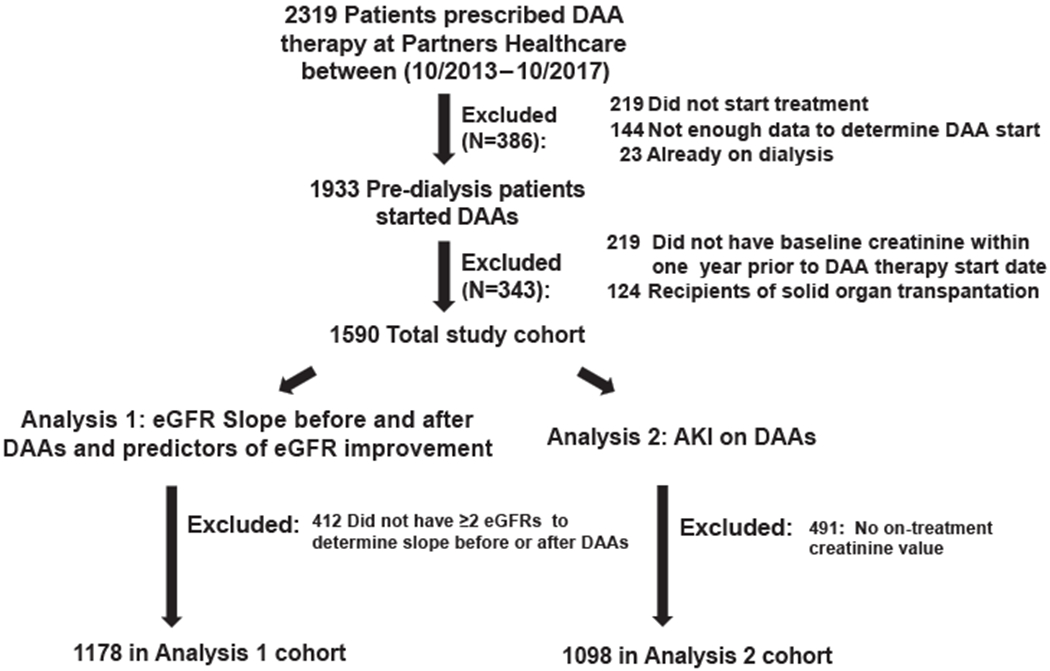
Patient flow.
Characteristics of the 1590 predialysis patients who started DAAs with a known baseline creatinine are shown in Table 1. Mean age was 56 years (SD, 12). Most (64%) were men; 73% self-identified as white, non-Hispanic, 13% as black, 7% as Hispanic, and 3% as Asian. Comorbidities were common and included hypertension in 46%, diabetes in 21%, cirrhosis in 42%, and co-infection with HIV in 8.9%. Distribution of HCV genotypes is shown in Table 1.
Table 1 |.
Patient characteristics for overall cohort and each analysis cohorts
| Overall cohort receiving DAAs with baseline creatinine within 1 year (n = 1590) | Analysis 1 |
Analysis 2 |
|
|---|---|---|---|
| Pre- and post-DAA eGFR slope (n = 1178) | On-treatment AKI (n = 1098) | ||
| Age, yr | 56 ± 12 | 57 ± 11 | 56 ± 12 |
| Male | 1011 (64) | 754 (64) | 704 (64) |
| Race | |||
| White | 1166 (73) | 842 (71) | 787 (72) |
| Black | 203 (13) | 172 (15) | 148 (13) |
| Hispanic | 107 (7) | 88 (7) | 80 (7) |
| Asian | 49 (3) | 30 (3) | 34 (3) |
| Other/not recorded | 65 (4) | 46 (4) | 49 (4) |
| Cirrhosis | 669 (42) | 534 (45) | 516 (47) |
| HIV | 141 (8.9) | 128 (11) | 128 (12) |
| Diabetes | 340 (21) | 306 (26) | 261 (24) |
| Hypertension | 726 (46) | 641 (54) | 550 (50) |
| Baseline creatinine, mg/dL | 0.90 (0.24) | 0.91 (0.25) | 0.91 (0.27) |
| Baseline eGFR, ml/min per 1.73 m2 | 89 (19) | 88 (19) | 88 (20) |
| eGFR ≥ 90 | 883 (56) | 616 (52) | 593 (54) |
| eGFR 60–89 | 582 (37) | 447 (38) | 399 (36) |
| eGFR 30–59 | 121 (7.6) | 112 (9.5) | 102 (9.3) |
| eGFR < 30 | 4 (0.3) | 3 (0.3) | 4 (0.4) |
| Median HCV baseline viral load, million IU/ml (interquartile range) | 1.7 × 10⁶ (5.2 × 10⁵–4.4 × 10⁶) | 1.7 × 10⁶ (5.5 × 10⁵–4.4 × 10⁶) | 1.7 × 10⁶ (5.4 × 10⁵–4.5 × 10⁶) |
| Genotype | |||
| 1aa | 884 (56) | 643 (55) | 595 (54) |
| 1b | 286 (18) | 220 (19) | 204 (19) |
| 2 | 178 (11) | 141 (12) | 121 (11) |
| 3 | 174 (11) | 129 (11) | 128 (12) |
| 4 | 52 (3.3) | 36 (3.1) | 39 (3.6) |
| 5 | 0 (0) | 0 (0) | 0 (0) |
| 6 | 5 (0.3) | 2 (0.2) | 4 (0.4) |
| Mixed genotype | 6 (0.4) | 5 (0.4) | 5 (0.5) |
| Unknown genotype | 5 (0.3) | 2 (0.2) | 2 (0.2) |
| Treatment experienced | 514 (32) | 396 (34) | 369 (34) |
| Sofosbuvir-based therapy | 1542 (97) | 1142 (97) | 1061 (97) |
| Ribavirin-containing regimen | 451 (28) | 348 (30) | 346 (32) |
| Interferon-containing regimen | 48 (3.0) | 42 (3.5) | 35 (3.2) |
| Discontinued early | 43 (2.7) | 36 (3.0) | 29 (2.6) |
| SVR status known | 1442 (91) | 1112 (94) | 1019 (93) |
| Cured | 1337 (93) | 1029 (93) | 943 (93) |
| Failed therapy | 105 (7) | 83 (7) | 76 (7) |
| SVR status unknown | 148 (9) | 66 (6) | 79 (7) |
AKI, acute kidney injury; DAA, direct-acting antiviral; eGFR, estimated glomerular filtration rate; HCV, hepatitis C virus; SVR, sustained virologic response.
Genotype 1a includes patients with both genotype 1a or genotype 1 nonsubtypable.
Values are mean ± SD or n (%) unless otherwise defined.
Average baseline serum creatinine was 0.90 (SD, 0.24) mg/dL corresponding to eGFR 89 (SD, 19) ml/min per 1.73 m2; 56% of the cohort had eGFR > 90 ml/min per 1.73 m2, 37% had GFR 60 to 90 ml/min per 1.73 m2, and 7.9% had eGFR < 60ml/min per 1.73 m2. Nearly all of the cohort (91%) had a baseline eGFR determination based on values averaged within 6 months, whereas 141 (9%) did not have a value within 6 months so had a baseline creatinine that was obtained by averaging values within 6 to 12 months of DAA therapy start. Those with baseline creatinine established from a value 6 to 12 months before DAAs were more likely to be women, had a slightly lower baseline creatinine value, and were less likely to have medical comorbidities, but there were no significant differences in AKI events (Supplementary Table S1).
Efficacy
DAA regimen selection was based on viral genotype; prior treatment history; presence of cirrhosis; and provider, patient, and payer preferences. Most patients (97%) received a sofosbuvir-based regimen. Interferon was used rarely (3%), and ribavirin was used in 28%. Most patients (83%) were prescribed 8 to 12 weeks of therapy. Specific details of regimens used, by genotype, are shown in Supplementary Table S2. Only 43 patients (2.7%) discontinued DAAs early. Of the 1442 patients with known sustained virologic response (SVR) status, 1337 (93%) were cured. One hundred forty-eight patients (9%) did not have a known SVR status based on electronic health record review. The efficacy of prescribed DAA regimens is shown in Supplementary Table S2.
Effect of DAA therapy on kidney function
Analysis 1: effect of DAAs on the slope of eGFR decline over time and predictors of eGFR improvement.
In analysis 1, 1178 patients had sufficient data to examine the change in the slope of decline of kidney function (Figure 1); 412 were excluded because they did not have at least 2 creatinine measurements before and at least 2 creatinine measurements after DAA therapy. The characteristics of these 1178 patients were similar to the overall cohort (Table 1). In the 3 years before DAA therapy, patients had on average 7.8 (SD, 6.4) creatinine measurements to construct a pretreatment slope. Patients had on average 7.8 (SD, 6.0) creatinine measurements in the period after starting DAAs to construct a post-DAA slope. The average length of follow-up was 573 days (SD, 337) after completing DAAs. In patients with CKD defined by baseline eGFR < 60 ml/min per 1.73 m2 there was a notably rapid annual eGFR loss in the 3 years before DAA therapy; the annual rate of decline substantially improved after DAA treatment, suggesting that the rapid eGFR loss associated with HCV viremia may be mitigated by DAA therapy (Table 2). Patients with eGFR > 60 ml/min per 1.73 m2 at baseline had a clinically small, but statistically significant, increase in eGFR decline per year when averaged over 3 years before and after DAAs (Table 2). However, our sensitivity analysis, which limited to eGFRs within 1 year before and after DAA therapy, demonstrated no significant change in eGFR decline in this group (Supplementary Table S3).
Table 2 |.
Average change in eGFR per year before and after DAA therapies, stratified by baseline CKD status
| Baseline eGFR | No. of cases | Pre-DAA slope (95% CI) | Post-DAA slope (95% CI) | P |
|---|---|---|---|---|
| eGFR ≥ 60 ml/min per 1.73 m2 | 1063 | −1.43 (−1.78, −1.08) | −2.33 (−3.36, −1.30) | 0.010 |
| eGFR < 60 ml/min per 1.73 m2 | 115 | −5.98 (−7.30, −4.67) | −1.32 (−4.50, 1.88) | <0.0001 |
CKD, chronic kidney disease; CI, confidence interval; DAA, direct-acting antiviral; eGFR, estimated glomerular filtration rate.
eGFR measurements taken from 3 years before to 3 years after DAA therapy were included in the analysis. The generalized estimating equation was used to derive the slope estimates after adjusting for age, baseline eGFR, and diabetes. Patients with eGFR < 60 ml/min per 1.73 m2 experienced a significant improvement in eGFR loss after receiving DAA therapy, from 5.98 ml/min per year to only 1.32 ml/min per year decline.
Ten percent of the cohort experienced “eGFR improvement,” defined as ≥10% increase in eGFR from baseline to follow-up, in the year after DAA therapy. In the multivariable model, patients who were nondiabetic and those with CKD stage ≥ 3 were 1.76- and 4.29-fold more likely to experience a significant eGFR improvement with DAAs, respectively (Table 3). Baseline eGFR remained statistically significant even when eGFR improvement was defined by an absolute increase in eGFR ≥ 10 ml/min per 1.73 m2 rather than a percent of baseline eGFR (Supplementary Table S4). When predictors of change in eGFR with DAAs were analyzed by linear regression, we found that female sex and white race were predictive of a small improvement in eGFR. Nondiabetic status and baseline eGFR < 60 ml/min per 1.73 m2 predicted larger improvements in eGFR (Supplementary Table S5).
Table 3 |.
Univariate and multivariable logistic regression model predicting eGFR improvement after DAA therapy
| Baseline predictors of eGFR improvement after DAAs | Univariate model |
Multivariable model |
||
|---|---|---|---|---|
| Odds ratio (95% CI) | P | Odds ratio (95% CI) | P | |
| Age, per 10 yr | 0.95 (0.80–1.1) | 0.60 | ||
| Sex (female vs. male) | 1.30 (0.87–1.9) | 0.19 | 1.16 (0.77–1.8) | 0.47 |
| Race (white vs. nonwhite) | 1.30 (0.83–2.1) | 0.24 | 1.31 (0.81–2.1) | 0.27 |
| Nondiabetic patients vs. diabetic | 1.78 (1.07–2.9) | 0.025 | 1.76 (1.01–3.0) | 0.043 |
| Cirrhosis (vs. noncirrhotic) | 0.75 (0.51–1.1) | 0.16 | 0.89 (0.58–1.4) | 0.58 |
| Hypertension (vs. nonhypertensive) | 0.75 (0.51–1.1) | 0.14 | 0.74 (0.48–1.1) | 0.17 |
| HIV co-infection | 1.05 (0.57–1.9) | 0.86 | — | — |
| Ribavirin use | 0.91 (0.59–1.4) | 0.67 | — | — |
| DAA course length (>12 wk vs. ≤12 wk) | 0.62 (0.35–1.1) | 0.11 | 0.61 (0.33–1.1) | 0.12 |
| Baseline eGFR < 60 ml/min per 1.73 m2 | 3.49 (2.2–5.7) | <0.001 | 4.29 (2.6–7.2) | <0.001 |
CI, confidence interval; DAA, direct-acting antiviral; eGFR, estimated glomerular filtration rate.
eGFR improvement was defined by ≥10% increase in eGFR from baseline to post-treatment average in the 12 months after completing DAA therapy. The multivariable model includes demographics and predictors with P < 0.1 in the univariate model. Only nondiabetic status and baseline eGFR < 60 ml/min per 1.73 m2 predicted improvement in eGFR after DAAs in multivariable models.
In the population of patients with CKD who had at least 1 serum creatinine measurement in the first year after completing DAA therapy (n = 112), we examined the effect of diabetes on change in eGFR. In patients with nondiabetic CKD, eGFR improved from on average from 50.6 ml/min per 1.73 m2 (95% confidence interval [CI], 48.9–52.3 ml/min per 1.73 m2) to 54.1 ml/min per 1.73 m2 (95% CI, 50.6–57.6 ml/min per 1.73 m2; P = 0.02). In those with diabetic CKD eGFR declined from 48.1 ml/min per 1.73 m2 (95% CI, 45.5–50.8 ml/min per 1.73 m2) to 43.2 ml/min per 1.73 m2 (95% CI, 38.9–47.5 ml/min per 1.73 m2) (Figure 2a). In the cohort with albuminuria measured before and after DAAs (n = 107), those with nondiabetic CKD experienced a significant reduction in albuminuria compared with those with diabetes, whose average albuminuria did not change with DAA therapy (P = 0.024) for the difference in the change in albuminuria by diabetes status (Figure 2b). Taken together, these data suggest that patients with nondiabetic CKD are most likely to immediately benefit from DAAs.
Figure 2 |. (a) Average estimated glomerular filtration rate (eGFR) before and after direct-acting antiviral (DAA) therapy in patients with baseline chronic kidney disease (CKD), stratified by diabetes status.

Includes all patients with baseline stage 3 or 4 CKD (eGFR < 60 ml/min per 1.73 m2) who had at least 1 creatinine (Cr) measured in the first year after DAA therapy (n = 112). In nondiabetic patients (n = 44), the eGFR improved after DAAs (P = 0.02). In diabetic patients (n = 68), the eGFR continued to decline despite DAAs. (b) Average albuminuria before and after DAA therapy, stratified by diabetes status. Includes all patients who had at least 1 quantification of albuminuria within 1 year before beginning DAA therapy and at least 1 quantification in the first year after completing DAA therapy (n = 107). In nondiabetic patients (n = 27), the albuminuria improved after DAAs (P = 0.025 for the difference in the natural log of proteinuria). In diabetic patients (n = 80), the average albuminuria remained stable. DM, diabetes mellitus.
Analysis 2: average kidney function and AKI events while on DAAs.
In analysis 2, 1098 patients (69% of cohort) had at least 1 serum creatinine measurement while on DAAs and were included in the analysis of on-treatment kidney function (Figure 1). Their baseline characteristics are shown in Table 1. Patients had on average 3.1 (SD, 4.0) creatinine measurements obtained while on DAAs; this roughly translates into monthly creatinine measurements because most were treated for 12 weeks or less. Average eGFR on DAAs was slightly lower than during the baseline period: 85.9 ± 20.2 ml/min per 1.73 m2 on treatment compared with 88.4 ± 19.6 ml/min per 1.73 m2 during the baseline period (P ≤ 0.001).
AKI events were rare, occurring in 29 patients (2.6%) in the overall cohort. More severe AKI events (AKI Network stages 2 and 3) while on DAAs were extremely rare, occurring in 4 (0.4%) and 4 (0.4%) of patients, respectively (Figure 2). Stage 1 AKI events were more common in patients with eGFR < 60 ml/min per 1.73 m2 compared with those with eGFR ≥ 60 ml/min per 1.73 m2. There were 7 AKI events in the 106 patients (6.6%) with eGFR < 60 ml/min per 1.73 m2 compared with 22 events in 992 patients (2.2%) with eGFR ≥ 60 ml/min per 1.73 m2; P = 0.007); however, there were no stage 2 or stage 3 AKI events in patients with eGFR < 60 ml/min per 1.73 m2. The rate of AKI in patients receiving a sofosbuvir-containing regimen was higher than in those treated with non–sofosbuvir-based regimens, occurring in 29 of 1061 patients (2.8%) treated with sofosbuvir-containing regimens compared with no AKI events in the 37 patients who received non–sofosbuvir-containing DAA regimens (either pariteprevir/ritonavir/ombitasvir/dasabuvir-based or elbasvir/grazoprevir-based therapy). A model of the clinical predictors of AKI events on therapy is shown in Table 4; in the multivariable models, having a baseline eGFR < 60 ml/min per 1.73 m2 significantly predicted the development of AKI while on DAAs. In the sensitivity analysis, when AKI was defined by only a >1.3-fold rise in serum creatinine while on DAAs, 115 events were detected. Baseline eGFR < 60 ml/min per 1.73 m2 no longer predicted AKI; only the presence of diabetes predicted this more sensitive definition of AKI (Supplementary Table S6).
Table 4 |.
Univariate and multivariable logistic regression model predicting AKI while on DAA therapies
| Univariate model |
Multivariable model |
|||
|---|---|---|---|---|
| Baseline Predictors of AKI on DAAs | Odds ratio (95% CI) | P | Odds ratio (95% CI) | P |
| Age, per 10 yr | 1.14 (0.81–1.6) | 0.46 | ||
| Sex (female vs. male) | 0.70 (0.31–1.6) | 0.38 | ||
| Race (white vs. nonwhite) | 0.85 (0.39–1.9) | 0.69 | ||
| Diabetes (vs. nondiabetic) | 1.50 (0.69–3.3) | 0.31 | ||
| Cirrhosis (vs. noncirrhotic) | 2.93 (1.3–6.5) | 0.009 | 2.32 (1.0–5.4) | 0.051 |
| Hypertension (vs. nonhypertensive) | 2.19 (1.01–4.8) | 0.048 | 1.62 (0.73–3.7) | 0.24 |
| HIV co-infection | 0.38 (0.07–2.0) | 0.26 | 0.43 (0.08–2.3) | 0.33 |
| Ribavirin use | 1.01 (0.46–2.2) | 0.99 | — | |
| Prior treatment failure | 1.42 (0.68–3.0) | 0.35 | ||
| DAA course length (>12 wk vs. ≤12 wk) | 2.03 (0.94–4.4) | 0.07 | 1.61 (0.73–3.6) | 0.24 |
| Baseline eGFR < 60 ml/min per 1.73 m2 | 3.25 (1.4–7.6) | 0.007 | 3.02 (1.3–7.3) | 0.014 |
AKI, acute kidney injury; CI, confidence interval; DAA, direct-acting antiviral; eGFR, estimated glomerular filtration rate.
The multivariable model includes demographics and predictors with P < 0.3 in the univariate model. Only presence of cirrhosis and baseline eGFR < 60 ml/min per 1.73 m2 predicted the development of AKI while on DAAs in multivariable models. Prolonged DAA course was defined as >12 weeks of treatment.
Of the 29 cases of AKI defined by a rise in creatinine > 1.5 from baseline while on DAAs, the cause of AKI was deemed unrelated to DAAs with an alternate explanation in 17 patients (59%), due to hepatic decompensation in 5 patients (17%), and possibly related to DAAs in 7 patients (24%) (Figure 3).12 Alternate causes of AKI included prerenal azotemia from the introduction of new or increased antihypertensive medications or diuretics (n = 5), sepsis (n = 4), dehydration from gastrointestinal illness or colonoscopy preparation (n = 3), and 1 case each of AKI in association with nephrolithiasis, congestive heart failure, hemorrhagic shock, glomerulonephritis with Henoch-Schonlein purpura identified before starting DAAs, and a laboratory error.
Figure 3 |. Etiology, severity, and reversibility of acute kidney injury (AKI) events during direct-acting antiviral (DAA) therapy. There were 29 AKI events on DAA therapy.

There was an alternative cause of AKI for most of the cohort (n = 17), and an additional 5 events were due to hepatic decompensation, and 7 events possibly were related to DAA therapy because an alternative cause could not be found on chart review. Most AKI events (79%) were transient (23 of 29). Of the 7 events possibly related to DAA therapy, 6 had stage 1, 0 had stage 2, and 1 had stage 3 AKI. Most (71%) were transient (5 of 7). Detailed summaries of AKI events are shown in Supplementary Table S7. AKIN, Acute Kidney Injury Network.12
Of the 29 cases of AKI, creatinine quickly recovered to within 0.2 mg/dL of baseline in 23 patients (79%); thus, only 6 patients (0.5%) treated with DAAs had persistent worsening of kidney function during therapy (Figure 3). Of the 7 cases possibly related to DAAs, 5 (71%) were transient and serum creatinine recovered without cessation of DAAs. Thus, only 2 of 1098 patients (0.18%) had AKI leading to persistent worsening of kidney function that was possibly attributed to DAAs. Deidentified case summaries of patients with AKI are provided in Supplementary Table S7.
DISCUSSION
This study is one of the largest to evaluate kidney function on DAAs. With sufficient numbers to evaluate the effect of DAAs on slope of eGFR decline, we found that patients with eGFR < 60 ml/min per 1.73 m2 experienced a significant stabilization of eGFR decline after DAAs. We found that DAA therapy was likely to stabilize or improve eGFR, particularly in those with nondiabetic CKD. Albuminuria was significantly improved in patients with nondiabetic CKD. We hypothesize that a substantial number of patients with HCV infection who have nondiabetic CKD may have undiagnosed HCV-related glomerular disease. Prior histopathologic series have suggested that glomerular abnormalities can be seen in 55% to 85% of unselected patients with HCV infection at the time of liver transplant or death.13,14 This phenotype of kidney disease seems most likely to respond favorably to DAAs.
A previous study that suggested higher rates of “worsening renal function” in patients with CKD treated with sofosbuvir-based DAAs found a 15% rate of worsening renal function in those with eGFR < 45 ml/min per 1.73 m2 compared with 1% in patients with eGFR ≥ 45 ml/min per 1.73 m2.11 However, this study used text-related diagnosis codes entered under adverse event reports to establish the diagnosis of worsening renal function, whereas our study relied on raw creatinine values and staged AKI events based on established diagnostic criteria. Previous studies also did not attempt to attribute cause or determine reversibility of AKI events. We found that although AKI events were slightly more common in patients with eGFR < 60 ml/min per 1.73 m2 compared with those with normal eGFR, there were no stage 2 or 3 AKI events in patients with stage 3 CKD and most AKI episodes were unrelated to DAAs and resolved without the need to discontinue DAAs. CKD itself is a known risk factor for AKI15; thus, it is not surprising that overall AKI events were slightly higher in patients with CKD compared with those with normal eGFR. The package insert for sofosbuvir recommends that it not be used in patients with eGFR < 30 ml/min per 1.73 m2. Because only an extremely small number of patients in this study had eGFR < 30 ml/min per 1.73 m2 we did not provide any additional information about the safety or the effect of DAAs on kidney function decline in patients with advanced CKD. Clinical trials using elbasvir and grazoprevir or glecaprevir and pibrentasvir, each of which are hepatically metabolized, have demonstrated safety and efficacy in patients with eGFR < 30 ml/min per 1.73 m2; thus, there is little reason to use sofosbuvir-based DAAs in this population.16,17
Prior studies of interferon-treated patients have suggested that HCV therapy can decrease the incidence of CKD and decrease the rate of end-stage renal disease. Satapathy et al.18 found in their US-based cohort that receiving interferon therapy was a significant negative predictor of incident CKD. In 2 studies of national Taiwanese cohorts, receipt of interferon-based treatment resulted in a 58% reduction in incident CKD and an 84% decreased risk of end-stage renal disease.19,20 Interferon-based regimens, which until DAAs were the backbone of HCV treatment, were poorly tolerated, had low rates of SVR, and treatment of patients with CKD was difficult, given the renal elimination of ribavirin. As a result, very few patients with CKD ever received interferon-based therapies. The introduction of DAA regimens marks the first time we can comprehensively evaluate the effect of HCV eradication on kidney function, because large numbers of patients are now undergoing safe and effective treatment of HCV. Small studies of patients treated with DAAs suggest they may be beneficial for kidney function. In a study of HCV-infected liver transplant recipients, DAAs and SVR improved renal function in those with mild CKD.21 A prior study including 57 patients with eGFR < 60 ml/min per 1.73 m2 showed SVR was associated with improvement in eGFR in a multivariable model.22 A recent prospective study of 94 patients with HCV treated with sofosbuvir showed an average improvement in eGFR of approximately 10 ml/min per 1.73 m2 at 1 year; however, there were only 9 patients with CKD, defined as eGFR < 45 ml/min per 1.73 m2 in this study.23
Our study has several limitations. Although the cohort is large, it was sourced from a single healthcare system, hence raising concerns about the generalizability to other populations. A major limitation is the retrospective nature of the data collection. It is possible that patients had AKI events that were managed at hospitals outside our healthcare network and that the rate of AKI events was underestimated. We only included patients who had at least 1 creatinine measured while on DAA therapy to ensure that patients getting most of their care outside our healthcare system were not included in the analysis. We could have missed AKI events that were related to DAAs that were not detected until shortly after the treatment period, because we only evaluated on-treatment values. Accurately estimating a baseline creatinine using retrospective data is challenging, and published series have used a variety of approaches, each of which may lead to bidirectional misclassification of the baseline and thus misclassification of AKI incidence and severity. In all “average periods,” we only allowed 1 creatinine per week to ensure that inpatient stays were not over-weighted in determining the baseline. Analysis of eGFR slope is limited when patients either have a limited number of values or their values only covered a short period of follow-up either before or after DAAs; however, our patients had on average > 7 values before and after therapy used to construct slopes. Only some patients were treated with non–sofosbuvir-containing regimens; thus, it is difficult to extend the conclusions from this analysis to other DAA regimens. Newer therapies, such as elbasvir and grazoprevir or glecaprevir and pibrentasvir, which include the combinations of hepatically metabolized NS3/4A protease inhibitors and NS5A inhibitors, were more recently approved and have been studied in clinical trials in patients with advanced CKD and on dialysis; however, these agents were not commonly used in this cohort.16,17 This study is limited by the absence of a control group. However, using patients whose HCV infection has not yet been treated as a comparison group is problematic because these patients differ very significantly from those who have been prescribed DAAs. Untreated patients are often not linked to medical care, have an alternate terminal illness, are waiting for solid organ transplantation, are uninsured, or are still actively using illicit drugs. In this study we allowed patients to serve as their own control, comparing their slope of eGFR decline before and after initiating DAAs to determine whether DAAs affected kidney function. Finally, recipients of solid organ transplants were excluded; data on what factors affect eGFR decline in HCV-infected transplant recipients are needed.
In conclusion, DAAs slowed the rate of eGFR decline in patients with impaired renal function at baseline (eGFR < 60 ml/min per 1.73 m2), with extremely low rates of AKI attributed to DAAs. This is the first analysis showing that DAAs may slow the rapid decline in eGFR associated with chronic HCV infection. In the era of DAAs, HCV infection may be a reversible risk factor for CKD progression. Future analyses with longer follow-up are needed to determine if DAAs decreases the incidence of end-stage renal disease in patients with HCV infection.
METHODS
Study population
This is a retrospective observational cohort study at Partners Healthcare in Boston, Massachusetts. The design and presentation of the results follows the STROBE guidelines for cohort studies. Patients were identified by query of the Research Patient Data Repository, which is a centralized data registry that gathers clinical information on patients seen in the Partners Healthcare system captured in the electronic health record. DAA-treated patients were identified by searching under the medication records using the names of all DAA therapies approved before October 15, 2017. Each patient’s electronic health record was reviewed to confirm that at least 1 dose of DAAs was taken by the patient and to confirm the exact start date. Additionally, treatment duration, DAA regimen used, and early discontinuations of therapy were recorded based on chart review. Patients were excluded if the exact start date of DAA therapy was unclear (Figure 1). A prolonged course of DAA therapy was defined as any DAA therapy exceeding 12 weeks.
Comorbid conditions including hypertension and cirrhosis were determined by International Classification of Disease, Ninth Revision, codes appearing at least twice in the electronic health record. Diabetes was determined by either hemoglobin A1c value ≥ 6.5 or by prescription of a glucose-lowering medication accompanied by an International Classification of Disease, Ninth Revision, code for diabetes mellitus. HIV infection was determined by prescription of HIV-specific antiretroviral therapy. Liver and kidney transplant status was determined by chart review, and the date of most recent transplant was recorded. Race was determined by self-report. Patients who underwent liver or kidney transplantation were excluded because of instability of kidney function at the time of kidney or liver transplantation as well as the need for nephrotoxic immunosuppressant medications likely affecting kidney function decline.
Determination of virologic and clinical outcomes
DAA therapy was prescribed at the discretion of the treating physician; treatment regimens depended on the genotype, presence of cirrhosis, and prior treatment experience. SVR was defined as an undetectable HCV RNA at least 12 weeks after the completion of therapy.24 Laboratory values obtained before, during, and after treatment that were done as a part of routine care. All creatinine values were analyzed.
Baseline kidney function was defined by average eGFR calculated using all available creatinine measures in the 6 months before the DAA start date. Patients who did not have any creatinine values during this 6-month period had all values included up to 12 months before starting DAAs. Patients without a baseline creatinine measured in the 12 months before starting DAAs were excluded. A sensitivity analysis was performed to determine whether baseline characteristics or clinical outcomes varied based on how the baseline creatinine was obtained (Supplementary Table S1). eGFR was calculated using the Chronic Kidney Disease Epidemiology Collaboration equation.25 For all average periods, including the baseline, on-treatment, and post-treatment averages, and to generate slope of eGFR decline, to address fluctuations related to acute illness or inpatient hospitalizations, if there was a group of measurements where any 2 measurements were within 8 days of each other, we used the serum creatinine measurement taken on the median date in the group. This median creatinine measurement was used for the eGFR calculation, so that there was no more than 1 eGFR measurement per week used to establish average eGFR or determine eGFR slope. Baseline CKD stage was defined by eGFR.26
During DAA therapy, all creatinine values were recorded. On-treatment AKI was defined by at least a 1.5-fold increase in creatinine at any time during DAA therapy from the baseline creatinine.12,27 The AKI Network stages of AKI were used to grade AKI severity.12 The causes of AKI were independently reviewed by 2 nephrologists (MES, YO) to determine the most likely etiology of AKI. We defined a “quick recovery” of AKI events as serum creatinine returning to within 0.2 mg/dL of the baseline creatinine within 1 week or at the next time it was measured (Supplementary Table S7).
Statistical analysis
Baseline characteristics of the overall cohort and each of the analysis cohorts were described using mean ± SD or percent. In all cases we chose a priori to evaluate the effect of baseline CKD, defined as eGFR < 60 ml/min per 1.73 m2 on each of the outcomes.
Analysis 1 aimed to compare the slope of eGFR decline in the 3 years before starting DAA therapy and the follow-up period beginning after starting DAA therapy until final follow-up creatinine for each patient, up to 3 years after starting DAAs, and to determine predictors of eGFR improvement after HCV treatment. The average duration of follow-up was summarized by mean and SD. Patients were excluded if they did not have at least 2 creatinine values measured in the 3 years before and at least 2 creatinine values measured after DAA therapy start date (Figure 1). We computed the slope of eGFR in ml/min per year using eGFR values from 3 years before and up to 3 years after DAA therapy by applying generalized estimating equations and a sandwich estimator of variance to account for correlations within the same subject. The pre-post difference in the slope of eGFR decline was estimated based on the interaction term between the DAA therapy indicator and the time trend, adjusting for age, diabetic status, and baseline eGFR. We initially included gender and race in our multivariate generalized estimating equation models, but they were not significant confounders in our patient population. Therefore, they were not included in our final models. We stratified the analysis by the baseline CKD status. We performed a sensitivity analysis using the same method but using only eGFR values measured within 1 year before and after DAA therapy (Supplementary Table S3).
To evaluate predictors of eGFR improvement after DAA therapy, a post-treatment average follow-up eGFR was generated by averaging all creatinine values in the 12 months after completing DAA therapy. As in the baseline period, to address fluctuations related to acute illness or inpatient hospitalizations, we used the median serum creatinine of any group of measurements where there were at least 2 successive measurements within 8 days of each other, such that there was no more than 1 eGFR measurement per week used to establish the post-treatment average eGFR. “eGFR improvement” was defined as at least a 10% increase in eGFR from baseline to follow-up. A logistic regression model was used to determine baseline factors associated with eGFR improvement after DAA therapy; odds ratios and 95% CIs were used to summarize the results of this model. A multivariable regression model predicting eGFR improvement included adjustment for demographics and any other variables that were significant to the level of 0.3 in univariate models. As a sensitivity analysis, we redefined eGFR improvement as at least a 10 ml/min per 1.73 m2 increase in eGFR to determine if predictors of eGFR improvement were consistent regardless of whether we defined this variable as a percent or absolute increase in eGFR (Supplementary Table S4). We also performed linear regression on the change in eGFR from baseline to the post-treatment average follow-up eGFR to have more power to evaluate predictors of changes in eGFR with therapy (Supplementary Table S5).
Because our prior analysis demonstrated that diabetes status impacted the likelihood of eGFR improvement in patients with CKD,27 we performed a stratified analysis of all patients with CKD. We compared the difference in eGFR from the baseline period to the post-treatment average follow-up eGFR as defined above (Figure 2a). We also compared the difference in albuminuria before and after DAA therapy (Figure 2b). Any patient with quantified proteinuria or albuminuria within 1 year before beginning DAA therapy and at least 1 quantification in the first year after completing DAA therapy was included in the analysis of albuminuria. When multiple measurements were available, we analyzed the quantification closest to the time of DAA start and the value closest to the time of SVR (12 weeks after completion of DAAs). Because albuminuria was more commonly measured than total proteinuria, we converted those who only had proteinuria assessed to a corresponding urinary albumin value by multiplying by 0.67. Because albuminuria was not normally distributed, we performed statistical testing on the natural log transformed values.
Analysis 2 sought to define the incidence, cause, and reversibility of AKI events occurring while taking DAA therapy. Patients were excluded if they did not have a creatinine measured while on DAA therapy (Figure 1). The average eGFR on DAA therapy was calculated using the CKD-epi equation.25 To determine the rate of AKI events, we calculated the fold-change from average baseline creatinine to all on-treatment creatinine values, and any increase >1.5-fold from baseline met criteria for AKI.12 Rates of AKI events, by stage, were calculated and stratified by baseline eGFR. A logistic regression model was used to determine baseline factors associated with AKI events during DAA therapy; odds ratios and 95% CIs were used to summarize the results of this model. A multivariable regression model predicting AKI included adjustment for demographics and any other variables that were significant to the level of 0.3 in univariate models. Because of the small number of AKI events, we used a Firth’s correction to account for small sample bias with profile penalized likelihood CIs applied. Additionally, to increase the number of AKI events, we performed a sensitivity analysis to determine predictors of AKI defined by a rise in serum creatinine > 1.3-fold from baseline (Supplementary Table S6).
All analyses were performed with R version 3.3 or Stata version 13 (StataCorp LLC, College Station, TX). A 2-sided P < 0.05 was considered to indicate statistical significance. The Institutional Review Board at Partners Healthcare System approved this study and waived the need for informed consent.
Supplementary Material
Table S1. Baseline characteristics and AKI outcomes by timing of baseline eGFR determination.
Table S2. DAA regimens and sustained virologic response rates, by genotype.
Table S3. Average change in eGFR in 1 year before and 1 year after DAA therapies by baseline CKD status.
Table S4. Univariate and multivariable logistic regression model predicting eGFR improvement ≥ 10 ml/min per 1.73 m2 after DAA therapy.
Table S5. Univariate and multivariable linear regression model predicting change in eGFR (ml/min per 1.73 m2) after DAA therapy.
Table S6. Univariate and multivariable logistic regression model predicting mild AKI (1.3-fold increase) while on DAA therapy.
Table S7. Summary of AKI events on DAA therapy.
ACKNOWLEDGMENTS
MES was supported by National Institutes of Health grant K23 DK117014. RTC was supported by National Institutes of Health grant K24 DK078772.
DISCLOSURE
MES received research grant funding from Gilead Sciences and is a scientific advisory board participant for Abbvie and Merck. RTC received research grants to the institution from Gilead Sciences, Abbvie, Merck, Bristol-Myers Squibb, Janssen, Boehringer Ingelheim, and Roche. RT is a consultant for Merck and Fresenius Medical Care. All other authors declared no competing interests.
Footnotes
Supplementary material is linked to the online version of the paper at www.kidney-international.org.
REFERENCES
- 1.Younossi Z, Park H, Henry L, et al. Extrahepatic manifestations of hepatitis C: a meta-analysis of prevalence, quality of life, and economic burden. Gastroenterology. 2016;150:1599–1608. [DOI] [PubMed] [Google Scholar]
- 2.Su FH, Su CT, Chang SN, et al. Association of hepatitis C virus infection with risk of ESRD: a population-based study. Am J Kidney Dis. 2012;60: 553–560. [DOI] [PubMed] [Google Scholar]
- 3.Tsui JI, Vittinghoff E, Shlipak MG, et al. Association of hepatitis C seropositivity with increased risk for developing end-stage renal disease. Arch Intern Med. 2007;167:1271–1276. [DOI] [PubMed] [Google Scholar]
- 4.Lee JJ, Lin MY, Chang JS, et al. Hepatitis C virus infection increases risk of developing end-stage renal disease using competing risk analysis. PloS One. 2014;9:e100790. [DOI] [PMC free article] [PubMed] [Google Scholar]
- 5.Molnar MZ, Alhourani HM, Wall BM, et al. Association of hepatitis C viral infection with incidence and progression of chronic kidney disease in a large cohort of US veterans. Hepatology. 2015;61:1495–1502. [DOI] [PMC free article] [PubMed] [Google Scholar]
- 6.Liangpunsakul S, Chalasani N. Relationship between hepatitis C and microalbuminuria: results from the NHANES III. Kidney Int. 2005;67:285–290. [DOI] [PubMed] [Google Scholar]
- 7.Fissell RB, Bragg-Gresham JL, Woods JD, et al. Patterns of hepatitis C prevalence and seroconversion in hemodialysis units from three continents: the DOPPS. Kidney Int. 2004;65:2335–2342. [DOI] [PubMed] [Google Scholar]
- 8.Feld JJ, Jacobson IM, Hezode C, et al. Sofosbuvir and velpatasvir for HCV genotype 1, 2, 4, 5, and 6 infection. N Engl J Med. 2015;373:2599–2607. [DOI] [PubMed] [Google Scholar]
- 9.Zeuzem S, Foster GR, Wang S, et al. Glecaprevir-pibrentasvir for 8 or 12 weeks in HCV genotype 1 or 3 infection. N Engl JMed. 2018;378:354–369. [DOI] [PubMed] [Google Scholar]
- 10.Sulkowski MS, Gardiner DF, Rodriguez-Torres M, et al. Daclatasvir plus sofosbuvir for previously treated or untreated chronic HCV infection. N Engl J Med. 2014;370:211–221. [DOI] [PubMed] [Google Scholar]
- 11.Saxena V, Koraishy FM, Sise ME, et al. Safety and efficacy of sofosbuvir-containing regimens in hepatitis C-infected patients with impaired renal function. Liver Int. 2016;36:807–816. [DOI] [PMC free article] [PubMed] [Google Scholar]
- 12.Mehta RL, Kellum JA, Shah SV, et al. Acute Kidney Injury Network: report of an initiative to improve outcomes in acute kidney injury. Crit Care. 2007;11:R31. [DOI] [PMC free article] [PubMed] [Google Scholar]
- 13.Arase Y, Ikeda K, Murashima N, et al. Glomerulonephritis in autopsy cases with hepatitis C virus infection. Intern Med. 1998;37:836–840. [DOI] [PubMed] [Google Scholar]
- 14.McGuire BM, Julian BA, Bynon JS Jr, et al. Glomerulonephritis in patients with hepatitis C cirrhosis undergoing liver transplantation. Ann Intern Med. 2006;144:735–741. [DOI] [PubMed] [Google Scholar]
- 15.Hsu CY, Ordonez JD, Chertow GM, et al. The risk of acute renal failure in patients with chronic kidney disease. Kidney Int. 2008;74:101–107. [DOI] [PMC free article] [PubMed] [Google Scholar]
- 16.Roth D, Nelson DR, Bruchfeld A, et al. Grazoprevir plus elbasvir in treatment-naive and treatment-experienced patients with hepatitis C virus genotype 1 infection and stage 4–5 chronic kidney disease (the C-SURFER study): a combination phase 3 study. Lancet. 2015;386:1537–1545. [DOI] [PubMed] [Google Scholar]
- 17.Gane E, Lawitz E, Pugatch D, et al. Glecaprevir and pibrentasvir in patients with HCV and severe renal impairment. N Engl J Med. 2017;377: 1448–1455. [DOI] [PubMed] [Google Scholar]
- 18.Satapathy SK, Lingisetty BCS, Williams BS. Higher prevalence of chronic kidney disease and shorter renal survival in patients with chronic hepatitis C virus infection. Hepatol Int. 2012;6:369–378. [DOI] [PubMed] [Google Scholar]
- 19.Chen Y-C, Hwang S-J, Li C-Y, et al. A Taiwanese Nationwide cohort study shows interferon-based therapy for chronic hepatitis c reduces the risk of chronic kidney disease. Medicine (Baltimore). 2015;94:e1334. [DOI] [PMC free article] [PubMed] [Google Scholar]
- 20.Hsu Y-C, Ho HJ, Huang Y-T, et al. Association between antiviral treatment and extrahepatic outcomes in patients with hepatitis C virus infection. Gut. 2015;64:495–503. [DOI] [PubMed] [Google Scholar]
- 21.Blé M, Aguilera V, Rubín A, et al. Improved renal function in liver transplant recipients treated for hepatitis C virus with a sustained virological response and mild chronic kidney disease. Liver Transpl. 2014;20:25–34. [DOI] [PubMed] [Google Scholar]
- 22.Sise ME, Backman E, Ortiz GA, et al. Effect of sofosbuvir-based hepatitis C virus therapy on kidney function in patients with CKD. Clin J Am Soc Nephrol. 2017;12:1615–1623. [DOI] [PMC free article] [PubMed] [Google Scholar]
- 23.Medeiros T, Rosario NF, Saraiva GN, et al. Renal safety after one year of sofosbuvir-based therapy for chronic hepatitis C: a Brazilian “real-life” study. J Clin Pharm Ther. 2018;43:707–713. [DOI] [PubMed] [Google Scholar]
- 24.Yoshida EM, Sulkowski MS, Gane EJ, et al. Concordance of sustained virological response 4, 12, and 24 weeks post-treatment with sofosbuvir-containing regimens for hepatitis C virus. Hepatology. 2015;61:41–45. [DOI] [PubMed] [Google Scholar]
- 25.Levey AS, Stevens LA, Schmid CH, et al. A new equation to estimate glomerular filtration rate. Ann Intern Med. 2009;150:604–612. [DOI] [PMC free article] [PubMed] [Google Scholar]
- 26.Levin A, Stevens PE. Summary of KDIGO 2012 CKD guideline: behind the scenes, need for guidance, and a framework for moving forward. Kidney Int. 2014;85:49–61. [DOI] [PubMed] [Google Scholar]
- 27.Bellomo R, Ronco C, Kellum JA, et al. Acute Dialysis Quality Initiative w. acute renal failure—definition, outcome measures, animal models, fluid therapy and information technology needs: the Second International Consensus Conference of the Acute Dialysis Quality Initiative (ADQI) group. Crit Care. 2004;8:R204–R212. [DOI] [PMC free article] [PubMed] [Google Scholar]
Associated Data
This section collects any data citations, data availability statements, or supplementary materials included in this article.
Supplementary Materials
Table S1. Baseline characteristics and AKI outcomes by timing of baseline eGFR determination.
Table S2. DAA regimens and sustained virologic response rates, by genotype.
Table S3. Average change in eGFR in 1 year before and 1 year after DAA therapies by baseline CKD status.
Table S4. Univariate and multivariable logistic regression model predicting eGFR improvement ≥ 10 ml/min per 1.73 m2 after DAA therapy.
Table S5. Univariate and multivariable linear regression model predicting change in eGFR (ml/min per 1.73 m2) after DAA therapy.
Table S6. Univariate and multivariable logistic regression model predicting mild AKI (1.3-fold increase) while on DAA therapy.
Table S7. Summary of AKI events on DAA therapy.