Abstract
Idiopathic toe walking on the balls of the feet is commonly found in children. Many toddlers who are just beginning to walk show signs of toe walking, but when toe walking persists after two years of age, the child’s risk of falling increases as well as the risk of other developmental delays. Idiopathic toe-walking is estimated to occur in 7 to 24% of children. In order to address the problem of toe walking and assess improvements due to intervention, one needs to identify heel-toe gait versus toe-toe gait in natural environments of idiopathic toe walkers. The aim of this study was to investigate if learning algorithms utilizing triaxial accelerometers and gyroscopes from wearable sensors could detect and differentiate heel-toe gait versus toe-toe gait. In this study, 5 adolescents (13± 5 years) patients with idiopathic toe walking characteristics wore inertial sensor at L5 – S1 joint. New interventions can be designed for idiopathic toe walking population, but currently, it is a challenge to quantify the efficiency of toe-walking intervention. In recent times, with the advancement of machine learning classification methods and powerful computing, longitudinal data from wearable sensors can be used to accurately classify gait abnormalities. The aim of this study was to investigate machine learning methods to classify toe-toe walking versus heel-toe walking using data from a single inertial sensor. We found that k-means clustering was successful in differentiating toe walking with that of typical walking signals. We found that some of the linear variability based features such as standard deviation, Root Mean Square (RMS), and kurtosis contained most of the variability among the data and could therefore distinguish toe-toe gait versus heeltoe gait through clustering. The k-means cluster provided an 82% accuracy score with a specificity of 83% and sensitivity of 86%. We further utilized Recurrent Convolution Neural Network (RNN) such as Long Short-Term Memory (LSTM). The LSTM model was another classification method that was used to distinguish between toe-toe gait and heel-toe gait. Wearable sensors integrated with machine and deep learning algorithms have the capability to transform current on-going therapy methods and monitor patients longitudinally for their improvement in gait. These novel learning-based techniques could successfully classify toe walking gait and help in estimating the efficacy of the treatment in idiopathic toe walking adolescents.
Keywords: idiopathic tow walkers (ITW), toe-toe gait, heel-toe gait
INTRODUCTION
Toe walking is usually associated with cerebral palsy, muscular dystrophy, autism spectrum disorders, and global developmental delay[1]. Idiopathic Toe Walkers (ITW) are normally children (above the age of 3 years) without a medical condition who are observed with a condition of toe walking[2]. In fact, toe walking is a normal variation in gait during child development upto the age of 3 years[2], and the complete maturation of ankle dorsiflexion during the foot contact is usually at the age of five years[3, 4].
Pediatric orthopedic surgeons and physical therapists define toe walking as symptomatic of decreased ankle range of motion and an inability to make a heel strike during the initial phase of foot contact[5]. Idiopathic toe-walking is estimated to occur in 7 to 24% of children[6, 7]. In order to study toe-walking severity and design an intervention for gait rehabilitation one has to identify when and for how much duration the toe walking is occurring in ITW. Machine learning has been applied in gait research to classify fatigue[8] and estimate minimum toe clearance[9]. Deep learning is a category of learning algorithms which have multiple non-linear processing neural layers. Deep learning methods have been found to out-perform machine learning algorithms [10–12]. It is not known whether machine learning or deep learning algorithms can detect gait differences during toe walking. In this study, we investigated several learning-based techniques to classify toe walking versus typical walking among idiopathic toe walking adolescents.
METHODS
Data Collection:
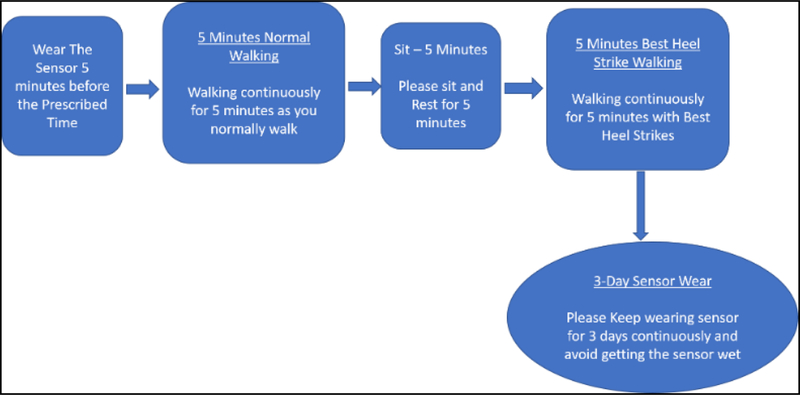
Five adolescents aged 13± 5 years, participated in this study. The study was approved by Children’s Hospital of Orange County (CHOC) and Chapman University. The body-fixed sensor or wearable sensor used is Dynaport (Motion Monitor+ McRoberts BV, The Hague, The Netherlands), which is small, lightweighted, and portable. The Dynaport contains three axis piezo-capacitive acceleration and gyroscope sensors, each measuring at a sample rate of 100 Hz. Data is stored on an inbuilt SD card. The sensor (size 84 mm × 50mm × 8 mm; weight 44.5g) is placed in a belt which is strapped around the waist. It is positioned at L5/S1, above posterior iliac spine. Each participant was diagnosed with idiopathic toe-walking characteristics by the physician at CHOC. The participants, who opted for this study were given the following instructions: they were first asked to wear the sensor 5 minutes prior to scheduled start time at their low-back (L5-S1). They then walked their typical gait walking cycle for 5 minutes; in this case, their “normal” walking was a toe-toe gait. They then had to sit down for 5 minutes, and after 5 minutes they were directed to walk with their “best heel strike” which tries to mimic a heel-to-toe gait stride. After these steps were completed, the participants kept wearing the sensor on their lower back for 3 days even while they were sleeping. They had to remove the sensor whenever there was a risk of getting wet, so they had to remove the sensor while at shower or while swimming. After the 3 days of data were gathered, the participants received intervention and treatment for their toe-walking tendencies. Then the participants wore the inertial sensor for 3 days again to collect their movement data again. Below is a schematic diagram of the steps that were taken to collect the data.
Walking detection Algorithm:
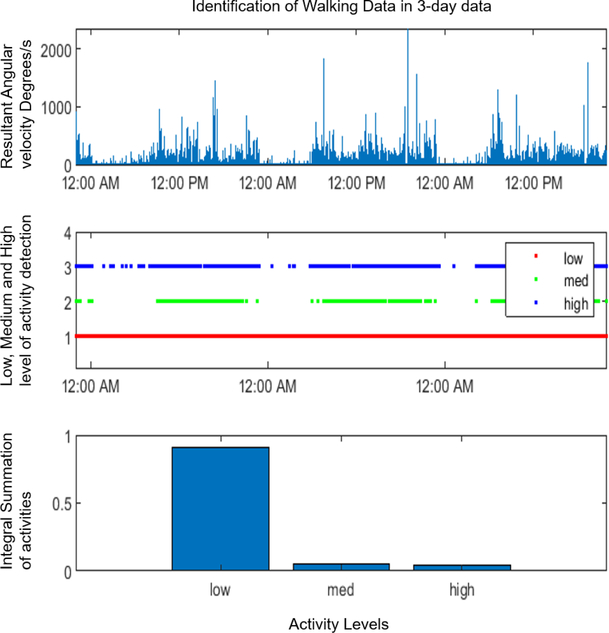
The preprocessing step was to detect walking from 3-day longitudinal monitoring data. To identify walking, a thresholding technique was used based on the magnitudes of the gyroscope data. If the magnitude of the gyroscope data fell between the values of 20 and 40 (first and third quartile of magnitudes generated), then it was classified as walking data. The diagram below displays how the thresholding algorithm can efficiently identify walking data from the resultant gyroscope data (Figure 2). The red line represents the values less than 20, labeled low. The green line represents the values between 20 and 40, labeled medium. The blue line represents the values above 40, labeled high. The green line is what is being extracted as walking data.
Fig. 2.
A diagram that shows how thresholding the magnitude of gyroscope data between 20 and 40 extracts walking data
K Means Clustering:
K-means clustering is a popular cluster analysis method in data mining, it is a method of vector quantization. We performed K-Means Clustering using inertial data to differentiate heel-toe walking data and toe-toe walking data. K Means clustering is a simple unsupervised learning method and uses centroids to group data. Labels are not required to cluster in this method. This was initially used to find groups and patterns in the data to see if there were distinct differences in toe walking/walking metrics. An accelerometer and gyroscope with a frequency of 100 Hz were used to collect this data. The accelerometer contained 3 columns of data that related to the x, y, z coordinates of acceleration, and the gyroscope contained 3 columns of data that related to angular velocities. One minute of walking data with 6 features created roughly 6000 data points for each gait cycle. The magnitudes of the accelerometer and magnitude of the gyroscope were calculated and normalized.
A sliding window of 1 s width (100 data points) that captured 1 gait cycle was applied[13]. Because the gait cycle is on average 1 second, the mean, standard deviation, covariance, root mean square, kurtosis, and skew were calculated for every second of normalized data. Once the features were computed, the VIF (Variance Inflation Factor) factors were determined to check for multi-collinearity. The features that had high VIFs were removed, and the dataset was checked for multi-collinearity again. This step was repeated until the VIF factors equaled less than or equal to 5. After repeating the steps and checking the VIF scores, minimum features were left. These three features are standard deviation, RMS, and Kurtosis.
Since there are two groups, toe walk and typical walk, we know to set the cluster to k= 2. “City block” (Manhattan) distance was used instead of “Euclidean” distance because the “City block” method allowed for the data to be separated by clusters in a vertical dimension space instead of a horizontal dimension space. The k-means clustering method was replicated 10 times to make sure the smallest total sum of distances was chosen for the centroids.
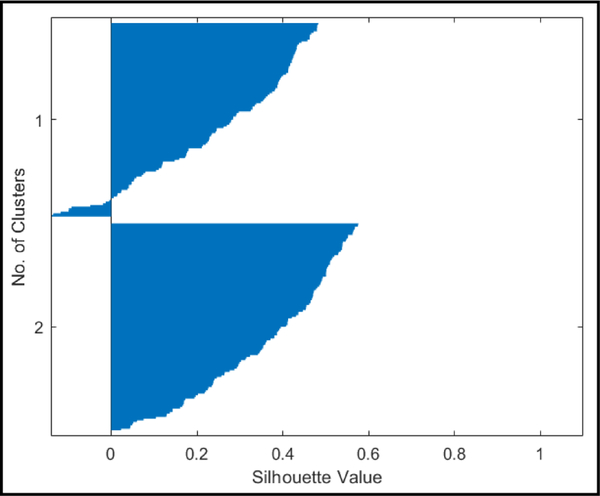
A silhouette score was also calculated for the k-means clustering technique. The silhouette score measures how close each point in one cluster is to the points in the neighboring clusters to provide a way to assess for optimal number of clusters.
Long Short-Term Memory (LSTM) Model:
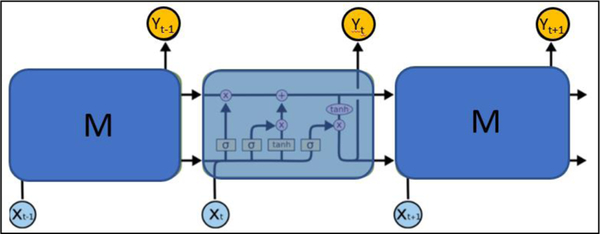
LSTM is a variation of deep learning networks and can learn the temporal dynamics of sequential data, which are suited well for learning from time series data. The LSTM is an industry standard type of Recurrent Neural Network (RNN) that is capable of learning long term dependencies from sequential data. Previous studies have shown that LSTM have very high accuracy of classification from wearable sensor signals[14]. Figure 5 shows an example of a basic RNN where xt represents the input, M represents the hidden state or memory cell, and yt represents the output. Because of the loop that occurs within the hidden state, an RNN can successfully model sequential data. LSTMs have the same general architectural structure as RNNs, but instead of having a single neural network layer, there are four layers of neural network. The LSTM’s memory cell contains three gates to control the cell state. These gates optionally let information through and are normally composed of a sigmoid neural network. Below is a visual representation of the memory cell and the gates that control the cell state (figure 3 and figure 4). The original accelerometer and gyroscope data were used as inputs for this model so that it could train on the dependencies of the 6 features (3-axes accelerometer and 3-axes gyroscope). The number of hidden units are related to the dimensional space of the training model. The number of hidden units were set to the frequency of the inertial sensor. The frequency of the sensor was set to 100 Hz, so the number of hidden units equaled 100. The number of classes equaled two (heel-toe walking classification versus toe-toe walking classification). There is a total of five layers in the architecture of the LSTM network. A sequence input layer was the first layer, and it is generally used for an input of sequences or time series data. In our case, it for the time series data. Following the sequence input layer was the LSTM layer, which learns the long-term dependencies between the time steps of sequence data. Next is the fully connected layer which vectorizes the information into a 2-dimensional vector which prepares the model for the classification output. The next layer is the softmax layer which contains the softmax distribution. It outputs a probability distribution of the inputs of how likely it falls under each classification. The last layer is the classification output layer, and in this case it is either “Toe-Walking” or “Normal Walking” (heel to toe gait). The units in LSTM control the information learned from previous time steps to the future model[15].
Fig. 5.
Plot of silhouette scores. The optimal number of clusters is 2 (toe walk versus normal walk)
Fig. 3.
An unrolled or unfolded RNN
Fig. 4.
An unrolled LSTM that shows the three gates within the memory cell of the neural network.
RESULTS
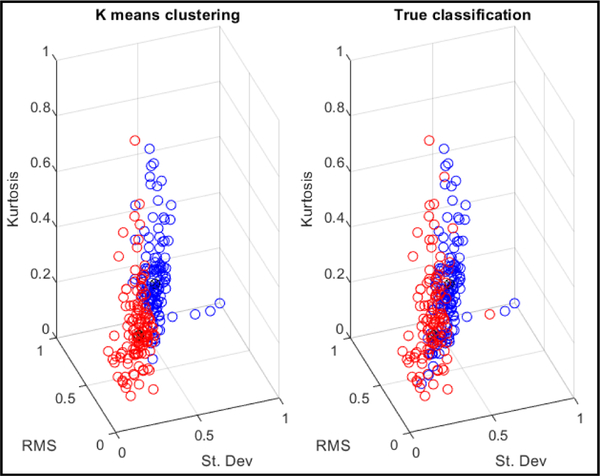
We found that K Means highlighted 3 important features for toe walking classification (Table 1) and VIF factors were used to check for multicollinearity among them. We found that the smallest total sum of distances was calculated to equal 49.44. We found that the silhouette plot showed that 2 clusters gave the best score. The average silhouette score for ‘city block’ was 0.31. The results for the K-Means clustering method show the clusters that were formed for toe-walking and normal walking. The figure below shows that the left side is the k-means cluster that was computed, and the right is the true cluster of the truth data. Because we have the true values of the classification, an accuracy score was computed to equal around 82%. The sensitivity score (true positive rate) was calculated to equal 86%, and the specificity score (true negative rate) was calculated to equal 83%.
Table 1:
Calculated VIF Factors that check for multicollinearity
| Mean | Cov. | Skew | St.Dev | RMS | Kurtosis | |
|---|---|---|---|---|---|---|
| Mean | 2615.8 | 39.1 | 7.9 | 398.4 | 4435.8 | 7.0 |
| Covariance | X | 38.8 | 7.5 | 28.0 | 6.7 | 6.6 |
| Skew | X | X | 7.2 | 4.7 | 4.5 | 6.3 |
| St. Dev | X | X | X | 3.8 | 3.8 | 1.1 |
LSTM:
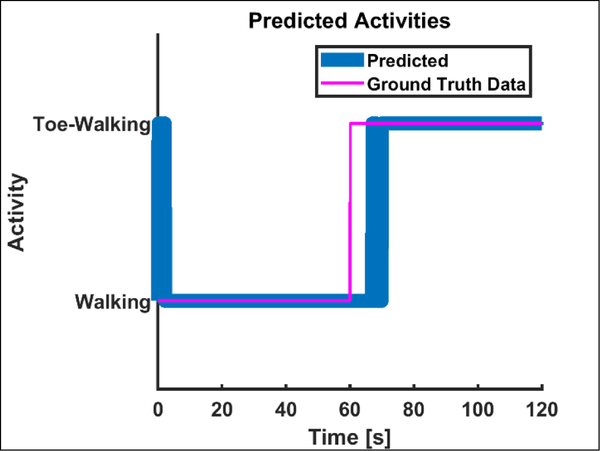
The LSTM model was trained on 80% of the data, validated on 10%, and tested on 10% of the data to classify for toe-walking and normal walking. Training that was done on the model as well as the loss function. Because a classification layer was used, the loss function was the cross entropy (logarithmic) loss. The loss function measures the error between the predicted y and the actual y. The diagram below shows that as the model becomes more accurate through back propagation and validation, the difference between the predicted y and the actual y gets closer and closer to zero. The training score for the model was used was 99.5%. The figure below shows how the LSTM model performed on the test data. The pink colored line represents the ground truth classified data, and the thick blue line represents the prediction that the model made with the accelerometer and gyroscope data. The first model performed fairly well on the testing data and got an accuracy score of 94.3%. A sensitivity score of 89.3% was calculated as well as a specificity score of 99.3%.
The LSTM model performed better in classifying than the k-means clustering method, and the data did not have to be pre-processed to get a high accuracy score. The k-means clustering technique however did provide results that were easier to understand graphically.
LSTM on Participant Data:
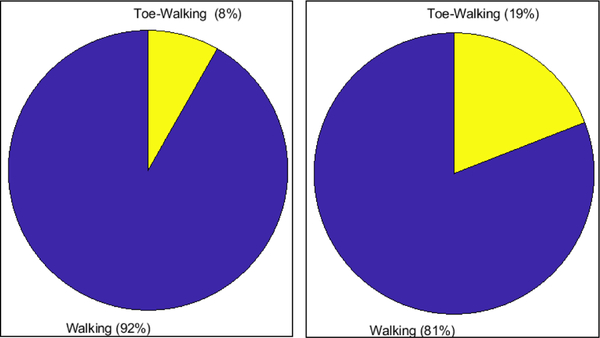
After developing an accurate LSTM model, it was applied on the 3-days’ worth of walking data that was extracted through the thresholding the magnitude of the gyroscope data. The pie graph on the right shows the results for Patient 1. In the 3 days of walking, the patient toe-toe walked 8% of the time, and heel-toe walked 92% of the time. The pie graph on the left shows the results for Patient 2. This patient toe-toe walked 19% of the time, and heel-toe walked 81% of the time.
DISCUSSION
The study investigated the use of machine learning algorithms to detect toe walking utilizing signals from wearable sensor mounted at the low back. We found that machine learning algorithms discriminated well between toe-toe gait versus heel-toe gait. We found simple algorithms like k-means can discriminate heeltoe versus toe-toe gait with 82% accuracy. We also found that the deep learning network like LSTM could achieve even better discrimination performance without complex feature engineering procedures. LSTM model was found to have an accuracy of 94.3%. In the LSTM model, we feed IMU outputs to the network without feature selection and extraction procedures. LSTM being an artificial intelligence deep learning model could still learn important discriminatory features to make correct classification autonomously. One of the disadvantages of using deep neural networks is lack of knowledge about features involved for learning by the network. This is a drawback in using neural networks, since knowledge about discriminatory features could be very important for clinical interventions of idiopathic toe walkers. We have previously reported that machine learning methods can detect subtle differences in human gait due to lower extremity fatigue[8]. The accuracy level of our model is greater than previous reported studies with single wearable sensor. Some researcher have reported that deep learning based algorithms can be helpful for detection of freezing of gait[16].
Limitations:
The study has not explored the effects of sensor location on accuracy of toe-toe gait detection. We are also limited to one sensor. The idiopathic toewalking adolescents wore sensor at their low-back for 3 days. The threshold-based walking detection algorithms may be limited to detect gait in toe walking adolescents. Thus, some of the walking data may have been lost for machine learning classification.
To our knowledge this is the first study to use machine learning with LSTM units to classify toe walking gait. The discriminant ability of our classifiers reveals strong potential of learning-based algorithms in designing interventions for idiopathic toe walkers. The machine learning tools equip us with means to quantify efficacy of intervention by counting steps taken through toe-toe gait versus heel-toe gait.
CONCLUSIONS
The integration of wearable sensors with deep learning classification algorithms, has the capability to transform current on-going therapy methods not only in the field of physical therapy, but also in any field where intervention is difficult to measure. The novel integration of wearable sensors that can be programmed to classify movement can aid in longitudinal studies and the advancement of further physical therapy rehabilitation research.
Fig. 1.
A schematic diagram of the steps that were taken for data collection.
Fig. 6.
The graph on the left shows the results of the k means cluster, and the graph on the right shows the true classification.
Fig. 7.
This diagram shows the performance of the LSTM model when testing it on a different dataset.
Fig. 8.
Pie chart of Participant 1 (Left) and pie chart of Participant 2 (Right). These pie charts summarize 3 days worth of walking data between heel-toe walking and toe-toe walking.
ACKNOWLEDGMENTS
We are grateful to CHOC Foundation and Kay Family Foundation who funded this research. We are also thankful to Dr. Richard Beuttler, Dr. Caprice Hollandsworth and Dr. Shweta Chedda, Ms. Molly Oh and student assistants for data collection.
Footnotes
DISCLOSURES
Sharon Kim has nothing to disclose. Rahul Soangra has nothing to disclose. Marybeth Grant-Beuttler has nothing to disclose. Afshin Aminian has nothing to disclose. Financial Disclosures: All authors have no financial disclosures. Conflicts of Interest: All authors have no conflict of interest to disclose. CHOC IRB Contact Information: IRB # 170870 CHOC Institutional Review Board – Research Institute, 1201 West La Veta, Research Building, 4th Floor, Room 410, Orange, CA 92868, Phone: (714) 509–8869
REFERENCES
- [1]. Williams CM, Tinley P, and Curtin M, “The Toe Walking Tool: A novel method for assessing idiopathic toe walking children,” Gait & Posture, vol. 32, pp. 508–511, 2010. [DOI] [PubMed] [Google Scholar]
- [2]. Sutherland DH, Olshen R, Cooper L, and Woo SL, “The development of mature gait,” J Bone Joint Surg Am, vol. 62, pp. 336–53, Apr 1980. [PubMed] [Google Scholar]
- [3]. Papariello SG and Skinner SR, “Dynamic electromyography analysis of habitual toe-walkers,” J Pediatr Orthop, vol. 5, pp. 171–5, Mar-Apr 1985. [PubMed] [Google Scholar]
- [4]. Hemo Y, Macdessi SJ, Pierce RA, Aiona MD, and Sussman MD, “Outcome of patients after Achilles tendon lengthening for treatment of idiopathic toe walking,” J Pediatr Orthop, vol. 26, pp. 336–40, May-Jun 2006. [DOI] [PubMed] [Google Scholar]
- [5]. Lovell WW, Winter RB, Morrissy RT, and Weinstein SL, Lovell and Winter’s Pediatric Orthopaedics: Lippincott Williams & Wilkins, 2006. [Google Scholar]
- [6]. Dietz F and Khunsree S, “Idiopathic toe walking: to treat or not to treat, that is the question,” Iowa Orthop J, vol. 32, pp. 184–8, 2012. [PMC free article] [PubMed] [Google Scholar]
- [7]. Eiff MP, Steiner E, Judkins DZ, and Winkler-Prins V, “Clinical inquiries. What is the appropriate evaluation and treatment of children who are “toe walkers”?,” J Fam Pract, vol. 55, pp. 447, 450, May 2006. [PubMed] [Google Scholar]
- [8]. Zhang J, Lockhart TE, and Soangra R, “Classifying lower extremity muscle fatigue during walking using machine learning and inertial sensors,” Ann Biomed Eng, vol. 42, pp. 600–12, Mar 2014. [DOI] [PMC free article] [PubMed] [Google Scholar]
- [9]. Santhiranayagam BK, Lai DT, Sparrow WA, and Begg RK, “A machine learning approach to estimate Minimum Toe Clearance using Inertial Measurement Units,” J Biomech, vol. 48, pp. 4309–16, Dec 16 2015. [DOI] [PubMed] [Google Scholar]
- [10]. Krizhevsky A, Sutskever I, and Hinton GE, “ImageNet classification with deep convolutional neural networks,” Communications of the ACM, vol. 60, pp. 84–90, 2017. [Google Scholar]
- [11]. Lee H, Pham PT, Largman Y, and Ng AY, “Unsupervised feature learning for audio classification using convolutional deep belief networks,” in NIPS, 2009. [Google Scholar]
- [12]. Silver D, Huang A, Maddison CJ, Guez A, Sifre L, van den Driessche G, et al. , “Mastering the game of Go with deep neural networks and tree search,” Nature, vol. 529, p. 484, 01/27/online 2016. [DOI] [PubMed] [Google Scholar]
- [13]. Xun G, Jia X, and Zhang A, “Detecting epileptic seizures with electroencephalogram via a context-learning model,” BMC Medical Informatics and Decision Making, vol. 16, p. 70, July 21 2016. [DOI] [PMC free article] [PubMed] [Google Scholar]
- [14]. Ordóñez F and Roggen D, “Deep Convolutional and LSTM Recurrent Neural Networks for Multimodal Wearable Activity Recognition,” Sensors, vol. 16, p. 115, 2016. [DOI] [PMC free article] [PubMed] [Google Scholar]
- [15]. Hochreiter S, #252, and Schmidhuber r., “Long Short-Term Memory,” Neural Comput, vol. 9, pp. 1735–1780, 1997. [DOI] [PubMed] [Google Scholar]
- [16]. Camps J, Samà A, Martín M, Rodríguez-Martín D, Pérez-López C, Alcaine S, et al. , “Deep Learning for Detecting Freezing of Gait Episodes in Parkinson’s Disease Based on Accelerometers,” Cham, 2017, pp. 344–355. [Google Scholar]


