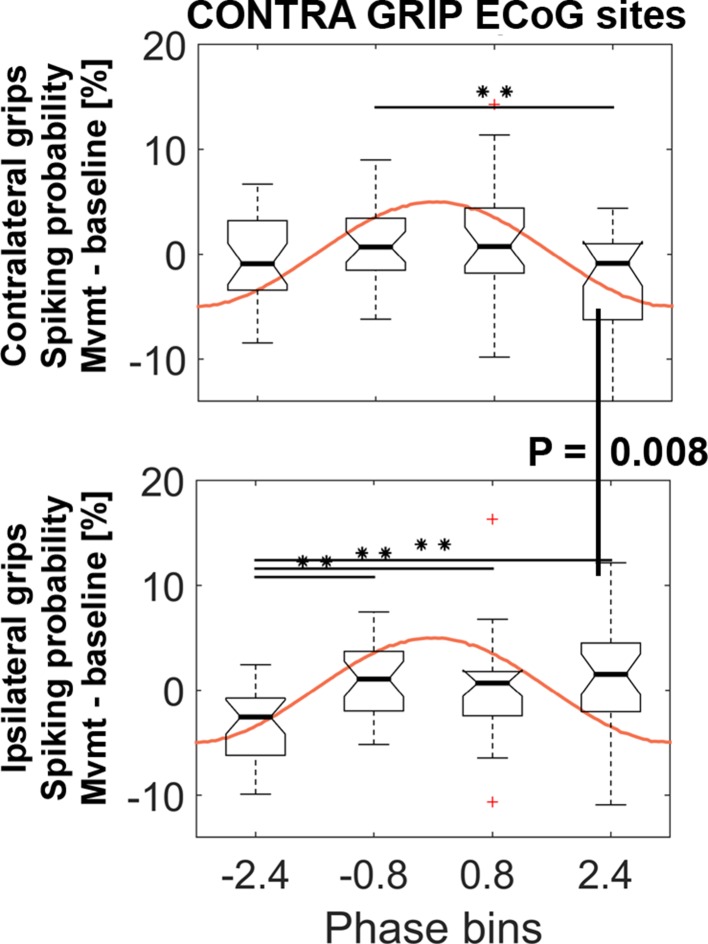
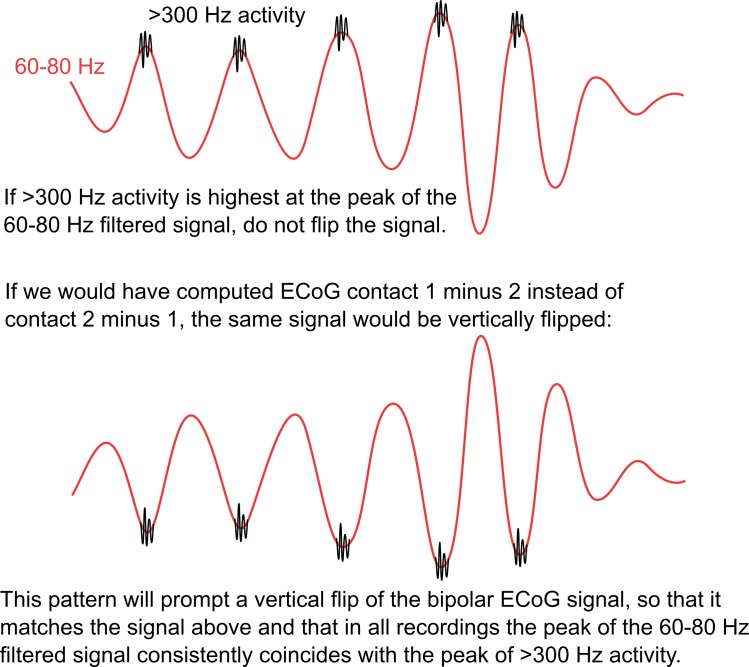
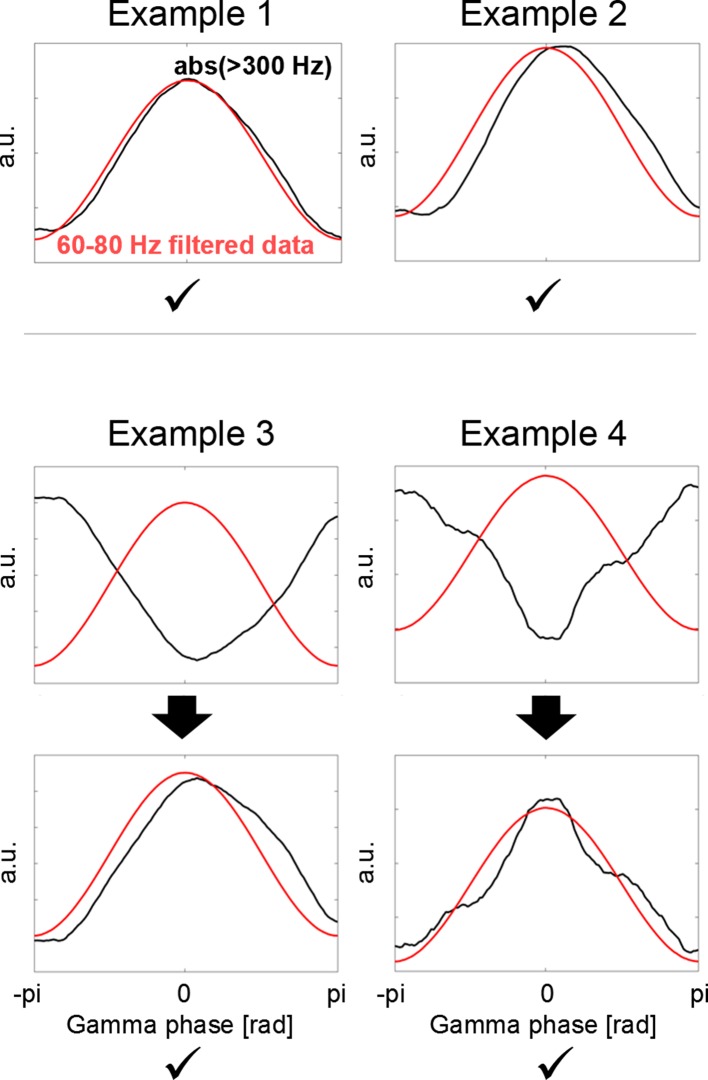
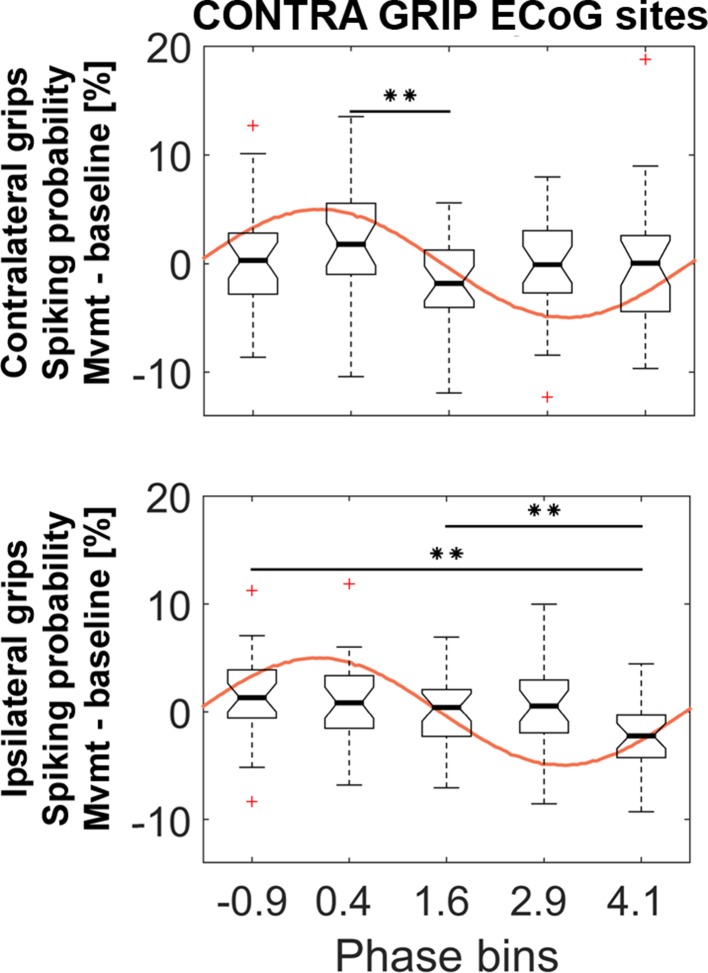
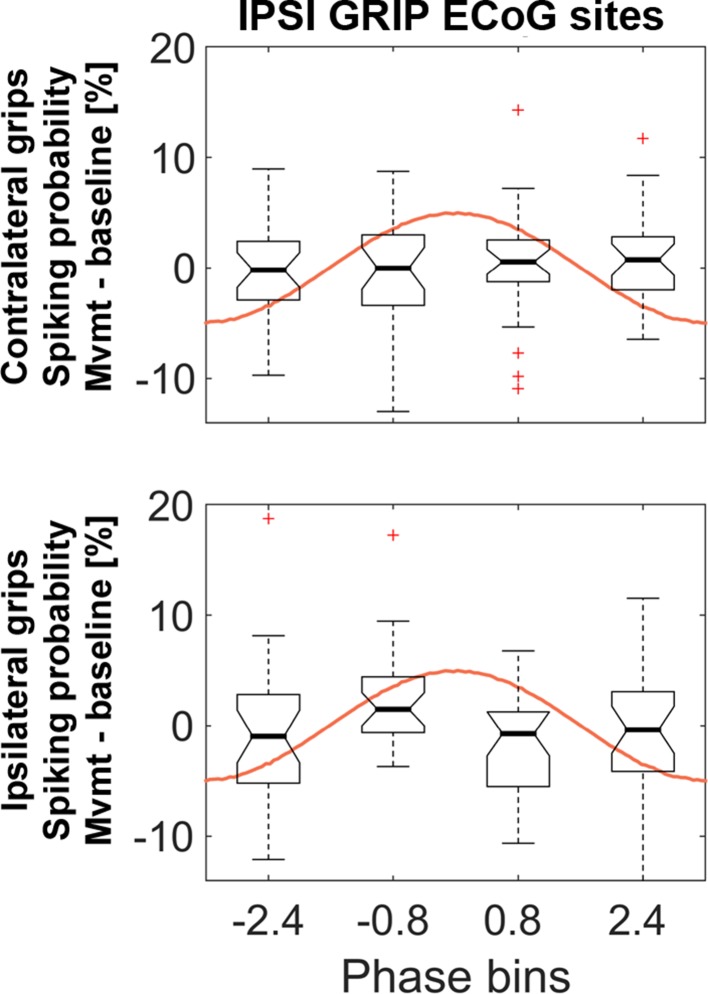
Figure 5. STN spiking probability is modulated relative to the phase of cortical gamma.
The top plot shows how spiking probabilities during contralateral grip onset co-modulate with the gamma phase. * show FDR-corrected significant differences between phase bins. Spiking was relatively reduced in BIN4 during contralateral gripping. It was significantly lower than during ipsilateral gripping (bottom plot, Wilcoxon signed-rank test, p=0.008). The central mark of the box plots displays the median and edges show the 25th and 75th percentile. Whiskers show the 1.5*interquartile range and outliers (red crosses) are data points beyond this range. See also Figure 5—figure supplements 1–4.

