

Summary
Fine-mapping of interesting loci discovered by genome-wide association study (GWAS) is mandatory to pinpoint causal variants. Traditionally, this fine-mapping is completed through increasing the genotyping density at candidate loci, for which imputation is the current standard approach. Although imputation is a useful technique, it has a number of limitations that impede accuracy. In this work, we describe the development of a precise and cost-effective Nanopore sequencing-based pipeline that provides comprehensive and accurate information at candidate loci to identify potential causal single-nucleotide polymorphisms (SNPs). We demonstrate the utility of this technique via the fine-mapping of a GWAS positive hit comprising a synonymous SNP that is associated with doxorubicin-induced cardiotoxicity. In this work, we provide a proof of principle for the application of Nanopore sequencing in post-GWAS fine-mapping and pinpointing of potential causal SNPs with a minimal cost of just ~$10/100 kb/sample.
Subject Areas: Genomic Analysis, Pharmacoinformatics, Omics, Genomics
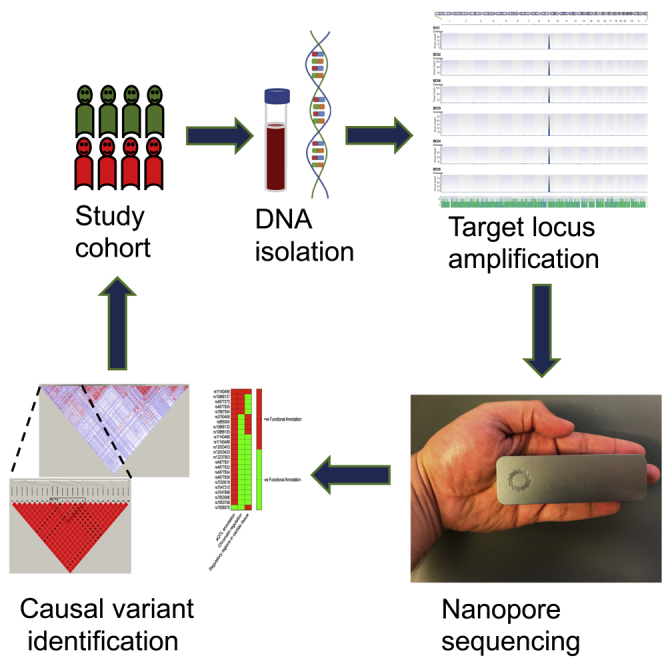
Graphical Abstract
Highlights
-
•
Nanopore-based pipeline helps to bridge the gaps between association and causation
-
•
This pipeline outperforms imputation in post-GWAS fine-mapping
-
•
Helps identify potential causal SNP(s) with a minimal cost of ~$10/100 kb/sample
Genomic Analysis; Pharmacoinformatics; Omics; Genomics
Introduction
The genome-wide association study (GWAS) is one of the most commonly used pharmacogenomic approaches and provides positive statistical associations between variants and an investigated phenotype (Magdy and Burridge, 2018). The vast majority of GWASs depend solely on genotyping chips that capture only hundreds of thousands of SNPs known as “tag SNPs” that are distributed across the entire genome (MacArthur et al., 2017). Tag SNPs are SNPs in perfect linkage disequilibrium (LD) with many other neighboring SNPs and act as surrogates for their detection. Thus, a statistically significant GWAS hit is always co-inherited (linked) with several other SNPs that have indistinguishable statistical associations with the studied phenotype, leaving us with numerous possibilities to investigate in relation to causality. Owing to this LD issue, GWASs require downstream fine-mapping and further genetic examination at candidate loci to provide more comprehensive information about positive hits and eventually narrow down the list of potential causal SNPs for downstream mechanistic validation (Magdy et al., 2016).
Importantly, traditional fine-mapping essentially starts with identifying all variants that are co-inherited with a GWAS statistically significant association through increasing the genotyping density at candidate loci, for which imputation is the current standard approach. Imputation infers information about un-typed markers by comparing a genotyped cohort with a population-specific reference panel of haplotypes. HapMap3 (Altshuler et al., 2010) and 1,000 genomes phase 3 (Genomes Project et al., 2010, Abecasis et al., 2012) reference panels are frequently used in imputation comprising 1.6 M and ~80 M genotyped SNPs in 1,184 and 2,504 individuals across different ancestor populations, respectively. Although imputation algorithms have added more power to GWASs, imputed genotypes accuracy is influenced by several factors. Although pre-phasing of the target dataset increases imputation speed, it decreases imputation accuracy as compared with no pre-phasing (Roshyara et al., 2016). Imputation at chromosome X (apart from pseudo autosomal regions) for which males are haploid requires special care, as this hemizygosity reduces effective population size (Ne), resulting in misleading longer shared haplotype stretches between individuals, and thus affects imputation accuracy (Konig et al., 2014). Imputation accuracy is also inversely correlated with lower minor allele frequency making it more challenging to predict rare alleles (Marchini and Howie, 2010). Selecting the correct reference panel is very critical for imputation accuracy; thus, mixed ethnicities heterogeneous cohorts could affect predicted genotypes (Browning, 2008). Different genotyping chips, study sample size, number of missed genotypes, and different imputation software could affect the accuracy of imputed genotypes (Marchini and Howie, 2010). Finally, imputation could provide information for previously identified SNPs in a particular population; however, it is unable to identify novel variant that might be harbored by a study cohort.
Recently, Oxford Nanopore Technologies has introduced a single molecule-based portable sequencer, MinION. MinION is capable of generating ultra-long sequence reads (up to 200 kb) that improves alignment and assembly. Nanopore sequencing utilizes synthetic nanopore proteins that are embedded into an electrically resistant polymer membrane. Ionic current is generated by applying voltage across the membrane at the beginning of the experiment, and base calling is generated by recording the disruption in ionic current caused by each nucleotide passing through nanopore protein (Jain et al., 2016). MinION-derived long sequence reads have been successfully utilized to genotype single nucleotide variants (SNVs) and identify insertions, deletions, and translocations in different types of diseases (Lang et al., 2018, Patel et al., 2018, Fuselli et al., 2018). The long sequencing reads generated by nanopore technology provide cost-effective, high depth of coverage and phasing of identified variants. Moreover, real-time data analysis provides the privilege of controlling the utilization of the MinION flow cell, as the sequencing could be stopped once sufficient coverage is reached.
Another unique advantage of Nanopore long reads is the feasibility of variants phasing. Phasing by definition is the assignment of variant alleles to paternal or maternal chromosomes and thus adds more useful information from each Nanopore sequencing experiment. Phasing could help identify inheritance patterns, allele-specific expression, haplotype resolution, and disease risk haplotypes, and accordingly, it may compensate for the analysis of relatives in rare clinical research samples (Mantere et al., 2019). The success rate of short sequence reads-based phasing is ~20% because reliable phasing requires that heterozygous variants are covered by the same sequence read, which is a big limitation for short sequence reads (Goldmann et al., 2016). On contrary, Nanopore long reads facilitate phasing of genetic variants that are multiple kilobases apart directly from sequencing reads (Laver et al., 2016), as well as complex genomic regions such as the major histocompatibility complex (MHC) locus that encompasses 4 Mb (Jain et al., 2018).
Here, we use data from a recent large multi-center pediatric GWAS that revealed a candidate cardioprotective SNP (rs7853758, G>A, L461L) in SLC28A3, previously called human concentrative nucleoside transporter-3 (hCNT3), as significantly associated with lower risk to develop doxorubicin-induced cardiotoxicity (DIC) (Visscher et al., 2012). This GWAS hit, rs7853758, is a synonymous SNP and thus most likely is not the causal SNP. In this work we sought to introduce a Nanopore-based precise and cost-effective pipeline for multiplexed targeted resequencing that provides high-level (~500x) depth of coverage and helps identify potential causal SNP/haplotype.
Results and Discussion
Nanopore Sequencing of SLC28A3 and Long Sequence Reads Alignment
First, we PCR amplified and validated nine amplicons compassing SLC28A3 gene (Figures S1A and S1B); we then sequenced the multiplexed amplicons from six patients using MinION Nanopore sequencer. Cumulative number of generated bases was 0.51, 1.1, 0.61, 0.87, 0.9, and 1.3 GB, and cumulative number of generated sequencing reads after demultiplexing was 103328, 182305, 117217, 195579, 226355, and 244678 reads, for DNA from patients BC01, BC02, BC03, BC04, BC05, and BC06, respectively (Figures S2A and S2B). Median read quality was 10, 10.2, 10.1, 10, 9.7, and 10.1 for BC01, BC02, BC03, BC04, BC05, and BC06, respectively (Figure 1A).
Figure 1.

Nanopore Long Sequence Reads Encompassing SLC28A3 Gene Locus
(A) Pauvre plot showing reads mean Phred quality score, reads length, and number of reads.
(B) Long-range PCR-based target enrichment for SLC28A3 amplicons aligned to reference human genome (GRCh38) showing depth of coverage peaks at chr9: 84,274,029–84,349,802.
(C) Zoom-in view at locus chr9: 84,274,029–84,349,802 encompassing SLC28A3.
(D) Heatmap showing the correlation of the depth of coverage at SLC28A3 locus between demultiplexed samples, BC01–BC06. The color code denotes value of Pearson correlation coefficient.
We next aligned sequence reads to reference human genome (GRCh38.p92) to check for non-specific PCR products. Aligning reads to reference genome resulted in a single peak encompassing SLC28A3 gene locus in our six samples (Figures 1B and 1C). The median percent identity of aligned reads was 89%, 88.7%, 88.9%, 88.6%, 88.7%, and 88.8% for BC01, BC02, BC03, BC04, BC05, and BC06, respectively (Figure S3). The depth of coverage at SLC28A3 locus for all samples was well correlated, in that average Pearson correlation co-efficient of one sample in relation to the other five samples was 0.7, 0.9, 0.86, 0.86, 0.7, and 0.87 for BC01, BC02, BC03, BC04, BC05, and BC06, respectively (Figure 1D). Taken together, homogeneous depth of coverage and read quality of all multiplexed samples along with the availability of a 96-barcoding kit maximizes the utility of this pipeline.
Variant Identification from Aligned Nanopore Long Sequence Reads
We next sought to identify SNPs in the study patients using Nanopolish (Loman et al., 2015) variant caller. In total 133 SNPs were identified, all of which have at least one variant allele in at least one patient (Figure 2A). The vast majority of identified SNPs are intronic (n = 93), 25 SNPs are located in 5′-UTR, 12 SNPs are located in 3′-UTR, in addition to three coding SNPs including two synonymous and one non-synonymous SNP (Figure 2A and Table S6). Of 133 identified SNPs, 28 are novel SNPs that have not been previously reported (Table S6). For all patients, Nanopore genotypes of the original GWAS hit, rs7853758, were in concordance with the GWAS-chip genotypes (Figure 2B). Novel SNPs included 14 intronic SNPs, 12 SNPs located in 5′-UTR, one SNP located in 3′-UTR, in addition to one non-synonymous SNP located at chr9:84285427 results in amino acid alteration Ala522Val (Table S6). The identified novel SNPs are co-inherited in both cardiotoxicity and cardioprotective patients and thus unlikely to be involved in doxorubicin-induced cardiotoxicity. However, identification of SNPs that are not captured by the GWAS SNP-chip is a major strength of the proposed pipeline, as these SNPs might have been missed if imputation only was implemented for fine-mapping.
Figure 2.

Variants Calling after SLC28A3 Nanopore Sequencing
(A) Consequence and location of identified SNPs (n = 133).
(B) Aligned sequence reads at the location of the original GWAS hit (rs7853758, G>A, L461L) confirm that BC01, BC02, and BC06 harbor homozygous reference genotype (GG), whereas BC03, BC04, and BC05 harbor heterozygotes variant genotype (GA).
(C) Effect of depth of coverage on variant calling after Nanopore sequencing of study samples (n = 6). Sequence reads were down-sampled down to 10% of the cumulative read counts.
(D) Genotypes (n = 563) concordance between nanopore sequencing and SNP-chip technologies. The genotypes are homozygous reference (REF), heterozygous (ALT1), and homozygous non-reference (ALT2). Genotype pairs such as REF/REF represent genotype calls by nanopore and by the Omni chip, respectively. REF/REF, ALT1/ALT1, and ALT2/ALT2 indicate concordant genotypes. Line graph represents genotype percentage of total.
Effect of Depth of Coverage on Genotype Concordance Rate
To investigate how low coverage depth might affect variant calling from Nanopore reads, each bam file containing all sequence reads from a particular patient was down-sampled to include only 90%, 80%, 70%, 60%, 50%, 40%, 30%, 20%, and 10% of the accumulative reads. Then variants called from down-sampled bam files were compared with variants called from the main bam file that contains all accumulative reads. Lower depth of coverage did not show dramatic effect on Nanopore-based variant calling. The mean genotypes concordance rate across all six samples was 98.73%, 97.98%, 97.44%, 97.77%, 96.86%, 96.70%, 96.18%, 96.35%, and 93.19% with decreasing coverage depth from 100% down to 10% (Figure 2C). This finding shows that ~500x depth of coverage is sufficient for reliable variant calling from Nanopore sequence reads. Moreover, the cumulative yield of a single Nanopore flow cell ranges between 7 and 10 Gb, and thus, when coupled with the available barcoding kits, this pipeline could be used to examine several candidate loci in at least 96 multiplexed samples.
Genotype Concordance between Nanopore SNPs and InfiniumOmniExpress-24v1-2
We had access to chip-based 94 genotyped loci distributed across SLC28A3 gene in the six patients we sequenced (n = 563, one genotype was missed in one sample), allowing us to check for concordance rate at these overlapping sites. Using SnpSift (Cingolani et al., 2012), we examined genotype concordance between the nanopore sequencing and InfiniumOmniExpress-24v1-2 genotyping chip. We found that 514 of the 563 overlapping genotypes were concordant (91.3%), i.e., both technologies called the same genotype (homozygous reference, heterozygous, or homozygous non-reference) at the same loci for a particular patient (Figure 2D and Table S7).
Functional Annotation Analysis Identifies Potential Causal SNP/Haplotype
We next examined which SNPs are linked in cardioprotected patients. Of the 133 identified SNPs, 24 SNPs including the GWAS hit are co-inherited in cardioprotected patients (Figure 3A and Table S6). These 23 SNPs are distributed as follows: eight SNPs are located in 3′ UTR, 14 SNPs are intronic, and 1 coding synonymous SNP (Figure 3B). Interestingly, seven SNPs are located within a long non-coding RNA, AL356134.1, that overlaps with SLC28A3. Moreover, SNP rs11140490 is located at the splice site of the first exon of AL356134.1 (Figure 3C).
Figure 3.

Identification of Potential Causal SNP after Nanopore Sequencing
(A) Heatmap showing identified SNP (n = 133) genotypes in all study patients (n = 6) after SLC28A3 sequencing. A total of 133 SNPs have been identified, all of which have at least one variant allele in at least one of the study samples. SNPs (n = 24) marked on the heatmap by black rectangle are those that are coinherited in Non-TOX (no toxicity) samples but not in TOX (toxicity).
(B) The distribution of potential SLC28A3 haplotype (24 SNPs) across SLC28A3 and the overlapping long noncoding RNA, AL356134.1.
(C) Zoom-in view of SNP rs11140490 located in the splice site of the first exon of AL356134.1.
(D) Regulatory effect of candidate SNPs on chromatin feature binding sites.
(E–G) SNPs functional annotation using chromatin regulatory analysis for SNP rs11140490 (E), rs4877835 (F), and rs7853758 (G). Log2 fold change measures the fold change in the probability of observing a binding site for relevant chromatin feature between reference and alternative allele for a particular SNP (Zhou and Troyanskaya, 2015). Significant (E-value ≤0.02) predicted effect of a SNP on a particular chromatin feature binding site is denoted by blue dots.
(H) Conservation analysis of SLC28A3 candidate SNPs using PhastCons database and SnpSift (Cingolani et al., 2012).
(I) eQTL annotation for candidate SNPs using Genotype-Tissue Expression (GTEx) project database.
(J) Overall prioritization of candidate causal SNPs based on functional annotation analyses including eQTL annotation, chromatin regulatory analyses, and overlapping with regulatory regions in cardiac tissues.
In order to narrow down the list of potential variants implicated in the cardioprotective phenotype after doxorubicin treatment, we investigated the regulatory properties of all non-coding candidate SNPs. Using ENCODE and Roadmap Epigenomics (Kundaje et al., 2015) data and DeepSEA (Zhou and Troyanskaya, 2015) algorithm, we examined the functional effect of each SNP on altering chromatin features (transcription factors, DNase hypersensitive site, and histone marks) binding sites. Among all SNPs, rs11140490 and rs4877835 have the most substantial regulatory effects as both SNPs have been predicted to be involved in altering the binding site of 206 and 204 chromatin features, respectively (Figures 3D and S4, Tables S8 and S9). In that, SNP rs11140490 is predicted to alter the binding sites of 43 features with log2 fold change of ≥ 1 (Figure 3E), whereas rs4877835 is predicted to alter the binding sites of only four features with log2 fold change of ≥ 1 (Figure 3F). Importantly, the primary GWAS significant association does not show any chromatin regulatory effect (Figure 3G).
Since doxorubicin-induced cardiotoxicity affects mainly heart cells, we then performed an additional regulatory analysis exclusively focusing on human cardiac tissue, and for that we used ensemble regulatory build that includes transcription factors, histone mark, and DNase hypersensitive regions. Six SNPs, rs11140490, rs4877835, rs4877831, rs7047898, rs885004, and rs10868137, are found to be located in at least one regulatory region in human cardiac tissue (Table S10 and Figure S5).
Then using phastCons database and SnpSift (Cingolani et al., 2012), we checked which of candidate SNPs are located in a highly conserved locus. We found that SNP rs4877835 is located in a highly conserved locus as compared with rs11140490, and rs10868137 with a conservation score of 0.75, 0.04, and 0.001, respectively (Figure 3H).
Finally, to investigate further regulatory consequences of these candidate SNPs, we used the Genotype-Tissue Expression (GTEx) project database (https://www.gtexportal.org/home/) and investigated which of the identified candidate SNPs have been shown to be an expression quantitative trait loci (eQTL). Almost all of the candidate SNPs have been previously identified as eQTL in cultured fibroblasts, thyroid, and brain tissues. In that, SNP rs4877831 is the most significant eQTL in cultured fibroblasts and SNP rs7030019 is the most significant eQTL in both thyroid and brain tissues (Figure 3I and Table S11).
These findings when taken together suggest that rs11140490 is the SNP with the highest likelihood to be causal. However, other candidate SNPs with positive functional annotations might also have a protective role against DIC (Figure 3J). SNP rs11140490 alone or in interaction with other identified candidate SNPs revealed from this analysis (Figure 3J) could affect the transcription and/or expression of AL356134.1, which regulates the expression of doxorubicin-related genes including SLC28A3 and eventually regulates patients' susceptibility to doxorubicin-induced cardiotoxicity.
Fine-Mapping at SLC28A3 Locus Using Genotype Imputation
We next sought to compare Nanopore-based fine mapping and imputation-based fine mapping at the SLC28A3 locus. The original GWAS that identified SNP rs7853758 used a genotyping chip that covers ~2,000 SNPs across 220 ADME (absorption, distribution, metabolism, and excretion)-related genes, which included 23 SNPs distributed across SLC28A3 (Visscher et al., 2012). Genotype imputation of additional SNPs not present on the GWAS genotyping platform was done using SHAPEIT (Delaneau et al., 2011) for phasing followed by IMPUTE2 (Howie et al., 2009) with 1K genomes reference panel. To validate the imputation analysis, known GWAS genotypes were masked one variant at a time and imputed using the remaining study and reference data. Internal cross-validation showed that the mean concordance between imputed genotypes (including the original GWAS hit, rs7853758) and the original genotypes was 98.5% (Table S12).
In total, 817 additional SNPs were imputed with an accuracy ranging from 0%–100%. In that, 73 SNPs were imputed with at least 90% accuracy and 52 SNPs were imputed with at least 99% accuracy (Figure 4A). Schurz et al. among others showed that imputation accuracy significantly decreases with lower minor allele frequency (MAF) SNP (Schurz et al., 2019). Similarly, we have noticed that imputation accuracy is inversely correlated with SNPs MAF, emphasizing the value of the Nanopore-based pipeline in identifying rare variants that could have been otherwise missed (Figure 4B). We then focused on the Nanopore-identified cardioprotective haplotype (24 SNPs) that is co-inherited in cardioprotected patients. Only 19 SNPs within this haplotype were imputed in the study cohort (Figure 4C), whereas five SNPs that have been identified with the Nanopore pipeline were not imputed. Although the European population represented by this study cohort has substantial long LD haplotype stretches, imputation was not able to identify all SNPs identified by Nanopore sequencing at the investigated candidate locus. Thus, we believe that Nanopore sequencing pipeline provides a comprehensive fine-mapping approach specially when studying populations with higher recombination rates and shorter haplotype stretches such as the African population. Similarly, Nanopore pipeline is very useful when studying cohorts with no available reference panel. When analyzing such cohorts and in case of any limitation that prohibits sequencing all the cohort samples, a subset of samples might be sequenced at interesting loci using the Nanopore pipeline, and the generated data could serve as a reference panel for this particular cohort and is subsequently used for imputation-based fine-mapping for the rest of the cohort samples.
Figure 4.

Genetic Analysis at SLC28A3 Candidate Locus in Control Individuals
(A and B) (A) Genotype imputation of additional SNPs not present on the original GWAS genotyping platform. Genotype imputation was done using SHAPEIT for phasing followed by IMPUTE2 (Howie et al., 2009) with 1K genomes reference panel. (B) Imputation accuracy is inversely correlated with MAF.
(C) Comparison between Nanopore pipeline-identified candidate SNPs (n = 24) and imputation-based identified SNPs (n = 19) at SLC28A3 locus.
(D–F) Haplotype structure of SLC28A3 locus in control individuals (n = 99). (D) Pairwise linkage disequilibrium (D′) for all SNPs spread over ~100 kb encompassing SLC28A3 locus. The linkage disequilibrium (D′) is indicated in the small boxes colored red or blue (a color legend is provided). LOD, log of the likelihood odds ratio. (E) LD haplotype structure for Nanopore-identified haplotype that is spread over 32 kb and comprises 24 SNPs that are co-inherited only in cardioprotected patients. The reference SNP numbers (rs) are indicated on top. Haplotype Block 1 (outlined by black triangle) is spread over 8 kb and is composed of seven SNPs that are located within a long non-coding RNA (LNCRNA), AL356134.1, that overlaps with SLC28A3. (F) The cardioprotective haplotype allelic frequencies in control individuals. Each SNP is labeled as follow: rs id (SNP number on the LD block in [B], reference allele > variant allele). SNP rs7853758 (in bold) is the primary GWAS hit. For each SNP, variant alleles are in red. Haplotype II that includes the variant alleles for all the seven SNPs have an allelic frequency of 17.7% in the CEU population. VCF file containing genotype calls for 99 CEU individuals was downloaded from the 1,000 genomes database for the 9p21.3 locus (chr9:84274029–84349802). Using VCFtools, VCF was converted to PED and MAP files. Plink (Purcell et al., 2007) was used to calculate linkage disequilibrium between SNPs, and finally the haplotype LD map was generated using Haploview V4.2.
Haplotype Structure of SLC28A3 Locus in Control Individuals (n = 99)
In order to confirm the linkage disequilibrium pattern of the Nanopore-identified cardioprotective haplotype (24 SNPs), we investigated the structure of this haplotype in 99 whole-genome sequenced control individuals from the CEU (Utah Residents [CEPH] with Northern and Western European Ancestry) population. The 24 SNPs constituting this cardioprotective haplotype are in high LD with an average D′ and R2 of 0.99 and 0.84, respectively (Figures 4D and 4E, and Table S13). Seven SNPs of the main haplotype are located within a long non-coding RNA (LNCRNA), AL356134.1, that overlaps with SLC28A3, forming a sub-haplotype block (Figure 4E). The seven SNPs that constitute this sub-haplotype are rs11140490 (A>G), rs10868135 (T>C), rs4877831 (C>G), rs4877833 (T>C), rs7853066 (A>G), rs7853758 (G>A), and rs7030019 (A>G).
We next investigated the allelic frequency of the AL356134.1 overlapping sub-haplotype. Seven structural Haplotype I-VII were identified (Figure 4F), in that Haplotype I comprises the reference alleles for all seven SNPs (ATCTAGA) and is inherited in 71.7% of the examined population, whereas haplotype II is built of the variants alleles for all seven SNPs (GCGCGAG) and is inherited in 17.7% of the examined population (Figure 4F). This finding is consistent with the linkage disequilibrium pattern identified by the Nanopore pipeline.
Nanopore Pipeline Is a Cost-Effective Pipeline for Candidate Loci Sequencing
A standard single MinION flow cell run (48 h) generates 4–8 Gb of useful sequencing data, and herein we were able to generate ~6 Gb from one flow cell. Although the newer generation of MinION flow cells are able to generate up to 30 Gb of sequencing data in a single run (https://nanoporetech.com/products/comparison), the cost estimates calculated here are based on an output of 5 Gb per flow cell. The generated 5 Gb are equivalent to 10 Mb with a depth of coverage of 500x that is suitable for downstream variant calling. The availability of Nanopore barcoding kits enables the multiplexing of up to 96 samples. One MinION flow cell generates 10 Mb (500x coverage) and thus is enough to sequence ~104 kb (500x coverage) in 96 samples that costs as low as $8/sample. This cost includes the cost of the MinION sequencer, MinION flow cell, library preparation, and samples barcoding. Nanopore sequencing for candidate loci is thus significantly more cost-effective as compared to other sequencing approaches including the commonly used Illumina targeted sequencing that costs ~$50/sample. These cost estimates do not include the cost of the Miseq Illumina sequencer, which is about $125,000. On contrary, the Nanopore MinION sequencer is included in a basic starter kit that also includes two flow cells and a sequencing kit all of which costs $1,000. A detailed cost estimates for Nanopore sequencing and Illumina targeted sequencing are mentioned in Table S14.
In summary, Nanopore long-read sequences coupled with long-range PCR comprises a useful aide for comprehensive post-GWAS fine-mapping and helps identification of causal SNP/haplotype. Using the herein introduced pipeline, 100 kb candidate loci sequencing with ample depth of coverage of 500x, that is compatible with reliable downstream variant calling would cost ~$10/sample. Real-time analysis of Nanopore sequencing run makes other permutations such as examining bigger candidate loci and smaller number of samples also possible at similar cost. Nanopore-based fine-mapping is able to prioritize candidate causal SNPs and is more comprehensive as compared with imputation-based fine mapping. The Nanopore-based approach eliminates the need for costly traditional post-GWAS resequencing strategies while still providing extensive information for examined genetic loci. Fine-mapping approaches, weather it is statistics based or functional annotation based when coupled to our pipeline that provides high-density genotyping information, will substantially help prioritization and identification of causal SNPs. The constant improvement in long reads aligning and variant calling algorithms will definitely expand the utility of this pipeline in the future.
Limitation of the Study
In this work we provide a proof of principle for the application of Nanopore sequencing in post-GWAS fine-mapping and pinpointing of potential causal SNPs. However, low sample size is a limitation of our study. Herein, six well-phenotyped, doxorubicin-exposed patients from the Canadian cohort were specifically re-recruited according to the original inclusion criteria. Re-recruiting more patients with similar strict criteria is very challenging and time consuming. Our proposed pipeline is worth testing in a larger cohort.
Methods
All methods can be found in the accompanying Transparent Methods supplemental file.
Acknowledgments
This work was supported by NIH grant R01 CA220002, American Heart Association Transformational Project Award 18TPA34230105, a Dixon Foundation Translational Research Grants Innovation Award, and the Fondation Leducq (P.W.B.).
Author Contributions
P.W.B. supervised the project. P.W.B. and T.M. conceived the project and wrote the paper. T.M. completed most of the experiment along with H.-H.K. T.M. completed the bioinformatics analysis.
Declaration of Interests
The authors have no conflicts of interest to declare.
Published: April 24, 2020
Footnotes
Supplemental Information can be found online at https://doi.org/10.1016/j.isci.2020.100971.
Data and Code Availability
The data that support the findings of this study are available from the corresponding author upon reasonable request.
Supplemental Information
REF, reference allele; ALT, alternative allele; 0, homozygous reference; 1, heterozygous variant; 2, homozygous variant; AA, amino acid. SNPs in bold are SNPs coinherited in cardioprotected patients but not in cardiotoxicity patients. Variants are annotated in relevance to SLC28A3 transcript NM_001199633.1.
D′, d prime; R2, r-squared, linkage disequilibrium coefficients.
References
- Abecasis G.R., Auton A., Brooks L.D., Depristo M.A., Durbin R.M., Handsaker R.E., Kang H.M., Marth G.T., Mcvean G.A. An integrated map of genetic variation from 1,092 human genomes. Nature. 2012;491:56–65. doi: 10.1038/nature11632. [DOI] [PMC free article] [PubMed] [Google Scholar]
- Altshuler D.M., Altshuler D.M., Gibbs R.A., Peltonen L., Altshuler D.M., Gibbs R.A., Peltonen L., Dermitzakis E., Schaffner S.F., Yu F. Integrating common and rare genetic variation in diverse human populations. Nature. 2010;467:52–58. doi: 10.1038/nature09298. [DOI] [PMC free article] [PubMed] [Google Scholar]
- Browning S.R. Missing data imputation and haplotype phase inference for genome-wide association studies. Hum. Genet. 2008;124:439–450. doi: 10.1007/s00439-008-0568-7. [DOI] [PMC free article] [PubMed] [Google Scholar]
- Cingolani P., Patel V.M., Coon M., Nguyen T., Land S.J., Ruden D.M., Lu X. Using Drosophila melanogaster as a model for genotoxic chemical mutational studies with a new program, SnpSift. Front. Genet. 2012;3:35. doi: 10.3389/fgene.2012.00035. [DOI] [PMC free article] [PubMed] [Google Scholar]
- Delaneau O., Marchini J., Zagury J.F. A linear complexity phasing method for thousands of genomes. Nat. Methods. 2011;9:179–181. doi: 10.1038/nmeth.1785. [DOI] [PubMed] [Google Scholar]
- Fuselli S., Baptista R.P., Panziera A., Magi A., Guglielmi S., Tonin R., Benazzo A., Bauzer L.G., Mazzoni C.J., Bertorelle G. A new hybrid approach for MHC genotyping: high-throughput NGS and long read MinION nanopore sequencing, with application to the non-model vertebrate Alpine chamois (Rupicapra rupicapra) Heredity (Edinb) 2018;121:293–303. doi: 10.1038/s41437-018-0070-5. [DOI] [PMC free article] [PubMed] [Google Scholar]
- Genomes Project C., Abecasis G.R., Altshuler D., Auton A., Brooks L.D., Durbin R.M., Gibbs R.A., Hurles M.E., Mcvean G.A. A map of human genome variation from population-scale sequencing. Nature. 2010;467:1061–1073. doi: 10.1038/nature09534. [DOI] [PMC free article] [PubMed] [Google Scholar]
- Goldmann J.M., Wong W.S., Pinelli M., Farrah T., Bodian D., Stittrich A.B., Glusman G., Vissers L.E., Hoischen A., Roach J.C. Parent-of-origin-specific signatures of de novo mutations. Nat. Genet. 2016;48:935–939. doi: 10.1038/ng.3597. [DOI] [PubMed] [Google Scholar]
- Howie B.N., Donnelly P., Marchini J. A flexible and accurate genotype imputation method for the next generation of genome-wide association studies. PLoS Genet. 2009;5:e1000529. doi: 10.1371/journal.pgen.1000529. [DOI] [PMC free article] [PubMed] [Google Scholar]
- Jain M., Koren S., Miga K.H., Quick J., Rand A.C., Sasani T.A., Tyson J.R., Beggs A.D., Dilthey A.T., Fiddes I.T. Nanopore sequencing and assembly of a human genome with ultra-long reads. Nat. Biotechnol. 2018;36(4):338–345. doi: 10.1038/nbt.4060. [DOI] [PMC free article] [PubMed] [Google Scholar]
- Jain M., Olsen H.E., Paten B., Akeson M. The Oxford Nanopore MinION: delivery of nanopore sequencing to the genomics community. Genome Biol. 2016;17:239. doi: 10.1186/s13059-016-1103-0. [DOI] [PMC free article] [PubMed] [Google Scholar]
- Konig I.R., Loley C., Erdmann J., Ziegler A. How to include chromosome X in your genome-wide association study. Genet. Epidemiol. 2014;38:97–103. doi: 10.1002/gepi.21782. [DOI] [PubMed] [Google Scholar]
- Kundaje A., Meuleman W., Ernst J., Bilenky M., Yen A., Heravi-Moussavi A., Kheradpour P., Zhang Z., Wang J., Ziller M.J. Integrative analysis of 111 reference human epigenomes. Nature. 2015;518:317–330. doi: 10.1038/nature14248. [DOI] [PMC free article] [PubMed] [Google Scholar]
- Lang K., Surendranath V., Quenzel P., Schofl G., Schmidt A.H., Lange V. Full-length HLA class I genotyping with the MinION nanopore sequencer. Methods Mol. Biol. 2018;1802:155–162. doi: 10.1007/978-1-4939-8546-3_10. [DOI] [PubMed] [Google Scholar]
- Laver T.W., Caswell R.C., Moore K.A., Poschmann J., Johnson M.B., Owens M.M., Ellard S., Paszkiewicz K.H., Weedon M.N. Pitfalls of haplotype phasing from amplicon-based long-read sequencing. Sci. Rep. 2016;6:21746. doi: 10.1038/srep21746. [DOI] [PMC free article] [PubMed] [Google Scholar]
- Loman N.J., Quick J., Simpson J.T. A complete bacterial genome assembled de novo using only nanopore sequencing data. Nat. Methods. 2015;12:733–735. doi: 10.1038/nmeth.3444. [DOI] [PubMed] [Google Scholar]
- MacArthur J., Bowler E., Cerezo M., Gil L., Hall P., Hastings E., Junkins H., McMahon A., Milano A., Morales J. The new NHGRI-EBI Catalog of published genome-wide association studies (GWAS Catalog) Nucleic Acids Res. 2017;45:D896–D901. doi: 10.1093/nar/gkw1133. [DOI] [PMC free article] [PubMed] [Google Scholar]
- Magdy T., Burmeister B.T., Burridge P.W. Validating the pharmacogenomics of chemotherapy-induced cardiotoxicity: what is missing? Pharmacol. Ther. 2016;168:113–125. doi: 10.1016/j.pharmthera.2016.09.009. [DOI] [PMC free article] [PubMed] [Google Scholar]
- Magdy T., Burridge P.W. The future role of pharmacogenomics in anticancer agent-induced cardiovascular toxicity. Pharmacogenomics. 2018;19:79–82. doi: 10.2217/pgs-2017-0177. [DOI] [PubMed] [Google Scholar]
- Mantere T., Kersten S., Hoischen A. Long-read sequencing emerging in medical genetics. Front. Genet. 2019;10:426. doi: 10.3389/fgene.2019.00426. [DOI] [PMC free article] [PubMed] [Google Scholar]
- Marchini J., Howie B. Genotype imputation for genome-wide association studies. Nat. Rev. Genet. 2010;11:499–511. doi: 10.1038/nrg2796. [DOI] [PubMed] [Google Scholar]
- Patel A., Belykh E., Miller E.J., George L.L., Martirosyan N.L., Byvaltsev V.A., Preul M.C. MinION rapid sequencing: Review of potential applications in neurosurgery. Surg. Neurol. Int. 2018;9:157. doi: 10.4103/sni.sni_55_18. [DOI] [PMC free article] [PubMed] [Google Scholar]
- Purcell S., Neale B., Todd-Brown K., Thomas L., Ferreira M.A., Bender D., Maller J., Sklar P., de Bakker P.I., Daly M.J. PLINK: a tool set for whole-genome association and population-based linkage analyses. Am. J. Hum. Genet. 2007;81:559–575. doi: 10.1086/519795. [DOI] [PMC free article] [PubMed] [Google Scholar]
- Roshyara N.R., Horn K., Kirsten H., Ahnert P., Scholz M. Comparing performance of modern genotype imputation methods in different ethnicities. Sci. Rep. 2016;6:34386. doi: 10.1038/srep34386. [DOI] [PMC free article] [PubMed] [Google Scholar]
- Schurz H., Muller S.J., Van Helden P.D., Tromp G., Hoal E.G., Kinnear C.J., Moller M. Evaluating the accuracy of imputation methods in a five-way admixed population. Front. Genet. 2019;10:34. doi: 10.3389/fgene.2019.00034. [DOI] [PMC free article] [PubMed] [Google Scholar]
- Visscher H., Ross C.J., Rassekh S.R., Barhdadi A., Dubé M.P., Al-Saloos H., Sandor G.S., Caron H.N., van Dalen E.C., Kremer L.C. Pharmacogenomic prediction of anthracycline-induced cardiotoxicity in children. J. Clin. Oncol. 2012;30:1422–1428. doi: 10.1200/JCO.2010.34.3467. [DOI] [PubMed] [Google Scholar]
- Zhou J., Troyanskaya O.G. Predicting effects of noncoding variants with deep learning-based sequence model. Nat. Methods. 2015;12:931–934. doi: 10.1038/nmeth.3547. [DOI] [PMC free article] [PubMed] [Google Scholar]
Associated Data
This section collects any data citations, data availability statements, or supplementary materials included in this article.
Supplementary Materials
REF, reference allele; ALT, alternative allele; 0, homozygous reference; 1, heterozygous variant; 2, homozygous variant; AA, amino acid. SNPs in bold are SNPs coinherited in cardioprotected patients but not in cardiotoxicity patients. Variants are annotated in relevance to SLC28A3 transcript NM_001199633.1.
D′, d prime; R2, r-squared, linkage disequilibrium coefficients.
Data Availability Statement
The data that support the findings of this study are available from the corresponding author upon reasonable request.