

Abstract
Background
There is evidence that water‐loss dehydration is common in older people and associated with many causes of morbidity and mortality. However, it is unclear what clinical symptoms, signs and tests may be used to identify early dehydration in older people, so that support can be mobilised to improve hydration before health and well‐being are compromised.
Objectives
To determine the diagnostic accuracy of state (one time), minimally invasive clinical symptoms, signs and tests to be used as screening tests for detecting water‐loss dehydration in older people by systematically reviewing studies that have measured a reference standard and at least one index test in people aged 65 years and over. Water‐loss dehydration was defined primarily as including everyone with either impending or current water‐loss dehydration (including all those with serum osmolality ≥ 295 mOsm/kg as being dehydrated).
Search methods
Structured search strategies were developed for MEDLINE (OvidSP), EMBASE (OvidSP), CINAHL, LILACS, DARE and HTA databases (The Cochrane Library), and the International Clinical Trials Registry Platform (ICTRP). Reference lists of included studies and identified relevant reviews were checked. Authors of included studies were contacted for details of further studies.
Selection criteria
Titles and abstracts were scanned and all potentially relevant studies obtained in full text. Inclusion of full text studies was assessed independently in duplicate, and disagreements resolved by a third author. We wrote to authors of all studies that appeared to have collected data on at least one reference standard and at least one index test, and in at least 10 people aged ≥ 65 years, even where no comparative analysis has been published, requesting original dataset so we could create 2 x 2 tables.
Data collection and analysis
Diagnostic accuracy of each test was assessed against the best available reference standard for water‐loss dehydration (serum or plasma osmolality cut‐off ≥ 295 mOsm/kg, serum osmolarity or weight change) within each study. For each index test study data were presented in forest plots of sensitivity and specificity. The primary target condition was water‐loss dehydration (including either impending or current water‐loss dehydration). Secondary target conditions were intended as current (> 300 mOsm/kg) and impending (295 to 300 mOsm/kg) water‐loss dehydration, but restricted to current dehydration in the final review.
We conducted bivariate random‐effects meta‐analyses (Stata/IC, StataCorp) for index tests where there were at least four studies and study datasets could be pooled to construct sensitivity and specificity summary estimates. We assigned the same approach for index tests with continuous outcome data for each of three pre‐specified cut‐off points investigated.
Pre‐set minimum sensitivity of a useful test was 60%, minimum specificity 75%. As pre‐specifying three cut‐offs for each continuous test may have led to missing a cut‐off with useful sensitivity and specificity, we conducted post‐hoc exploratory analyses to create receiver operating characteristic (ROC) curves where there appeared some possibility of a useful cut‐off missed by the original three. These analyses enabled assessment of which tests may be worth assessing in further research. A further exploratory analysis assessed the value of combining the best two index tests where each had some individual predictive ability.
Main results
There were few published studies of the diagnostic accuracy of state (one time), minimally invasive clinical symptoms, signs or tests to be used as screening tests for detecting water‐loss dehydration in older people. Therefore, to complete this review we sought, analysed and included raw datasets that included a reference standard and an index test in people aged ≥ 65 years.
We included three studies with published diagnostic accuracy data and a further 21 studies provided datasets that we analysed. We assessed 67 tests (at three cut‐offs for each continuous outcome) for diagnostic accuracy of water‐loss dehydration (primary target condition) and of current dehydration (secondary target condition).
Only three tests showed any ability to diagnose water‐loss dehydration (including both impending and current water‐loss dehydration) as stand‐alone tests: expressing fatigue (sensitivity 0.71 (95% CI 0.29 to 0.96), specificity 0.75 (95% CI 0.63 to 0.85), in one study with 71 participants, but two additional studies had lower sensitivity); missing drinks between meals (sensitivity 1.00 (95% CI 0.59 to 1.00), specificity 0.77 (95% CI 0.64 to 0.86), in one study with 71 participants) and BIA resistance at 50 kHz (sensitivities 1.00 (95% CI 0.48 to 1.00) and 0.71 (95% CI 0.44 to 0.90) and specificities of 1.00 (95% CI 0.69 to 1.00) and 0.80 (95% CI 0.28 to 0.99) in 15 and 22 people respectively for two studies, but with sensitivities of 0.54 (95% CI 0.25 to 0.81) and 0.69 (95% CI 0.56 to 0.79) and specificities of 0.50 (95% CI 0.16 to 0.84) and 0.19 (95% CI 0.17 to 0.21) in 21 and 1947 people respectively in two other studies). In post‐hoc ROC plots drinks intake, urine osmolality and axillial moisture also showed limited diagnostic accuracy. No test was consistently useful in more than one study.
Combining two tests so that an individual both missed some drinks between meals and expressed fatigue was sensitive at 0.71 (95% CI 0.29 to 0.96) and specific at 0.92 (95% CI 0.83 to 0.97).
There was sufficient evidence to suggest that several stand‐alone tests often used to assess dehydration in older people (including fluid intake, urine specific gravity, urine colour, urine volume, heart rate, dry mouth, feeling thirsty and BIA assessment of intracellular water or extracellular water) are not useful, and should not be relied on individually as ways of assessing presence or absence of dehydration in older people.
No tests were found consistently useful in diagnosing current water‐loss dehydration.
Authors' conclusions
There is limited evidence of the diagnostic utility of any individual clinical symptom, sign or test or combination of tests to indicate water‐loss dehydration in older people. Individual tests should not be used in this population to indicate dehydration; they miss a high proportion of people with dehydration, and wrongly label those who are adequately hydrated.
Promising tests identified by this review need to be further assessed, as do new methods in development. Combining several tests may improve diagnostic accuracy.
Plain language summary
Clinical symptoms, signs and tests for identification of impending and current water‐loss dehydration in older people
Water‐loss dehydration results from drinking too little fluid. It is common in older people and associated with increased risk of many health problems. We wanted to find out whether simple tests (like skin turgor, dry mouth, urine colour and bioelectrical impedance) can usefully tell us whether an older person (aged at least 65 years) is drinking enough. Within the review we assessed 67 different tests, but no tests were consistently useful in telling us whether older people are drinking enough, or are dehydrated. Some tests did appear useful in some studies, and these promising tests should be re‐checked to see whether they are useful in specific older populations. There was sufficient evidence to suggest that some tests should not be used to indicate dehydration. Tests that should not be used include dry mouth, feeling thirsty, heart rate, urine colour, and urine volume.
Summary of findings
Summary of findings'. 'Summary of findings table.
| Tests which show some potential ability to diagnose water‐loss dehydration (as stand‐alone tests) in analyses of pre‐defined cut‐offs | Tests which show some potential ability to diagnose water‐loss dehydration (as stand‐alone tests) in post‐hoc ROC analyses | Tests which are not useful, and should not be relied on individually as ways of assessing presence or absence of dehydration in older people (were not found to be useful in any study at either pre‐specified cut‐offs or in post‐hoc ROC analyses |
| Expressing fatigue | Urine osmolality | Urine tests: urine volume, USG, urine colour |
| BIA: resistance at 50 kHz | Axillial moisture | BIA: total body water, intracellular water and extracellular water |
| Missing some drinks between meals | Drinks intake | Other tests: heart rate, dry mouth, feeling thirsty |
BIA ‐ bioelectrical impedance analysis; USG ‐ urine specific gravity
Background
Target condition being diagnosed
Dehydration is defined as "loss or removal of fluid" from the body and occurs when fluid intake fails to fully replace fluid losses in the body (Churchill Livingstone 2008). A more physiological definition of dehydration would be having a clinically relevant decline in total body water volume compared to the subject's euvolaemic volume state, which gives the person the best haemodynamic, renal and peripheral tissue‐fluid homeostasis.
Causes of dehydration in older people may include diarrhoea, exudation (from burns or other raw areas), fever and increased sweating, polyuria (frequent urination), bleeding, vomiting and/or inadequate fluid intake. The resultant hypovolaemia (decrease in blood plasma volume) is accompanied by electrolyte balance disruption (Churchill Livingstone 2008). The most extreme manifestation of dehydration is hypovolaemic shock, which requires emergency medical treatment. Signs of hypovolaemic shock can include cool and clammy skin, reduced urine output, flattening of veins in the neck, altered mental state, low pulmonary wedge pressure, low cardiac index and high systemic vascular resistance index (Goldman 2004). Milder dehydration is common in older people.
The Dehydration Council suggests that dehydration is a complex condition resulting in a reduction in total body water (TBW) (Thomas 2008). It can be classified as water‐loss dehydration (due to water deficit, which can be hypernatraemic (high blood sodium levels) or hyponatraemic (low blood sodium levels) in the presence of hyperglycaemia (high blood glucose)); or salt‐loss dehydration (due to salt and water deficit, generally hyponatraemic, rarely isotonic (the same concentration of solutes as blood)).
Serum osmolality is the osmolar concentration or osmotic pressure of serum, so reflects the number of dissolved particles (whether they are able to permeate cell membranes or not) per kilogram of serum. Serum osmolality of 275 to < 295 mOsmol/kg is considered normal; 295 to 300 mOsmol/kg suggests impending water‐loss dehydration; and > 300 mOsmol/kg suggests current water‐loss dehydration (Thomas 2008). In this review we have used the term "water‐loss dehydration" to indicate people with serum osmolality of 295 mOsm/kg or more (with either impending or current dehydration). The terms "impending dehydration" and "current dehydration" have been used, following the terminology of Thomas 2008, although these terms are not commonly used in some settings.
In water‐loss dehydration either serum sodium or glucose levels are raised and hypotonic fluids must be given, diuretic medications changed and/or other causes of increased fluid losses treated. Impending (mild or pre‐clinical) water‐loss dehydration is an intermediate stage that may indicate long term chronic fluid deficiency, which may not progress, or an early stage of dehydration before onset of current dehydration. Impending dehydration may indicate a point at which an intervention to reverse dehydration, prevent medical emergency and reduce the risk of current dehydration, can be applied. Rapid medical intervention is needed for current (severe or clinical) water‐loss dehydration because electrolyte disturbance and volume reduction is a significant health risk.
Dehydration in older people is associated with high risk of adverse health outcomes and death (Waikar 2009; Warren 1994). Dehydration contributes to many of the major causes of death and morbidity in older people. Adverse health outcomes associated with dehydration in older people include falls, fractures, heart disease, confusion, delirium, heat stress, constipation, kidney failure, pressure ulcers, poor wound healing, suboptimal rehabilitation outcomes, infections, seizures, drug toxicity, and reduced quality of life (Chan 2002; DoH and Nutrition Summit 2007; Mentes 2006a; Olde Rikkert 2009; Rolland 2006; Thomas 2008; Wakefield 2008).
There are consistent data from high quality prospective studies (appropriately adjusted for concurrent risk factors and disease) indicating that raised serum osmolality and tonicity (indicating water‐loss dehydration) are associated with increased risk of mortality in a general elderly US population, UK stroke patients and US older people with diabetes (Bhalla 2000; Stookey 2004a; Wachtel 1991), and with poorer functional status in US older people (Stookey 2004a). In 2004, John Reid, UK Secretary of State for Health, stated that high numbers of unplanned hospital admissions among the at‐risk elderly were for entirely preventable conditions such as dehydration (Reid 2004). The estimated avoidable cost to the 1999 US healthcare system of older people admitted to hospital with primary diagnoses of dehydration was US$1.1 to US$1.4 billion annually, and admission rates appeared to be rising (Xiao 2004). Early identification, prevention and treatment of dehydration in the community would benefit older people and reduce healthcare costs.
Dehydration becomes more common as people age for several reasons (Hooper 2014). As we get older our thirst response decreases (De Castro 1992), meaning that it is not appropriate for them to rely on thirst to ensure that they drink sufficient quantities of fluid. In addition, their ability to retain salt and fluid falls as kidney function decreases, kidney and urinary diseases increase in prevalence (Davies 1995; Lindeman 1985), and total body fluid reduces (Olde Rikkert 1997; Olde Rikkert 2009). Medications such as diuretics, laxatives, angiotensin‐converting enzyme inhibitors, psychotropic medications and polypharmacy (Mentes 2006a), as well as increased dependence on carers to provide drinks, also increase dehydration risk. The prevalence of dehydration in frail older people varies by setting and level of care required, as well as how hydration status is assessed. It has been asserted that hydration is well maintained in older people living independently, maintaining normal patterns of eating and drinking, but dehydration can develop following illness, depression, surgery, trauma or other physically stressful situations (Luckey 2003). However, recent evidence suggests that the prevalence of dehydration in independent community‐dwelling older people is higher than previously thought. Plasma osmolality, measured in a US population of 15,000 people aged from 20 to 90 years (from the NHANES III cohort), found that 40% of those aged 70 to 90 years had impending water‐loss dehydration, and a further 28% had current dehydration (high plasma tonicity, > 300 mmol/L, Stookey 2005c). Another large US survey found that 50% of older people had elevated plasma tonicity. Both findings may relate to a high prevalence of elevated glucose, rather than hypernatraemia (Stookey 2005b; Thomas 2008).
Older people living in residential care represent an extremely frail population. In the UK, 4% of the growing number of older people live in care homes or long‐stay hospitals; rising to 21% of those aged 85 years and over (National Care Homes 2007). Research in Norfolk (UK) care homes found that on a single assessment of 56 residents (from six institutions), 17 (30%) residents were dehydrated (with a furrowed tongue). A year later rates were lower (21%) and the risk of being dehydrated at the second visit did not relate to hydration status at first visit (Kenkmann 2010). More recently a cross‐sectional study of 186 older people living in 56 Norfolk and Suffolk care homes measured dehydration using serum osmolality and found that 46% had water‐loss dehydration (including 19% with current dehydration, and a further 27% with impending dehydration, Siervo 2014). A Californian nursing home study found that 31% of residents were dehydrated (defined as follows: 11% of elderly residents were hospitalised for dehydration, 6% were given intravenous rehydration, and 14% were found to have blood urea nitrogen/creatinine ratio greater than 25:1) at some point over six months (Mentes 2006b). However, point prevalence dehydration was reported to be 1.4% in Missouri nursing homes (Thomas 2008). The prevalence of dehydration in studies depends not only on the population assessed, but also on what definition of dehydration is employed and methods used. A small study of US nursing home residents suggested that most participants did not drink enough fluid (39/40 drank less than 1.5 L/day), and drank little between meals (Chidester 1997; Spangler 1998b), but dehydration was not assessed. Factors contributing to low fluid intake included clinical (dysphagia, functional impairment, dementia, and pain); social (lack of attention to drink preferences, inability of residents to communicate with staff, and lack of social support); and institutional factors (untrained and unsupervised staff).
Older people in hospital are also at risk of dehydration. El‐Sharkawy 2014 found that of 103 people aged at least 65 years recruited on admission to hospital, 40% were dehydrated on admission and 44% were dehydrated 48 hours later. Dehydration was assessed using serum osmolality measurements.
Suggested interventions to help prevent dehydration in older adults living in care homes include education and involvement of staff, use of social times, drinks carts and water jugs to support drinking habits, encouraging relatives to offer residents drinks, monitoring urine colour, drinking more in hot weather, being aware of medications and health conditions that increase fluid requirements, and providing specific support for those with swallowing problems (Mentes 2006a; Water UK 2006). However, many interventions have not been tested or were tested using methodology with moderate risk of bias such as before‐after studies (Robinson 2002) or provided equivocal results (Culp 2003; Mentes 2003). A systematic review that aimed to "identify the factors that increase the risk of dehydration in older adults, how best to assess the risk and manage oral fluid intake" concluded that few data were available to answer these questions (Hodgkinson 2003). A systematic review assessing the effectiveness of factors to reduce the risk of dehydration in older people living in residential care has recently been published and a further review, assessing the effectiveness of interventions to support eating and drinking in those with dementia is in process (Bunn 2014; Bunn 2015; Abdelhamid 2014). Perhaps the first stage in prevention of dehydration in older people is recognising the condition when it occurs, so that is it clear whether it is an institutional problem and if measures to reduce dehydration have been successful. In particular, recognising early dehydration (impending dehydration) would enable early intervention of preventive measures.
This systematic review focused on simple tests that may identify water‐loss dehydration as distinct from salt‐loss dehydration or volume depletion due to blood loss because it is likely that with underlying differences in physiology and impact, there will be differences in clinical symptoms, signs and tests.
Reference standard for dehydration
In the absence of a consensus definition or gold standard test of dehydration, we used several reference standards for water‐loss dehydration. There are several approaches in situations where a reference standard is imperfect, but generally involve creation of a feasible reference standard (Reitsma 2009b). For dehydration due to reduced fluid intake, feasible reference standards for initial assessment of dehydration include raised serum or plasma osmolality, serum osmolarity or a large and rapid change in body mass (McGee 1999).
Serum and plasma osmolality are often used as interchangeable terms, but serum is missing fibrinogen which constitutes 4% of the total protein, so will have a very slightly different osmolality. Serum and plasma osmolality have the clinical advantage in that they can be assessed as a state or single measure (does not require prior knowledge or measurements), and because osmolality is highly controlled by the body, any change suggests problems in body biochemistry. Disadvantages are that if body fluids are lost along with electrolytes (through loss of blood or diarrhoea) then fluid may be lost without alteration of osmolality. However, this review is concerned with reductions in body fluid relating to conscious or unconscious reductions in fluid intake with or without increased losses due to variables such as use of diuretics, fever, diabetes insipidus, dysregulated diabetes mellitus, increased perspiration, or hot dry surroundings. In such situations where body fluids are lost overall, the response is likely to be increased osmolality (Thomas 2008). Serum and plasma osmolality appear to be useful markers of water‐loss dehydration in the absence of tracking over time (Cheuvront 2010), and so constitute the most commonly used reference standard (Panel on Dietary Reference Intakes 2004; Thomas 2008; Cheuvront 2013).
During the review process it was agreed that serum osmolarity (which approximates serum osmolality but instead of being directly measured is calculated from the components of osmolality, including serum sodium, potassium, urea and glucose) would be used where serum or plasma osmolality (directly measured) was not available.
Total body mass, or weight, is the sum of body fluid, fat, muscle, organs and bone, and the weight of body fluid is difficult to disentangle from total weight. However, fluid is the body component with the ability to alter most quickly, so that a substantial change in body weight over a short period of time will relate most directly to fluid status (Cheuvront 2010; Shirreffs 2003). For this reason, a reduction of ≥ 3% of body weight within seven days may be considered to be a clear indication of dehydration, as would an increase of ≥ 3% of body weight on rehydration within seven days. This relies on more than one assessment, and the assessments need to be accurate (for example, with weight measured nude and at the same time each day) and account for issues such as constipation or oedema (Cheuvront 2010).
TBW can be estimated by deuterium oxide dilution and therefore change in TBW can be assessed over time (Schloerb 1950). A fall in body water of 2% or more could be considered to constitute dehydration, however due to the variance in assessment of TBW (1% to 2%), this will not be used as a reference standard. A single measure of TBW has not been correlated with hydration status in older people, so cannot be used as a reference standard on its own.
In summary, we accepted the use of the following reference standards for dehydration:
serum or plasma osmolality
serum or plasma osmolarity
change in body weight over seven days
Where more than one of these was available in any one study we always used osmolality for preference, followed by osmolarity.
The target condition of primary interest was water‐loss dehydration, including impending or current water‐loss dehydration (serum osmolality ≥ 295 mOsm/kg).
Index test(s)
Protecting the health of older people, and preventing emergency hospital admissions due to dehydration, requires early detection and treatment in the community. Carers, residential home staff and primary health care workers are in the position to facilitate this early detection and treatment. While a biochemical assessment may be the best state (one time) indicator of dehydration in a clinical setting (Thomas 2008) these tests are not generally available in community, primary or residential care settings (Leibovitz 2007).
A systematic review of the diagnostic accuracy of physical signs of hypovolaemia, which included studies published to late 1997, found that in the few relevant studies there was limited evidence that in older people with vomiting, diarrhoea or reduced fluid intake that dry armpits (axilla) supported the diagnosis of hypovolaemia (positive likelihood ratio (PLR) 2.8, 95% CI 1.4 to 5.4), and moist mucous membranes or a tongue without furrows supported lack of hypovolaemia (negative likelihood ratio (NLR) for each 0.3, 95% CI 0.1 to 0.6). Capillary refill time and poor skin turgor (elasticity) were not diagnostic (McGee 1999). A recent Australian cohort study found that systolic blood pressure drop on standing, sternal skin turgor, tongue dryness, and body mass index were good indicators of early dehydration on hospital admission. However, these factors were compared with physician assessment of hydration status that may have included some or all of these clinical signs (Vivanti 2008). A recent retrospective case series of patients admitted to an emergency department in Switzerland found that the most common symptoms of patients with hypernatraemia (in over 50% of those presenting) were disorientation, somnolence and recent falls (Arampatzis 2012).
Other state (one time) methods proposed to diagnose dehydration include assessment of urine colour, urine specific gravity (USG), saliva osmolality, tear osmolarity, urine volume, sunken eyes, rapid pulse, postural pulse increment, severe postural dizziness, fluid balance charts, upper body weakness, bioelectrical impedance (BIA), and checklists of risk factors (Cheuvront 2010; Eaton 1994; Fortes 2011a; Gross 1992; Mentes 2006a; Mentes 2006b; Schut 2005; Thomas 2008; Vivanti 2008; Walsh 2004a; Walsh 2004b). A systematic review that searched literature to 1995 found that early diagnosis of dehydration in older adults can be difficult because "the classical physical signs of dehydration may be absent or misleading in an older patient" suggesting that even index tests established in younger people cannot be assumed to be useful in older people (Weinberg 1995). Although some tests are probably not useful in older people, others may indicate dehydration risk, early stages of dehydration, or current dehydration. It is likely that a portfolio of assessments would be needed to usefully assess stage and type of dehydration among people in residential care without indicating that all residents are at high risk (Wotton 2008).
Alternative test(s)
There are a variety of recommendations for tests used in clinical practice to assess dehydration, and many of those used in assessing dehydration in older people appear to be based on those used and validated in children or healthy young athletes, without further assessment. There are no existing validated simple assessments of dehydration in older people.
Despite this, on informal enquiry health and social care workers often report using simple clinical symptoms, signs and tests (often tongue furrows, dry mouth, urine colour, capillary refill or skin turgor) or non‐invasive tests requiring some technology (such as USG, change in blood pressure on standing or bioelectrical impedance) to screen older people for dehydration. Articles and websites teach or exhort health and social care professionals and the public to use and rely on these tests (Allison 2005; NHS 2013; Rushing 2009; WebMD 2014; Wedro 2014). As these tests appear to be commonly used it is important to check that they are providing accurate information.
Rationale
Currently available evidence on water‐loss dehydration in older people is inconsistent. It is vital both for the health and well‐being of older people and to reduce unplanned emergency hospital admissions, that the risk of water‐loss dehydration is reduced, methods of assessing dehydration risk are developed, impending dehydration in older people in the community and residential care are recognised, and early referral for diagnosis and treatment is carried out where appropriate. The US report on Dietary Reference Values for water intake states that development of "simple non‐ or minimally invasive indexes of body dehydration status" is a key research need (Panel on Dietary Reference Intakes 2004). A valid, simple and non‐invasive screening test for dehydration for older adults in the community would better enable:
identification of older adults with impending water‐loss dehydration so that measures can be taken to improve fluid status;
monitoring progress of such older people;
identification of older adults with likely current water‐loss dehydration so that further testing or rapid medical support or both can be provided;
identification of settings/populations where there is a high risk of dehydration so that public health measures to improve hydration may be taken; and
assessment of effects of interventions to improve hydration in individuals and populations.
Objectives
To determine the diagnostic accuracy of state (one time), minimally invasive clinical symptoms, signs and tests to be used as screening tests for detecting water‐loss dehydration in older people by systematically reviewing studies that have measured a reference standard and at least one index test in people aged 65 years and over. Water‐loss dehydration was defined primarily as including everyone with either impending or current water‐loss dehydration (including all those with serum osmolality ≥ 295 mOsm/kg as being dehydrated).
Secondary objectives
To assess the effect of different cut‐offs of index test results assessed using continuous data on sensitivity and specificity in diagnosis of water‐loss dehydration.
To identify clinical symptoms, signs and tests that may be used in screening for water‐loss dehydration in older people.
To identify clinical symptoms, signs and tests that are not useful in screening for water‐loss dehydration in older people.
To assess clinical symptoms, signs and tests of current dehydration (including all those with serum osmolality > 300 mOsm/kg).
To assess clinical symptoms, signs and tests of impending dehydration (including all those with serum osmolality 295 to 300 mOsm/kg).
To directly compare promising index tests (sensitivity ≥ 0.60 and specificity ≥ 0.75) where two or more are measured in a single study (direct comparison).
To carry out an exploratory analysis to assess the value of combining the best three index tests where the three tests each have some predictive ability of their own, and individual studies include participants who had all three tests.
Investigation of sources of heterogeneity
We planned to explore sources of heterogeneity in the diagnostic accuracy of those individual clinical symptoms, signs and tests that showed some evidence of discrimination. Heterogeneity was to be explored according to the reference standard used, cut‐off value for tests providing continuous data, type of participants (community‐dwelling older people, those in residential care, and those in hospital), sex, and baseline prevalence of dehydration (Leeflang 2013).
Methods
Criteria for considering studies for this review
Types of studies
Diagnostic studies that compared an index test with a reference standard for water‐loss dehydration in older people were included. We also considered cohort and cross‐sectional studies that had not analysed diagnostic accuracy, but where at least one reference standard and at least one index test were measured in at least 10 participants aged 65 years or over and with at least two participants with water‐loss dehydration and at least two participants without water‐loss dehydration. These studies were included where the authors were able to provide a relevant 2 x 2 table comparing a reference with an index test, or a dataset from which relevant 2 x 2 tables could be calculated. Where we had access to the full study dataset we excluded any participants who did not receive both the index test and the reference standard. We attempted to access the full datasets (such as Excel spreadsheets or SPSS files) of all included studies.
Participants
People aged 65 years and over who were hospitalised, living in the community, or in institutions, in a developed country were included. Participants could not have kidney failure, cardiac (heart) failure, had not recently been prepared for surgery or undergone surgery, but may have had other chronic or acute illnesses, such as stroke, fracture, diabetes or infection. For mixed populations of older people that included participants aged under 65 years, we excluded participants aged less than 65 years where we had access to the full dataset; but, where only summary data were available, the study was only included where the proportion of those under 65 years was less than 10%. In the same way, when using published data we excluded studies with more than 10% of participants having one or more of the following: kidney failure, cardiac failure or a recent operation; and when using full study datasets, participants diagnosed with any of these conditions (according to individual study criteria) were excluded from analysis.
Index tests
Single clinical symptoms, signs and tests or a portfolio of symptoms, signs and/or tests and/or a checklist. Prespecified potential index tests for dehydration included dry axilla and other markers of transepidermal water loss; dry mucous membranes; dry or furrowed tongue; extended capillary refill time and measures of skin blood flow; poor sternal skin turgor; systolic blood pressure drop on standing; urine colour; USG; saliva osmolality; urine volume; sunken eyes; rapid pulse; postural pulse increment; postural dizziness; fluid balance charts; thirst; bad taste in the mouth; upper body weakness; measures of thermoregulation; bioelectrical impedance analysis (BIA); and checklists of risk factors. Index tests that appeared appropriate and so were included during the review process included drink and fluid intake; number of urine voids; urine osmolality; tear osmolality; tear volume or symptoms of dry eyes; saliva volume; cognitive and consciousness levels; feelings of tiredness or dullness; enjoyment of food and appetite; need for iv or thickened fluids and presence of blue lips. These index tests were included regardless of the definition of test positivity or cut‐off chosen (and these sometimes did vary between studies).
BIA assesses electrical impedance through the body (commonly from the fingers to the toes) and is often used to estimate body fat. Equipment is portable and fairly easy to use, and some types of BIA are theoretically able to assess TBW. BIA is in use in some areas in assessing hydration status of older people (especially those living in residential care). Different measurements can be made, including resistance (the resistance of the extracellular path through the body) and multi‐frequency machines use take measurements at several different electrical frequencies. BIA machines may produce raw data on resistance and impedance, or use internal functions (incorporating information such as participant height, weight and age) to automatically calculate TBW and the extracellular water (ECW) and intracellular water (ICW) components.
Comparator tests
There is no existing comparator test.
Target conditions
Water‐loss dehydration (including people with either impending or current water‐loss dehydration, anyone with a serum osmolality of ≥ 295 mOsm/kg) was the primary target condition. Impending water‐loss dehydration (serum osmolality 295 to 300 mOsm/kg) and current water‐loss dehydration (> 300 mOsm/kg), treated as two separate conditions, were planned as secondary target conditions.
Reference standards
Studies that used one of our reference standards for water‐loss dehydration, ordered in terms of their importance to make best use of the reference standard better able to represent water‐loss dehydration in frail older people, were included. The primary standard was raised plasma or serum osmolality, followed by serum osmolarity, then body mass (weight) change.
We have referred to those with either impending (serum osmolality 295 to 300 mOsm/kg) or current (serum osmolality > 300 mOsm/kg) dehydration as having water‐loss dehydration. Having water loss dehydration (having either impending or current dehydration, serum osmolality ≥ 295 mOsm/kg) has been contrasted with being euhydrated (serum osmolality 275 to < 295 mOsm/kg) as our primary target condition.
The secondary target condition was current dehydration (serum osmolality > 300 mOsm/kg) compared with euhydration or impending dehydration (serum osmolality 275 to 300 mOsm/kg). We intended to assess another secondary target condition, impending dehydration alone (serum osmolality 295 to 300 mOsm/kg) compared to euhydration (serum osmolality 275 to < 295 mOsm/kg), but these analyses were not carried out.
Serum or plasma osmolality
The primary target condition, water‐loss dehydration, included all those with serum or plasma osmolality of 295 mOsm/kg or greater (people with either impending or current dehydration)
Serum or plasma osmolality of 295 to 300 mOsmol/kg suggested impending water‐loss dehydration
Serum or plasma osmolality > 300 mOsmol/kg suggested current dehydration.
Serum osmolarity
We planned to use serum and plasma osmolality in the protocol, but during the review process it was decided to include serum osmolarity as a reference standard as it is an estimate of serum osmolality. Serum osmolarity is calculated from serum sodium, potassium, glucose and urea, rather than being directly measured. The exact formula used to calculate serum osmolarity has been noted for each study, and the cut‐offs used are the same as the cut‐offs for serum osmolality.
Body mass (weight) change
Weight change could be naturally occurring or follow encouragement to limit fluid intake for a period, but could not result from unusual levels of exercise or saunas (because these may result in dehydration that is metabolically distinct from naturally occurring dehydration). Weight change was included where a baseline weight was measured and re‐weighing occurred within seven days (and no surgery had occurred within that period).
We defined impending dehydration as a reduction of 3% to 5% of body weight within seven days or less, or an increase of 3% to 5% of body weight within seven days as an indication that a person was dehydrated before rehydration
Current dehydration corresponded to changes of more than 5% of body weight
Weight change over a period less than seven days was not multiplied up to the seven day equivalent.
Search methods for identification of studies
Search methods used were based on guidelines for Cochrane diagnostic test accuracy reviews (de Vet 2008).
Electronic searches
Searches were run in MEDLINE (OvidSP), EMBASE (OvidSP) and CINAHL from inception until 29 April 2013. The Database of Reviews of Effectiveness (DARE) and Health Technology Assessment (HTA) databases were searched viaThe Cochrane Library for any relevant non‐Cochrane reviews using a strategy adapted from the MEDLINE strategy. The International Clinical Trials Registry Platform (ICTRP) was searched for ongoing studies using keywords derived from this search strategy. We sought assistance from the Cochrane Kidney and Transplant Trials Search Co‐ordinator to search the Cochrane Register of Diagnostic Test Accuracy Studies for further relevant studies. Searches for these databases were run in April 2013. No limits as to language or publication type were applied and no diagnostic methodology search filters were employed as these appear unhelpful in reducing sensitivity (de Vet 2008; Whiting 2011).
Searching other resources
Reference lists of included studies and identified relevant reviews were checked. Authors of included studies were contacted for details of further relevant studies.
Data collection and analysis
Selection of studies
Titles and abstracts were scanned and all potentially relevant studies obtained in full text. Full text articles in languages other than English were translated. Study inclusion eligibility was assessed independently in duplicate, and disagreements resolved by a third author. We wrote to authors of all studies that appeared to have collected data on at least one reference standard and at least one index test, and in at least 10 people aged 65 years and over, even where no comparative analysis has been published, requesting either that the original authors supply the relevant 2 x 2 table or the original dataset so that we could create 2 x 2 tables. The latter was preferable because it enabled the review authors to remove data relating to any participants aged under 65 years, or with heart failure or kidney disease, and provided the potential to explore effects of different cut points for index tests that provided continuous data. We also wrote to authors who had published data in relevant participants including either index or reference standard data, to ask whether relevant reference standard or index data had been collected.
Data extraction and management
A data extraction form, including validity criteria, was developed for the review and tested by all data extractors (LH, AA, NA, AC, DG, AH, SR, AS, SW) on two or three included studies. We collected age, gender, health, functional status, and level of independence data for participants, as well as how each test was performed and assessed, timing of each test including how far apart in time the different tests were taken, and at what time of day. The data extraction form was refined (with definitions and explanations added as required by the team) and then data extraction was carried out in duplicate for each included study. Authors who extracted data conferred to agree on a final data extraction and validity assessment for the review. Where items required for data extraction or validity assessment were designated as unclear, original study investigators were contacted to obtain further details.
Where complete datasets for included studies were sought from original investigators, we requested data on sex, age, and presence or absence of diseases such as kidney and heart failure as well as results of our index tests and reference standards. In processing the study datasets, we ensured that details of each component of the dataset was understood (the timing of tests, units, serum or urinary measures and so forth) by analysing the publication and from contact with original investigators. The dataset was then cleaned by removing data of participants aged less than 65 years; those with kidney failure, heart failure, or oedema; or who were perioperative or postoperative; and participants who had no reference standard data or with serum osmolality < 275 mOsm/kg. The process, including losses of participants, was logged. This final dataset for each included study was used to complete tables of characteristics and validity.
We constructed 2 x 2 tables (no dehydration versus water‐loss dehydration) for each index test, one table for each dichotomous index test for each study, and three tables per continuous index test (one table for each of three cut‐off points). The three pre‐specified cut‐off points for continuous index tests were consistent for all studies measuring that index test, and based on recommended cut‐offs in the literature (ideally), reference ranges (where recommended cut‐offs are not available) or were data driven (Table 2). Data driven cut points were set as the median in the dataset, plus a value higher than the median and lower than the median. The higher cut point was chosen as the point midway between the median and highest value present in the dataset, and the lower cut point as the point midway between the median and the lowest value present. Before analyses were finalised the proposed cut‐offs for each included index test were circulated around the review authors for comments (without the results of any of the analyses) and the cut‐offs for several index tests were adjusted according to suggested references and accepted levels (details for each cut‐off found in Table 2).
1. Explanations of cut‐off values.
| Test | Description and detail | Cut off reasoning |
| Drinks intake 1) Very low 2) Low 3) Moderate |
Ad lib water intake (including water in water, tea and coffee) or all drinks combined Very low versus low and moderate and high Very low: < 1.4L/d in men, < 1.0 L/d in women Low: 1.4 to < 2.2 L/d in men, 1.0 to <1.6 L/d in women Moderate: 2.2 to < 3.0 L/d in men, 1.6 to < 2.2 L/d in women High: ≥ 3.0 L/d in men, ≥ 2.2 L/d in women |
European guidance, EFSA 2010, suggests that men need 2.5 L/d of fluid (overall, from food and drinks) while women need 2.0 L/d. As they assume that 20% of fluid comes from food, this suggests a drinks intake need of 2.0 L/d in men and 1.6L/d in women. The US Panel on Dietary Reference Intakes 2004 suggests that men should drink 3.0 L/d and women 2.2 L/d. We set cut offs to reflect the range of drinks intakes above and below these levels |
| Drinks intake 4) Standard |
Drinks intake < 1.5 L/d in men and women | Taken from evidence that drinks intakes in institutionalised adults should be at least 1500 mL/d (Chidester 1997; McGee 1999) |
| Fluid intake 5) Very low 6) Low 7) Moderate |
Fluid intake (fluid from food and drinks) Very low versus ≥ low Very low: < 1.7 Lin men, < 1.3 L in women Low: 1.7 to < 2.7 L in men, 1.3 to < 2.0 L in women Moderate: 2.7 to < 3.7 L in men, 2.0 to < 2.7 L in women High: ≥ 3.7 L in men, ≥ 2.7 L in women |
European guidance, EFSA 2010, suggests that men need 2.5 L/d of fluid (overall, from food and drinks), and that women need 2.0 L/d. The US Panel on Dietary Reference Intakes 2004 suggests that men need 3.7 L/d and women 2.7 L/d of fluid from all sources. We set cut offs to reflect the range of fluid intakes above and below these levels |
| 8) Misses drinks between meals | Participant reports missing drinks between meals | Participant answered "0" to at least one question about how many drinks were taken between meals (defined by primary study, Kajii 2006) |
| 9) Misses drinks at meals | Participant reports missing some drinks at meals | Participant answered "0" to at least one question about how many drinks were taken at breakfast, lunch and evening meal (defined by primary study, Kajii 2006) |
| Urine volume 10) < 300 mL/d 11) < 500 mL/d 12) < 800 mL/d 13) Fluid recommendations |
< 300 mL/d versus ≥ 300 mL/d < 500 mL/d versus ≥ 500 mL/d < 800 mL/d versus ≥ 800 mL/d < 1700 mL/d in men or < 1300 mL/d in women versus ≥ 1700 mL/d in men or ≥ 1300 mL/d in women |
Oliguria is defined as < 300 to 500 mL/d in adults and normal urine output 800 to 2000 mL/d. Cut‐offs set at 300 mL/d, 500 mL/d, 800 mL/d and the lowest fluid intake cut‐offs (1.3 L/d in women, 1.7 L/d in men). A review co‐author later commented that the cut‐off traditionally used in the USA is 400 mL/24 h – we kept the 300 and 500 mL cut offs as these fall either side of 400 mL/24 h |
| Daytime urine volume (/day) 14) < 900 mL 15) < 1420 mL 16) < 1940 mL |
< 900 mL versus ≥ 900 mL from 7am to 11pm | Cut‐offs decided on the basis of the median (1417 mL) and outlying values (900 and 1940 mL) in Johnson 2003 |
| Night urine volume (/night) 17) > 450 mL 18) > 860 mL 19) > 1270 mL |
≥ 450 mL versus < 450 mL from 11pm to 7am | Cut‐offs decided by median (863 mL) and outliers (450 and 1270 mL) in Johnson 2003 |
| Daytime urine voids (/day) 20) ≥ 11 21) ≥ 7 22) ≥ 4 |
Number of urinary voids during the day, 7am to 11pm | Cut‐offs chosen by median (7.0) and outliers (4 and 11) in Johnson 2003 |
| Night urine voids (/night) 23) ≥1.5 24) ≥ 2.6 25) ≥ 4.1 |
Number of urinary voids during the night, 11pm to 7am | Cut‐offs chosen by median (2.6) and outliers (1.5 and 4.1) in Johnson 2003 |
| 26) Nocturnal polyuria | Self‐reported nocturnal polyuria (reported as yes or no) | |
| Fluid balance 27) ‐180 mL/d 28) < +180 mL/d 29) < +1700 mL/d |
Fluid from foods and drinks minus urine volume (both over 24 hours), < ‐180mL/d versus ≥ ‐180 mL/d | Cut‐offs defined by medians from the first 3 datasets analysed (Bossingham 2005; Lindner 2009; Monahan 2006) |
| USG 30) ≥ 1.035 31) ≥ 1.028 32) ≥ 1.020 |
≥ 1.035 ≥ 1.028 ≥ 1.020 |
Various normal ranges for USG are suggested including 1.006 to 1.020 (Bossingham 2005) and Armstrong has suggested that > 1.035 is consistent with frank dehydration (Armstrong 1998), so cut‐offs chosen at 1.020, 1.028 and 1.035 |
| Urine colour 33) > 6 34) > 4 35) > 2 |
Urine colour as assessed on the Armstrong colour chart, cut‐off over 6 | Urine colour as assessed on the Armstrong colour chart, score from 1 to 8, 1 is palest, 8 darkest (Armstrong 1998), so cut‐offs chosen at 2, 4 and 6 |
| Urine osmolality 36) > 1000 mOsm/kg 37) > 800 mOsm/kg 38) > 600 mOsm/kg |
> 1000 mOsm/kg > 800 mOsm/kg > 600 mOsm/kg |
Cut‐offs taken from EFSA 2010 'Dietary Reference Values for water'. They suggest usual urinary osmolarity ranges from 50 to 1200 mOsm/L with up to 500 mOsm/L indicating normal hydration. Cut‐offs set at 600, 800 and 1000 mOsm/L |
| Tear osmolarity 39) > 324 mOsm/L 40) > 316 mOsm/L 41) > 310 mOsm/L |
Tear osmolarity by TearLab system | Literature driven cut‐offs (for dry‐eye disease, not for dehydration), referenced by Fortes 2011 |
| Heart rate 42) ≥ 120 BPM 43) ≥100 BPM 44) ≥ 80 BPM |
Heart rates below 60 BPM are called bradycardia, and over 100 BPM tachycardia. As higher heart rate is associated with dehydration cut‐offs were chosen at 80 BPM (the upper end of normal), 100 BPM (onset of tachycardia) and 120 BPM (a step above 100) | |
| 45) Orthostatic hypotension | Blood pressure falls by at least 20 mm Hg systolic or 10 mm Hg diastolic at 30 sec, 1 min or 3 mins after moving from lying to standing or sitting | Defined by Freeman 2011 |
| Body temperature 46) ≥ 38.2oC 47) ≥ 36.8oC 48) ≥ 33.2oC |
≥ 38.2oC versus < 38.2oC ≥ 36.8oC versus < 36.8oC ≥ 33.2oC versus < 33.2oC |
The typical under‐tongue body temperature is 36.8oC, with the normal range 33.2oC to 38.2oC (Sund‐Levander 2002), so cut‐offs were chosen at 33.2oC, 36.8oC and 38.2oC |
| Skin turgor 49) Anterior forearm: ≥ 3 sec 50) Anterior thigh: ≥ 3 sec 51) Anterior thigh: abnormal 52) Subclavicular: ≥ 3 sec 53) Sternum: ≥ 3 sec 54) Anterior chest: slow |
Skin turgor is defined by the number of seconds taken for skin to return to normal after being pinched Anterior forearm: ≥ 3 sec versus 0 to 2 sec Anterior thigh: ≥ 3 sec versus 0 to 2 sec Anterior thigh: abnormal versus normal Subclavicular: ≥ 3 sec versus 0 to 2 sec Sternum: ≥ 3 sec versus 0 to 2 sec Anterior chest skin turgor assessed as slow to return to normal position by internal medicine residents |
Defined by primary study authors (Chassagne 2006; Shimizu 2012; Source Study 2000) |
| Skin turgor 55) Hand: ≥ 4 sec 56) Hand: ≥ 3 sec 57) Hand: ≥1 sec |
Skin turgor assessed on back of hand, taking ≥ 4 sec versus < 4 sec to return to normal after pinching | ≥ 3 sec is a commonly chosen cut‐off in skin turgor studies, so we used this as a cut‐off and added data driven cut‐offs: median (1 sec); minimum (0 sec); maximum (4 sec) (Kafri 2013). Pragmatically ≥ 1, ≥ 3, ≥ 4 |
| Skin turgor 58): Hand: abnormal |
Skin turgor on back of hand was considered abnormal (no definition) | Defined by primary study authors (McGarvey 2010) |
| Skin turgor 59) site unspecified: abnormal |
The only instructions on form (there was no other specific information as to site etc and considered to be a judgement): “Doesn't bounce back if pinched” | Defined by primary study authors (Rowat 2011) |
| Capillary refill 60) ≥ 4 sec 61) ≥ 3 sec 62) ≥ 2 sec |
≥ 4 sec versus 0 to 3 sec ≥ 3 sec versus 0 to 2 sec (Kafri 2013i) Capillary refill of middle finger at heart height > 2 sec (Shimizu 2012) ≥ 2 sec versus 0 to 1 sec |
Cut‐offs data driven, defined by Shimizu 2012 dataset (> 2 sec versus 0 to 2 sec) and by Kafri 2013 (median (2 sec); minimum (1 sec); maximum (4 sec)). Cut‐offs ≥ 2 sec, ≥ 3 sec and ≥ 4 sec |
| 63) Dry axilla by touch | Axilla (underarm) was dry to the feel (as opposed to moist) | Feel of axilla ‐ dry or moist. Defined by primary study authors (Eaton 1994; Shimizu 2012) |
| Dry axilla by skin moisture meter 64) < 32% 65) < 37% 66) < 42% |
< 32% < 37% < 42% |
Mean axillary moisture in the primary research was 37%, with a mean of 33% in the dehydrated group and 42% in the hydrated group, so cut‐offs were chosen at 37%, 32% and 42% (Shimizu 2012) |
| Consciousness level 67) ≥ coma 68) ≥ stupor 69) ≥ obsessed |
Coma versus other Coma or stupor versus other (Chassagne 2006) or decreased consciousness (Shimizu 2012) Coma or stupor or obsessed versus alert |
Cut‐offs provided by levels chosen by primary researcher (coma, stupor, obsessed, alert) (Chassagne 2006). We also included data presented in Shimizu 2012, as decreased consciousness versus not decreased |
| Mini‐Mental State Exam 70) < 10 71) < 20 72) < 25 |
Mini‐Mental State Exam, a measure of cognitive health, scores from 0 to 30, higher scores suggest better cognitive health | Cut‐offs chosen according to standards for the Mini‐Mental State Exam, with a score of 24 or less indicating presence of dementia, 20 to 24 indicating mild dementia, 10 to 19 moderate dementia and < 10 severe dementia (O'Bryant 2008; Simard 1998). Cut‐offs were chosen at < 25, < 20 and < 10 |
| Neecham confusion scale 73) < 27 74) ≤ 24 75) < 20 |
Neecham confusion scale, a 9‐item instrument for assessing confusion, range 0 to 30. Scores of ≤ 24 suggest delirium, other cut‐offs chosen at 20 and 27 | |
| Tiredness 76) Severe 77) Moderate or severe |
Do you have any symptoms of tiredness? 0 = no, if yes graded on 1 to 100 VAS for severity. Severe tiredness ≥ 67, Moderate tiredness ≥ 34, fatigue (tiredness of any degree) ≥ 1 | VAS scale split into thirds (Sjöstrand ED 2013; Sjöstrand Healthy 2013) |
| 78) Fatigue, any | Participant reported fatigue. Participant answered "yes" to question of whether had felt fatigue over past 3 days (Kajii 2006) or answered "yes" to feeling symptoms of tiredness (any number > 0 on 0 to 100 VAS) (Sjöstrand Healthy 2013). | |
| 79) Lassitude | Participant answered "yes" to question of whether had felt lassitude over past 3 days | Set by primary researcher (Kajii 2006) |
| 80) Feels dull | Participant answered "yes" to question of whether had felt dull over past 3 days | Set by primary researcher (Kajii 2006) |
| 81) Dry oral mucosa, cheek | Dry oral mucosa, assessed on the inside of the cheek ‐ dry versus wet | Defined by researchers (Chassagne 2006). |
| Tongue furrows 82) ≥ mild 83) ≥ moderate 84) ≥ severe |
Mild, moderate or severe versus none Moderate or severe versus none or mild Severe versus none, mild or moderate |
Severity categories as defined by study author (Kafri 2013) |
| Tongue dry 85) ≥ mild 86) ≥ moderate 87) Severe |
Mild, moderate or severe versus damp Moderate or severe versus mild or damp Severe versus mild, moderate or damp |
Severity categories as defined by study author (Kafri 2013) |
| Resistance at 50 kHz from BIA 88) ≥ 550 ohm 89) ≥ 450 ohm 90) ≥ 350 ohm |
Dichotomised at 550 ohm Dichotomised at 450 ohm Dichotomised at 350 ohm |
Cut‐off proposed at 550 ohm by Allison 2005 (with values of at least 550 ohm suggesting hypovolaemia). Other cut‐offs chosen at 350 and 450 ohm pragmatically |
| Resistance at 100 kHz from BIA 91) ≥ 550 ohm 92) ≥ 450 ohm 93) ≥ 350 ohm |
Dichotomised at 550 ohm Dichotomised at 450 ohm Dichotomised at 350 ohm |
Cut‐off proposed at 550 ohm by Allison 2005 (with values of at least 550 ohm suggesting hypovolaemia). Other cut‐offs chosen at 350 and 450 ohm pragmatically |
| Resistance at 200 kHz from BIA 94) ≥ 550 ohm 95) ≥ 450 ohm 96) ≥ 350 ohm |
Dichotomised at 550 ohm Dichotomised at 450 ohm Dichotomised at 350 ohm |
Cut‐off proposed at 550 ohm by Allison 2005 (with values of at least 550 ohm suggesting hypovolaemia). Other cut‐offs chosen at 350 and 450 ohm pragmatically |
| Total body water as a % of body weight by BIA 97) < 45% 98) < 47% 99) < 49% |
< 45% versus ≥ 45% < 47% versus ≥ 47% < 49% versus ≥ 49% |
Cut‐offs chosen based on data published in Kafri 2013, best total body water percent diagnostic accuracy at 47%, outliers 45%, 49% |
| Intracellular water as a % of total body weight by BIA 100) < 25% 101) < 27% 102) < 29% |
< 25% versus ≥ 25% < 27% versus ≥ 27% < 29% versus ≥ 29% |
Cut‐offs chosen based on data published in Kafri 2013, best intracellular water percent diagnostic accuracy at 27%, outliers 25%, 29% |
| Extracellular water as a % of total body weight by BIA 103) < 18% 104) < 20% 105) < 22% |
< 18% versus ≥ 18% < 20% versus ≥ 20% < 22% versus ≥ 22% |
Cut‐offs chosen based on data published in Kafri 2013, best extracellular water percent diagnostic accuracy at 20%, outliers 18%, 22% |
| 106) Insufficient tears | Insufficient tear sample for osmolality analysis (< 50 nL) | Assessed as in Fortes 2011 |
| 107) Insufficient tears or not tolerated | Insufficient tear sample for osmolality analysis (< 50 nL) or participant could not tolerate tear collection | Assessed as in Fortes 2011 |
| 108) Oral thickener used | Participants taking fluid orally with a thickener versus those with oral intake and no thickener or nasogastric feeds | Categories chosen by study author (Stotts 2009) |
| 109) Oral fluid without thickener | Participants taking fluid orally without thickener versus those with oral intake and thickener or nasogastric feeds | Categories chosen by study author (Stotts 2009) |
| 110) Lips dry | Participant reports lips have felt dry during past 3 days | Categorised by study authors (Kajii 2006) |
| Dry mouth 111) Severe 112) Moderate or severe |
Do you have any symptoms of dry mouth? 0 = no, if yes graded on 1 to 100 VAS for severity. Severe dry mouth ≥ 67, moderate ≥34+, fatigue (any degree) ≥ 1 | VAS scale split into thirds (Sjöstrand ED 2013; Sjöstrand Healthy 2013) |
| 113) Dry mouth, any | Participant reports dry mouth of any degree | Participant reports mouth has been dry over the past 3 days (Kajii 2006) or Reports abnormal dryness (Source Study 2000 ‐ unclear who assessed, and Rowat 2011 ‐ assessed by staff) Researchers found both tongue & oral mucosa to be dry (Shimizu 2012), Researchers found dry oral mucosa, assessed at the linguo‐maxillary sulcus (Chassagne 2006) Oral mucous membranes found to be dry by the examiner (McGarvey 2010) Participants reported they had some symptoms of dry mouth (Sjöstrand ED 2013; Sjöstrand Healthy 2013) |
| 114) Unable to spit | Participant unable to spit into a cup | |
| Thirst (VAS rating) 115) Severe 116) Moderate plus 117) Mild plus |
Severe: > 125 mm of 180 mm scale (0 equates to "not thirsty at all", 125 "extremely thirsty") or ≥ 67 on a 100 mm scale Moderate: > 80 mm of 180 mm scale Mild: > 40 mm of 180 mm scale |
Thirst VAS rating > 125mm of 180 mm scale, 0 equates to "not thirsty at all", 125 equates to "extremely thirsty" (Mack 1994). As the median of this small dataset was 51 mm (minimum (0); maximum 1(30 mm)) one cut‐off was chosen below the median, at 40 mm, and one intermediate (at 80 mm). For Sjostrand severe thirst was assumed as a score of equated to ≥ 67, moderate to ≥ 34, mild to ≥ 1 (Sjöstrand Healthy 2013) |
| 118) Thirsty, any degree | Participant feels thirsty (any degree) | Participant reports they have felt thirst over past 3 days (Kajii 2006) or thirst (no description how assessed (Source Study 2000), or participant says whether or not they feel thirsty at present (McGarvey 2010), or stated that did or did not have symptoms of thirst (0 = no, if yes graded on 1 to 100 VAS for severity) (Sjöstrand Healthy 2013) |
| 119) Tongue smarts | Participant answers "yes" to question of whether tongue has been smarting over past 3 days | |
| 120) Mouth smarts | Participant answered "yes" to question of whether anywhere other than their tongue has been smarting over past 3 days | |
| 121) Sticky saliva | Participant answered "yes" to question of whether saliva has been sticky over the past 3 days | |
| 122) Sticky mouth | Participant answered "yes" to question of whether mouth has felt sticky over past 3 days | |
| 123) Blue lips | Blue lips (assessed as blue or not, by staff) | |
| 124) Sunken eyes | Sunken eyes (assessed as sunken or not, by staff) | |
| 125) Bed sores | Presence of bed sores (assessed as present or not by staff) | |
| 126) Swallowing problems | Participant answered "yes" to question of whether had had swallowing problems over past 3 days | |
| 127) Enjoyment of food | Participant reported lack of enjoyment of food, by answering "no" to question of whether had felt enjoyment of food over past 3 days | |
| 128) Appetite | Participant reported lack of appetite, by answering "no" to question of whether had felt good appetite over past 3 days | |
| Dry eye severity by DEQ‐5 129) > 12 130) > 6 131) > 3 |
DEQ‐5 | DEQ‐5 range 0 to 20, higher scores indicate more frequent or severe dry eyes. Cut‐off of > 6 suggested by literature review of Fortes 2011, others data driven (median (6); minimum (0); maximum (18)) at 3, 6, 12 |
| Dry eye severity by VAS 132) > 5.0 cm 133) > 1.1 cm 134) > 0.6 cm |
VAS of 10 cm in reply to "How dry do your eyes feel right now" with 0 meaning "not at all dry" and 10 meaning "very dry" | Cut‐offs data driven (median (1.1 cm); minimum (0 cm): maximum (9 cm)) at 0.6 cm, 1.1 cm and 5.0 cm (Fortes 2011) |
| Non‐invasive tear film breakup time 135) < 6 sec 136) < 10 sec 137) < 27 sec |
Non‐invasive tear film breakup time (sec) | Cut‐off of < 10 sec suggested as result of literature review by Fortes 2011, others data driven (median (8.9 sec); minimum (2.5 sec); maximum (44.7 sec)) at < 6 sec, < 10 sec and < 27 sec) |
| Balance 138) Severe 139) ≥ moderate 140) Any degree |
Do you have any symptoms of balance problems? 0 = no, if yes graded on 1 to 100 VAS for severity. Severe balance problems ≥ 67, moderate ≥ 34, mild ≥ 1 | VAS scale split into thirds (Sjöstrand ED 2013; Sjöstrand Healthy 2013) |
| Headache 141) Severe 142) ≥ moderate 143) Any degree |
Do you have any symptoms of headache? 0 = no, if yes graded on 1 to 100 VAS for severity. Severe headache ≥ 67, moderate ≥ 34, mild ≥ 1 | VAS scale split into thirds (Sjöstrand ED 2013; Sjöstrand Healthy 2013) |
| Nausea 144) Severe 145) ≥ moderate 146) Any degree |
Do you have any symptoms of nausea? 0 = no, if yes graded on 1 to 100 VAS for severity. Severe nausea ≥ 67, moderate ≥ 34, mild ≥ 1 | VAS scale split into thirds (Sjöstrand ED 2013; Sjöstrand Healthy 2013) |
| Muscle weakness 147) Severe 148) ≥moderate 149) Any degree |
Do you have any symptoms of muscle weakness? 0 = no, if yes graded on 1 to 100 VAS for severity. Severe muscle weakness ≥ 67, moderate ≥ 34, mild ≥ 1 | VAS scale split into thirds (Sjöstrand ED 2013; Sjöstrand Healthy 2013) |
| Dizziness 150) Severe 151)≥ moderate 152) Any degree |
Do you have any symptoms of dizziness? 0 = no, if yes graded on 1 to 100 VAS for severity. Severe dizziness ≥ 67, moderate ≥ 34, mild ≥ 1 | VAS scale split into thirds (Sjöstrand ED 2013; Sjöstrand Healthy 2013) |
| 153) Combined drinks AND fatigue | Combined measure, scored where an individual participant BOTH missed some drinks between meals AND reported fatigue | |
| 154) Combined, drinks OR fatigue | Combined measure, scored where an individual participant EITHER missed some drinks between meals OR reported fatigue (or both) |
BIA ‐ bioimpedance analysis; BPM ‐ beats/minute; DEQ‐5 ‐ dry eye questionnaire; USG ‐ urine specific gravity; VAS ‐ visual analogue scale
Once the cut‐offs were finalised we calculated sensitivity, specificity, positive and negative predictive values (PPV and NPV), positive and NLRs (PLR and NLR) and diagnostic odds ratio (DOR) for each 2 x 2 table.
Assessment of methodological quality
Assessment of methodological quality was carried out independently in duplicate as part of data extraction. It was based on the characteristics suggested by QUADAS (the first version), and reflected in the RevMan 5.3 program (Reitsma 2009a; Whiting 2006). Additionally, we recorded whether the study was free of commercial funding. The qualities assessed are described in further detail in Appendix 2.
Statistical analysis and data synthesis
Analyses were performed according to descriptions in the Cochrane Handbook for Systematic Reviews of Diagnostic Test Accuracy (Macaskill 2010). Diagnostic accuracy of each clinical symptom, sign and test was assessed against the best available reference standard for water‐loss dehydration (ideally assessed using serum osmolality, but serum osmolarity or weight change where osmolality was not available) within each study.
The main analysis for each index test assessed ability to diagnose water‐loss dehydration (no dehydration versus impending or current dehydration, serum osmolality ≥ 295 mOsm/kg). For each index test we also assessed ability to diagnose current dehydration (no or impending dehydration versus current dehydration, serum osmolality > 300 mOsm/kg), a secondary target condition. It was planned that we would also analyse no dehydration versus impending dehydration alone (serum osmolality 295 to 300 mOsm/kg, omitting data for those with current dehydration), but as the number of analyses in the review was so high, and the data in each study already limited, this was abandoned.
Individual study data for each index test were presented in forest plots of sensitivity and specificity and in receiver operating characteristic (ROC) space, subgrouped by cut‐off for continuous index tests.
We conducted bivariate random‐effects meta‐analyses in Stata/IC (StataCorp) using metandi for index tests where there were at least four studies or datasets on a single index test and the studies all shared a cut‐off for test positivity, so that datasets could be pooled (Reitsma 2005) to construct sensitivity and specificity summary estimates, and summary ROC curves. We assigned the same approach for index tests with continuous outcome data for each of the three cut‐off points investigated. Where meta‐analyses would not run in STATA we increased the number of integration points, until the meta‐analysis would run (Table 3). We planned that covariates would be incorporated into the bivariate model to examine the effects of factors that may have been responsible for heterogeneity, however as the number of studies for each test was limited (eight studies were available for one test, dry mouth, but most tests included in the meta‐analyses had only four useful datasets) this was felt to be inappropriate, having limited power.
2. Meta‐analysis results for water‐loss dehydration: cut‐off at 295 mOsm/kg$.
| Test | Cut‐off | Number of studies | Number of participants | Sensitivity (95% CI) | Specificity (95% CI) | PLR (95% CI) | NLR (95% CI) | DOR (95% CI) |
| Fluid intake | Very low | 4 | 130 | 0.17 (0.09 to 0.28) | 0.91 (0.55 to 0.99) | 1.80 (1.83 to 13.21) | 0.92 (0.73 to 1.15) | 1.96 (0.22 to 17.92) |
| Low | 4 | 130 | 0.32 (0.06 to 0.77) | 0.71 (0.27 to 0.94) | 1.09 (0.43 to 2.79) | 0.96 (0.63 to 1.46) | 1.14 (0.29 to 4.38) | |
| Moderate | 4 | 130 | 0.62 (0.33 to 0.84) | 0.35 (0.14 to 0.63) | 0.95 (0.67 to 1.33) | 1.10 (0.61 to 1.97) | 0.86 (0.34 to 2.17) | |
| Urine volume | < 300 mL/d | 6 | 150 | 0.02 (0.00 to 0.58) | 0.99 (0.67 to 1.00) | 1.79 (0.01 to 456.93) | 0.99 (0.89 to 1.10) | 1.81 (0.01 to 513.00) |
| < 500 mL/d | 6 | 150 | 0.02 (0.00 to 0.68) | 0.92 (0.64 to 0.99) | 0.21 (0.00 to 29.68) | 1.07 (0.91 to 1.26) | 0.20 (0.00 to 31.35) | |
| < 800 mL/d* | 6 | 150 | 0.17 (0.03 to 0.60) | 0.87 (0.13 to 1.00) | 1.40 (0.14 to 14.26) | 0.94 (0.70 to 1.28) | 1.48 (0.11 to 20.14) | |
| < fluid recommendations | 6 | 150 | 0.38 (0.13 to 0.73) | 0.62 (0.29 to 0.86) | 1.01 (0.56 to 1.80) | 1.00 (0.69 to 1.43) | 1.01 (0.40 to 2.59) | |
| Fluid balance | < ‐180 mL/d (< a deficit of 180 mL/d) | 4 | 92 | 0.09 (0.03 to 0.27) | 0.97 (0.00 to 1.00) | 3.62 (0.00 to 1880531) | 0.93 (0.67 to 1.29) | 3.89 (0.00 to 2771562) |
| < +180 mL/d (< a surplus of 180 mL/d) | 4 | 92 | 0.24 (0.12 to 0.43) | 0.53 (0.11 to 0.92) | 0.51 (0.17 to 1.60) | 1.43 (0.53 to 3.88) | 0.36 (0.04 to 2.92) | |
| < +1700 mL/d (< a surplus of 1700 mL/d) | 4 | 92 | 0.62 (0.38 to 0.82) | 0.01 (0.00 to 0.90) | 0.63 (0.43 to 0.91) | 50.42 (0.05 to 47624.47) | 0.01 (0.00 to 11.41) | |
| USG | ≥ 1.035 | 4 | 358 | 0.00 (0.00 to 0.70) | 1.00 (0.06 to 1.00) | 0.90 (0.00 to 9538.29) | 1.00 (0.99 to 1.01) | 0.90 (0.00 to 9653.24) |
| ≥ 1.028 | 4 | 358 | 0.03 (0.00 to 0.22) | 0.94 (0.73 to 0.99) | 0.45 (0.12 to 1.67) | 1.04 (0.97 to 1.11) | 0.43 (0.11 to 1.66) | |
| ≥ 1.020 | 4 | 358 | 0.22 (0.11 to 0.40) | 0.78 (0.39 to 0.95) | 1.01 (0.43 to 2.40) | 1.00 (0.78 to 1.27) | 1.01 (0.34 to 3.06) | |
| Urine colour | > 6* | 4 | 78 | 0.14 (0.01 to 0.72) | 0.95 (0.29 to 1.00) | 2.64 (0.17 to 40.97) | 0.91 (0.67 to 1.23) | 2.91 (0.16 to 53.59) |
| > 4* | 4 | 78 | 0.32 (0.06 to 0.79) | 0.88 (0.09 to 1.00) | 2.70 (0.14 to 51.59) | 0.77 (0.48 to 1.24) | 3.51 (0.15 to 84.09) | |
| >2 | 4 | 78 | 0.68 (0.24 to 0.93) | 0.43 (0.14 to 0.77) | 1.18 (0.71 to 1.95) | 0.76 (0.30 to 1.91) | 1.56 (0.39 to 6.23) | |
| Urine osmolality | > 1000 mOsm/kg | 6 | 158 | Meta‐analysis would not run | ||||
| > 800 mOsm/kg* | 6 | 158 | 0.10 (0.04 to 0.23) | 0.97 (0.81 to 1.00) | 3.86 (0.48 to 31.16) | 0.92 (0.83 to 1.02) | 4.18 (0.48 to 36.28) | |
| > 600 mOsm/kg | 6 | 158 | 0.43 (0.29 to 0.58) | 0.73 (0.58 to 0.84) | 1.59 (0.96 to 2.64) | 0.78 (0.60 to 1.02) | 2.04 (0.96 to 4.33) | |
| Heart rate | ≥ 120 BPM | 4 | 373 | Meta‐analysis would not run | ||||
| ≥ 100 BPM** | 4 | 373 | 0.09 (0.03 to 0.26) | 0.87 (0.59 to 0.97) | 0.75 (0.34 to 1.65) | 1.04 (0.92 to 1.17) | 0.73 (0.30 to 1.79) | |
| ≥ 80 BPM | 4 | 373 | 0.45 (0.31 to 0.60) | 0.56 (0.15 to 0.90) | 1.03 (0.45 to 2.38) | 0.98 (0.52 to 1.84) | 1.06 (0.24 to 4.58) | |
| BIA resist 50 kHz | ≥ 550 ohm | 4 | 2005 | 0.29 (0.19 to 0.42) | 0.98 (0.22 to 1.00) | 16.29 (0.10 to 2772.02) | 0.72 (0.60 to 0.87) | 22.56 (0.12 to 4224.63) |
| ≥ 450 ohm | 4 | 2005 | 0.73 (0.57 to 0.84) | 0.70 (0.18 to 0.96) | 2.43 (0.43 to 13.65) | 0.39 (0.14 to 1.07) | 6.20 (0.42 to 90.95) | |
| ≥ 350 ohm | 4 | 2005 | 0.92 (0.71 to 0.98) | 0.16 (0.02 to 0.61) | 1.10 (0.81 to 1.48) | 0.50 (0.10 to 2.59) | 2.20 (0.32 to 15.02) | |
| TBW as % body weight | < 45% | 5 | 2325 | 0.31 (0.18 to 0.47) | 0.72 (0.42 to 0.90) | 1.08 (0.65 to 1.79) | 0.97 (0.80 to 1.17) | 1.11 (0.55 to 2.23) |
| < 47% | 5 | 2325 | 0.40 (0.23 to 0.60) | 0.60 (0.30 to 0.85) | 1.01 (0.70 to 1.47) | 0.99 (0.78 to 1.26) | 1.02 (0.55 to 1.89) | |
| < 49% | 5 | 2325 | 0.54 (0.35 to 0.72) | 0.50 (0.24 to 0.77) | 1.09 (0.80 to 1.49) | 0.91 (0.69 to 1.19) | 1.20 (0.67 to 2.15) | |
| ICW as % body weight | < 25% | 4 | 379 | 0.54 (0.31 to 0.76) | 0.59 (0.22 to 0.88) | 1.31 (0.74 to 2.32) | 0.78 (0.60 to 1.03) | 1.67 (0.73 to 3.81) |
| < 27% | 4 | 379 | 0.69 (0.52 to 0.83) | 0.45 (0.14 to 0.80) | 1.26 (0.74 to 2.13) | 0.68 (0.42 to 1.12) | 1.84 (0.67 to 5.04) | |
| < 29% | 4 | 379 | 0.80 (0.63 to 0.90) | 0.26 (0.09 to 0.55) | 1.07 (0.87 to 1.31) | 0.80 (0.47 to 1.34) | 1.34 (0.66 to 2.75) | |
| ECW as % body weight | < 18% | 4 | 379 | 0.02 (0.00 to 0.18) | 0.97 (0.77 to 1.00) | 0.68 (0.11 to 4.35) | 1.01 (0.96 to 1.06) | 0.67 (0.10 to 4.49) |
| < 20% | 4 | 379 | 0.06 (0.02 to 0.19) | 0.93 (0.62 to 0.99) | 0.81 (0.20 to 3.35) | 1.02 (0.91 to 1.14) | 0.80 (0.17 to 3.70) | |
| <2 2% | 4 | 379 | 0.15 (0.08 to 0.27) | 0.76 (0.42 to 0.93) | 0.62 (0.23 to 1.72) | 1.12 (0.81 to 1.55) | 0.55 (0.15 to 2.09) | |
| Dry mouth | 8 | 623 | 0.39 (0.26 to 0.54) | 0.68 (0.56 to 0.78) | 1.24 (0.83 to 1.85) | 0.89 (0.70 to 1.12) | 1.39 (0.74 to 2.62) | |
| Thirsty** | 6 | 300 | 0.34 (0.18 to 0.54) | 0.64 (0.42 to 0.82) | 0.94 (0.56 to 1.57) | 1.03 (0.78 to 1.36) | 0.91 (0.41 to 2.01) | |
$Water‐loss dehydration includes those with impending (serum osmolality 295 to 300 mOsm/kg) and current (serum osmolality >300 mOsm/kg) dehydration
* and **: these meta‐analyses did not run using the metandi command as usual, but those marked * ran using nip(7), those marked ** did not run with nip(7), but did run with nip(8)
BIA ‐ bioelectrical impedance analysis; BPM ‐ beats per minute; ECW ‐ extracellular water; ICW ‐ intracellular water; TBW ‐ total body water; USG ‐ urine specific gravity
The principal aim of this review was to identify the potential usefulness of index tests to identify or rule out water‐loss dehydration (impending or current dehydration). Because the index tests may be used to screen for dehydration in populations with little or no current screening, but among whom there are likely to be high levels of dehydration, initial tools needed to be quite specific. This will help to limit numbers of false positive results that may discredit future time spent in responding to positive results. Any level of sensitivity would be an improvement on the current lack of ability to detect most episodes of dehydration in the community, but clearly, the higher the sensitivity the better, while maintaining high specificity. We suggested in the protocol that minimum specificity of a useful test would be 75%, and minimum sensitivity would be 60% for either impending or current dehydration. These levels were used as standards against which the utility of minimally invasive clinical symptoms, signs and tests were assessed.
We directly compared index tests that fulfilled the minimum criteria of sensitivity ≥ 60% and specificity ≥ 75% where two or more were measured in a single study (direct comparison). We planned that the tests would be compared at their best cut‐off point, that is, the point that provided the best discrimination, its threshold nearest to the upper left quadrant of the ROC curve. We also planned bivariate meta‐regression to explore including a binary covariate for index test to understand whether the expected sensitivity and specificity or both differed between index tests (Macaskill 2010).
For the review we had to pre‐specify three cut‐offs for each test with a continuous measure (as above). As this is an area where there is little previously published research the danger was that we chose unhelpful cut‐offs and missed a cut‐off with useful sensitivity and specificity. For this reason we carried out post‐hoc analyses to create more detailed ROC curves where there appeared some possibility from the completed analyses that a cut‐point with sensitivity ≥ 60% and specificity ≥ 75% may exist (between two pre‐specified cut‐offs or below or above the cut‐offs tested). These analyses were presented so that we could assess which tests may be worth testing in further research (as the cut‐offs were not pre‐specified we cannot derive conclusions from them, but they may be useful in driving future primary research). Interpretation of ROC plots involves assessment of how close to the top left‐hand corner the curve runs (the closer to this corner, the higher the sensitivity and specificity). A straight line running from the bottom left to top right corners is the line of no effect (indicating an absence of any diagnostic accuracy). Useful diagnostic accuracy (pre‐specified as sensitivity of ≥ 60% and specificity of ≥ 75%) is indicated by the curve entering the rectangle outlined in grey in the top left hand corner of the plot.
An exploratory analysis assessed the value of combining the best three index tests where each had some individual predictive ability, as combining several slightly useful tests may result in a more useful test. As these are simple tests it would be realistic to carry out two or three of them as a screening test for dehydration in the clinical or social care context. We were only able to assess the diagnostic accuracy of combined tests where an individual study included participants who had all of the best index tests. As we had access to individual participant data for the study that included two potentially useful tests (expressing fatigue and missing drinks between meals; Kajii 2006), we were able to assess diagnostic accuracy where individuals had positive results from both tests, and where individuals had positive results from either test.
Investigations of heterogeneity
Heterogeneity was examined by considering study characteristics, visual inspection of forest plots of sensitivities and specificities, and examining ROC curves of raw data. Heterogeneity due to different cut‐off values for each index test were examined by comparing results of the bivariate random‐effects meta‐analyses at each cut‐off point. It was planned that we would assess the effects of reference standard type (serum osmolality, serum osmolarity or weight change), participant type (community‐dwelling older people, those in residential care or in hospital), sex, and baseline prevalence of dehydration were assessed (Leeflang 2009). However, given the small number of studies that assessed each test, this was not considered appropriate. Most were study‐level variables, but for mixed sex studies where we had the full study dataset, we planned to produced separate 2 x 2 tables for men and women to enable more complete analysis ‐ this was not carried out because most studies included few participants and further subdivision would lead to little gain in information.
Sensitivity analyses
We planned to assess the effect of four quality items: acceptable delay between tests; incorporation avoided; partial verification avoided; and withdrawals explained; on the results by using each quality assessment item as a covariate in bivariate regression. These four items were chosen for sensitivity analyses because they were not explored within the investigations of heterogeneity and were potentially troublesome even though we had access to full datasets for most included studies. However, given the small number of included studies for each test this bivariate regression was considered inappropriate.
Assessment of reporting bias
As there were so few studies reporting any single index test it was not possible to formally assess the extent of reporting bias in the included studies.
Results
Results of the search
The final searches were run in April 2013 (for MEDLINE, EMBASE and CINAHL) (Figure 1). After duplicates were removed from the 6888 records retrieved, 205 records were identified as possibly being relevant, and the full texts of these articles were assessed. Of these, 78 were found not to be relevant to this review. The remaining 134 articles related to 121 studies. We attempted to contact study authors to obtain further information, including whether relevant reference test or index test data were available, and if so, seeking datasets for inclusion in this review. As a result of this process we excluded 90 studies, leaving 24 studies for inclusion in the review. We also identified three ongoing studies (two through database searching, and one through contact with authors). Two potentially relevant studies were identified through contact with authors and were not analysed at the time of review submission, and two further potentially relevant studies were identified in a non‐systematic way after submission of this review for publication, and have not yet been formally assessed for inclusion, but will be assessed for inclusion at the first update of this review (Studies awaiting classification).
1.
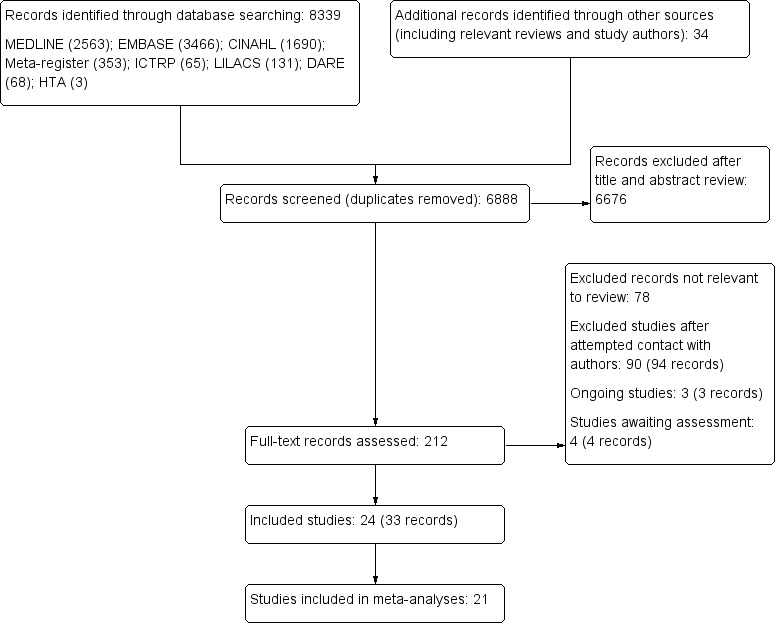
Study flow diagram
Three studies were included using only data from study publications (Allison 2005; Eaton 1994; Shimizu 2012), and although we tried to contact authors for further details and the full dataset, no additional data were received. We obtained 21 full datasets from study authors for inclusion in the review (Bossingham 2005; Chassagne 2006; Culp 2003; Fletcher 1999; Fortes 2011; Gaspar 2011a; Johnson 2003; Kafri 2013; Kajii 2006; Lindner 2009; Mack 1994; McGarvey 2010; Monahan 2006; Powers 2012; Rowat 2011; Source Study 2000; Stookey 2005; Stotts 2009; Perren 2011; Sjöstrand ED 2013; Sjöstrand Healthy 2013). None of these studies could have been included without obtaining these additional data.
We included 24 studies (3412 participants) that ranged in size from 10 to 1947 participants (see Characteristics of included studies). Participants were living in the community (7 studies, 2116 people), residential care (5 studies, 850 people), hospital (11 studies, 418 people) and mixed settings (1 study, 28 people from residential care and hospital settings). Among the included studies, 13 used serum osmolality (measured directly) as the reference standard; seven used serum osmolarity (calculated); three used weight change and one used a combination of serum osmolality and raised serum urea/creatinine ratio.
There was a wide variety of index tests among the included studies. Of these index tests, at least four studies (making meta‐analysis realistic) provided data on: fluid intake, urine volume, fluid balance, USG, urine colour, urine osmolality, heart rate, BIA resistance at 50 kHz, BIA TBW, ECW and ICW as percentages of body weight, dry mouth and feeling thirsty. The 21 studies that contributed data for these endpoints are included in the meta‐analyses (Allison 2005; Bossingham 2005; Chassagne 2006; Culp 2003; Fletcher 1999; Gaspar 2011a; Johnson 2003; Kafri 2013; Kajii 2006; Lindner 2009; Mack 1994; McGarvey 2010; Perren 2011; Powers 2012; Rowat 2011; Sjöstrand ED 2013; Sjöstrand Healthy 2013; Source Study 2000; Stookey 2005; Stotts 2009; Shimizu 2012).
Methodological quality of included studies
The methodological quality of included studies is set out in Characteristics of included studies, and summarised in Figure 2. Representative spectrum assessed whether participants were older people living in the community independently or in care, and whether there was consecutive or random recruitment. We assessed six studies at low risk of bias (included older people living in the community and recruitment was consecutive or random), 13 were at high risk of bias (so participants were not living in the community or recruitment was neither consecutive nor random), and risk of bias was unclear in five studies.
2.
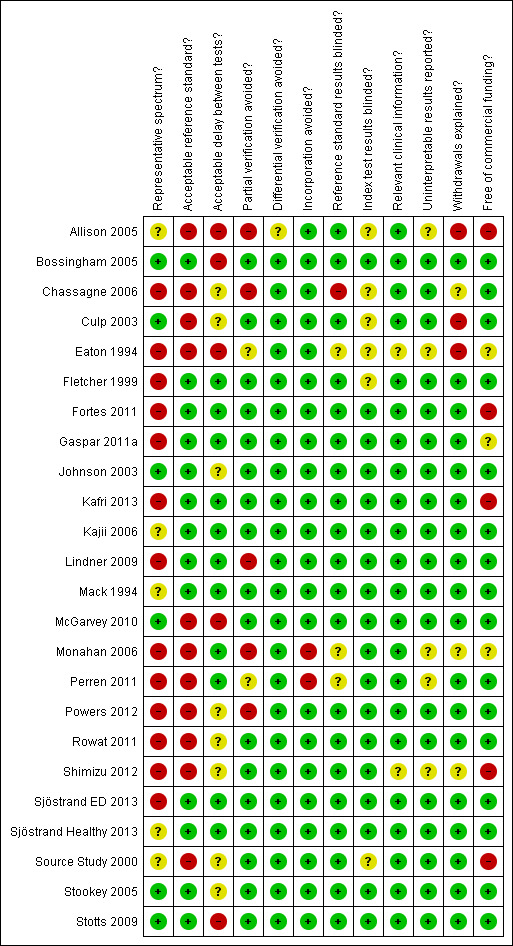
Methodological quality summary: review authors' judgements about each methodological quality item for each included study.
We assessed that 13/24 included studies had a low risk reference standard (serum or plasma osmolality directly observed).
Delay between index and reference standard tests is of particular importance in dehydration; hydration status can alter over the course of a few hours. For this reason our standard for good practice was that the delay between the index and reference standard tests would be two hours or less. We found that 11 studies were at low risk from delay between tests (less than two hours between at least 90% of index and reference standard tests); five were at high risk, and risk was unclear in eight studies.
We found that 17 studies were at low risk from partial verification (prospective studies where all participants received both index and reference standard tests); five were at high risk; and two were unclear risk. To be considered at low risk of bias from partial verification a study had to be prospective (so that the reference standard test was planned, and not delivered on the basis of other findings, that may include the results of the index tests) (de Groot 2011).
Our assessment found that 23 studies were at low risk from differential verification (studies at low risk used the same reference standard in all participants); one was unclear. Furthermore, 22 studies were at low risk of incorporation of index tests into the reference standard, and two were at high risk. There were 20 studies that had reference standard results interpreted blind to index test results, so were at low risk of reference standard results being interpreted according to the index test results; one was at high risk and three at unclear risk. There were 18 studies at low risk from index test results being interpreted according to reference standard test results; six were unclear. We found that 22 studies (including all of those where a dataset was provided) were at low risk of interpreting index or reference tests with reference to other relevant clinical data; two were unclear. We identified that 19 studies were at low risk of uninterpretable test results being a problem; five were at unclear risk. There were 18 studies at low risk of unexplained withdrawals, three at high risk and three at unclear risk. Lastly, 16 studies were at low risk of commercial funding biasing reporting of the study, five were at high risk and three at unclear risk.
Findings
Adequate sensitivity and specificity for water‐loss dehydration (including people with impending or current dehydration, serum osmolality ≥ 295 mOsm/kg)
Sensitivity was defined as the percentage of dehydrated people who are correctly identified as having the condition by the index test, and specificity the percentage of euhydrated people who were correctly identified by the index test as not being dehydrated. The positive predictive value (PPV) is the probability that with a positive index test result, the person is truly dehydrated, and the negative predictive value (NPV) is the probability that with a negative index test result, the person is truly euhydrated.
A ROC curve is a graph that shows how well a continuous index test predicts dehydration (as measured by the reference standard) as the cut‐off of the index test varies. For a clear introduction to the concepts of sensitivity, specificity, likelihood ratios and other measures, and interpretation of ROC plots see Linnet 2012.
The sensitivity and specificity of each index test for each included study at each pre‐specified cut‐off are presented in forest plots of sensitivity and specificity in the data tables. Furthermore, data on PPV, NPV, PLR and NLR, pre‐ and post‐test probabilities are presented in Table 4. Of the 152 cut‐offs tested for 68 possible index tests only three showed sensitivity of at least 60% and specificity of at least 75%. These potentially useful index tests were missing drinks between meals (sensitivity 1.00 (95% CI 0.59 to 1.00); specificity 0.77 (95% CI 0.64 to 0.86) in 71 people) and expressing fatigue (sensitivity 0.71 (95% CI 0.29 to 0.96); specificity 0.75 (95% CI 0.63 to 0.85) in 71 people, each assessed in Kajii 2006) and BIA resistance at 50 kHz with a cut‐off of ≥ 450 ohm. Two other studies (Sjöstrand ED 2013; Sjöstrand Healthy 2013) also assessed fatigue but did not show this level of diagnostic accuracy (with sensitivities of 0.42 (95% CI 0.23 to 0.63) and 0.30 (95% CI 0.07 to 0.65) and specificities of 0.80 (95% CI 0.28 to 0.99) and 1.00 (95% CI 0.29 to 1.00) in 31 and 13 people respectively). BIA resistance at 50 kHz was assessed in four studies but showed the appropriate specificity and sensitivity in only two (sensitivities 1.00 (95% CI 0.48 to 1.00) and 0.71 (95% CI 0.44 to 0.90) and specificities of 1.00 (95% CI 0.69 to 1.00) and 0.80 (95% CI 0.28 to 0.99) in 15 and 22 people respectively for Allison 2005 and Powers 2012, but with sensitivities of 0.54 (95% CI 0.25 to 0.81) and 0.69 (95% CI 0.56 to 0.79) and specificities of 0.50 (95% CI 0.16 to 0.84) and 0.19 (95% CI 0.17 to 0.21) in 21 and 1947 people respectively in Kafri 2013 and Stookey 2005).
3. Diagnostic accuracy of tests for water‐loss dehydration: 295 mOsm/kg cut‐off$.
| Test | Studies | TP | FP | FN | TN |
Sensitivity (95% CI) |
Specificity (95% CI) |
PPV | NPV | PLR | NLR | Pre‐test probability | Post‐test probability given T+ | Post‐test probability given T‐ |
| 1) Drinks intake: very low | Bossingham 2005 | 0 | 1 | 4 | 16 | 0.00 (0.00 to 0.60) | 0.94 (0.71 to 1.00) | 0 | 0.80 | 0 | 1.06 | 0.19 | 0 | 0.20 |
| Kajii 2006 | 3 | 2 | 4 | 62 | 0.43 (0.10 to 0.82) | 0.97 (0.89 to 1.00) | 0.6 | 0.94 | 13.71 | 0.59 | 0.10 | 0.6 | 0.06 | |
| 2) Drinks intake: low | Bossingham 2005 | 3 | 11 | 1 | 6 | 0.75 (0.19 to 0.99) | 0.35 (0.14 to 0.62) | 0.21 | 0.86 | 1.16 | 0.71 | 0.19 | 0.21 | 0.14 |
| Kajii 2006 | 5 | 20 | 2 | 44 | 0.71 (0.29 to 0.96) | 0.69 (0.56 to 0.80) | 0.2 | 0.96 | 2.29 | 0.42 | 0.10 | 0.2 | 0.04 | |
| 3) Drinks intake: moderate | Bossingham 2005 | 4 | 17 | 0 | 0 | 1.00 (0.40 to 1.00) | 0.00 (0.00 to 0.20) | 0.19 | # | 1 | # | 0.19 | 0.19 | # |
| Kajii 2006 | 7 | 49 | 0 | 15 | 1.00 (0.59 to 1.00) | 0.23 (0.14 to 0.36) | 0.13 | 1 | 1.31 | 0 | 0.10 | 0.13 | 0 | |
| 4) Drinks intake: standard | Bossingham 2005 | 0 | 5 | 4 | 12 | 0.00 (0.00 to 0.60) | 0.71 (0.44 to 0.90) | 0 | 0.75 | 0 | 1.42 | 0.19 | 0 | 0.25 |
| Kajii 2006 | 4 | 14 | 3 | 50 | 0.57 (0.18 to 0.90) | 0.78 (0.66 to 0.87) | 0.22 | 0.94 | 2.61 | 0.55 | 0.10 | 0.22 | 0.06 | |
| 5) Fluid intake: very low | Bossingham 2005 | 0 | 0 | 4 | 17 | 0.00 (0.00 to 0.60) | 1.00 (0.80 to 1.00) | # | 0.81 | # | 1 | 0.19 | # | 0.19 |
| Lindner 2009 | 5 | 0 | 21 | 8 | 0.19 (0.07 to 0.39) | 1.00 (0.63 to 1.00) | 1 | 0.28 | # | 0.81 | 0.76 | 1 | 0.72 | |
| Perren 2011 | 0 | 7 | 6 | 14 | 0.00 (0.00 to 0.46) | 0.67 (0.43 to 0.85) | 0 | 0.70 | 0 | 1.5 | 0.22 | 0 | 0.30 | |
| Stotts 2009 | 6 | 4 | 24 | 14 | 0.20 (0.08 to 0.39) | 0.78 (0.52 to 0.94) | 0.6 | 0.37 | 0.9 | 1.03 | 0.63 | 0.6 | 0.63 | |
| 6) Fluid intake: low | Stotts 2009 | 22 | 12 | 8 | 6 | 0.73 (0.54 to 0.88) | 0.33 (0.13 to 0.59) | 0.65 | 0.43 | 1.1 | 0.8 | 0.63 | 0.65 | 0.57 |
| Bossingham 2005 | 0 | 0 | 4 | 17 | 0.00 (0.00 to 0.60) | 1.00 (0.80 to 1.00) | # | 0.81 | # | 1 | 0.19 | # | 0.19 | |
| Lindner 2009 | 10 | 3 | 16 | 5 | 0.38 (0.20 to 0.59) | 0.63 (0.24 to 0.91) | 0.77 | 0.24 | 1.03 | 0.98 | 0.76 | 0.77 | 0.76 | |
| Perren 2011 | 2 | 10 | 4 | 11 | 0.33 (0.04 to 0.78) | 0.52 (0.30 to 0.74) | 0.17 | 0.73 | 0.7 | 1.27 | 0.22 | 0.17 | 0.27 | |
| 7) Fluid intake: moderate | Bossingham 2005 | 1 | 7 | 3 | 10 | 0.25 (0.01 to 0.81) | 0.59 (0.33 to 0.82) | 0.13 | 0.77 | 0.61 | 1.28 | 0.19 | 0.13 | 0.23 |
| Lindner 2009 | 14 | 4 | 12 | 4 | 0.54 (0.33 to 0.73) | 0.50 (0.16 to 0.84) | 0.78 | 0.25 | 1.08 | 0.92 | 0.76 | 0.78 | 0.75 | |
| Perren 2011 | 3 | 12 | 3 | 9 | 0.50 (0.12 to 0.88) | 0.43 (0.22 to 0.66) | 0.2 | 0.75 | 0.88 | 1.17 | 0.22 | 0.2 | 0.25 | |
| Stotts 2009 | 27 | 17 | 3 | 1 | 0.90 (0.73 to 0.98) | 0.06 (0.00 to 0.27) | 0.61 | 0.25 | 0.95 | 1.8 | 0.63 | 0.61 | 0.75 | |
| 8) Misses drinks between meals | Kajii 2006 | 7 | 15 | 0 | 49 | 1.00 (0.59 to 1.00) | 0.77 (0.64 to 0.86) | 0.32 | 1 | 4.27 | 0 | 0.10 | 0.32 | 0 |
| 9) Misses drinks at meals | Kajii 2006 | 0 | 3 | 7 | 61 | 0.00 (0.00 to 0.41) | 0.95 (0.87 to 0.99) | 0 | 0.90 | 0 | 1.05 | 0.10 | 0 | 0.10 |
| 10) Urine volume: < 300 mL/d | Bossingham 2005 | 0 | 0 | 4 | 17 | 0.00 (0.00 to 0.60) | 1.00 (0.80 to 1.00) | # | 0.81 | # | 1 | 0.19 | # | 0.19 |
| Fletcher 1999 | 0 | 0 | 4 | 11 | 0.00 (0.00 to 0.60) | 1.00 (0.72 to 1.00) | # | 0.73 | # | 1 | 0.27 | # | 0.27 | |
| Johnson 2003 | 0 | 0 | 15 | 28 | 0.00 (0.00 to 0.22) | 1.00 (0.88 to 1.00) | # | 0.65 | # | 1 | 0.35 | # | 0.35 | |
| Lindner 2009 | 4 | 0 | 22 | 8 | 0.15 (0.04 to 0.35) | 1.00 (0.63 to 1.00) | 1 | 0.27 | # | 0.85 | 0.76 | 1 | 0.73 | |
| Mack 1994 | 0 | 1 | 2 | 7 | 0.00 (0.00 to 0.84) | 0.88 (0.47 to 1.00) | 0 | 0.78 | 0 | 1.14 | 0.2 | 0 | 0.22 | |
| Perren 2011 | 0 | 9 | 6 | 12 | 0.00 (0.00 to 0.46) | 0.57 (0.34 to 0.78) | 0 | 0.67 | 0 | 1.75 | 0.22 | 0 | 0.33 | |
| 11) Urine volume: < 500 mL/d | Bossingham 2005 | 0 | 0 | 4 | 17 | 0.00 (0.00 to 0.60) | 1.00 (0.80 to 1.00) | # | 0.81 | # | 1 | 0.19 | # | 0.19 |
| Fletcher 1999 | 0 | 1 | 4 | 10 | 0.00 (0.00 to 0.60) | 0.91 (0.59 to 1.00) | 0 | 0.71 | 0 | 1.1 | 0.27 | 0 | 0.29 | |
| Johnson 2003 | 0 | 0 | 15 | 28 | 0.00 (0.00 to 0.22) | 1.00 (0.88 to 1.00) | # | 0.65 | # | 1 | 0.35 | # | 0.35 | |
| Lindner 2009 | 6 | 1 | 20 | 7 | 0.23 (0.09 to 0.44) | 0.88 (0.47 to 1.00) | 0.86 | 0.26 | 1.85 | 0.88 | 0.76 | 0.86 | 0.74 | |
| Mack 1994 | 0 | 2 | 2 | 6 | 0.00 (0.00 to 0.84) | 0.75 (0.35 to 0.97) | 0 | 0.75 | 0 | 1.33 | 0.2 | 0 | 0.25 | |
| Perren 2011 | 0 | 12 | 6 | 9 | 0.00 (0.00 to 0.46) | 0.43 (0.22 to 0.66) | 0 | 0.60 | 0 | 2.33 | 0.22 | 0 | 0.40 | |
| 12) Urine volume: < 800 mL/d | Bossingham 2005 | 0 | 0 | 4 | 17 | 0.00 (0.00 to 0.60) | 1.00 (0.80 to 1.00) | # | 0.81 | # | 1 | 0.19 | # | 0.19 |
| Fletcher 1999 | 0 | 2 | 4 | 9 | 0.00 (0.00 to 0.60) | 0.82 (0.48 to 0.98) | 0 | 0.69 | 0 | 1.22 | 0.27 | 0 | 0.31 | |
| Johnson 2003 | 0 | 0 | 15 | 28 | 0.00 (0.00 to 0.22) | 1.00 (0.88 to 1.00) | # | 0.65 | # | 1 | 0.35 | # | 0.35 | |
| Lindner 2009 | 10 | 3 | 16 | 5 | 0.38 (0.20 to 0.59) | 0.63 (0.24 to 0.91) | 0.77 | 0.24 | 1.03 | 0.98 | 0.76 | 0.77 | 0.76 | |
| Mack 1994 | 1 | 4 | 1 | 4 | 0.50 (0.01 to 0.99) | 0.50 (0.16 to 0.84) | 0.2 | 0.8 | 1 | 1 | 0.2 | 0.2 | 0.2 | |
| Perren 2011 | 4 | 21 | 2 | 0 | 0.67 (0.22 to 0.96) | 0.00 (0.00 to 0.16) | 0.16 | 0.00 | 0.67 | # | 0.22 | 0.16 | 1.00 | |
| 13) Urine volume: fluid recommendations (alt) | Bossingham 2005 | 0 | 1 | 4 | 16 | 0.00 (0.00 to 0.60) | 0.94 (0.71 to 1.00) | 0 | 0.80 | 0 | 1.06 | 0.19 | 0 | 0.20 |
| Fletcher 1999 | 2 | 8 | 2 | 3 | 0.50 (0.07 to 0.93) | 0.27 (0.06 to 0.61) | 0.2 | 0.6 | 0.69 | 1.83 | 0.27 | 0.2 | 0.4 | |
| Johnson 2003 | 1 | 3 | 14 | 25 | 0.07 (0.00 to 0.32) | 0.89 (0.72 to 0.98) | 0.25 | 0.64 | 0.62 | 1.05 | 0.35 | 0.25 | 0.36 | |
| Lindner 2009 | 19 | 5 | 7 | 3 | 0.73 (0.52 to 0.88) | 0.38 (0.09 to 0.76) | 0.79 | 0.3 | 1.17 | 0.72 | 0.76 | 0.79 | 0.7 | |
| Mack 1994 | 1 | 7 | 1 | 1 | 0.50 (0.01 to 0.99) | 0.13 (0.00 to 0.53) | 0.13 | 0.5 | 0.57 | 4 | 0.2 | 0.13 | 0.5 | |
| Perren 2011 | 3 | 6 | 3 | 15 | 0.50 (0.12 to 0.88) | 0.71 (0.48 to 0.89) | 0.33 | 0.83 | 1.75 | 0.7 | 0.22 | 0.33 | 0.17 | |
| 14) Urine volume (day): > 900 mL | Johnson 2003 | 3 | 3 | 12 | 25 | 0.20 (0.04 to 0.48) | 0.89 (0.72 to 0.98) | 0.5 | 0.68 | 1.87 | 0.90 | 0.35 | 0.5 | 0.32 |
| 15) Urine volume (day): > 1420 mL | Johnson 2003 | 7 | 15 | 8 | 13 | 0.47 (0.21 to 0.73) | 0.46 (0.28 to 0.66) | 0.32 | 0.62 | 0.87 | 1.15 | 0.35 | 0.32 | 0.38 |
| 16) Urine volume (day): > 1940 mL | Johnson 2003 | 12 | 22 | 3 | 6 | 0.80 (0.52 to 0.96) | 0.21 (0.08 to 0.41) | 0.35 | 0.67 | 1.02 | 0.93 | 0.35 | 0.35 | 0.33 |
| 17) Urine volume (night): > 450 mL | Johnson 2003 | 1 | 2 | 14 | 26 | 0.07 (0.00 to 0.32) | 0.93 (0.76 to 0.99) | 0.33 | 0.65 | 0.93 | 1.01 | 0.35 | 0.33 | 0.35 |
| 18) Urine volume (night): > 860 mL | Johnson 2003 | 8 | 13 | 7 | 15 | 0.53 (0.27 to 0.79) | 0.54 (0.34 to 0.72) | 0.38 | 0.68 | 1.15 | 0.87 | 0.35 | 0.38 | 0.32 |
| 19) Urine volume (night): > 1270 mL | Johnson 2003 | 12 | 26 | 3 | 2 | 0.80 (0.52 to 0.96) | 0.07 (0.01 to 0.24) | 0.32 | 0.40 | 0.86 | 2.8 | 0.35 | 0.32 | 0.60 |
| 20) Urine voids/day: ≥ 11 | Johnson 2003 | 0 | 1 | 2 | 40 | 0.00 (0.00 to 0.84) | 0.98 (0.87 to 1.00) | 0 | 0.95 | 0 | 1.03 | 0.05 | 0 | 0.05 |
| 21) Urine voids/day: ≥ 7 | Johnson 2003 | 2 | 20 | 0 | 21 | 1.00 (0.16 to 1.00) | 0.51 (0.35 to 0.67) | 0.09 | 1.00 | 2.05 | 0 | 0.05 | 0.09 | 0 |
| 22) Urine voids/day: ≥ 4 | Johnson 2003 | 2 | 38 | 0 | 3 | 1.00 (0.16 to 1.00) | 0.07 (0.02 to 0.20) | 0.05 | 1.00 | 1.08 | 0 | 0.05 | 0.05 | 0 |
| 23) Urine voids/night: ≥ 1.5 | Johnson 2003 | 0 | 4 | 15 | 24 | 0.00 (0.00 to 0.22) | 0.86 (0.67 to 0.96) | 0 | 0.62 | 0 | 1.17 | 0.35 | 0 | 0.39 |
| 24) Urine voids/night: ≥ 2.6 | Johnson 2003 | 8 | 14 | 7 | 14 | 0.53 (0.27 to 0.79) | 0.50 (0.31 to 0.69) | 0.36 | 0.67 | 1.07 | 0.93 | 0.35 | 0.36 | 0.33 |
| 25) Urine voids/night: ≥ 4.1 | Johnson 2003 | 13 | 24 | 2 | 4 | 0.87 (0.60 to 0.98) | 0.14 (0.04 to 0.33) | 0.35 | 0.67 | 1.01 | 0.93 | 0.35 | 0.35 | 0.33 |
| 26) Nocturnal polyuria | Johnson 2003 | 8 | 16 | 7 | 12 | 0.53 (0.27 to 0.79) | 0.43 (0.24 to 0.63) | 0.33 | 0.63 | 0.93 | 1.09 | 0.35 | 0.33 | 0.37 |
| 27) Fluid balance: < ‐180 mL/d (< a fluid deficit of 180 mL/d) | Bossingham 2005 | 0 | 0 | 4 | 17 | 0.00 (0.00 to 0.60) | 1.00 (0.80 to 1.00) | # | 0.81 | # | 1 | 0.19 | # | 0.19 |
| Lindner 2009 | 2 | 0 | 24 | 8 | 0.08 (0.01 to 0.25) | 1.00 (0.63 to 1.00) | 1 | 0.25 | # | 0.92 | 0.76 | 1 | 0.75 | |
| Monahan 2006 | 2 | 3 | 5 | 0 | 0.29 (0.04 to 0.71) | 0.00 (0.00 to 0.71) | 0.4 | 0 | 0.29 | # | 0.7 | 0.4 | 1 | |
| Perren 2011 | 0 | 9 | 6 | 12 | 0.00 (0.00 to 0.46) | 0.57 (0.34 to 0.78) | 0 | 0.67 | 0 | 1.75 | 0.22 | 0 | 0.33 | |
| 28) Fluid balance: < +180 mL/d (< a fluid excess of 180 mL/d) | Bossingham 2005 | 2 | 8 | 2 | 9 | 0.50 (0.07to 0.93) | 0.53 (0.28to 0.77) | 0.2 | 0.82 | 1.06 | 0.94 | 0.19 | 0.2 | 0.18 |
| Lindner 2009 | 4 | 0 | 22 | 8 | 0.15 (0.04to 0.35) | 1.00 (0.63to 1.00) | 1 | 0.27 | # | 0.85 | 0.76 | 1 | 0.73 | |
| Monahan 2006 | 3 | 3 | 4 | 0 | 0.43 (0.10to 0.82) | 0.00 (0.00to 0.71) | 0.5 | 0 | 0.43 | # | 0.7 | 0.5 | 1 | |
| Perren 2011 | 0 | 12 | 6 | 9 | 0.00 (0.00to 0.46) | 0.43 (0.22to 0.66) | 0 | 0.60 | 0 | 2.33 | 0.22 | 0 | 0.40 | |
| 29) Fluid balance: < +1700 mL/d (< a fluid excess of 1700 mL/d) | Bossingham 2005 | 4 | 17 | 0 | 0 | 1.00 (0.40to 1.00) | 0.00 (0.00to 0.20) | 0.19 | # | 1 | # | 0.19 | 0.19 | # |
| Lindner 2009 | 12 | 4 | 14 | 4 | 0.46 (0.27to 0.67) | 0.50 (0.16to 0.84) | 0.75 | 0.22 | 0.92 | 1.08 | 0.76 | 0.75 | 0.78 | |
| Monahan 2006 | 3 | 3 | 4 | 0 | 0.43 (0.10to 0.82) | 0.00 (0.00 to 0.71) | 0.5 | 0 | 0.43 | # | 0.7 | 0.5 | 1 | |
| Perren 2011 | 4 | 21 | 2 | 0 | 0.67 (0.22 to 0.96) | 0.00 (0.00 to 0.16) | 0.16 | 0.00 | 0.67 | # | 0.22 | 0.16 | 1.00 | |
| 30) USG: ≥ 1.035 | Bossingham 2005 | 0 | 0 | 2 | 19 | 0.00 (0.00 to 0.84) | 1.00 (0.82 to 1.00) | # | 0.810 | # | 1 | 0.190 | # | 0.190 |
| Culp 2003 | 0 | 0 | 245 | 63 | 0.00 (0.00 to 0.01) | 1.00 (0.94 to 1.00) | # | 0.205 | # | 1 | 0.795 | # | 0.795 | |
| Rowat 2011 | 2 | 1 | 11 | 3 | 0.15 (0.02 to 0.45) | 0.75 (0.19 to 0.99) | 0.67 | 0.21 | 0.62 | 1.13 | 0.77 | 0.67 | 0.79 | |
| Sjöstrand Healthy 2013 | 0 | 0 | 9 | 3 | 0.00 (0.00 to 0.34) | 1.00 (0.29 to 1.00) | # | 0.25 | # | 1.00 | 0.75 | # | 0.75 | |
| 31) USG: ≥ 1.028 | Bossingham 2005 | 0 | 0 | 2 | 19 | 0.00 (0.00 to 0.84) | 1.00 (0.82 to 1.00) | # | 0.810 | # | 1 | 0.190 | # | 0.190 |
| Culp 2003 | 7 | 5 | 238 | 58 | 0.03 (0.01 to 0.06) | 0.92 (0.82 to 0.97) | 0.58 | 0.20 | 0.36 | 1.06 | 0.80 | 0.58 | 0.80 | |
| Rowat 2011 | 3 | 1 | 10 | 3 | 0.23 (0.05 to 0.54) | 0.75 (0.19 to 0.99) | 0.75 | 0.23 | 0.92 | 1.03 | 0.77 | 0.75 | 0.77 | |
| Sjöstrand Healthy 2013 | 0 | 0 | 9 | 3 | 0.00 (0.00 to 0.34) | 1.00 (0.29 to 1.00) | # | 0.25 | # | 1.00 | 0.75 | # | 0.75 | |
| 32) USG: ≥ 1.020 | Bossingham 2005 | 0 | 0 | 2 | 19 | 0.00 (0.00 to 0.84) | 1.00 (0.82 to 1.00) | # | 0.81 | # | 1 | 0.19 | # | 0.19 |
| Culp 2003 | 58 | 18 | 187 | 45 | 0.24 (0.18 to 0.30) | 0.71 (0.59 to 0.82) | 0.76 | 0.19 | 0.83 | 1.07 | 0.80 | 0.76 | 0.81 | |
| Rowat 2011 | 6 | 2 | 7 | 2 | 0.46 (0.19 to 0.75) | 0.50 (0.07 to 0.93) | 0.75 | 0.22 | 0.92 | 1.08 | 0.77 | 0.75 | 0.78 | |
| Sjöstrand Healthy 2013 | 3 | 1 | 6 | 2 | 0.33 (0.07 to 0.70) | 0.67 (0.09 to 0.99) | 0.75 | 0.25 | 1.00 | 1.00 | 0.75 | 0.75 | 0.75 | |
| 33) Urine colour: > 6 | Fletcher 1999 | 1 | 1 | 3 | 10 | 0.25 (0.01 to 0.81) | 0.91 (0.59 to 1.00) | 0.5 | 0.77 | 2.75 | 0.83 | 0.27 | 0.5 | 0.23 |
| Rowat 2011 | 11 | 3 | 2 | 1 | 0.85 (0.55 to 0.98) | 0.25 (0.01 to 0.81) | 0.79 | 0.333 | 1.13 | 0.62 | 0.77 | 0.79 | 0.67 | |
| Sjöstrand ED 2013 | 1 | 0 | 28 | 7 | 0.03 (0.00 to 0.18) | 1.00 (0.59 to 1.00) | 1.00 | 0.20 | # | 0.97 | 0.81 | 1.00 | 0.80 | |
| Sjöstrand Healthy 2013 | 0 | 0 | 7 | 3 | 0.00 (0.00 to 0.41) | 1.00 (0.29 to 1.00) | # | 0.30 | # | 1.00 | 0.70 | # | 0.70 | |
| 34) Urine colour: > 4 | Fletcher 1999 | 3 | 9 | 1 | 2 | 0.75 (0.19 to 0.99) | 0.18 (0.02 to 0.52) | 0.25 | 0.67 | 0.92 | 1.38 | 0.27 | 0.25 | 0.33 |
| Rowat 2011 | 9 | 2 | 4 | 2 | 0.69 (0.39 to 0.91) | 0.50 (0.07 to 0.93) | 0.82 | 0.33 | 1.38 | 0.62 | 0.77 | 0.82 | 0.67 | |
| Sjöstrand ED 2013 | 4 | 0 | 25 | 7 | 0.14 (0.04 to 0.32) | 1.00 (0.59 to 1.00) | 1.00 | 0.22 | # | 0.86 | 0.81 | 1.00 | 0.78 | |
| Sjöstrand Healthy 2013 | 0 | 0 | 7 | 3 | 0.00 (0.00 to 0.41) | 1.00 (0.29 to 1.00) | # | 0.30 | # | 1.00 | 0.70 | # | 0.70 | |
| 35) Urine colour: > 2 | Fletcher 1999 | 4 | 10 | 0 | 1 | 1.00 (0.40 to 1.00) | 0.09 (0.00 to 0.41) | 0.29 | 1 | 1.1 | 0 | 0.27 | 0.29 | 0 |
| Rowat 2011 | 2 | 1 | 11 | 3 | 0.15 (0.02 to 0.45) | 0.75 (0.19 to 0.99) | 0.67 | 0.21 | 0.62 | 1.13 | 0.77 | 0.67 | 0.79 | |
| Sjöstrand ED 2013 | 20 | 4 | 9 | 3 | 0.69 (0.49 to 0.85) | 0.43 (0.10 to 0.82) | 0.83 | 0.25 | 1.21 | 0.72 | 0.81 | 0.83 | 0.75 | |
| Sjöstrand Healthy 2013 | 5 | 1 | 2 | 2 | 0.71 (0.29 to 0.96) | 0.67 (0.09 to 0.99) | 0.83 | 0.50 | 2.14 | 0.43 | 0.70 | 0.83 | 0.50 | |
| 36) Urine osmolality: > 1000 mOsm/kg | Fletcher 1999 | 0 | 0 | 4 | 11 | 0.00 (0.00 to 0.60) | 1.00 (0.72 to 1.00) | # | 0.73 | # | 1 | 0.27 | # | 0.27 |
| Johnson 2003 | 0 | 0 | 15 | 28 | 0.00 (0.00 to 0.22) | 1.00 (0.88 to 1.00) | # | 0.65 | # | 1 | 0.35 | # | 0.35 | |
| Lindner 2009 | 0 | 0 | 19 | 8 | 0.00 (0.00 to 0.18) | 1.00 (0.63 to 1.00) | # | 0.30 | # | 1 | 0.70 | # | 0.70 | |
| Powers 2012 | 1 | 0 | 16 | 5 | 0.06 (0.00 to 0.29) | 1.00 (0.48 to 1.00) | 1 | 0.24 | # | 0.94 | 0.77 | 1 | 0.76 | |
| Sjöstrand ED 2013 | 0 | 0 | 31 | 7 | 0.00 (0.00 to 0.11) | 1.00 (0.59 to 1.00) | # | 0.18 | # | 1.00 | 0.82 | # | 0.82 | |
| Sjöstrand Healthy 2013 | 0 | 0 | 10 | 3 | 0.00 (0.00 to 0.31) | 1.00 (0.29 to 1.00) | # | 0.23 | # | 1.00 | 0.77 | # | 0.77 | |
| 37) Urine osmolality: > 800 mOsm/kg | Fletcher 1999 | 1 | 1 | 3 | 10 | 0.25 (0.01 to 0.81) | 0.91 (0.59 to 1.00) | 0.5 | 0.77 | 2.75 | 0.83 | 0.27 | 0.5 | 0.23 |
| Johnson 2003 | 0 | 0 | 15 | 28 | 0.00 (0.00 to 0.22) | 1.00 (0.88 to 1.00) | # | 0.65 | # | 1 | 0.35 | # | 0.35 | |
| Lindner 2009 | 0 | 0 | 19 | 8 | 0.00 (0.00 to 0.18) | 1.00 (0.63 to 1.00) | # | 0.30 | # | 1 | 0.70 | # | 0.70 | |
| Powers 2012 | 3 | 1 | 14 | 4 | 0.18 (0.04 to 0.43) | 0.80 (0.28 to 0.99) | 0.75 | 0.22 | 0.88 | 1.03 | 0.77 | 0.75 | 0.78 | |
| Sjöstrand ED 2013 | 5 | 0 | 26 | 7 | 0.16 (0.05 to 0.34) | 1.00 (0.59 to 1.00) | 1.00 | 0.21 | # | 0.84 | 0.82 | 1.00 | 0.79 | |
| Sjöstrand Healthy 2013 | 2 | 0 | 8 | 3 | 0.20 (0.03 to 0.56) | 1.00 (0.29 to 1.00) | 1.00 | 0.27 | # | 0.80 | 0.77 | 1.00 | 0.73 | |
| 38) Urine osmolality: > 600 mOsm/kg | Fletcher 1999 | 1 | 6 | 3 | 5 | 0.25 (0.01 to 0.81) | 0.45 (0.17 to 0.77) | 0.14 | 0.63 | 0.46 | 1.65 | 0.27 | 0.14 | 0.38 |
| Johnson 2003 | 5 | 6 | 10 | 22 | 0.33 (0.12 to 0.62) | 0.79 (0.59 to 0.92) | 0.45 | 0.69 | 1.56 | 0.85 | 0.35 | 0.45 | 0.31 | |
| Lindner 2009 | 4 | 1 | 15 | 7 | 0.21 (0.06 to 0.46) | 0.88 (0.47 to 1.00) | 0.8 | 0.32 | 1.68 | 0.90 | 0.70 | 0.8 | 0.68 | |
| Powers 2012 | 7 | 1 | 10 | 4 | 0.41 (0.18 to 0.67) | 0.80 (0.28 to 0.99) | 0.88 | 0.29 | 2.06 | 0.74 | 0.77 | 0.88 | 0.71 | |
| Sjöstrand ED 2013 | 15 | 1 | 16 | 6 | 0.48 (0.30 to 0.67) | 0.86 (0.42 to 1.00) | 0.94 | 0.27 | 3.39 | 0.60 | 0.82 | 0.94 | 0.73 | |
| Sjöstrand Healthy 2013 | 8 | 1 | 2 | 2 | 0.80 (0.44 to 0.97) | 0.67 (0.09 to 0.99) | 0.89 | 0.50 | 2.40 | 0.30 | 0.77 | 0.89 | 0.50 | |
| 39) Tear osmolarity: > 324 mOsm/L | Fortes 2011 | 8 | 28 | 12 | 41 | 0.40 (0.19 to 0.64) | 0.59 (0.47 to 0.71) | 0.22 | 0.77 | 0.99 | 1.01 | 0.23 | 0.22 | 0.23 |
| 40) Tear osmolarity: > 316 mOsm/L | Fortes 2011 | 10 | 37 | 10 | 32 | 0.50 (0.27 to 0.73) | 0.46 (0.34 to 0.59) | 0.21 | 0.76 | 0.93 | 1.08 | 0.23 | 0.21 | 0.24 |
| 41) Tear osmolarity: > 310 mOsm/L | Fortes 2011 | 11 | 49 | 9 | 20 | 0.55 (0.32 to 0.77) | 0.29 (0.19 to 0.41) | 0.18 | 0.69 | 0.77 | 1.55 | 0.23 | 0.18 | 0.31 |
| 42) Heart rate: ≥ 120 BPM | Chassagne 2006 | 6 | 1 | 246 | 51 | 0.02 (0.01 to 0.05) | 0.98 (0.90 to 1.00) | 0.86 | 0.17 | 1.24 | 1.00 | 0.83 | 0.86 | 0.83 |
| Lindner 2009 | 2 | 1 | 24 | 7 | 0.08 (0.01, 0.25) | 0.88 (0.47 to 1.00) | 0.67 | 0.23 | 0.62 | 1.05 | 0.76 | 0.67 | 0.77 | |
| Powers 2012 | 0 | 0 | 17 | 5 | 0.00 (0.00 to 0.20) | 1.00 (0.48 to 1.00) | # | 0.23 | # | 1 | 0.77 | # | 0.77 | |
| Sjöstrand Healthy 2013 | 0 | 0 | 10 | 3 | 0.00 (0.00 to 0.31) | 1.00 (0.29 to 1.00) | # | 0.23 | # | 1.00 | 0.77 | # | 0.77 | |
| 43) Heart rate: ≥ 100 BPM | Chassagne 2006 | 23 | 5 | 229 | 47 | 0.09 (0.06 to 0.13) | 0.90 (0.79 to 0.97) | 0.82 | 0.17 | 0.95 | 1.01 | 0.83 | 0.82 | 0.83 |
| Lindner 2009 | 8 | 4 | 18 | 4 | 0.31 (0.14 to 0.52) | 0.50 (0.16 to 0.84) | 0.67 | 0.18 | 0.62 | 1.38 | 0.76 | 0.67 | 0.82 | |
| Powers 2012 | 0 | 1 | 17 | 4 | 0.00 (0.00 to 0.20) | 0.80 (0.28 to 0.99) | 0 | 0.19 | 0 | 1.25 | 0.77 | 0 | 0.81 | |
| Sjöstrand Healthy 2013 | 0 | 0 | 10 | 3 | 0.00 (0.00 to 0.31) | 1.00 (0.29 to 1.00) | # | 0.23 | # | 1.00 | 0.77 | # | 0.77 | |
| 44) Heart rate: ≥ 80 BPM | Chassagne 2006 | 118 | 22 | 134 | 30 | 0.47 (0.41 to 0.53) | 0.58 (0.43 to 0.71) | 0.84 | 0.18 | 1.11 | 0.92 | 0.83 | 0.84 | 0.82 |
| Lindner 2009 | 16 | 8 | 10 | 0 | 0.62 (0.41 to 0.80) | 0.00 (0.00 to 0.37) | 0.67 | 0 | 0.62 | # | 0.76 | 0.67 | 1 | |
| Powers 2012 | 2 | 2 | 15 | 3 | 0.12 (0.01 to 0.36) | 0.60 (0.15 to 0.95) | 0.5 | 0.17 | 0.29 | 1.47 | 0.77 | 0.5 | 0.83 | |
| Sjöstrand Healthy 2013 | 4 | 0 | 6 | 3 | 0.40 (0.12 to 0.74) | 1.00 (0.29 to 1.00) | 1.00 | 0.33 | # | 0.60 | 0.77 | 1.00 | 0.67 | |
| 45) Orthostatic hypotension | Chassagne 2006 | 19 | 4 | 100 | 20 | 0.16 (0.10 to 0.24) | 0.83 (0.63 to 0.95) | 0.83 | 0.17 | 0.96 | 1.01 | 0.83 | 0.83 | 0.83 |
| 46) Body temperature: ≥ 38.2oC | Chassagne 2006 | 21 | 1 | 224 | 49 | 0.09 (0.05 to 0.13) | 0.98 (0.89 to 1.00) | 0.95 | 0.18 | 4.29 | 0.93 | 0.83 | 0.95 | 0.82 |
| 47) Body temperature: ≥ 36.8oC | Chassagne 2006 | 210 | 39 | 35 | 11 | 0.86 (0.81 to 0.90) | 0.22 (0.12 to 0.36) | 0.84 | 0.24 | 1.10 | 0.65 | 0.83 | 0.84 | 0.76 |
| 48) Body temperature: ≥ 33.2oC | Chassagne 2006 | 244 | 50 | 1 | 0 | 1.00 (0.98 to 1.00) | 0.00 (0.00 to 0.07) | 0.83 | 0 | 1.00 | # | 0.83 | 0.83 | 1 |
| 49) Skin turgor, anterior forearm: ≥ 3 sec | Chassagne 2006 | 115 | 22 | 134 | 29 | 0.46 (0.40 to 0.53) | 0.57 (0.42 to 0.71) | 0.84 | 0.18 | 1.07 | 0.95 | 0.83 | 0.84 | 0.82 |
| 50) Skin turgor, anterior thigh: ≥ 3 sec | Chassagne 2006 | 71 | 8 | 179 | 43 | 0.28 (0.23 to 0.34) | 0.84 (0.71 to 0.93) | 0.90 | 0.19 | 1.81 | 0.85 | 0.83 | 0.90 | 0.81 |
| 51) Skin turgor, anterior thigh: abnormal | Source Study 2000 | 11 | 5 | 98 | 48 | 0.10 (0.05 to 0.17) | 0.91 (0.79 to 0.97) | 0.6875 | 0.32876712 | 1.07 | 0.992737 | 0.67283951 | 0.6875 | 0.67123288 |
| 52) Skin turgor, subclavicular: ≥ 3 sec | Chassagne 2006 | 99 | 12 | 154 | 39 | 0.39 (0.33 to 0.45) | 0.76 (0.63 to 0.87) | 0.89 | 0.20 | 1.66 | 0.80 | 0.839 | 0.89 | 0.80 |
| 53) Skin turgor, sternum: ≥ 3 sec | Chassagne 2006 | 76 | 13 | 175 | 38 | 0.30 (0.25 to 0.36) | 0.75 (0.60 to 0.86) | 0.85 | 0.18 | 1.19 | 0.94 | 0.83 | 0.85 | 0.82 |
| 54) Skin turgor, anterior chest: slow | Shimizu 2012 | 2 | 6 | 9 | 12 | 0.18 (0.02 to 0.52) | 0.67 (0.41 to 0.87) | 0.25 | 0.57 | 0.55 | 1.23 | 0.38 | 0.25 | 0.43 |
| 55) Skin turgor, hand: ≥ 4 sec | Kafri 2013 | 1 | 0 | 17 | 13 | 0.06 (0.00 to 0.27) | 1.00 (0.75 to 1.00) | 1 | 0.43 | # | 0.94 | 0.58 | 1 | 0.57 |
| 56) Skin turgor, hand: ≥ 3 sec | Kafri 2013 | 1 | 3 | 15 | 12 | 0.06 (0.00 to 0.30) | 0.80 (0.52 to 0.96) | 0.25 | 0.44 | 0.31 | 1.17 | 0.52 | 0.06 | 0.8 |
| 57) Skin turgor, hand: ≥ 1 sec | Kafri 2013 | 17 | 13 | 1 | 0 | 0.94 (0.73 to 1.00) | 0.00 (0.00 to 0.25) | 0.57 | 0 | 0.94 | # | 0.58 | 0.57 | 1 |
| 58) Skin turgor, hand: abnormal | McGarvey 2010 | 2 | 3 | 1 | 5 | 0.67 (0.09 to 0.99) | 0.63 (0.24 to 0.91) | 0.4 | 0.83 | 1.78 | 0.53 | 0.27 | 0.4 | 0.17 |
| 59) Skin turgor, site unspecified: abnormal | Rowat 2011 | 3 | 1 | 11 | 3 | 0.21 (0.05 to 0.51) | 0.75 (0.19 to 0.99) | 0.75 | 0.21 | 0.86 | 1.05 | 0.78 | 0.75 | 0.79 |
| 60) Capillary refill: ≥ 4 sec | Kafri 2013 | 1 | 0 | 17 | 13 | 0.06 (0.00 to 0.27) | 1.00 (0.75 to 1.00) | 1 | 0.43 | # | 0.94 | 0.58 | 1 | 0.57 |
| 61) Capillary refill: ≥ 3 sec | Kafri 2013 | 3 | 2 | 15 | 11 | 0.17 (0.04 to 0.41) | 0.85 (0.55 to 0.98) | 0.6 | 0.42 | 1.08 | 0.98 | 0.58 | 0.6 | 0.58 |
| Shimizu 2012 | 2 | 3 | 7 | 15 | 0.22 (0.03 to 0.60) | 0.83 (0.59 to 0.96) | 0.4 | 0.68 | 1.33 | 0.93 | 0.33 | 0.4 | 0.32 | |
| 62) Capillary refill: ≥ 2 sec | Kafri 2013 | 14 | 8 | 4 | 5 | 0.78 (0.52 to 0.94) | 0.38 (0.14 to 0.68) | 0.64 | 0.56 | 1.26 | 0.58 | 0.58 | 0.64 | 0.44 |
| 63) Dry axilla by touch | Eaton 1994 | 10 | 12 | 10 | 54 | 0.50 (0.27 to 0.73) | 0.82 (0.70 to 0.90) | 0.45 | 0.84 | 2.75 | 0.61 | 0.23 | 0.45 | 0.16 |
| Shimizu 2012 | 4 | 3 | 7 | 15 | 0.36 (0.11 to 0.69) | 0.83 (0.59 to 0.96) | 0.57 | 0.68 | 2.18 | 0.76 | 0.38 | 0.57 | 0.32 | |
| 64) Dry axilla by meter: < 32% | Shimizu 2012 | 4 | 1 | 11 | 13 | 0.27 (0.08 to 0.55) | 0.93 (0.66 to 1.00) | 0.8 | 0.54 | 3.73 | 0.79 | 0.52 | 0.8 | 0.46 |
| 65) Dry axilla by meter: < 37% | Shimizu 2012 | 12 | 6 | 3 | 8 | 0.80 (0.52 to 0.96) | 0.57 (0.29 to 0.82) | 0.67 | 0.73 | 1.87 | 0.35 | 0.52 | 0.67 | 0.27 |
| 66) Dry axilla by meter: < 42% | Shimizu 2012 | 14 | 8 | 1 | 6 | 0.93 (0.68 to 1.00) | 0.43 (0.18 to 0.71) | 0.64 | 0.86 | 1.63 | 0.16 | 0.52 | 0.64 | 0.14 |
| 67) Consciousness level: ≥ coma | Chassagne 2006 | 9 | 1 | 246 | 47 | 0.04 (0.02 to 0.07) | 0.98 (0.89 to 1.00) | 0.9 | 0.16 | 1.69 | 0.99 | 0.84 | 0.9 | 0.84 |
| 68) Consciousness level: ≥ stupor | Chassagne 2006 | 39 | 6 | 216 | 42 | 0.15 (0.11 to 0.20) | 0.88 (0.75 to 0.95) | 0.87 | 0.16 | 1.22 | 0.97 | 0.84 | 0.87 | 0.84 |
| Shimizu 2012 | 1 | 5 | 8 | 13 | 0.11 (0.00 to 0.48) | 0.72 (0.47 to 0.90) | 0.17 | 0.62 | 0.4 | 1.23 | 0.33 | 0.17 | 0.38 | |
| 69) Consciousness level: ≥ obsessed | Chassagne 2006 | 142 | 23 | 113 | 25 | 0.56 (0.49 to 0.62) | 0.52 (0.37 to 0.67) | 0.86 | 0.18 | 1.16 | 0.85 | 0.84 | 0.86 | 0.82 |
| 70) MMSE: < 10 | Culp 2003 | 2 | 0 | 243 | 63 | 0.01 (0.00 to 0.03) | 1.00 (0.94 to 1.00) | 1 | 0.21 | # | 0.99 | 0.80 | 1 | 0.79 |
| Gaspar 2011a | 0 | 0 | 3 | 14 | 0.00 (0.00 to 0.71) | 1.00 (0.77 to 1.00) | # | 0.82 | # | 1 | 0.18 | # | 0.18 | |
| 71) MMSE: < 20 | Culp 2003 | 74 | 15 | 171 | 48 | 0.30 (0.25 to 0.36) | 0.76 (0.64 to 0.86) | 0.83 | 0.22 | 1.27 | 0.92 | 0.80 | 0.83 | 0.78 |
| Gaspar 2011a | 0 | 1 | 3 | 13 | 0.00 (0.00 to 0.71) | 0.93 (0.66 to 1.00) | 0 | 0.81 | 0 | 1.08 | 0.18 | 0 | 0.19 | |
| 72) MMSE: < 25 | Culp 2003 | 141 | 36 | 104 | 27 | 0.58 (0.51 to 0.64) | 0.43 (0.30 to 0.56) | 0.80 | 0.21 | 1.01 | 0.99 | 0.80 | 0.80 | 0.79 |
| Gaspar 2011a | 0 | 4 | 3 | 10 | 0.00 (0.00 to 0.71) | 0.71 (0.42 to 0.92) | 0 | 0.77 | 0 | 1.4 | 0.18 | 0 | 0.23 | |
| 73) Neecham: < 20 | Culp 2003 | 7 | 0 | 238 | 63 | 0.03 (0.01 to 0.06) | 1.00 (0.94 to 1.00) | 1 | 0.21 | # | 0.97 | 0.80 | 1 | 0.79 |
| 74) Neecham: ≤ 24 | Culp 2003 | 36 | 8 | 209 | 55 | 0.15 (0.11 to 0.20) | 0.87 (0.77 to 0.94) | 0.82 | 0.21 | 1.16 | 0.98 | 0.80 | 0.82 | 0.79 |
| 75) Neecham: < 27 | Culp 2003 | 108 | 24 | 137 | 39 | 0.44 (0.38 to 0.51) | 0.62 (0.49 to 0.74) | 0.82 | 0.22 | 1.16 | 0.90 | 0.80 | 0.82 | 0.78 |
| 76) Tiredness: severe | Sjöstrand Healthy 2013 | 0 | 0 | 10 | 3 | 0.00 (0.00 to 0.31) | 1.00 (0.29 to 1.00) | # | 0.23 | # | 1.00 | 0.77 | # | 0.77 |
| Sjöstrand ED 2013 | 3 | 0 | 23 | 5 | 0.12 (0.02 to 0.30) | 1.00 (0.48 to 1.00) | 1.00 | 0.18 | # | 0.88 | 0.84 | 1.00 | 0.82 | |
| 77) Tiredness: moderate or severe | Sjöstrand Healthy 2013 | 1 | 0 | 9 | 3 | 0.10 (0.00 to 0.45) | 1.00 (0.29 to 1.00) | 1.00 | 0.25 | # | 0.90 | 0.77 | 1.00 | 0.75 |
| Sjöstrand ED 2013 | 7 | 1 | 19 | 4 | 0.27 (0.12 to 0.48) | 0.80 (0.28 to 0.99) | 0.88 | 0.17 | 1.35 | 0.91 | 0.84 | 0.88 | 0.83 | |
| 78) Fatigue | Kajii 2006 | 5 | 16 | 2 | 48 | 0.71 (0.29 to 0.96) | 0.75 (0.63 to 0.85) | 0.24 | 0.96 | 2.86 | 0.38 | 0.10 | 0.24 | 0.04 |
| Sjöstrand ED 2013 | 11 | 1 | 15 | 4 | 0.42 (0.23 to 0.63) | 0.80 (0.28 to 0.99) | 0.92 | 0.21 | 2.12 | 0.72 | 0.84 | 0.92 | 0.79 | |
| Sjöstrand Healthy 2013 | 3 | 0 | 7 | 3 | 0.30 (0.07 to 0.65) | 1.00 (0.29 to 1.00) | 1.00 | 0.30 | # | 0.7 | 0.77 | 1.00 | 0.70 | |
| 79) Lassitude | Kajii 2006 | 1 | 12 | 6 | 52 | 0.14 (0.00 to 0.58) | 0.81 (0.70 to 0.90) | 0.08 | 0.90 | 0.76 | 1.05 | 0.10 | 0.08 | 0.10 |
| 80) Feels dull | Kajii 2006 | 3 | 19 | 4 | 45 | 0.43 (0.10 to 0.82) | 0.70 (0.58 to 0.81) | 0.14 | 0.92 | 1.44 | 0.81 | 0.10 | 0.14 | 0.08 |
| 81) Dry oral mucosa: cheek | Chassagne 2006 | 59 | 2 | 182 | 47 | 0.24 (0.19 to 0.30) | 0.96 (0.86 to 1.00) | 0.97 | 0.21 | 6.00 | 0.79 | 0.83 | 0.97 | 0.79 |
| 82) Tongue furrows: ≥ mild | Kafri 2013 | 9 | 8 | 7 | 7 | 0.56 (0.30 to 0.80) | 0.47 (0.21 to 0.73) | 0.53 | 0.5 | 1.05 | 0.94 | 0.52 | 0.53 | 0.5 |
| 83) Tongue furrows: ≥ moderate | Kafri 2013 | 3 | 1 | 13 | 14 | 0.19 (0.04 to 0.46) | 0.93 (0.68 to 1.00) | 0.75 | 0.52 | 2.81 | 0.87 | 0.52 | 0.75 | 0.48 |
| 84) Tongue furrows: ≥ severe | Kafri 2013 | 1 | 0 | 15 | 15 | 0.06 (0.00 to 0.30) | 1.00 (0.78 to 1.00) | 1 | 0.5 | # | 0.94 | 0.52 | 1 | 0.5 |
| 85) Tongue dry: ≥ mild | Kafri 2013 | 9 | 6 | 7 | 9 | 0.56 (0.30 to 0.80) | 0.60 (0.32 to 0.84) | 0.6 | 0.56 | 1.41 | 0.73 | 0.52 | 0.6 | 0.44 |
| 86) Tongue dry: ≥ moderate | Kafri 2013 | 4 | 1 | 12 | 14 | 0.25 (0.07 to 0.52) | 0.93 (0.68 to 1.00) | 0.8 | 0.54 | 3.75 | 0.80 | 0.52 | 0.8 | 0.46 |
| 87) Tongue dry: severe | Kafri 2013 | 1 | 0 | 15 | 15 | 0.06 (0.00 to 0.30) | 1.00 (0.78 to 1.00) | 1 | 0.5 | # | 0.94 | 0.52 | 1 | 0.5 |
| 88) BIA resistance 50 kHz: ≥ 550 ohm | Allison 2005 | 4 | 0 | 1 | 10 | 0.80 (0.28 to 0.99) | 1.00 (0.69 to 1.00) | 1 | 0.909 | # | 0.2 | 0.333 | 1 | 0.090 |
| Kafri 2013 | 3 | 0 | 10 | 8 | 0.23 (0.05 to 0.54) | 1.00 (0.63 to 1.00) | 1.00 | 0.44 | # | 0.77 | 0.62 | 1.00 | 0.56 | |
| Powers 2012 | 3 | 0 | 14 | 5 | 0.18 (0.04 to 0.43) | 1.00 (0.48 to 1.00) | 1.00 | 0.26 | # | 0.82 | 0.77 | 1.00 | 0.74 | |
| Stookey 2005 | 21 | 727 | 49 | 1150 | 0.30 (0.20 to 0.42) | 0.61 (0.59 to 0.63) | 0.03 | 0.96 | 0.77 | 1.14 | 0.04 | 0.03 | 0.04 | |
| 89) BIA resistance 50 kHz: ≥ 450 ohm | Allison 2005 | 5 | 0 | 0 | 10 | 1.00 (0.48 to 1.00) | 1.00 (0.69 to 1.00) | 1 | 1 | # | 0 | 0.33 | 1 | 0 |
| Kafri 2013 | 7 | 4 | 6 | 4 | 0.54 (0.25 to 0.81) | 0.50 (0.16 to 0.84) | 0.64 | 0.40 | 1.08 | 0.92 | 0.62 | 0.64 | 0.60 | |
| Powers 2012 | 12 | 1 | 5 | 4 | 0.71 (0.44 to 0.90) | 0.80 (0.28 to 0.99) | 0.92 | 0.44 | 3.53 | 0.37 | 0.77 | 0.92 | 0.56 | |
| Stookey 2005 | 48 | 1518 | 22 | 359 | 0.69 (0.56 to 0.79) | 0.19 (0.17 to 0.21) | 0.03 | 0.94 | 0.85 | 1.64 | 0.04 | 0.03 | 0.06 | |
| 90) BIA resistance 50 kHz: ≥ 350 ohm | Allison 2005 | 5 | 5 | 0 | 5 | 1.00 (0.48 to 1.00) | 0.50 (0.19 to 0.81) | 0.5 | 1 | 2 | 0 | 0.33 | 0.5 | 0 |
| Kafri 2013 | 9 | 7 | 4 | 1 | 0.69 (0.39 to 0.91) | 0.13 (0.00 to 0.53) | 0.56 | 0.20 | 0.79 | 2.46 | 0.62 | 0.56 | 0.80 | |
| Powers 2012 | 15 | 2 | 2 | 3 | 0.88 (0.64 to 0.99) | 0.60 (0.15 to 0.95) | 0.88 | 0.60 | 2.21 | 0.20 | 0.77 | 0.88 | 0.40 | |
| Stookey 2005 | 69 | 1859 | 1 | 18 | 0.99 (0.92 to 1.00) | 0.01 (0.01 to 0.02) | 0.04 | 0.95 | 1.00 | 1.49 | 0.04 | 0.04 | 0.05 | |
| 91) BIA resistance 100 kHz: ≥ 550 ohm | Kafri 2013 | 2 | 0 | 11 | 8 | 0.15 (0.02 to 0.45) | 1.00 (0.63 to 1.00) | 1.00 | 0.42 | # | 0.85 | 0.62 | 1.00 | 0.58 |
| 92) BIA resistance 100 kHz: ≥ 450 ohm | Kafri 2013 | 6 | 3 | 7 | 5 | 0.46 (0.19 to 0.75) | 0.63 (0.24 to 0.91) | 0.67 | 0.42 | 1.23 | 0.86 | 0.62 | 0.67 | 0.58 |
| 93) BIA resistance 100 kHz: ≥ 350 ohm | Kafri 2013 | 9 | 7 | 4 | 1 | 0.69 (0.39 to 0.91) | 0.13 (0.00 to 0.53) | 0.56 | 0.20 | 0.79 | 2.46 | 0.62 | 0.56 | 0.80 |
| 94) BIA resistance 200 kHz: ≥ 550 ohm | Kafri 2013 | 1 | 0 | 12 | 8 | 0.08 (0.00 to 0.36) | 1.00 (0.63 to 1.00) | 1.00 | 0.40 | # | 0.92 | 0.62 | 1.00 | 0.60 |
| 95) BIA resistance 200 kHz to ≥ 450 ohm | Kafri 2013 | 6 | 0 | 7 | 8 | 0.46 (0.19 to 0.75) | 1.00 (0.63 to 1.00) | 1.00 | 0.53 | # | 0.54 | 0.62 | 1.00 | 0.47 |
| 96) BIA resistance 200 kHz: ≥ 350 ohm | Kafri 2013 | 8 | 6 | 5 | 2 | 0.62 (0.32 to 0.86) | 0.25 (0.03 to 0.65) | 0.57 | 0.29 | 0.82 | 1.54 | 0.62 | 0.57 | 0.71 |
| 97) BIA TBW: < 45% | Culp 2003 | 59 | 12 | 186 | 51 | 0.24 (0.19 to 0.30) | 0.81 (0.69 to 0.90) | 0.83 | 0.22 | 1.26 | 0.94 | 0.80 | 0.83 | 0.79 |
| Gaspar 2011a | 2 | 20 | 1 | 5 | 0.67 (0.09 to 0.99) | 0.20 (0.07 to 0.41) | 0.09 | 0.83 | 0.83 | 1.67 | 0.11 | 0.09 | 0.17 | |
| Kafri 2013 | 2 | 1 | 11 | 7 | 0.15 (0.02 to 0.45) | 0.88 (0.47 to 1.00) | 0.67 | 0.39 | 1.23 | 0.97 | 0.62 | 0.67 | 0.61 | |
| Powers 2012 | 4 | 0 | 13 | 5 | 0.24 (0.07 to 0.50) | 1.00 (0.48 to 1.00) | 1.00 | 0.28 | # | 0.77 | 0.77 | 1.00 | 0.72 | |
| Stookey 2005 | 26 | 692 | 44 | 1184 | 0.37 (0.26 to 0.50) | 0.63 (0.61 to 0.65) | 0.04 | 0.96 | 1.01 | 1.00 | 0.04 | 0.04 | 0.04 | |
| 98) BIA TBW: < 47% | Culp 2003 | 85 | 18 | 160 | 45 | 0.35 (0.29 to 0.41) | 0.71 (0.59 to 0.82) | 0.83 | 0.22 | 1.21 | 0.91 | 0.80 | 0.83 | 0.78 |
| Gaspar 2011a | 3 | 22 | 0 | 3 | 1.00 (0.29 to 1.00) | 0.12 (0.03 to 0.31) | 0.12 | 1 | 1.14 | 0 | 0.11 | 0.12 | 0 | |
| Kafri 2013 | 2 | 1 | 11 | 7 | 0.15 (0.02 to 0.45) | 0.88 (0.47 to 1.00) | 0.67 | 0.39 | 1.23 | 0.97 | 0.62 | 0.67 | 0.61 | |
| Powers 2012 | 5 | 1 | 12 | 4 | 0.29 (0.10 to 0.56) | 0.80 (0.28 to 0.99) | 0.83 | 0.25 | 1.47 | 0.88 | 0.77 | 0.83 | 0.75 | |
| Stookey 2005 | 31 | 914 | 39 | 962 | 0.44 (0.32 to 0.57) | 0.51 (0.49 to 0.54) | 0.03 | 0.96 | 0.91 | 1.09 | 0.04 | 0.03 | 0.04 | |
| 99) BIA TBW: < 49% | Culp 2003 | 107 | 23 | 138 | 40 | 0.44 (0.37 to 0.50) | 0.63 (0.50 to 0.75) | 0.82 | 0.23 | 1.20 | 0.89 | 0.80 | 0.82 | 0.78 |
| Gaspar 2011a | 3 | 23 | 0 | 2 | 1.00 (0.29 to 1.00) | 0.08 (0.01 to 0.26) | 0.12 | 1 | 1.09 | 0 | 0.11 | 0.12 | 0 | |
| Kafri 2013 | 7 | 1 | 6 | 7 | 0.54 (0.25 to 0.81) | 0.88 (0.47 to 1.00) | 0.88 | 0.54 | 4.31 | 0.53 | 0.62 | 0.88 | 0.46 | |
| Powers 2012 | 6 | 1 | 11 | 4 | 0.35 (0.14 to 0.62) | 0.80 (0.28 to 0.99) | 0.86 | 0.27 | 1.77 | 0.81 | 0.77 | 0.86 | 0.73 | |
| Stookey 2005 | 43 | 1112 | 27 | 764 | 0.61 (0.49 to 0.73) | 0.41 (0.38 to 0.43) | 0.04 | 0.97 | 1.04 | 0.95 | 0.04 | 0.04 | 0.03 | |
| 100) BIA ICW: < 25% | Culp 2003 | 140 | 29 | 105 | 34 | 0.57 (0.51 to 0.63) | 0.54 (0.41 to 0.67) | 0.83 | 0.25 | 1.24 | 0.79 | 0.80 | 0.83 | 0.76 |
| Gaspar 2011a | 3 | 22 | 0 | 3 | 1.00 (0.29 to 1.00) | 0.12 (0.03 to 0.31) | 0.12 | 1 | 1.14 | 0 | 0.11 | 0.12 | 0 | |
| Kafri 2013 | 5 | 1 | 8 | 7 | 0.38 (0.14 to 0.68) | 0.88 (0.47 to 1.00) | 0.83 | 0.47 | 3.08 | 0.70 | 0.62 | 0.83 | 0.53 | |
| Powers 2012 | 5 | 1 | 12 | 4 | 0.29 (0.10 to 0.56) | 0.80 (0.28 to 0.99) | 0.83 | 0.25 | 1.47 | 0.88 | 0.77 | 0.83 | 0.75 | |
| 101) BIA ICW: < 27% | Culp 2003 | 180 | 41 | 65 | 22 | 0.73 (0.67 to 0.79) | 0.35 (0.23 to 0.48) | 0.81 | 0.25 | 1.13 | 0.76 | 0.80 | 0.81 | 0.75 |
| Gaspar 2011a | 3 | 23 | 0 | 2 | 1.00 (0.29 to 1.00) | 0.08 (0.01 to 0.26) | 0.12 | 1 | 1.09 | 0 | 0.11 | 0.12 | 0 | |
| Kafri 2013 | 7 | 2 | 6 | 6 | 0.54 (0.25 to 0.81) | 0.75 (0.35 to 0.97) | 0.78 | 0.50 | 2.15 | 0.62 | 0.62 | 0.78 | 0.50 | |
| Powers 2012 | 9 | 1 | 8 | 4 | 0.53 (0.28 to 0.77) | 0.80 (0.28 to 0.99) | 0.90 | 0.33 | 2.65 | 0.59 | 0.77 | 0.90 | 0.67 | |
| 102) BIA ICW: < 29% | Culp 2003 | 200 | 48 | 45 | 15 | 0.82 (0.76 to 0.86) | 0.24 (0.14 to 0.36) | 0.81 | 0.25 | 1.07 | 0.77 | 0.80 | 0.81 | 0.75 |
| Gaspar 2011a | 3 | 24 | 0 | 1 | 1.00 (0.29 to 1.00) | 0.04 (0.00 to 0.20) | 0.11 | 1 | 1.04 | 0 | 0.11 | 0.11 | 0 | |
| Kafri 2013 | 9 | 5 | 4 | 3 | 0.69 (0.39 to 0.91) | 0.38 (0.09 to 0.76) | 0.64 | 0.43 | 1.11 | 0.82 | 0.62 | 0.64 | 0.57 | |
| Powers 2012 | 10 | 2 | 7 | 3 | 0.59 (0.33 to 0.82) | 0.60 (0.15 to 0.95) | 0.83 | 0.30 | 1.47 | 0.69 | 0.77 | 0.83 | 0.70 | |
| 103) BIA ECW: < 18% | Culp 2003 | 3 | 1 | 242 | 62 | 0.01 (0.00 to 0.04) | 0.98 (0.91 to 1.00) | 0.75 | 0.20 | 0.77 | 1.00 | 0.80 | 0.75 | 0.80 |
| Gaspar 2011a | 1 | 5 | 2 | 20 | 0.33 (0.01 to 0.91) | 0.80 (0.59 to 0.93) | 0.17 | 0.91 | 1.67 | 0.83 | 0.11 | 0.17 | 0.09 | |
| Kafri 2013 | 0 | 0 | 13 | 8 | 0.00 (0.00 to 0.25) | 1.00 (0.63 to 1.00) | # | 0.38 | # | 1.00 | 0.62 | # | 0.62 | |
| Powers 2012 | 0 | 0 | 17 | 5 | 0.00 (0.00 to 0.20) | 1.00 (0.48 to 1.00) | # | 0.23 | # | 1.00 | 0.77 | # | 0.77 | |
| 104) BIA ECW: < 20% | Culp 2003 | 8 | 2 | 237 | 61 | 0.03 (0.01 to 0.06) | 0.97 (0.89 to 1.00) | 0.8 | 0.21 | 1.03 | 1.00 | 0.80 | 0.8 | 0.80 |
| Gaspar 2011a | 1 | 12 | 2 | 13 | 0.33 (0.01 to 0.91) | 0.52 (0.31 to 0.72) | 0.08 | 0.87 | 0.69 | 1.28 | 0.11 | 0.08 | 0.138 | |
| Kafri 2013 | 1 | 0 | 12 | 8 | 0.08 (0.00 to 0.36) | 1.00 (0.63 to 1.00) | 1.00 | 0.40 | # | 0.92 | 0.62 | 1.00 | 0.60 | |
| Powers 2012 | 1 | 0 | 16 | 5 | 0.06 (0.00 to 0.29) | 1.00 (0.48 to 1.00) | 1.00 | 0.24 | # | 0.94 | 0.77 | 1.00 | 0.76 | |
| 105) BIA ECW: < 22% | Culp 2003 | 26 | 4 | 219 | 59 | 0.11 (0.07 to 0.15) | 0.94 (0.85 to 0.98) | 0.87 | 0.21 | 1.67 | 0.95 | 0.80 | 0.87 | 0.79 |
| Gaspar 2011a | 1 | 16 | 2 | 9 | 0.33 (0.01 to 0.91) | 0.36 (0.18 to 0.57) | 0.06 | 0.82 | 0.52 | 1.85 | 0.11 | 0.06 | 0.18 | |
| Kafri 2013 | 2 | 1 | 11 | 7 | 0.15 (0.02 to 0.45) | 0.88 (0.47 to 1.00) | 0.67 | 0.39 | 1.23 | 0.97 | 0.62 | 0.67 | 0.61 | |
| Powers 2012 | 3 | 2 | 14 | 3 | 0.18 (0.04 to 0.43) | 0.60 (0.15 to 0.95) | 0.60 | 0.18 | 0.44 | 1.37 | 0.77 | 0.60 | 0.82 | |
| 106) Insufficient tears | Fortes 2011 | 3 | 4 | 24 | 74 | 0.11 (0.02 to 0.29) | 0.95 (0.87 to 0.99) | 0.43 | 0.76 | 2.17 | 0.94 | 0.26 | 0.43 | 0.25 |
| 107) Insufficient tears or not tolerated | Fortes 2011 | 7 | 9 | 20 | 69 | 0.26 (0.11 to 0.46) | 0.88 (0.79 to 0.95) | 0.44 | 0.78 | 2.25 | 0.84 | 0.26 | 0.44 | 0.23 |
| 108) Oral thickener used | Stotts 2009 | 6 | 5 | 24 | 13 | 0.20 (0.08 to 0.39) | 0.72 (0.47 to 0.90) | 0.55 | 0.35 | 0.72 | 1.11 | 0.63 | 0.55 | 0.65 |
| 109) Oral fluid without thickener | Stotts 2009 | 17 | 8 | 13 | 10 | 0.57 (0.37 to 0.75) | 0.56 (0.31 to 0.78) | 0.68 | 0.43 | 1.28 | 0.78 | 0.63 | 0.68 | 0.57 |
| 110) Lips dry | Kajii 2006 | 0 | 20 | 7 | 44 | 0.00 (0.00 to 0.41) | 0.69 (0.56 to 0.80) | 0 | 0.86 | 0 | 1.45 | 0.10 | 0 | 0.14 |
| 111) Dry mouth: severe | Sjöstrand Healthy 2013 | 1 | 0 | 9 | 3 | 0.10 (0.00 to 0.45) | 1.00 (0.29 to 1.00) | 1 | 0.25 | # | 0.90 | 0.77 | 1.00 | 0.75 |
| Sjöstrand ED 2013 | 2 | 1 | 24 | 4 | 0.08 (0.01 to 0.25) | 0.80 (0.28 to 0.99) | 0.67 | 0.14 | 0.38 | 1.15 | 0.84 | 0.67 | 0.86 | |
| 112) Dry mouth: severe or moderate | Sjöstrand Healthy 2013 | 3 | 1 | 7 | 2 | 0.30 (0.07 to 0.65) | 0.67 (0.09 to 0.99) | 0.75 | 0.22 | 0.9 | 1.05 | 0.77 | 0.75 | 0.78 |
| Sjöstrand ED 2013 | 4 | 1 | 22 | 4 | 0.15 (0.04 to 0.35) | 0.80 (0.28 to 0.99) | 0.80 | 0.15 | 0.77 | 1.06 | 0.84 | 0.80 | 0.85 | |
| 113) Dry mouth | Chassagne 2006 | 65 | 6 | 174 | 43 | 0.27 (0.22 to 0.33) | 0.88 (0.75 to 0.95) | 0.92 | 0.20 | 2.2 | 0.83 | 0.83 | 0.92 | 0.80 |
| Kajii 2006 | 1 | 24 | 6 | 40 | 0.14 (0.00 to 0.58) | 0.63 (0.50 to 0.74) | 0.04 | 0.87 | 0.38 | 1.37 | 0.10 | 0.04 | 0.13 | |
| McGarvey 2010 | 3 | 3 | 0 | 5 | 1.00 (0.29 to 1.00) | 0.63 (0.24 to 0.91) | 0.5 | 1 | 2.67 | 0 | 0.27 | 0.5 | 0 | |
| Rowat 2011 | 9 | 2 | 5 | 2 | 0.64 (0.35 to 0.87) | 0.50 (0.07 to 0.93) | 0.82 | 0.29 | 1.29 | 0.71 | 0.78 | 0.82 | 0.71 | |
| Sjöstrand ED 2013 | 11 | 1 | 15 | 4 | 0.42 (0.23 to 0.63) | 0.80 (0.28 to 0.99) | 0.92 | 0.21 | 2.12 | 0.72 | 0.84 | 0.92 | 0.79 | |
| Sjöstrand Healthy 2013 | 4 | 2 | 6 | 1 | 0.40 (0.12 to 0.74) | 0.33 (0.01 to 0.91) | 0.67 | 0.14 | 0.60 | 1.80 | 0.77 | 0.67 | 0.86 | |
| Source Study 2000 | 20 | 13 | 91 | 40 | 0.18 (0.11 to 0.26) | 0.75 (0.62 to 0.86) | 0.61 | 0.31 | 0.73 | 1.09 | 0.68 | 0.61 | 0.69 | |
| Shimizu 2012 | 5 | 7 | 4 | 11 | 0.56 (0.21 to 0.86) | 0.61 (0.36 to 0.83) | 0.42 | 0.73 | 1.43 | 0.73 | 0.33 | 0.42 | 0.27 | |
| 114) Unable to spit | McGarvey 2010 | 0 | 0 | 3 | 8 | 0.00 (0.00 to 0.71) | 1.00 (0.63 to 1.00) | # | 0.73 | # | 1 | 0.27 | # | 0.27 |
| 115) Thirst: severe | Sjöstrand Healthy 2013 | 1 | 0 | 9 | 3 | 0.10 (0.00 to 0.45) | 1.00 (0.29 to 1.00) | 1.00 | 0.25 | # | 0.90 | 0.77 | 1.00 | 0.75 |
| Sjöstrand ED 2013 | 1 | 0 | 25 | 5 | 0.04 (0.00 to 0.20) | 1.00 (0.48 to 1.00) | 1.00 | 0.17 | # | 0.96 | 0.84 | 1.00 | 0.83 | |
| Mack 1994 | 0 | 1 | 2 | 7 | 0.00 (0.00 to 0.84) | 0.88 (0.47 to 1.00) | 0 | 0.78 | 0 | 1.14 | 0.2 | 0 | 0.22 | |
| 116) Thirst: moderate or severe | Sjöstrand Healthy 2013 | 4 | 2 | 6 | 1 | 0.40 (0.12 to 0.74) | 0.33 (0.01 to 0.91) | 0.67 | 0.14 | 0.60 | 1.80 | 0.77 | 0.67 | 0.86 |
| Sjöstrand ED 2013 | 5 | 1 | 21 | 4 | 0.19 (0.07 to 0.39) | 0.80 (0.28 to 0.99) | 0.83 | 0.16 | 0.96 | 1.01 | 0.84 | 0.83 | 0.84 | |
| Mack 1994 | 0 | 1 | 2 | 7 | 0.00 (0.00 to 0.84) | 0.88 (0.47 to 1.00) | 0 | 0.78 | 0 | 1.14 | 0.2 | 0 | 0.22 | |
| 117) Thirst VAS rating: mild | Mack 1994 | 1 | 6 | 1 | 2 | 0.50 (0.01 to 0.99) | 0.25 (0.03 to 0.65) | 0.14 | 0.67 | 0.67 | 2 | 0.2 | 0.14 | 0.33 |
| 118) Thirsty: any degree | Kajii 2006 | 2 | 24 | 5 | 40 | 0.29 (0.04 to 0.71) | 0.63 (0.50 to 0.74) | 0.08 | 0.89 | 0.76 | 1.14 | 0.10 | 0.08 | 0.11 |
| McGarvey 2010 | 1 | 2 | 2 | 6 | 0.33 (0.01 to 0.91) | 0.75 (0.35 to 0.97) | 0.33 | 0.75 | 1.33 | 0.89 | 0.27 | 0.33 | 0.25 | |
| Sjöstrand ED 2013 | 11 | 1 | 15 | 4 | 0.42 (0.23 to 0.63) | 0.80 (0.28 to 0.99) | 0.92 | 0.21 | 2.12 | 0.72 | 0.84 | 0.92 | 0.79 | |
| Sjöstrand Healthy 2013 | 5 | 2 | 5 | 1 | 0.50 (0.19 to 0.81) | 0.33 (0.01 to 0.91) | 0.71 | 0.17 | 0.75 | 1.50 | 0.77 | 0.71 | 0.83 | |
| Source Study 2000 | 12 | 5 | 99 | 48 | 0.11 (0.06 to 0.18) | 0.91 (0.79 to 0.97) | 0.71 | 0.33 | 1.15 | 0.98 | 0.68 | 0.71 | 0.67 | |
| 119) Tongue smarts | Kajii 2006 | 0 | 2 | 7 | 62 | 0.00 (0.00 to 0.41) | 0.97 (0.89 to 1.00) | 0 | 0.90 | 0 | 1.03 | 0.10 | 0 | 0.10 |
| 120) Mouth smarts | Kajii 2006 | 0 | 4 | 7 | 60 | 0.00 (0.00 to 0.41) | 0.94 (0.85 to 0.98) | 0 | 0.90 | 0 | 1.07 | 0.10 | 0 | 0.10 |
| 121) Sticky saliva | Kajii 2006 | 0 | 14 | 7 | 50 | 0.00 (0.00 to 0.41) | 0.78 (0.66 to 0.87) | 0 | 0.88 | 0 | 1.28 | 0.10 | 0 | 0.12 |
| 122) Sticky mouth | Kajii 2006 | 0 | 14 | 7 | 50 | 0.00 (0.00 to 0.41) | 0.78 (0.66 to 0.87) | 0 | 0.88 | 0 | 1.28 | 0.10 | 0 | 0.12 |
| 123) Blue lips | Rowat 2011 | 1 | 0 | 13 | 4 | 0.07 (0.00 to 0.34) | 1.00 (0.40 to 1.00) | 1 | 0.24 | # | 0.93 | 0.78 | 1 | 0.76 |
| 124) Sunken eyes | Rowat 2011 | 0 | 0 | 14 | 4 | 0.00 (0.00 to 0.23) | 1.00 (0.40 to 1.00) | # | 0.22 | # | 1 | 0.78 | # | 0.78 |
| Shimizu 2012 | 3 | 3 | 8 | 15 | 0.27 (0.06 to 0.61) | 0.83 (0.59 to 0.96) | 0.5 | 0.65 | 1.64 | 0.87 | 0.38 | 0.5 | 0.35 | |
| McGarvey 2010 | 0 | 3 | 3 | 5 | 0.00 (0.00 to 0.71) | 0.63 (0.24 to 0.91) | 0 | 0.63 | 0 | 1.6 | 0.27 | 0 | 0.38 | |
| 125) Bed sores | Source Study 2000 | 6 | 7 | 105 | 46 | 0.05 (0.02 to 0.11) | 0.87 (0.75 to 0.95) | 0.46 | 0.30 | 0.41 | 1.09 | 0.68 | 0.46 | 0.70 |
| 126) Swallowing problems | Kajii 2006 | 1 | 14 | 6 | 50 | 0.14 (0.00 to 0.58) | 0.78 (0.66 to 0.87) | 0.07 | 0.89 | 0.65 | 1.10 | 0.10 | 0.07 | 0.11 |
| 127) Enjoyment of food | Kajii 2006 | 2 | 62 | 0 | 7 | 1.00 (0.16 to 1.00) | 0.10 (0.04 to 0.20) | 0.03 | 1.00 | 1.11 | 0 | 0.03 | 0.03 | 0 |
| 128) Appetite | Kajii 2006 | 1 | 6 | 6 | 58 | 0.14 (0.00 to 0.58) | 0.91 (0.81 to 0.96) | 0.14 | 0.91 | 1.52 | 0.95 | 0.10 | 0.14 | 0.09 |
| 129) Dry eye severity by DEQ‐5: > 12 | Fortes 2011 | 1 | 8 | 25 | 70 | 0.04 (0.00 to 0.20) | 0.90 (0.81 to 0.95) | 0.11 | 0.74 | 0.38 | 1.07 | 0.25 | 0.11 | 0.26 |
| 130) Dry eye severity by DEQ‐5: > 6 | Fortes 2011 | 11 | 37 | 15 | 41 | 0.42 (0.23 to 0.63) | 0.53 (0.41 to 0.64) | 0.23 | 0.73 | 0.89 | 1.10 | 0.25 | 0.23 | 0.27 |
| 131) Dry eye severity by DEQ‐5: > 3 | Fortes 2011 | 17 | 49 | 9 | 29 | 0.65 (0.44 to 0.83) | 0.37 (0.26 to 0.49) | 0.26 | 0.76 | 1.04 | 0.93 | 0.25 | 0.26 | 0.24 |
| 132) Dry eye severity by VAS: > 5.0 cm | Fortes 2011 | 4 | 14 | 23 | 63 | 0.15 (0.04 to 0.34) | 0.82 (0.71 to 0.90) | 0.22 | 0.73 | 0.81 | 1.04 | 0.26 | 0.22 | 0.27 |
| 133) Dry eye severity by VAS: > 1.1 cm | Fortes 2011 | 9 | 39 | 18 | 38 | 0.33 (0.17 to 0.54) | 0.49 (0.38 to 0.61) | 0.19 | 0.68 | 0.66 | 1.35 | 0.26 | 0.19 | 0.32 |
| 134) Dry eye severity by VAS: > 0.6 cm | Fortes 2011 | 16 | 48 | 11 | 29 | 0.59 (0.39 to 0.78) | 0.38 (0.27 to 0.49) | 0.25 | 0.73 | 0.95 | 1.08 | 0.26 | 0.25 | 0.28 |
| 135) NITBUT: < 6 sec | Fortes 2011 | 5 | 20 | 22 | 57 | 0.19 (0.06 to 0.38) | 0.74 (0.63 to 0.83) | 0.2 | 0.72 | 0.71 | 1.10 | 0.26 | 0.2 | 0.28 |
| 136) NITBUT: < 10 sec | Fortes 2011 | 12 | 43 | 15 | 34 | 0.44 (0.25 to 0.65) | 0.44 (0.33 to 0.56) | 0.22 | 0.69 | 0.80 | 1.26 | 0.26 | 0.22 | 0.31 |
| 137) NITBUT: < 27 sec | Fortes 2011 | 24 | 70 | 3 | 7 | 0.89 (0.71 to 0.98) | 0.09 (0.04 to 0.18) | 0.26 | 0.70 | 0.98 | 1.22 | 0.26 | 0.26 | 0.30 |
| 138) Balance: severe | Sjöstrand Healthy 2013 | 0 | 0 | 10 | 3 | 0.00 (0.00 to 0.31) | 1.00 (0.29 to 1.00) | # | 0.23 | # | 1.00 | 0.77 | # | 0.77 |
| Sjöstrand ED 2013 | 2 | 0 | 24 | 5 | 0.08 (0.01 to 0.25) | 1.00 (0.48 to 1.00) | 1.00 | 0.17 | # | 0.92 | 0.84 | 1.00 | 0.83 | |
| 139) Balance: ≥ moderate | Sjöstrand Healthy 2013 | 0 | 1 | 10 | 2 | 0.00 (0.00 to 0.31) | 0.67 (0.09 to 0.99) | 0 | 0.17 | 0 | 1.50 | 0.77 | 0 | 0.83 |
| Sjöstrand ED 2013 | 6 | 0 | 20 | 5 | 0.23 (0.09 to 0.44) | 1.00 (0.48 to 1.00) | 1.00 | 0.20 | # | 0.77 | 0.84 | 1.00 | 0.80 | |
| 140) Balance: any degree | Sjöstrand Healthy 2013 | 1 | 1 | 9 | 2 | 0.10 (0.00 to 0.45) | 0.67 (0.09 to 0.99) | 0.50 | 0.18 | 0.30 | 1.35 | 0.77 | 0.50 | 0.82 |
| Sjöstrand ED 2013 | 9 | 1 | 17 | 4 | 0.35 (0.17 to 0.56) | 0.80 (0.28 to 0.99) | 0.90 | 0.19 | 1.73 | 0.82 | 0.84 | 0.90 | 0.81 | |
| 141) Headache: severe | Sjöstrand Healthy 2013 | 0 | 0 | 10 | 3 | 0.00 (0.00 to 0.31) | 1.00 (0.29 to 1.00) | # | 0.23 | # | 1.00 | 0.77 | # | 0.77 |
| Sjöstrand ED 2013 | 0 | 0 | 26 | 5 | 0.00 (0.00 to 0.13) | 1.00 (0.48 to 1.00) | # | 0.16 | # | 1.00 | 0.84 | # | 0.84 | |
| 142) Headache: ≥ moderate | Sjöstrand Healthy 2013 | 0 | 0 | 10 | 3 | 0.00 (0.00 to 0.31) | 1.00 (0.29 to 1.00) | # | 0.23 | # | 1.00 | 0.77 | # | 0.77 |
| Sjöstrand ED 2013 | 0 | 0 | 26 | 5 | 0.00 (0.00 to 0.13) | 1.00 (0.48 to 1.00) | # | 0.16 | # | 1.00 | 0.84 | # | 0.84 | |
| 143) Headache: any degree | Sjöstrand Healthy 2013 | 3 | 0 | 7 | 3 | 0.30 (0.07 to 0.65) | 1.00 (0.29 to 1.00) | 1.00 | 0.30 | # | 0.70 | 0.77 | 1.00 | 0.70 |
| Sjöstrand ED 2013 | 4 | 0 | 22 | 5 | 0.15 (0.04 to 0.35) | 1.00 (0.48 to 1.00) | 1.00 | 0.19 | # | 0.85 | 0.84 | 1.00 | 0.81 | |
| 144) Nausea: severe | Sjöstrand Healthy 2013 | 0 | 0 | 10 | 3 | 0.00 (0.00 to 0.31) | 1.00 (0.29 to 1.00) | # | 0.23 | # | 1.00 | 0.77 | # | 0.77 |
| Sjöstrand ED 2013 | 0 | 0 | 26 | 5 | 0.00 (0.00 to 0.13) | 1.00 (0.48 to 1.00) | # | 0.16 | # | 1.00 | 0.84 | # | 0.84 | |
| 145) Nausea: ≥ moderate | Sjöstrand Healthy 2013 | 0 | 0 | 10 | 3 | 0.00 (0.00 to 0.31) | 1.00 (0.29 to 1.00) | # | 0.23 | # | 1.00 | 0.77 | # | 0.77 |
| Sjöstrand ED 2013 | 0 | 0 | 26 | 5 | 0.00 (0.00 to 0.13) | 1.00 (0.48 to 1.00) | # | 0.16 | # | 1.00 | 0.84 | # | 0.84 | |
| 146) Nausea: any degree | Sjöstrand Healthy 2013 | 0 | 0 | 10 | 3 | 0.00 (0.00 to 0.31) | 1.00 (0.29 to 1.00) | # | 0.23 | # | 1.00 | 0.77 | # | 0.77 |
| Sjöstrand ED 2013 | 3 | 1 | 23 | 4 | 0.12 (0.02 to 0.30) | 0.80 (0.28 to 0.99) | 0.75 | 0.15 | 0.58 | 1.11 | 0.84 | 0.75 | 0.85 | |
| 147) Muscle weakness: severe | Sjöstrand Healthy 2013 | 0 | 0 | 10 | 3 | 0.00 (0.00 to 0.31) | 1.00 (0.29 to 1.00) | # | 0.23 | # | 1.00 | 0.77 | # | 0.77 |
| Sjöstrand ED 2013 | 1 | 0 | 25 | 5 | 0.04 (0.00 to 0.20) | 1.00 (0.48 to 1.00) | 1.00 | 0.17 | # | 0.96 | 0.84 | 1.00 | 0.83 | |
| 148) Muscle weakness: ≥ moderate | Sjöstrand Healthy 2013 | 1 | 1 | 9 | 2 | 0.10 (0.00 to 0.45) | 0.67 (0.09 to 0.99) | 0.50 | 0.18 | 0.30 | 1.35 | 0.77 | 0.50 | 0.82 |
| Sjöstrand ED 2013 | 1 | 1 | 25 | 4 | 0.04 (0.00 to 0.20) | 0.80 (0.28 to 0.99) | 0.50 | 0.14 | 0.19 | 1.20 | 0.84 | 0.50 | 0.86 | |
| 149) Muscle weakness: any degree | Sjöstrand Healthy 2013 | 1 | 1 | 9 | 2 | 0.10 (0.00 to 0.45) | 0.67 (0.09 to 0.99) | 0.50 | 0.18 | 0.30 | 1.35 | 0.77 | 0.50 | 0.82 |
| Sjöstrand ED 2013 | 6 | 1 | 20 | 4 | 0.23 (0.09 to 0.44) | 0.80 (0.28 to 0.99) | 0.86 | 0.17 | 1.15 | 0.96 | 0.84 | 0.86 | 0.83 | |
| 150) Dizziness: severe | Sjöstrand Healthy 2013 | 0 | 0 | 10 | 3 | 0.00 (0.00 to 0.31) | 1.00 (0.29 to 1.00) | # | 0.23 | # | 1.00 | 0.77 | # | 0.77 |
| Sjöstrand ED 2013 | 2 | 0 | 24 | 5 | 0.08 (0.01 to 0.25) | 1.00 (0.48 to 1.00) | 1.00 | 0.17 | # | 0.92 | 0.84 | 1.00 | 0.83 | |
| 151) Dizziness: ≥ moderate | Sjöstrand Healthy 2013 | 1 | 0 | 9 | 3 | 0.10 (0.00 to 0.45) | 1.00 (0.29 to 1.00) | 1.00 | 0.25 | # | 0.90 | 0.77 | 1.00 | 0.75 |
| Sjöstrand ED 2013 | 4 | 0 | 22 | 5 | 0.15 (0.04 to 0.35) | 1.00 (0.48 to 1.00) | 1.00 | 0.19 | # | 0.85 | 0.84 | 1.00 | 0.81 | |
| 152) Dizziness: any degree | Sjöstrand Healthy 2013 | 1 | 0 | 9 | 3 | 0.10 (0.00 to 0.45) | 1.00 (0.29 to 1.00) | 1.00 | 0.25 | # | 0.90 | 0.77 | 1.00 | 0.75 |
| Sjöstrand ED 2013 | 8 | 0 | 18 | 5 | 0.31 (0.14 to 0.52) | 1.00 (0.48 to 1.00) | 1.00 | 0.22 | # | 0.69 | 0.84 | 1.00 | 0.78 |
$ Water‐loss dehydration includes those with impending (serum osmolality 295 to 300 mOsm/kg) and current (serum osmolality > 300 mOsm/kg) dehydration
# ‐ incalculable; BIA ‐ bioelectrical impedance analysis; BPM ‐ beats per minute; DOR ‐ diagnostic odds ratio; ECW ‐ extracellular water; FP ‐ false positive; FN ‐ false negative; ICW ‐ intracellular water; MMSE ‐ mini‐mental state exam; Neecham ‐ Neecham confusion scale; NITBUT ‐ non‐invasive tear film breakup time; NLR ‐ negative likelihood ratio; NPV negative predictive value; PLR positive likelihood ratio; PPV ‐ positive predictive value; T+ ‐ positive test result, T‐ = negative test result, TP ‐ true positive; TN ‐ true negative; TBW ‐ total body water; USG ‐ urine specific gravity; VAS ‐ visual analogue scale
Kajii 2006 included 71 frail elderly Japanese people living at home, mean age 76 years, 63% women. The reference standard used was serum osmolality (directly measured) and all other methodological quality indicators where high (indicating low risk of bias) except that it was unclear whether recruitment (which took place from a community centre) was consecutive or random. This study provides high quality evidence of the diagnostic utility of missing drinks between meals and of expressing fatigue; however, missing drinks between meals has not been tested in any other studies.
Missing drinks between meals was assessed by participants being asked how much water they drank between breakfast and lunch, between lunch and dinner, and between dinner and next breakfast, they were scored as missing drinks between meals if they answered "none" to any of these questions. Fatigue was assessed in the answer to the question "do you feel fatigue?" (yes or no were allowed as answers).
Expressing fatigue was tested in two further studies (Sjöstrand ED 2013; Sjöstrand Healthy 2013). Sjöstrand Healthy 2013 recruited 13 elderly volunteers from Sweden, mean age 81 years, 54% women. Sjöstrand ED 2013 included 40 elderly people attending the emergency department of a tertiary care centre in Sweden, mean age 84 years, 58% women. The reference standard for both studies was serum osmolality (directly measured), and again, all other methodological quality indicators were met (indicating low risk of bias) except for representative spectrum. This was because it was unclear whether consecutive or random recruitment took place in either study, and the emergency department‐based study did not recruit from the community.
We identified four studies that assessed BIA resistance at 50 kHz; their validity was more variable. The reference standard was serum osmolality (directly measured) for Kafri 2013 and Stookey 2005, serum osmolarity (calculated) for Allison 2005 and Powers 2012.
Validity concerns for the Allison 2005 study included that only 22/1225 care home residents discussed (age and gender balance not reported) were represented in the data (without explanation), partial verification appeared to be a problem (in that not everyone receiving the index tests also received the reference standard; de Groot 2011), there appeared to be a delay of up to three months between the reference standard and index tests (a problem in a condition as fast‐changing as dehydration), and that it did not appear free of commercial funding.
Powers 2012 (which also suggested appropriate sensitivity and specificity for BIA resistance at 50 kHz) included 22 USA geriatric facility inpatients and outpatients, mean age 79 years, 64% women. For this study all reference and index tests were conducted on the same day, partial verification was not dealt with, withdrawals were explained, and the study appeared free of commercial funding.
Kafri 2013 included 21 people hospitalised following a stroke in the UK, mean age 78 years, 35% women. All reference and index tests were conducted on the same day, although not always within two hours, partial verification was not a problem, withdrawals were explained, and the study was partly funded by the European Hydration Institute.
Stookey 2005 included 1947 older people as part of a nationally representative USA sample (National Health and Nutrition Examination Survey or NHANES), mean age 75 years, 51% women. The index and reference standard were carried out at a single interview, partial verification was not a problem, withdrawals were explained and the study was free of commercial funding.
While there is an indication of some level of diagnostic accuracy for BIA resistance at 50 kHz this was not confirmed by the largest and highest validity study, Stookey 2005. Potential sources of heterogeneity among studies, aside from validity, included differing baseline prevalence of dehydration (varying from 4% in Stookey 2005 to 77% in Powers 2012, effect of prevalence discussed in Leeflang 2013) and general health (the studies included the general public, care home residents, geriatric unit inpatients and outpatients and people in hospital following a stroke).
We planned to explore sources of heterogeneity of diagnostic accuracy of individual clinical symptoms, signs and tests that show some evidence of discrimination by the reference standard used, cut‐off value for tests providing continuous data, type of participants (community‐dwelling older people, those in residential care, and those in hospital), sex, and baseline prevalence of dehydration, however there were no groups of studies with appropriate levels of accuracy within which to explore any heterogeneity.
Because a study was published during the conduct of this review that suggested body weight fluctuations of over 3% in well hydrated hospitalised elderly patients (Vivanti 2013) we questioned the validity of weight change as a reference standard. For this reason we examined the diagnostic accuracy of the tests reported by the three studies that used weight change as a reference standard (McGarvey 2010; Monahan 2006; Perren 2011). Where these clinical symptoms, signs and tests were assessed by more than one study in no case did the study using weight change as the reference standard stand out in suggesting dramatically better or worse diagnostic accuracy. Being unable to spit was the only test examined only in a study using weight change as the reference standard ‐ this did not suggest any useful diagnostic accuracy, but should be re‐checked against serum osmolality.
Meta‐analyses were conducted for tests with at least four studies contributing data. These tests were fluid intake, urine volume, fluid balance, USG, urine colour, urine osmolality, heart rate, BIA resistance at 50 kHz, TBW, ICW and ECW as percentages of body weight, dry mouth and thirst (Table 3). For no meta‐analyses and no cut‐offs were the point estimates of the sensitivity ≥ 60% and specificity ≥ 75%. The most encouraging was a meta‐analysis run for BIA resistance at 50 kHz with a cut‐off of ≥450 ohm, suggesting a sensitivity of 73% (57% to 84%) and specificity of 70% (18% to 96%). As with all the meta‐analysis results the confidence intervals were very wide reflecting small studies and heterogeneity in results.
ROC plots for water‐loss dehydration (serum osmolality ≥ 295 mOsm/kg or equivalent); post‐hoc analyses
Data for several index tests suggested that there was a potential cut‐off with sufficient sensitivity and specificity if we used higher, lower or intermediate cut‐offs, so these post‐hoc analyses were carried out, and ROC plots shown, for drinks and fluid intake (Figure 3), USG and colour (Figure 4), urine osmolality and output volume (Figure 5), signs including axillial moisture, body temperature and skin turgor, and BIA resistance at 50 kHz (Figure 6), and BIA assessments of TBW, ECW and ICW as percentages of body weight (Figure 7). Most of these are shown for both impending and current dehydration, but to limit the number of figures the ROC plot for current dehydration was not shown for ECW or ICW (no point on either ROC curve fulfilled our criteria of ≥ 60% sensitivity and ≥ 75% specificity).
3.
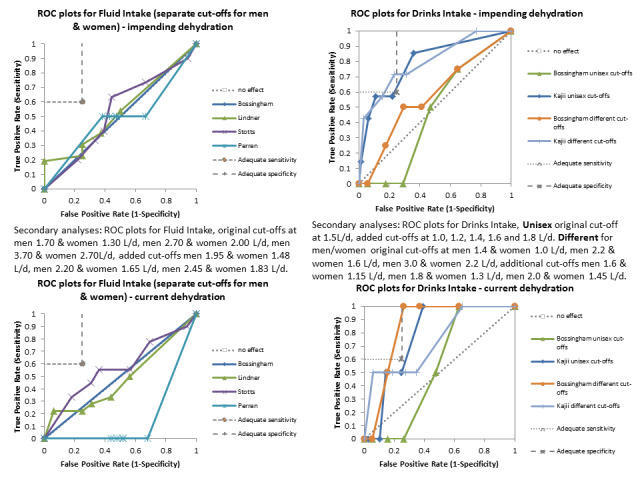
ROC plots for drinks intake and fluid intake, for impending and for current dehydration. Better diagnostic accuracy (with sensitivity of at least 60% and specificity of at least 85%) is represented by a line falling within the grey‐outlined oblong in the top left hand corner of each plot. For a clear introduction to the concepts of sensitivity, specificity, likelihood ratios and other measures, and interpretation of ROC plots see Linnet 2012 (downloadable from http://www.clinchem.org/content/early/2012/07/13/clinchem.2012.182543.full.pdf).
4.
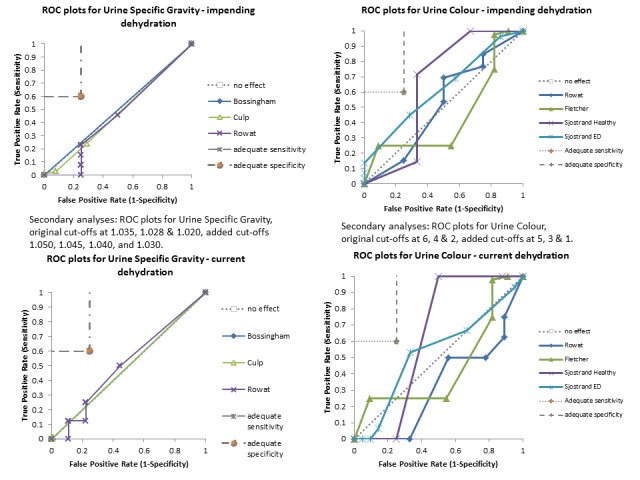
ROC plots for urine specific gravity and urine colour, for impending and for current dehydration. Better diagnostic accuracy (with sensitivity of at least 60% and specificity of at least 85%) is represented by a line falling within the grey‐outlined oblong in the top left hand corner of each plot. For a clear introduction to the concepts of sensitivity, specificity, likelihood ratios and other measures, and interpretation of ROC plots see Linnet 2012 (downloadable from http://www.clinchem.org/content/early/2012/07/13/clinchem.2012.182543.full.pdf).
5.
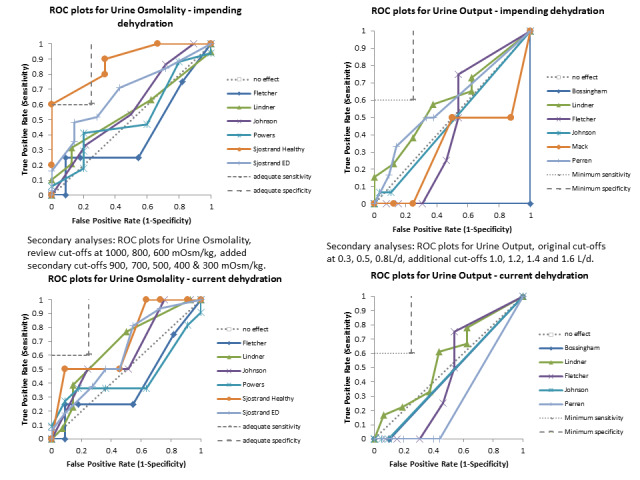
ROC plots for urine osmolality and urine output, for impending and for current dehydration. Better diagnostic accuracy (with sensitivity of at least 60% and specificity of at least 85%) is represented by a line falling within the grey‐outlined oblong in the top left hand corner of each plot. For a clear introduction to the concepts of sensitivity, specificity, likelihood ratios and other measures, and interpretation of ROC plots see Linnet 2012 (downloadable from http://www.clinchem.org/content/early/2012/07/13/clinchem.2012.182543.full.pdf).
6.
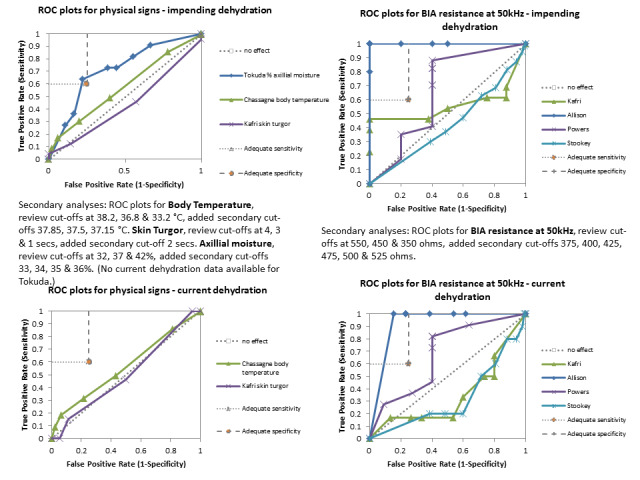
ROC plots for tests of dehydration and BIA resistance at 50kHz, for impending and for current dehydration. Better diagnostic accuracy (with sensitivity of at least 60% and specificity of at least 85%) is represented by a line falling within the grey‐outlined oblong in the top left hand corner of each plot. For a clear introduction to the concepts of sensitivity, specificity, likelihood ratios and other measures, and interpretation of ROC plots see Linnet 2012 (downloadable from http://www.clinchem.org/content/early/2012/07/13/clinchem.2012.182543.full.pdf).
7.
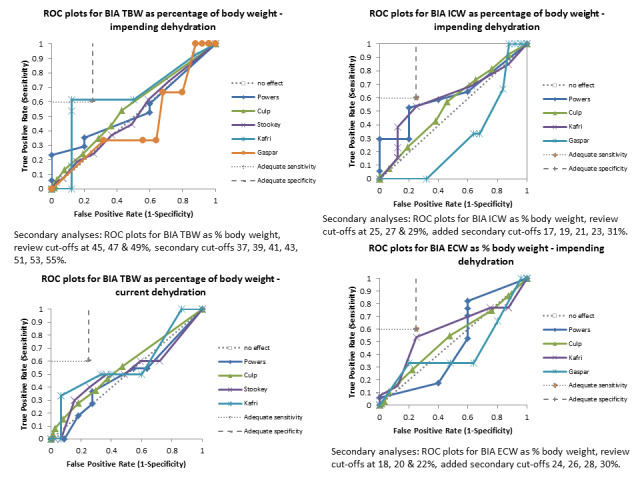
ROC plots for BIA total body water (TBW), intra‐cellular water (ICW) and extra‐cellular water (ECW) as % of body weight for impending dehydration and for BIA total body water as % body weight for current dehydration. Better diagnostic accuracy (with sensitivity of at least 60% and specificity of at least 85%) is represented by a line falling within the grey‐outlined oblong in the top left hand corner of each plot. For a clear introduction to the concepts of sensitivity, specificity, likelihood ratios and other measures, and interpretation of ROC plots see Linnet 2012 (downloadable from http://www.clinchem.org/content/early/2012/07/13/clinchem.2012.182543.full.pdf).
ROC plots appeared promising only for drinks intake, urine osmolality and axillial moisture (although neither quite reached the required sensitivity and specificity) and BIA resistance at 50 kHz, and BIA TBW assessment (although only one of the several studies curves reached the required sensitivity and specificity). However, it should be noted that as most studies are small the confidence intervals were very wide, so that ROC plots that appear to enter the rectangle of interest may not actually be as useful as they appear. Similarly, some plots that do not seem to enter the rectangle of interest may be more useful than they appear.
Adequate sensitivity and specificity for current dehydration (serum osmolality > 300 mOsm/kg or equivalent); secondary target condition
The diagnostic accuracy characteristics for current dehydration are shown in Table 5. The only test for which there was any suggestion of appropriate levels of sensitivity and specificity was BIA resistance at 50kHz at 450Ω, but this was only in one of the four studies that provided data (sensitivity was 1.00 [0.16, 1.00], specificity 0.77 [0.46, 0.95] in 15 people, Allison 2005, but sensitivity was 0.33 (95% CI 0.04 to 0.78], 0.73 (95% CI0.39 to 0.94), 0.60 (95% CI 0.26 to 0.88) and specificity 0.40 (95% CI 0.16 to 0.68), 0.45 (95% CI 0.17 to 0.77), 0.19 (95% CI 0.18 to 0.21) in Kafri 2013, Powers 2012 and Stookey 2005 respectively). Because almost no tests reported useful sensitivity and specificity in single studies, meta‐analysis was not felt to be appropriate.
4. Diagnostic accuracy of tests for current dehydration: cut‐off at 300 mOsm/kg$.
| Test | Studies | TP | FP | FN | TN | Sensitivity | Specificity | PPV | NPV | PLR | NLR | Pre‐test probability | Post‐test probability given T+ | Post‐test probability given T‐ |
| 1) Drinks intake: very low | Bossingham 2005 | 0 | 1 | 2 | 18 | 0.00 (0.00 to 0.84) | 0.95 (0.74 to 1.00) | 0 | 0.90 | 0 | 1.06 | 0.10 | 0 | 0.10 |
| Kajii 2006 | 1 | 4 | 1 | 65 | 0.50 (0.01 to 0.99) | 0.94 (0.86 to 0.98) | 0.20 | 0.98 | 8.62 | 0.53 | 0.03 | 0.2 | 0.02 | |
| 2) Drinks intake: low | Bossingham 2005 | 2 | 7 | 0 | 12 | 1.00 (0.16 to 1.00) | 0.63 (0.38 to 0.84) | 0.22 | 1.00 | 2.71 | 0 | 0.10 | 0.22 | 0 |
| Kajii 2006 | 1 | 24 | 1 | 45 | 0.50 (0.01 to 0.99) | 0.65 (0.53 to 0.76) | 0.04 | 0.98 | 1.44 | 0.77 | 0.03 | 0.04 | 0.02 | |
| 3) Drinks intake: moderate | Bossingham 2005 | 2 | 12 | 0 | 7 | 1.00 (0.16 to 1.00) | 0.37 (0.16 to 0.62) | 0.14 | 1.00 | 1.58 | 0 | 0.10 | 0.14 | 0 |
| Kajii 2006 | 2 | 54 | 0 | 15 | 1.00 (0.16 to 1.00) | 0.22 (0.13 to 0.33) | 0.04 | 1.00 | 1.28 | 0 | 0.03 | 0.04 | 0 | |
| 4) Drinks intake: standard | Bossingham 2005 | 0 | 5 | 2 | 14 | 0.00 (0.00 to 0.84) | 0.74 (0.49 to 0.91) | 0 | 0.88 | 0 | 1.36 | 0.10 | 0 | 0.13 |
| Kajii 2006 | 1 | 17 | 1 | 52 | 0.50 (0.01 to 0.99) | 0.75 (0.64 to 0.85) | 0.06 | 0.98 | 2.03 | 0.66 | 0.03 | 0.06 | 0.02 | |
| 5) Fluid intake: very low | Bossingham 2005 | 0 | 0 | 2 | 19 | 0.00 (0.00 to 0.84) | 1.00 (0.82 to 1.00) | # | 0.90 | # | 1.00 | 0.10 | # | 0.10 |
| Lindner 2009 | 4 | 1 | 14 | 15 | 0.22 (0.06 to 0.48) | 0.94 (0.70 to 1.00) | 0.80 | 0.52 | 3.56 | 0.83 | 0.53 | 0.80 | 0.48 | |
| Perren 2011 | 0 | 7 | 2 | 18 | 0.00 (0.00 to 0.84) | 0.72 (0.51 to 0.88) | 0 | 0.90 | 0 | 1.39 | 0.07 | 0 | 0.10 | |
| Stotts 2009 | 3 | 7 | 6 | 32 | 0.33 (0.07 to 0.70) | 0.82 (0.66 to 0.92) | 0.30 | 0.84 | 1.86 | 0.81 | 0.19 | 0.30 | 0.16 | |
| 6) Fluid intake: low | Stotts 2009 | 7 | 27 | 2 | 12 | 0.78 (0.40 to 0.97) | 0.31 (0.17 to 0.48) | 0.21 | 0.86 | 1.12 | 0.72 | 0.19 | 0.21 | 0.14 |
| Bossingham 2005 | 0 | 0 | 2 | 19 | 0.00 (0.00 to 0.84) | 1.00 (0.82 to 1.00) | # | 0.90 | # | 1.00 | 0.10 | # | 0.10 | |
| Lindner 2009 | 6 | 7 | 12 | 9 | 0.33 (0.13 to 0.59) | 0.56 (0.30 to 0.80) | 0.46 | 0.43 | 0.76 | 1.19 | 0.53 | 0.46 | 0.57 | |
| Perren 2011 | 0 | 12 | 2 | 13 | 0.00 (0.00 to 0.84) | 0.52 (0.31 to 0.72) | 0.00 | 0.87 | 0 | 1.92 | 0.07 | 0.00 | 0.13 | |
| 7) Fluid intake: moderate | Bossingham 2005 | 1 | 7 | 1 | 12 | 0.50 (0.01 to 0.99) | 0.63 (0.38 to 0.84) | 0.13 | 0.92 | 1.36 | 0.79 | 0.10 | 0.13 | 0.08 |
| Lindner 2009 | 9 | 9 | 9 | 7 | 0.50 (0.26 to 0.74) | 0.44 (0.20 to 0.70) | 0.50 | 0.44 | 0.89 | 1.14 | 0.53 | 0.50 | 0.56 | |
| Perren 2011 | 0 | 15 | 2 | 10 | 0.00 (0.00 to 0.84) | 0.40 (0.21 to 0.61) | 0 | 0.83 | 0.00 | 2.50 | 0.07 | 0 | 0.17 | |
| Stotts 2009 | 9 | 35 | 0 | 4 | 1.00 (0.66 to 1.00) | 0.10 (0.03 to 0.24) | 0.20 | 1.00 | 1.11 | 0 | 0.19 | 0.20 | 0 | |
| 8) Misses drinks between meals | Kajii 2006 | 2 | 20 | 0 | 49 | 1.00 (0.16 to 1.00) | 0.71 (0.59 to 0.81) | 0.09 | 1.00 | 3.45 | 0 | 0.03 | 0.09 | 0 |
| 9) Misses drinks at meals | Kajii 2006 | 0 | 3 | 2 | 66 | 0.00 (0.00 to 0.84) | 0.96 (0.88 to 0.99) | 0 | 0.97 | 0 | 1.05 | 0.03 | 0 | 0.03 |
| 10) Urine volume: < 300 mL/d | Bossingham 2005 | 0 | 0 | 2 | 19 | 0.00 (0.00 to 0.84) | 1.00 (0.82 to 1.00) | # | 0.90 | # | 1.00 | 0.10 | # | 0.10 |
| Fletcher 1999 | 0 | 0 | 4 | 13 | 0.00 (0.00 to 0.60) | 1.00 (0.75 to 1.00) | # | 0.76 | # | 1.00 | 0.24 | # | 0.24 | |
| Johnson 2003 | 0 | 0 | 2 | 41 | 0.00 (0.00 to 0.84) | 1.00 (0.91 to 1.00) | # | 0.95 | # | 1.00 | 0.05 | # | 0.05 | |
| Lindner 2009 | 3 | 1 | 15 | 15 | 0.17 (0.04 to 0.41) | 0.94 (0.70 to 1.00) | 0.75 | 0.50 | 2.67 | 0.89 | 0.53 | 0.75 | 0.50 | |
| Perren 2011 | 0 | 9 | 2 | 16 | 0.00 (0.00 to 0.84) | 0.64 (0.43 to 0.82) | 0 | 0.89 | 0 | 1.56 | 0.07 | 0 | 0.11 | |
| 11) Urine volume: < 500 mL/d | Bossingham 2005 | 0 | 0 | 2 | 19 | 0.00 (0.00 to 0.84) | 1.00 (0.82 to 1.00) | # | 0.90 | # | 1.00 | 0.10 | # | 0.10 |
| Fletcher 1999 | 0 | 1 | 4 | 12 | 0.00 (0.00 to 0.60) | 0.92 (0.64 to 1.00) | 0 | 0.75 | 0 | 1.08 | 0.24 | 0 | 0.25 | |
| Johnson 2003 | 0 | 0 | 2 | 41 | 0.00 (0.00 to 0.84) | 1.00 (0.91 to 1.00) | # | 0.95 | # | 1.00 | 0.05 | # | 0.05 | |
| Lindner 2009 | 4 | 3 | 14 | 13 | 0.22 (0.06 to 0.48) | 0.81 (0.54 to 0.96) | 0.57 | 0.48 | 1.19 | 0.96 | 0.53 | 0.57 | 0.52 | |
| Perren 2011 | 0 | 12 | 2 | 13 | 0.00 (0.00 to 0.84) | 0.52 (0.31 to 0.72) | 0 | 0.87 | 0 | 1.92 | 0.07 | 0 | 0.13 | |
| 12) Urine volume: < 800 mL/d | Bossingham 2005 | 0 | 0 | 2 | 19 | 0.00 (0.00 to 0.84) | 1.00 (0.82 to 1.00) | # | 0.90 | # | 1.00 | 0.10 | # | 0.10 |
| Fletcher 1999 | 0 | 2 | 4 | 11 | 0.00 (0.00 to 0.60) | 0.85 (0.55 to 0.98) | 0 | 0.73 | 0 | 1.18 | 0.24 | 0 | 0.27 | |
| Johnson 2003 | 0 | 0 | 2 | 41 | 0.00 (0.00 to 0.84) | 1.00 (0.91 to 1.00) | # | 0.95 | # | 1.00 | 0.05 | # | 0.05 | |
| Lindner 2009 | 6 | 7 | 12 | 9 | 0.33 (0.13 to 0.59) | 0.56 (0.30 to 0.80) | 0.46 | 0.43 | 0.76 | 1.19 | 0.53 | 0.46 | 0.57 | |
| Perren 2011 | 1 | 24 | 1 | 1 | 0.50 (0.01 to 0.99) | 0.04 (0.00 to 0.20) | 0.04 | 0.50 | 0.52 | 12.5 | 0.07 | 0.04 | 0.50 | |
| 13) Urine volume: fluid recommendations (alternate) | Bossingham 2005 | 0 | 1 | 2 | 18 | 0.00 (0.00 to 0.84) | 0.95 (0.74 to 1.00) | 0 | 0.90 | 0 | 1.06 | 0.10 | 0 | 0.10 |
| Fletcher 1999 | 2 | 8 | 2 | 3 | 0.50 (0.07 to 0.93) | 0.27 (0.06 to 0.61) | 0.20 | 0.60 | 0.69 | 1.83 | 0.27 | 0.20 | 0.40 | |
| Johnson 2003 | 0 | 4 | 2 | 37 | 0.00 (0.00 to 0.84) | 0.90 (0.77 to 0.97) | 0 | 0.95 | 0 | 1.11 | 0.05 | 0 | 0.05 | |
| Lindner 2009 | 14 | 10 | 4 | 6 | 0.78 (0.52 to 0.94) | 0.38 (0.15 to 0.65) | 0.58 | 0.60 | 1.24 | 0.59 | 0.53 | 0.58 | 0.40 | |
| Perren 2011 | 0 | 9 | 2 | 16 | 0.00 (0.00 to 0.84) | 0.64 (0.43 to 0.82) | 0 | 0.89 | 0.00 | 1.56 | 0.07 | 0 | 0.11 | |
| 14) Urine volume (day): > 900 mL | Johnson 2003 | 1 | 5 | 1 | 36 | 0.50 (0.01 to 0.99) | 0.88 (0.74 to 0.96) | 0.17 | 0.97 | 4.10 | 0.57 | 0.05 | 0.17 | 0.03 |
| 15) Urine volume (day): > 1420 mL | Johnson 2003 | 1 | 21 | 1 | 20 | 0.50 (0.01 to 0.99) | 0.49 (0.33 to 0.65) | 0.05 | 0.95 | 0.98 | 1.03 | 0.05 | 0.05 | 0.05 |
| 16) Urine volume (day): > 1940 mL | Johnson 2003 | 2 | 32 | 0 | 9 | 1.00 (0.16 to 1.00) | 0.22 (0.11 to 0.38) | 0.06 | 1.00 | 1.28 | 0 | 0.05 | 0.06 | 0 |
| 17) Urine volume (night): > 450 mL | Johnson 2003 | 0 | 3 | 2 | 38 | 0.00 (0.00 to 0.84) | 0.93 (0.80 to 0.98) | 0 | 0.95 | 0 | 1.08 | 0.05 | 0 | 0.050 |
| 18) Urine volume (night): > 860 mL | Johnson 2003 | 1 | 20 | 1 | 21 | 0.50 (0.01 to 0.99) | 0.51 (0.35 to 0.67) | 0.05 | 0.95 | 1.03 | 0.98 | 0.05 | 0.05 | 0.05 |
| 19) Urine volume (night): > 1270 mL | Johnson 2003 | 1 | 37 | 1 | 4 | 0.50 (0.01 to 0.99) | 0.10 (0.03 to 0.23) | 0.03 | 0.80 | 0.55 | 5.13 | 0.05 | 0.03 | 0.20 |
| 20) Urine voids/day: ≥ 11 | Johnson 2003 | 0 | 1 | 2 | 40 | 0.00 (0.00 to 0.84) | 0.98 (0.87 to 1.00) | 0 | 0.95 | 0 | 1.03 | 0.05 | 0 | 0.05 |
| 21) Urine voids/day: ≥ 7 | Johnson 2003 | 2 | 20 | 0 | 21 | 1.00 (0.16 to 1.00) | 0.51 (0.35 to 0.67) | 0.09 | 1.00 | 2.05 | 0 | 0.05 | 0.09 | 0.00 |
| 22) Urine voids/day: ≥ 4 | Johnson 2003 | 2 | 38 | 0 | 3 | 1.00 (0.16 to 1.00) | 0.07 (0.02 to 0.20) | 0.05 | 1.00 | 1.08 | 0 | 0.05 | 0.05 | 0 |
| 23) Urine voids/night: ≥ 4.1 | Johnson 2003 | 1 | 5 | 1 | 36 | 0.50 (0.01 to 0.99) | 0.88 (0.74 to 0.96) | 0.17 | 0.97 | 4.10 | 0.57 | 0.05 | 0.17 | 0.03 |
| 24) Urine voids/night: ≥ 2.6 | Johnson 2003 | 1 | 20 | 1 | 21 | 0.50 (0.01 to 0.99) | 0.51 (0.35 to 0.67) | 0.05 | 0.95 | 1.03 | 0.98 | 0.05 | 0.05 | 0.05 |
| 25) Urine voids/night: ≥ 1.5 | Johnson 2003 | 2 | 37 | 0 | 4 | 1.00 (0.16 to 1.00) | 0.10 (0.03 to 0.23) | 0.05 | 1.00 | 1.11 | 0 | 0.05 | 0.05 | 0 |
| 26) Nocturnal polyuria | Johnson 2003 | 1 | 23 | 1 | 18 | 0.50 (0.01 to 0.99) | 0.44 (0.28 to 0.60) | 0.04 | 0.95 | 0.89 | 1.14 | 0.05 | 0.04 | 0.05 |
| 27) Fluid balance: <‐180 mL/d (< a deficit of 180 mL/d) | Bossingham 2005 | 0 | 0 | 2 | 19 | 0.00 (0.00 to 0.84) | 1.00 (0.82 to 1.00) | # | 0.90 | # | 1.00 | 0.10 | # | 0.10 |
| Lindner 2009 | 0 | 2 | 18 | 14 | 0.00 (0.00 to 0.19) | 0.88 (0.62 to 0.98) | 0 | 0.44 | 0 | 1.14 | 0.53 | 0 | 0.56 | |
| Monahan 2006 | 1 | 4 | 4 | 1 | 0.20 (0.01 to 0.72) | 0.20 (0.01 to 0.72) | 0.20 | 0.20 | 0.25 | 4.00 | 0.50 | 0.20 | 0.80 | |
| Perren 2011 | 0 | 9 | 2 | 16 | 0.00 (0.00 to 0.84) | 0.64 (0.43 to 0.82) | 0 | 0.89 | 0 | 1.56 | 0.07 | 0 | 0.11 | |
| 28) Fluid balance: < +180 mL/d (< a surplus of 180 mL/d) | Bossingham 2005 | 1 | 9 | 1 | 10 | 0.50 (0.01 to 0.99) | 0.53 (0.29 to 0.76) | 0.10 | 0.91 | 1.06 | 0.95 | 0.10 | 0.10 | 0.09 |
| Lindner 2009 | 2 | 2 | 16 | 14 | 0.11 (0.01 to 0.35) | 0.88 (0.62 to 0.98) | 0.50 | 0.47 | 0.89 | 1.02 | 0.53 | 0.50 | 0.53 | |
| Monahan 2006 | 2 | 4 | 3 | 1 | 0.40 (0.05 to 0.85) | 0.20 (0.01 to 0.72) | 0.33 | 0.25 | 0.50 | 3.00 | 0.50 | 0.33 | 0.75 | |
| Perren 2011 | 0 | 12 | 2 | 13 | 0.00 (0.00 to 0.84) | 0.52 (0.31 to 0.72) | 0 | 0.87 | 0 | 1.92 | 0.07 | 0 | 0.13 | |
| 29) Fluid balance: < +1700 mL/d (< a surplus of 1700 mL/d) | Bossingham 2005 | 2 | 19 | 0 | 0 | 1.00 (0.16 to 1.00) | 0.00 (0.00 to 0.18) | 0.10 | # | 1.00 | # | 0.10 | 0.10 | # |
| Lindner 2009 | 7 | 9 | 11 | 7 | 0.39 (0.17 to 0.64) | 0.44 (0.20 to 0.70) | 0.44 | 0.39 | 0.69 | 1.40 | 0.53 | 0.44 | 0.61 | |
| Monahan 2006 | 2 | 4 | 3 | 1 | 0.40 (0.05 to 0.85) | 0.20 (0.01 to 0.72) | 0.33 | 0.25 | 0.50 | 3.00 | 0.50 | 0.33 | 0.75 | |
| Perren 2011 | 1 | 24 | 1 | 1 | 0.50 (0.01 to 0.99) | 0.04 (0.00 to 0.20) | 0.04 | 0.50 | 0.52 | 12.5 | 0.07 | 0.04 | 0.50 | |
| 30) USG: ≥ 1.035 | Bossingham 2005 | 0 | 0 | 2 | 19 | 0.00 (0.00 to 0.84) | 1.00 (0.82 to 1.00) | # | 0.90 | # | 1.00 | 0.10 | # | 0.10 |
| Culp 2003 | 0 | 0 | 169 | 139 | 0.00 (0.00 to 0.02) | 1.00 (0.97 to 1.00) | # | 0.45 | # | 1.00 | 0.55 | # | 0.55 | |
| Rowat 2011 | 1 | 2 | 7 | 7 | 0.13 (0.00 to 0.53) | 0.78 (0.40 to 0.97) | 0.33 | 0.50 | 0.56 | 1.13 | 0.47 | 0.33 | 0.50 | |
| Sjöstrand Healthy 2013 | 0 | 0 | 2 | 11 | 0.00 (0.00 to 0.84) | 1.00 (0.72 to 1.00) | # | 0.85 | # | 1.00 | 0.15 | # | 0.15 | |
| 31) USG: ≥ 1.028 | Bossingham 2005 | 0 | 0 | 2 | 19 | 0.00 (0.00 to 0.84) | 1.00 (0.82 to 1.00) | # | 0.90 | # | 1.00 | 0.10 | # | 0.10 |
| Culp 2003 | 3 | 9 | 166 | 130 | 0.02 (0.00 to 0.05) | 0.94 (0.88 to 0.97) | 0.25 | 0.44 | 0.27 | 1.05 | 0.55 | 0.25 | 0.56 | |
| Rowat 2011 | 2 | 2 | 6 | 7 | 0.25 (0.03 to 0.65) | 0.78 (0.40 to 0.97) | 0.50 | 0.54 | 1.13 | 0.96 | 0.47 | 0.50 | 0.46 | |
| Sjöstrand Healthy 2013 | 0 | 0 | 2 | 11 | 0.00 (0.00 to 0.84) | 1.00 (0.72 to 1.00) | # | 0.85 | # | 1.00 | 0.15 | # | 0.15 | |
| 32) USG: ≥ 1.020 | Bossingham 2005 | 0 | 0 | 2 | 19 | 0.00 (0.00 to 0.84) | 1.00 (0.82 to 1.00) | # | 0.90 | # | 1.00 | 0.10 | # | 0.10 |
| Culp 2003 | 35 | 41 | 134 | 98 | 0.21 (0.15 to 0.28) | 0.71 (0.62 to 0.78) | 0.46 | 0.42 | 0.70 | 1.12 | 0.55 | 0.46 | 0.58 | |
| Rowat 2011 | 4 | 4 | 4 | 5 | 0.50 (0.16 to 0.84) | 0.56 (0.21 to 0.86) | 0.50 | 0.56 | 1.13 | 0.90 | 0.47 | 0.50 | 0.44 | |
| Sjöstrand Healthy 2013 | 1 | 3 | 1 | 8 | 0.50 (0.01 to 0.99) | 0.73 (0.39 to 0.94) | 0.25 | 0.89 | 1.83 | 0.69 | 0.15 | 0.25 | 0.11 | |
| 33) Urine colour: > 6 | Fletcher 1999 | 1 | 1 | 3 | 10 | 0.25 (0.01 to 0.81) | 0.91 (0.59 to 1.00) | 0.50 | 0.77 | 2.75 | 0.83 | 0.27 | 0.50 | 0.23 |
| Rowat 2011 | 0 | 3 | 8 | 6 | 0.00 (0.00 to 0.37) | 0.67 (0.30 to 0.93) | 0 | 0.43 | 0 | 1.50 | 0.47 | 0 | 0.57 | |
| Sjöstrand ED 2013 | 0 | 1 | 15 | 20 | 0.00 (0.00 to 0.22) | 0.95 (0.76 to 1.00) | 0.00 | 0.57 | 0 | 1.05 | 0.42 | 0.00 | 0.43 | |
| Sjöstrand Healthy 2013 | 0 | 0 | 2 | 8 | 0.00 (0.00 to 0.84) | 1.00 (0.63 to 1.00) | # | 0.80 | # | 1.00 | 0.20 | # | 0.20 | |
| 34) Urine colour: > 4 | Fletcher 1999 | 3 | 9 | 1 | 2 | 0.75 (0.19 to 0.99) | 0.18 (0.02 to 0.52) | 0.25 | 0.67 | 0.92 | 1.38 | 0.27 | 0.25 | 0.33 |
| Rowat 2011 | 4 | 7 | 4 | 2 | 0.50 (0.16 to 0.84) | 0.22 (0.03 to 0.60) | 0.36 | 0.33 | 0.64 | 2.25 | 0.47 | 0.36 | 0.67 | |
| Sjöstrand ED 2013 | 1 | 3 | 14 | 18 | 0.07 (0.00 to 0.32) | 0.86 (0.64 to 0.97) | 0.25 | 0.56 | 0.47 | 1.09 | 0.42 | 0.25 | 0.44 | |
| Sjöstrand Healthy 2013 | 0 | 0 | 2 | 8 | 0.00 (0.00 to 0.84) | 1.00 (0.63 to 1.00) | # | 0.80 | # | 1.00 | 0.20 | # | 0.20 | |
| 35) Urine colour: > 2 | Fletcher 1999 | 4 | 10 | 0 | 1 | 1.00 (0.40 to 1.00) | 0.09 (0.00 to 0.41) | 0.29 | 1.00 | 1.10 | 0 | 0.27 | 0.29 | 0 |
| Rowat 2011 | 6 | 8 | 2 | 1 | 0.75 (0.35 to 0.97) | 0.11 (0.00 to 0.48) | 0.43 | 0.33 | 0.84 | 2.25 | 0.47 | 0.43 | 0.67 | |
| Sjöstrand ED 2013 | 10 | 14 | 5 | 7 | 0.67 (0.38 to 0.88) | 0.33 (0.15 to 0.57) | 0.42 | 0.58 | 1.00 | 1.00 | 0.42 | 0.42 | 0.42 | |
| Sjöstrand Healthy 2013 | 2 | 4 | 0 | 4 | 1.00 (0.16 to 1.00) | 0.50 (0.16 to 0.84) | 0.33 | 1.00 | 2.00 | 0.00 | 0.20 | 0.33 | 0.00 | |
| 36) Urine osmolality: > 1000 mOsm/kg | Fletcher 1999 | 0 | 0 | 4 | 11 | 0.00 (0.00 to 0.60) | 1.00 (0.72 to 1.00) | # | 0.73 | # | 1.00 | 0.27 | # | 0.27 |
| Johnson 2003 | 0 | 0 | 2 | 41 | 0.00 (0.00 to 0.84) | 1.00 (0.91 to 1.00) | # | 0.95 | # | 1 | 0.05 | # | 0.05 | |
| Lindner 2009 | 0 | 0 | 13 | 14 | 0.00 (0.00 to 0.25) | 1.00 (0.77 to 1.00) | # | 0.52 | # | 1.00 | 0.48 | # | 0.48 | |
| Powers 2012 | 1 | 0 | 10 | 11 | 0.09 (0.00 to 0.41) | 1.00 (0.72 to 1.00) | 1.00 | 0.52 | # | 0.91 | 0.50 | 1.00 | 0.48 | |
| Sjöstrand ED 2013 | 0 | 0 | 16 | 22 | 0.00 (0.00 to 0.21) | 1.00 (0.85 to 1.00) | # | 0.58 | # | 1.00 | 0.42 | # | 0.42 | |
| Sjöstrand Healthy 2013 | 0 | 0 | 2 | 11 | 0.00 (0.00 to 0.84) | 1.00 (0.72 to 1.00) | # | 0.85 | # | 1.00 | 0.15 | # | 0.15 | |
| 37) Urine osmolality: > 800 mOsm/kg | Fletcher 1999 | 1 | 1 | 3 | 10 | 0.25 (0.01 to 0.81) | 0.91 (0.59 to 1.00) | 0.50 | 0.77 | 2.75 | 0.83 | 0.27 | 0.50 | 0.23 |
| Johnson 2003 | 0 | 0 | 2 | 41 | 0.00 (0.00 to 0.84) | 1.00 (0.91 to 1.00) | # | 0.95 | # | 1 | 0.05 | # | 0.05 | |
| Lindner 2009 | 0 | 0 | 13 | 14 | 0.00 (0.00 to 0.25) | 1.00 (0.77 to 1.00) | # | 0.52 | # | 1.00 | 0.48 | # | 0.48 | |
| Powers 2012 | 3 | 1 | 8 | 10 | 0.27 (0.06 to 0.61) | 0.91 (0.59 to 1.00) | 0.75 | 0.56 | 3.00 | 0.80 | 0.50 | 0.75 | 0.44 | |
| Sjöstrand ED 2013 | 3 | 2 | 13 | 20 | 0.19 (0.04 to 0.46) | 0.91 (0.71 to 0.99) | 0.60 | 0.61 | 2.06 | 0.89 | 0.42 | 0.60 | 0.39 | |
| Sjöstrand Healthy 2013 | 1 | 1 | 1 | 10 | 0.50 (0.01 to 0.99) | 0.91 (0.59 to 1.00) | 0.50 | 0.91 | 5.5 | 0.55 | 0.15 | 0.50 | 0.09 | |
| 38) Urine osmolality: > 600 mOsm/kg | Fletcher 1999 | 1 | 6 | 3 | 5 | 0.25 (0.01 to 0.81) | 0.45 (0.17 to 0.77) | 0.14 | 0.63 | 0.46 | 1.65 | 0.27 | 0.14 | 0.38 |
| Johnson 2003 | 1 | 10 | 1 | 31 | 0.50 (0.01 to 0.99) | 0.76 (0.60 to 0.88) | 0.09 | 0.97 | 2.05 | 0.66 | 0.05 | 0.09 | 0.03 | |
| Lindner 2009 | 3 | 2 | 10 | 12 | 0.23 (0.05 to 0.54) | 0.86 (0.57 to 0.98) | 0.60 | 0.55 | 1.62 | 0.90 | 0.48 | 0.60 | 0.45 | |
| Powers 2012 | 4 | 4 | 7 | 7 | 0.36 (0.11 to 0.69) | 0.64 (0.31 to 0.89) | 0.50 | 0.50 | 1.00 | 1.00 | 0.50 | 0.50 | 0.50 | |
| Sjöstrand ED 2013 | 8 | 8 | 8 | 14 | 0.50 (0.25 to 0.75) | 0.64 (0.41 to 0.83) | 0.50 | 0.64 | 1.38 | 0.79 | 0.42 | 0.50 | 0.36 | |
| Sjöstrand Healthy 2013 | 2 | 7 | 0 | 4 | 1.00 (0.16 to 1.00) | 0.36 (0.11 to 0.69) | 0.22 | 1.00 | 1.57 | 0.00 | 0.15 | 0.22 | 0.00 | |
| 39) Tear osmolarity: > 324 mOsm/L | Fortes 2011 | 3 | 33 | 1 | 52 | 0.75 (0.19 to 0.99) | 0.61 (0.50 to 0.72) | 0.08 | 0.98 | 1.93 | 0.41 | 0.04 | 0.08 | 0.02 |
| 40) Tear osmolarity: > 316 mOsm/L | Fortes 2011 | 3 | 44 | 1 | 41 | 0.75 (0.19 to 0.99) | 0.48 (0.37 to 0.59) | 0.06 | 0.98 | 1.45 | 0.52 | 0.04 | 0.06 | 0.02 |
| 41) Tear osmolarity: > 310 mOsm/L | Fortes 2011 | 3 | 57 | 1 | 28 | 0.75 (0.19 to 0.99) | 0.33 (0.23 to 0.44) | 0.05 | 0.97 | 1.12 | 0.76 | 0.04 | 0.05 | 0.03 |
| 42) Heart rate: ≥ 120 BPM | Chassagne 2006 | 6 | 1 | 212 | 85 | 0.03 (0.01 to 0.06) | 0.99 (0.94 to 1.00) | 0.86 | 0.29 | 2.37 | 0.98 | 0.72 | 0.86 | 0.71 |
| Lindner 2009 | 1 | 2 | 17 | 14 | 0.06 (0.00 to 0.27) | 0.88 (0.62 to 0.98) | 0.33 | 0.45 | 0.44 | 1.08 | 0.53 | 0.33 | 0.55 | |
| Powers 2012 | 0 | 0 | 11 | 11 | 0.00 (0.00 to 0.28) | 1.00 (0.72 to 1.00) | # | 0.50 | # | 1.00 | 0.50 | # | 0.50 | |
| Sjöstrand Healthy 2013 | 0 | 0 | 2 | 11 | 0.00 (0.00 to 0.84) | 1.00 (0.72 to 1.00) | # | 0.85 | # | 1.00 | 0.15 | # | 0.15 | |
| 43) Heart rate: ≥ 100 BPM | Chassagne 2006 | 22 | 6 | 196 | 80 | 0.10 (0.06 to 0.15) | 0.93 (0.85 to 0.97) | 0.79 | 0.29 | 1.45 | 0.97 | 0.72 | 0.79 | 0.71 |
| Lindner 2009 | 7 | 5 | 11 | 11 | 0.39 (0.17 to 0.64) | 0.69 (0.41 to 0.89) | 0.58 | 0.50 | 1.24 | 0.89 | 0.53 | 0.58 | 0.50 | |
| Powers 2012 | 0 | 1 | 11 | 10 | 0.00 (0.00 to 0.28) | 0.91 (0.59 to 1.00) | 0 | 0.48 | 0 | 1.10 | 0.50 | 0 | 0.52 | |
| Sjöstrand Healthy 2013 | 0 | 0 | 2 | 11 | 0.00 (0.00 to 0.84) | 1.00 (0.72 to 1.00) | # | 0.85 | # | 1.00 | 0.15 | # | 0.15 | |
| 44) Heart rate: ≥ 80 BPM | Chassagne 2006 | 108 | 32 | 110 | 54 | 0.50 (0.43 to 0.56) | 0.63 (0.52 to 0.73) | 0.77 | 0.33 | 1.33 | 0.80 | 0.72 | 0.77 | 0.67 |
| Lindner 2009 | 13 | 11 | 5 | 5 | 0.72 (0.47 to 0.90) | 0.31 (0.11 to 0.59) | 0.54 | 0.50 | 1.05 | 0.89 | 0.53 | 0.54 | 0.50 | |
| Powers 2012 | 2 | 2 | 9 | 9 | 0.18 (0.02 to 0.52) | 0.82 (0.48 to 0.98) | 0.50 | 0.50 | 1.00 | 1.00 | 0.50 | 0.50 | 0.50 | |
| Sjöstrand Healthy 2013 | 1 | 3 | 1 | 8 | 0.50 (0.01 to 0.99) | 0.73 (0.39 to 0.94) | 0.25 | 0.89 | 1.83 | 0.69 | 0.15 | 0.25 | 0.11 | |
| 45) Orthostatic hypotension | Chassagne 2006 | 14 | 9 | 88 | 32 | 0.14 (0.08 to 0.22) | 0.78 (0.62 to 0.89) | 0.61 | 0.27 | 0.63 | 1.11 | 0.71 | 0.61 | 0.73 |
| 46) Body temperature: ≥ 38.2oC | Chassagne 2006 | 20 | 2 | 196 | 77 | 0.09 (0.06 to 0.14) | 0.97 (0.91 to 1.00) | 0.91 | 0.28 | 3.66 | 0.93 | 0.73 | 0.91 | 0.72 |
| 47) Body temperature: ≥ 36.8oC | Chassagne 2006 | 185 | 64 | 31 | 15 | 0.86 (0.80 to 0.90) | 0.19 (0.11 to 0.29) | 0.74 | 0.33 | 1.06 | 0.76 | 0.73 | 0.74 | 0.67 |
| 48) Body temperature: ≥ 33.2oC | Chassagne 2006 | 215 | 79 | 1 | 0 | 1.00 (0.97 to 1.00) | 0.00 (0.00 to 0.05) | 0.73 | 0 | 1.00 | # | 0.73 | 0.73 | 1.00 |
| 49) Skin turgor, anterior forearm: ≥ 3 sec | Chassagne 2006 | 103 | 34 | 112 | 51 | 0.48 (0.41 to 0.55) | 0.60 (0.49 to 0.70) | 0.75 | 0.31 | 1.20 | 0.87 | 0.72 | 0.75 | 0.69 |
| 50) Skin turgor, to anterior thigh: ≥ 3 sec | Chassagne 2006 | 67 | 12 | 149 | 73 | 0.31 (0.25 to 0.38) | 0.86 (0.77 to 0.92) | 0.85 | 0.33 | 2.20 | 0.80 | 0.72 | 0.85 | 0.67 |
| 51) Skin turgor, anterior thigh: abnormal | Source Study 2000 | 11 | 5 | 69 | 77 | 0.14 (0.07 to 0.23) | 0.94 (0.86 to 0.98) | 0.69 | 0.53 | 2.26 | 0.92 | 0.49 | 0.69 | 0.47 |
| 52) Skin turgor, subclavicular: ≥ 3 sec | Chassagne 2006 | 96 | 15 | 123 | 70 | 0.44 (0.37 to 0.51) | 0.82 (0.73 to 0.90) | 0.86 | 0.36 | 2.48 | 0.68 | 0.72 | 0.86 | 0.64 |
| 53) Skin turgor, sternum: ≥ 3 sec | Chassagne 2006 | 71 | 18 | 146 | 67 | 0.33 (0.27 to 0.39) | 0.79 (0.69 to 0.87) | 0.80 | 0.31 | 1.55 | 0.85 | 0.72 | 0.80 | 0.69 |
| 55) Skin turgor, hand: ≥ 4 sec | Kafri 2013 | 0 | 1 | 13 | 17 | 0.00 (0.00 to 0.25) | 0.94 (0.73 to 1.00) | 0 | 0.57 | 0 | 1.06 | 0.42 | 0 | 0.43 |
| 56) Skin turgor, hand: ≥ 3 sec | Kafri 2013 | 2 | 2 | 11 | 16 | 0.15 (0.02 to 0.45) | 0.89 (0.65 to 0.99) | 0.50 | 0.59 | 1.38 | 0.95 | 0.42 | 0.50 | 0.41 |
| 57) Skin turgor, hand: ≥ 1 sec | Kafri 2013 | 13 | 17 | 0 | 1 | 1.00 (0.75 to 1.00) | 0.06 (0.00 to 0.27) | 0.43 | 1.00 | 1.06 | 0 | 0.42 | 0.43 | 0 |
| 59) Skin turgor, site unspecified: abnormal | Rowat 2011 | 3 | 1 | 6 | 8 | 0.33 (0.07 to 0.70) | 0.89 (0.52 to 1.00) | 0.75 | 0.57 | 3.00 | 0.75 | 0.50 | 0.75 | 0.43 |
| 60) Capillary refill: ≥ 4 sec | Kafri 2013 | 0 | 1 | 7 | 23 | 0.00 (0.00 to 0.41) | 0.96 (0.79 to 1.00) | 0 | 0.77 | 0 | 1.04 | 0.23 | 0 | 0.23 |
| 61) Capillary refill: ≥ 3 sec | Kafri 2013 | 2 | 3 | 5 | 21 | 0.29 (0.04 to 0.71) | 0.88 (0.68 to 0.97) | 0.40 | 0.81 | 2.29 | 0.82 | 0.23 | 0.40 | 0.19 |
| 62) Capillary refill: ≥ 2 sec | Kafri 2013 | 6 | 16 | 1 | 8 | 0.86 (0.42 to 1.00) | 0.33 (0.16 to 0.55) | 0.27 | 0.89 | 1.29 | 0.43 | 0.23 | 0.27 | 0.11 |
| 67) Consciousness level: ≥ coma | Chassagne 2006 | 9 | 1 | 210 | 83 | 0.04 (0.02 to 0.08) | 0.99 (0.94 to 1.00) | 0.90 | 0.28 | 3.45 | 0.97 | 0.72 | 0.90 | 0.72 |
| 68) Consciousness level: ≥ stupor | Chassagne 2006 | 38 | 7 | 181 | 77 | 0.17 (0.13 to 0.23) | 0.92 (0.84 to 0.97) | 0.84 | 0.30 | 2.08 | 0.90 | 0.72 | 0.84 | 0.70 |
| 69) Consciousness level: ≥ obsessed | Chassagne 2006 | 127 | 38 | 92 | 46 | 0.58 (0.51 to 0.65) | 0.55 (0.44 to 0.66) | 0.77 | 0.33 | 1.28 | 0.77 | 0.72 | 0.77 | 0.67 |
| 70) MMSE: < 10 | Culp 2003 | 0 | 2 | 169 | 137 | 0.00 (0.00 to 0.02) | 0.99 (0.95 to 1.00) | 0 | 0.45 | 0 | 1.01 | 0.55 | 0 | 0.55 |
| 71) MMSE: < 20 | Culp 2003 | 51 | 38 | 118 | 101 | 0.30 (0.23 to 0.38) | 0.73 (0.64 to 0.80) | 0.57 | 0.46 | 1.10 | 0.96 | 0.55 | 0.57 | 0.54 |
| 72) MMSE: < 25 | Culp 2003 | 97 | 80 | 72 | 59 | 0.57 (0.50 to 0.65) | 0.42 (0.34 to 0.51) | 0.55 | 0.45 | 1.00 | 1.00 | 0.55 | 0.55 | 0.55 |
| 73) Neecham: < 20 | Culp 2003 | 5 | 2 | 164 | 137 | 0.03 (0.01 to 0.07) | 0.99 (0.95 to 1.00) | 0.71 | 0.46 | 2.06 | 0.98 | 0.55 | 0.71 | 0.54 |
| 74) Neecham: ≤ 24 | Culp 2003 | 27 | 17 | 142 | 122 | 0.16 (0.11 to 0.22) | 0.88 (0.81 to 0.93) | 0.61 | 0.46 | 1.31 | 0.96 | 0.55 | 0.61 | 0.54 |
| 75) Neecham: < 27 | Culp 2003 | 81 | 51 | 88 | 88 | 0.48 (0.40 to 0.56) | 0.63 (0.55 to 0.71) | 0.61 | 0.50 | 1.31 | 0.82 | 0.55 | 0.61 | 0.50 |
| 76) Tiredness: severe | Sjöstrand Healthy 2013 | 0 | 0 | 2 | 11 | 0.00 (0.00 to 0.84) | 1.00 (0.72 to 1.00) | # | 0.85 | # | 1.00 | 0.15 | # | 0.15 |
| Sjöstrand ED 2013 | 0 | 3 | 13 | 15 | 0.00 (0.00 to 0.25) | 0.83 (0.59 to 0.96) | 0.00 | 0.54 | 0 | 1.20 | 0.42 | 0.00 | 0.46 | |
| 77) Tiredness: moderate or severe | Sjöstrand Healthy 2013 | 0 | 1 | 2 | 10 | 0.00 (0.00 to 0.84) | 0.91 (0.59 to 1.00) | 0.00 | 0.83 | 0 | 1.10 | 0.15 | 0.00 | 0.17 |
| Sjöstrand ED 2013 | 2 | 6 | 11 | 12 | 0.15 (0.02 to 0.45) | 0.67 (0.41 to 0.87) | 0.25 | 0.52 | 0.46 | 1.27 | 0.42 | 0.25 | 0.48 | |
| 78) Fatigue | Kajii 2006 | 2 | 19 | 0 | 50 | 1.00 (0.16 to 1.00) | 0.72 (0.60 to 0.83) | 0.10 | 1.00 | 3.63 | 0 | 0.03 | 0.10 | 0 |
| Sjöstrand ED 2013 | 5 | 7 | 8 | 11 | 0.38 (0.14 to 0.68) | 0.61 (0.36 to 0.83) | 0.42 | 0.58 | 0.99 | 1.01 | 0.42 | 0.42 | 0.42 | |
| Sjöstrand Healthy 2013 | 0 | 3 | 2 | 8 | 0.00 (0.00 to 0.84) | 0.73 (0.39 to 0.94) | 0.00 | 0.80 | 0.00 | 1.375 | 0.15 | 0.00 | 0.20 | |
| 79) Lassitude | Kajii 2006 | 0 | 13 | 2 | 56 | 0.00 (0.00 to 0.84) | 0.81 (0.70 to 0.90) | 0 | 0.97 | 0 | 1.23 | 0.03 | 0 | 0.03 |
| 80) Feels dull | Kajii 2006 | 1 | 21 | 1 | 48 | 0.50 (0.01 to 0.99) | 0.70 (0.57 to 0.80) | 0.05 | 0.98 | 1.64 | 0.72 | 0.03 | 0.05 | 0.02 |
| 81) Dry oral mucosa: cheek | Chassagne 2006 | 54 | 7 | 155 | 74 | 0.26 (0.20 to 0.32) | 0.91 (0.83 to 0.96) | 0.89 | 0.32 | 2.99 | 0.81 | 0.72 | 0.89 | 0.68 |
| 82) Tongue furrows: ≥ mild | Kafri 2013 | 5 | 12 | 1 | 13 | 0.83 (0.36 to 1.00) | 0.52 (0.31 to 0.72) | 0.29 | 0.93 | 1.74 | 0.32 | 0.19 | 0.29 | 0.07 |
| 83) Tongue furrows: ≥ moderate | Kafri 2013 | 1 | 3 | 5 | 22 | 0.17 (0.00 to 0.64) | 0.88 (0.69 to 0.97) | 0.25 | 0.81 | 1.39 | 0.95 | 0.19 | 0.25 | 0.19 |
| 84) Tongue furrows: ≥ severe | Kafri 2013 | 0 | 1 | 6 | 24 | 0.00 (0.00 to 0.46) | 0.96 (0.80 to 1.00) | 0 | 0.80 | 0 | 1.04 | 0.19 | 0 | 0.20 |
| 85) Tongue dry: ≥ mild | Kafri 2013 | 5 | 10 | 1 | 15 | 0.83 (0.36 to 1.00) | 0.60 (0.39 to 0.79) | 0.33 | 0.94 | 2.08 | 0.28 | 0.19 | 0.33 | 0.06 |
| 86) Tongue dry: ≥ moderate | Kafri 2013 | 2 | 3 | 4 | 22 | 0.33 (0.04 to 0.78) | 0.88 (0.69 to 0.97) | 0.40 | 0.85 | 2.78 | 0.76 | 0.19 | 0.40 | 0.15 |
| 87) Tongue dry: severe | Kafri 2013 | 0 | 1 | 6 | 24 | 0.00 (0.00 to 0.46) | 0.96 (0.80 to 1.00) | 0 | 0.80 | 0 | 1.04 | 0.19 | 0 | 0.20 |
| 88) BIA resistance 50 kHz: ≥ 550 ohm | Allison 2005 | 2 | 2 | 0 | 11 | 1.00 (0.16 to 1.00) | 0.85 (0.55 to 0.98) | 0.50 | 1.00 | 6.50 | 0 | 0.13 | 0.50 | 0 |
| Kafri 2013 | 1 | 2 | 5 | 13 | 0.17 (0.00 to 0.64) | 0.87 (0.60 to 0.98) | 0.33 | 0.72 | 1.25 | 0.96 | 0.29 | 0.33 | 0.28 | |
| Powers 2012 | 3 | 1 | 8 | 10 | 0.27 (0.06 to 0.61) | 0.91 (0.59 to 1.00) | 0.75 | 0.56 | 3.00 | 0.80 | 0.50 | 0.75 | 0.44 | |
| Stookey 2005 | 2 | 746 | 8 | 1191 | 0.20 (0.03 to 0.56) | 0.61 (0.59 to 0.64) | 0.00 | 0.99 | 0.52 | 1.30 | 0.005 | 0.003 | 0.007 | |
| 89) BIA resistance 50 kHz: ≥ 450 ohm | Allison 2005 | 2 | 3 | 0 | 10 | 1.00 (0.16 to 1.00) | 0.77 (0.46 to 0.95) | 0.40 | 1.00 | 4.33 | 0 | 0.13 | 0.40 | 0 |
| Kafri 2013 | 2 | 9 | 4 | 6 | 0.33 (0.04 to 0.78) | 0.40 (0.16 to 0.68) | 0.18 | 0.60 | 0.56 | 1.67 | 0.29 | 0.18 | 0.40 | |
| Powers 2012 | 8 | 6 | 3 | 5 | 0.73 (0.39 to 0.94) | 0.45 (0.17 to 0.77) | 0.57 | 0.63 | 1.33 | 0.60 | 0.50 | 0.57 | 0.38 | |
| Stookey 2005 | 6 | 1560 | 4 | 377 | 0.60 (0.26 to 0.88) | 0.19 (0.18 to 0.21) | 0.00 | 0.99 | 0.75 | 2.06 | 0.005 | 0.004 | 0.010 | |
| 90) BIA resistance 50 kHz: ≥ 350 ohm | Allison 2005 | 2 | 8 | 0 | 5 | 1.00 (0.16 to 1.00) | 0.38 (0.14 to 0.68) | 0.20 | 1.00 | 1.63 | 0 | 0.13 | 0.20 | 0 |
| Kafri 2013 | 4 | 12 | 2 | 3 | 0.67 (0.22 to 0.96) | 0.20 (0.04 to 0.48) | 0.25 | 0.60 | 0.83 | 1.67 | 0.29 | 0.25 | 0.40 | |
| Powers 2012 | 10 | 7 | 1 | 4 | 0.91 (0.59 to 1.00) | 0.36 (0.11 to 0.69) | 0.59 | 0.80 | 1.43 | 0.25 | 0.50 | 0.59 | 0.20 | |
| Stookey 2005 | 10 | 1918 | 0 | 19 | 1.00 (0.69 to 1.00) | 0.01 (0.01 to 0.02) | 0.01 | 1.00 | 1.01 | 0 | 0.01 | 0.01 | 0 | |
| 91) BIA resistance 100 kHz: ≥ 550 ohm | Kafri 2013 | 1 | 1 | 5 | 14 | 0.17 (0.00 to 0.64) | 0.93 (0.68 to 1.00) | 0.50 | 0.74 | 2.50 | 0.89 | 0.29 | 0.50 | 0.26 |
| 92) BIA resistance 100 kHz: ≥ 450 ohm | Kafri 2013 | 1 | 8 | 5 | 7 | 0.17 (0.00 to 0.64) | 0.47 (0.21 to 0.73) | 0.11 | 0.58 | 0.31 | 1.79 | 0.29 | 0.11 | 0.42 |
| 93) BIA resistance 100 kHz: ≥ 350 ohm | Kafri 2013 | 4 | 12 | 2 | 3 | 0.67 (0.22 to 0.96) | 0.20 (0.04 to 0.48) | 0.25 | 0.60 | 0.83 | 1.67 | 0.29 | 0.25 | 0.40 |
| 94) BIA resistance 200 kHz: ≥ 550 ohm | Kafri 2013 | 0 | 1 | 6 | 14 | 0.00 (0.00 to 0.46) | 0.93 (0.68 to 1.00) | 0 | 0.70 | 0 | 1.07 | 0.29 | 0.00 | 0.30 |
| 95) BIA resistance 200 kHz: ≥ 450 ohm | Kafri 2013 | 1 | 5 | 5 | 10 | 0.17 (0.00 to 0.64) | 0.67 (0.38 to 0.88) | 0.17 | 0.67 | 0.50 | 1.25 | 0.29 | 0.17 | 0.33 |
| 96) BIA resistance 200 kHz: ≥ 350 ohm | Kafri 2013 | 3 | 11 | 3 | 4 | 0.50 (0.12 to 0.88) | 0.27 (0.08 to 0.55) | 0.21 | 0.57 | 0.68 | 1.88 | 0.29 | 0.21 | 0.43 |
| 97) BIA TBW: < 45% | Culp 2003 | 47 | 25 | 122 | 114 | 0.28 (0.21 to 0.35) | 0.82 (0.75 to 0.88) | 0.65 | 0.48 | 1.55 | 0.88 | 0.55 | 0.65 | 0.52 |
| Kafri 2013 | 2 | 1 | 4 | 14 | 0.33 (0.04 to 0.78) | 0.93 (0.68 to 1.00) | 0.67 | 0.78 | 5.00 | 0.71 | 0.29 | 0.67 | 0.22 | |
| Powers 2012 | 2 | 2 | 9 | 9 | 0.18 (0.02 to 0.52) | 0.82 (0.48 to 0.98) | 0.50 | 0.50 | 1.00 | 1.00 | 0.50 | 0.50 | 0.50 | |
| Stookey 2005 | 5 | 713 | 5 | 1223 | 0.50 (0.19 to 0.81) | 0.63 (0.61 to 0.65) | 0.01 | 1.00 | 1.36 | 0.79 | 0.005 | 0.007 | 0.004 | |
| 98) BIA TBW: < 47% | Culp 2003 | 63 | 41 | 106 | 98 | 0.37 (0.30 to 0.45) | 0.71 (0.62 to 0.78) | 0.61 | 0.48 | 1.26 | 0.89 | 0.55 | 0.61 | 0.52 |
| Kafri 2013 | 2 | 1 | 4 | 14 | 0.33 (0.04 to 0.78) | 0.93 (0.68 to 1.00) | 0.67 | 0.78 | 5.00 | 0.71 | 0.29 | 0.67 | 0.22 | |
| Powers 2012 | 3 | 3 | 8 | 8 | 0.27 (0.06 to 0.61) | 0.73 (0.39 to 0.94) | 0.50 | 0.50 | 1.00 | 1.00 | 0.50 | 0.50 | 0.50 | |
| Stookey 2005 | 5 | 940 | 5 | 996 | 0.50 (0.19 to 0.81) | 0.51 (0.49 to 0.54) | 0.01 | 1.00 | 1.03 | 0.97 | 0.005 | 0.005 | 0.005 | |
| 99) BIA TBW: < 49% | Culp 2003 | 79 | 52 | 90 | 87 | 0.47 (0.39 to 0.55) | 0.63 (0.54 to 0.71) | 0.60 | 0.49 | 1.25 | 0.85 | 0.55 | 0.60 | 0.51 |
| Kafri 2013 | 3 | 5 | 3 | 10 | 0.50 (0.12 to 0.88) | 0.67 (0.38 to 0.88) | 0.38 | 0.77 | 1.50 | 0.75 | 0.29 | 0.38 | 0.23 | |
| Powers 2012 | 4 | 3 | 7 | 8 | 0.36 (0.11 to 0.69) | 0.73 (0.39 to 0.94) | 0.57 | 0.53 | 1.33 | 0.88 | 0.50 | 0.57 | 0.47 | |
| Stookey 2005 | 6 | 1149 | 4 | 787 | 0.60 (0.26 to 0.88) | 0.41 (0.38 to 0.43) | 0.01 | 0.99 | 1.01 | 0.98 | 0.005 | 0.005 | 0.005 | |
| 100) BIA ICW: < 25% | Culp 2003 | 97 | 64 | 72 | 75 | 0.57 (0.50 to 0.65) | 0.54 (0.45 to 0.62) | 0.60 | 0.51 | 1.25 | 0.79 | 0.55 | 0.60 | 0.49 |
| Kafri 2013 | 3 | 3 | 3 | 12 | 0.50 (0.12 to 0.88) | 0.80 (0.52 to 0.96) | 0.50 | 0.80 | 2.50 | 0.63 | 0.29 | 0.50 | 0.20 | |
| Powers 2012 | 3 | 3 | 8 | 8 | 0.27 (0.06 to 0.61) | 0.73 (0.39 to 0.94) | 0.50 | 0.50 | 1.00 | 1.00 | 0.50 | 0.50 | 0.50 | |
| 101) BIA ICW: < 27% | Culp 2003 | 129 | 92 | 40 | 47 | 0.76 (0.69 to 0.83) | 0.34 (0.26 to 0.42) | 0.58 | 0.54 | 1.15 | 0.70 | 0.55 | 0.58 | 0.46 |
| Kafri 2013 | 3 | 6 | 3 | 9 | 0.50 (0.12 to 0.88) | 0.60 (0.32 to 0.84) | 0.33 | 0.75 | 1.25 | 0.83 | 0.29 | 0.33 | 0.25 | |
| Powers 2012 | 6 | 4 | 5 | 7 | 0.55 (0.23 to 0.83) | 0.64 (0.31 to 0.89) | 0.60 | 0.58 | 1.50 | 0.71 | 0.50 | 0.60 | 0.42 | |
| 102) BIA ICW: < 29% | Culp 2003 | 140 | 108 | 29 | 31 | 0.83 (0.76 to 0.88) | 0.22 (0.16 to 0.30) | 0.56 | 0.52 | 1.07 | 0.77 | 0.55 | 0.56 | 0.48 |
| Kafri 2013 | 4 | 10 | 2 | 5 | 0.67 (0.22 to 0.96) | 0.33 (0.12 to 0.62) | 0.29 | 0.71 | 1.00 | 1.00 | 0.29 | 0.29 | 0.29 | |
| Powers 2012 | 6 | 6 | 5 | 5 | 0.55 (0.23 to 0.83) | 0.45 (0.17 to 0.77) | 0.50 | 0.50 | 1.00 | 1.00 | 0.50 | 0.50 | 0.50 | |
| 103) BIA ECW: < 18% | Culp 2003 | 2 | 2 | 167 | 137 | 0.01 (0.00 to 0.04) | 0.99 (0.95 to 1.00) | 0.50 | 0.45 | 0.82 | 1.00 | 0.55 | 0.50 | 0.55 |
| Kafri 2013 | 0 | 0 | 6 | 15 | 0.00 (0.00 to 0.46) | 1.00 (0.78 to 1.00) | # | 0.71 | # | 1.00 | 0.29 | # | 0.29 | |
| Powers 2012 | 0 | 0 | 11 | 11 | 0.00 (0.00 to 0.28) | 1.00 (0.72 to 1.00) | # | 0.50 | # | 1.00 | 0.50 | # | 0.50 | |
| 104) BIA ECW: < 20% | Culp 2003 | 6 | 4 | 163 | 135 | 0.04 (0.01 to 0.08) | 0.97 (0.93 to 0.99) | 0.60 | 0.45 | 1.23 | 0.99 | 0.55 | 0.60 | 0.55 |
| Kafri 2013 | 1 | 0 | 5 | 15 | 0.17 (0.00 to 0.64) | 1.00 (0.78 to 1.00) | 1.00 | 0.75 | # | 0.83 | 0.29 | 1.00 | 0.25 | |
| Powers 2012 | 0 | 1 | 11 | 10 | 0.00 (0.00 to 0.28) | 0.91 (0.59 to 1.00) | 0 | 0.48 | 0 | 1.10 | 0.50 | 0 | 0.52 | |
| 105) BIA ECW: < 22% | Culp 2003 | 20 | 10 | 149 | 129 | 0.12 (0.07 to 0.18) | 0.93 (0.87 to 0.96) | 0.67 | 0.46 | 1.64 | 0.95 | 0.55 | 0.67 | 0.54 |
| Kafri 2013 | 2 | 1 | 4 | 14 | 0.33 (0.04 to 0.78) | 0.93 (0.68 to 1.00) | 0.67 | 0.78 | 5.00 | 0.71 | 0.29 | 0.67 | 0.22 | |
| Powers 2012 | 1 | 4 | 10 | 7 | 0.09 (0.00 to 0.41) | 0.64 (0.31 to 0.89) | 0.20 | 0.41 | 0.25 | 1.43 | 0.50 | 0.20 | 0.59 | |
| 106) Insufficient tears | Fortes 2011 | 1 | 6 | 6 | 92 | 0.14 (0.00 to 0.58) | 0.94 (0.87 to 0.98) | 0.14 | 0.94 | 2.33 | 0.91 | 0.07 | 0.14 | 0.06 |
| 107) Insufficient tears or not tolerated | Fortes 2011 | 3 | 13 | 4 | 85 | 0.43 (0.10 to 0.82) | 0.87 (0.78 to 0.93) | 0.19 | 0.96 | 3.23 | 0.66 | 0.07 | 0.19 | 0.04 |
| 108) Oral thickener used | Stotts 2009 | 1 | 10 | 8 | 29 | 0.11 (0.00 to 0.48) | 0.74 (0.58 to 0.87) | 0.09 | 0.78 | 0.43 | 1.20 | 0.19 | 0.09 | 0.22 |
| 109) Oral fluid without thickener | Stotts 2009 | 7 | 18 | 2 | 21 | 0.78 (0.40 to 0.97) | 0.54 (0.37 to 0.70) | 0.28 | 0.91 | 1.69 | 0.41 | 0.19 | 0.28 | 0.09 |
| 110) Lips dry | Kajii 2006 | 0 | 20 | 2 | 49 | 0.00 (0.00 to 0.84) | 0.71 (0.59 to 0.81) | 0 | 0.96 | 0 | 1.41 | 0.03 | 0 | 0.04 |
| 111) Dry mouth: severe | Sjöstrand Healthy 2013 | 0 | 1 | 2 | 10 | 0.00 (0.00 to 0.84) | 0.91 (0.59 to 1.00) | 0 | 0.83 | 0 | 1.10 | 0.15 | 0.00 | 0.17 |
| Sjöstrand ED 2013 | 0 | 3 | 13 | 15 | 0.00 (0.00 to 0.25) | 0.83 (0.59 to 0.96) | 0.00 | 0.54 | 0.00 | 1.20 | 0.42 | 0.00 | 0.46 | |
| 112) Dry mouth: severe or moderate | Sjöstrand Healthy 2013 | 1 | 3 | 1 | 8 | 0.50 (0.01 to 0.99) | 0.73 (0.39 to 0.94) | 0.25 | 0.89 | 1.83 | 0.69 | 0.15 | 0.25 | 0.11 |
| Sjöstrand ED 2013 | 0 | 5 | 13 | 13 | 0.00 (0.00 to 0.25) | 0.72 (0.47 to 0.90) | 0.00 | 0.50 | 0.00 | 1.38 | 0.42 | 0.00 | 0.50 | |
| 113) Dry mouth | Chassagne 2006 | 58 | 13 | 149 | 68 | 0.28 (0.22 to 0.35) | 0.84 (0.74 to 0.91) | 0.82 | 0.31 | 1.75 | 0.86 | 0.72 | 0.82 | 0.69 |
| Kajii 2006 | 0 | 25 | 2 | 44 | 0.00 (0.00 to 0.84) | 0.64 (0.51 to 0.75) | 0 | 0.96 | 0 | 1.57 | 0.03 | 0 | 0.04 | |
| Rowat 2011 | 6 | 5 | 3 | 4 | 0.67 (0.30 to 0.93) | 0.44 (0.14 to 0.79) | 0.55 | 0.57 | 1.20 | 0.75 | 0.50 | 0.55 | 0.43 | |
| Sjöstrand ED 2013 | 5 | 7 | 8 | 11 | 0.38 (0.14 to 0.68) | 0.61 (0.36 to 0.83) | 0.42 | 0.58 | 0.99 | 1.01 | 0.42 | 0.42 | 0.42 | |
| Sjöstrand Healthy 2013 | 1 | 5 | 1 | 6 | 0.50 (0.01 to 0.99) | 0.55 (0.23 to 0.83) | 0.17 | 0.86 | 1.10 | 0.92 | 0.15 | 0.17 | 0.14 | |
| Source Study 2000 | 17 | 16 | 65 | 66 | 0.21 (0.13 to 0.31) | 0.80 (0.70 to 0.88) | 0.52 | 0.50 | 1.06 | 0.98 | 0.50 | 0.52 | 0.50 | |
| 115) Thirst: severe | Sjöstrand Healthy 2013 | 0 | 1 | 2 | 10 | 0.00 (0.00 to 0.84) | 0.91 (0.59 to 1.00) | 0.00 | 0.83 | 0 | 1.10 | 0.15 | 0.00 | 0.17 |
| Sjöstrand ED 2013 | 0 | 1 | 13 | 17 | 0.00 (0.00 to 0.25) | 0.94 (0.73 to 1.00) | 0.00 | 0.57 | 0 | 1.06 | 0.42 | 0.00 | 0.43 | |
| 116) Thirst) moderate or severe | Sjöstrand Healthy 2013 | 1 | 5 | 1 | 6 | 0.50 (0.01 to 0.99) | 0.55 (0.23 to 0.83) | 0.17 | 0.86 | 1.10 | 0.92 | 0.15 | 0.17 | 0.14 |
| Sjöstrand ED 2013 | 2 | 4 | 11 | 14 | 0.15 (0.02 to 0.45) | 0.78 (0.52 to 0.94) | 0.33 | 0.56 | 0.69 | 1.09 | 0.42 | 0.33 | 0.44 | |
| 118) Thirst: any degree | Kajii 2006 | 0 | 26 | 2 | 43 | 0.00 (0.00 to 0.84) | 0.62 (0.50 to 0.74) | 0 | 0.96 | 0 | 1.60 | 0.03 | 0 | 0.04 |
| Sjöstrand ED 2013 | 5 | 7 | 8 | 11 | 0.38 (0.14 to 0.68) | 0.61 (0.36 to 0.83) | 0.42 | 0.58 | 0.99 | 1.01 | 0.42 | 0.42 | 0.42 | |
| Sjöstrand Healthy 2013 | 1 | 6 | 1 | 5 | 0.50 (0.01 to 0.99) | 0.45 (0.17 to 0.77) | 0.14 | 0.83 | 0.92 | 1.10 | 0.15 | 0.14 | 0.17 | |
| Source Study 2000 | 12 | 5 | 70 | 77 | 0.15 (0.08 to 0.24) | 0.94 (0.86 to 0.98) | 0.71 | 0.52 | 2.40 | 0.91 | 0.50 | 0.71 | 0.48 | |
| 119) Tongue smarts | Kajii 2006 | 0 | 2 | 2 | 67 | 0.00 (0.00 to 0.84) | 0.97 (0.90 to 1.00) | 0 | 0.97 | 0 | 1.03 | 0.03 | 0 | 0.03 |
| 120) Mouth smarts | Kajii 2006 | 0 | 4 | 2 | 65 | 0.00 (0.00 to 0.84) | 0.94 (0.86 to 0.98) | 0 | 0.97 | 0 | 1.06 | 0.03 | 0 | 0.03 |
| 121) Sticky saliva | Kajii 2006 | 0 | 14 | 2 | 55 | 0.00 (0.00 to 0.84) | 0.80 (0.68 to 0.88) | 0 | 0.96 | 0 | 1.25 | 0.03 | 0 | 0.04 |
| 122) Sticky mouth | Kajii 2006 | 0 | 14 | 2 | 55 | 0.00 (0.00 to 0.84) | 0.80 (0.68 to 0.88) | 0 | 0.96 | 0 | 1.25 | 0.03 | 0 | 0.04 |
| 123) Blue lips | Rowat 2011 | 1 | 0 | 8 | 9 | 0.11 (0.00 to 0.48) | 1.00 (0.66 to 1.00) | 1.00 | 0.53 | # | 0.89 | 0.50 | 1.00 | 0.47 |
| 124) Sunken eyes | Rowat 2011 | 0 | 0 | 9 | 9 | 0.00 (0.00 to 0.34) | 1.00 (0.66 to 1.00) | # | 0.50 | # | 1.00 | 0.50 | # | 0.50 |
| 125) Bed sores | Source Study 2000 | 6 | 7 | 76 | 75 | 0.07 (0.03 to 0.15) | 0.91 (0.83 to 0.96) | 0.46 | 0.50 | 0.86 | 1.01 | 0.50 | 0.46 | 0.50 |
| 126) Swallowing problems | Kajii 2006 | 0 | 15 | 2 | 54 | 0.00 (0.00 to 0.84) | 0.78 (0.67 to 0.87) | 0 | 0.96 | 0 | 1.28 | 0.03 | 0 | 0.04 |
| 127) Enjoyment of food | Kajii 2006 | 2 | 62 | 0 | 7 | 1.00 (0.16 to 1.00) | 0.10 (0.04 to 0.20) | 0.03 | 1.00 | 1.11 | 0 | 0.03 | 0.03 | 0 |
| 128) Appetite | Kajii 2006 | 1 | 6 | 1 | 63 | 0.50 (0.01 to 0.99) | 0.91 (0.82 to 0.97) | 0.14 | 0.98 | 5.75 | 0.55 | 0.03 | 0.14 | 0.02 |
| 129) Dry eye severity by DEQ‐5: > 12 | Fortes 2011 | 0 | 9 | 6 | 89 | 0.00 (0.00 to 0.46) | 0.91 (0.83 to 0.96) | 0 | 0.94 | 0 | 1.10 | 0.06 | 0 | 0.06 |
| 130) Dry eye severity by DEQ‐5: > 6 | Fortes 2011 | 2 | 46 | 4 | 52 | 0.33 (0.04 to 0.78) | 0.53 (0.43 to 0.63) | 0.04 | 0.93 | 0.71 | 1.26 | 0.06 | 0.04 | 0.07 |
| 131) Dry eye severity by DEQ‐5: > 3 | Fortes 2011 | 2 | 64 | 4 | 34 | 0.33 (0.04 to 0.78) | 0.35 (0.25 to 0.45) | 0.03 | 0.89 | 0.51 | 1.92 | 0.06 | 0.03 | 0.11 |
| 132) Dry eye severity by VAS: > 5.0 cm | Fortes 2011 | 1 | 17 | 6 | 80 | 0.14 (0.00 to 0.58) | 0.82 (0.73 to 0.89) | 0.06 | 0.93 | 0.82 | 1.04 | 0.07 | 0.06 | 0.07 |
| 133) Dry eye severity by VAS: > 1.1 cm | Fortes 2011 | 1 | 47 | 6 | 50 | 0.14 (0.00 to 0.58) | 0.52 (0.41 to 0.62) | 0.02 | 0.89 | 0.29 | 1.66 | 0.07 | 0.02 | 0.11 |
| 134) Dry eye severity by VAS: > 0.6 cm | Fortes 2011 | 3 | 61 | 4 | 36 | 0.43 (0.10 to 0.82) | 0.37 (0.28 to 0.48) | 0.05 | 0.90 | 0.68 | 1.54 | 0.07 | 0.05 | 0.10 |
| 135) NITBUT: < 6 sec | Fortes 2011 | 2 | 23 | 5 | 74 | 0.29 (0.04 to 0.71) | 0.76 (0.67 to 0.84) | 0.08 | 0.94 | 1.20 | 0.94 | 0.07 | 0.08 | 0.06 |
| 136) NITBUT: < 10 sec | Fortes 2011 | 3 | 52 | 4 | 45 | 0.43 (0.10 to 0.82) | 0.46 (0.36 to 0.57) | 0.05 | 0.92 | 0.80 | 1.23 | 0.07 | 0.05 | 0.08 |
| 137) NITBUT: < 27 sec | Fortes 2011 | 7 | 87 | 0 | 10 | 1.00 (0.59 to 1.00) | 0.10 (0.05 to 0.18) | 0.07 | 1.00 | 1.11 | 0 | 0.07 | 0.07 | 0 |
| 138) Balance: severe | Sjöstrand Healthy 2013 | 0 | 0 | 2 | 11 | 0.00 (0.00 to 0.84) | 1.00 (0.72 to 1.00) | # | 0.85 | # | 1.00 | 0.15 | # | 0.15 |
| Sjöstrand ED 2013 | 1 | 1 | 12 | 17 | 0.08 (0.00 to 0.36) | 0.94 (0.73 to 1.00) | 0.50 | 0.59 | 1.38 | 0.98 | 0.42 | 0.50 | 0.41 | |
| 139) Balance: ≥ moderate | Sjöstrand Healthy 2013 | 0 | 1 | 2 | 10 | 0.00 (0.00 to 0.84) | 0.91 (0.59 to 1.00) | 0 | 0.83 | 0 | 1.10 | 0.15 | 0 | 0.17 |
| Sjöstrand ED 2013 | 3 | 3 | 10 | 15 | 0.23 (0.05 to 0.54) | 0.83 (0.59 to 0.96) | 0.50 | 0.60 | 1.38 | 0.92 | 0.42 | 0.50 | 0.40 | |
| 140) Balance: any degree | Sjöstrand Healthy 2013 | 0 | 2 | 2 | 9 | 0.00 (0.00 to 0.84) | 0.82 (0.48 to 0.98) | 0.00 | 0.82 | 0.00 | 1.22 | 0.15 | 0.00 | 0.18 |
| Sjöstrand ED 2013 | 4 | 6 | 9 | 12 | 0.31 (0.09 to 0.61) | 0.67 (0.41 to 0.87) | 0.40 | 0.57 | 0.92 | 1.04 | 0.42 | 0.40 | 0.43 | |
| 141) Headache: severe | Sjöstrand Healthy 2013 | 0 | 0 | 2 | 11 | 0.00 (0.00 to 0.84) | 1.00 (0.72 to 1.00) | # | 0.85 | # | 1.00 | 0.15 | # | 0.15 |
| Sjöstrand ED 2013 | 0 | 0 | 13 | 18 | 0.00 (0.00 to 0.25) | 1.00 (0.81 to 1.00) | # | 0.58 | # | 1.00 | 0.42 | # | 0.42 | |
| 142) Headache: ≥ moderate | Sjöstrand Healthy 2013 | 0 | 0 | 2 | 11 | 0.00 (0.00 to 0.84) | 1.00 (0.72 to 1.00) | # | 0.85 | # | 1.00 | 0.15 | # | 0.15 |
| Sjöstrand ED 2013 | 0 | 0 | 13 | 18 | 0.00 (0.00 to 0.25) | 1.00 (0.81 to 1.00) | # | 0.58 | # | 1.00 | 0.42 | # | 0.42 | |
| 143) Headache: any degree | Sjöstrand Healthy 2013 | 0 | 3 | 2 | 8 | 0.00 (0.00 to 0.84) | 0.73 (0.39 to 0.94) | 0.00 | 0.80 | 0.00 | 1.375 | 0.15 | 0.00 | 0.20 |
| Sjöstrand ED 2013 | 1 | 3 | 12 | 15 | 0.08 (0.00 to 0.36) | 0.83 (0.59 to 0.96) | 0.25 | 0.56 | 0.46 | 1.11 | 0.42 | 0.25 | 0.44 | |
| 144) Nausea: severe | Sjöstrand Healthy 2013 | 0 | 0 | 2 | 11 | 0.00 (0.00 to 0.84) | 1.00 (0.72 to 1.00) | # | 0.85 | # | 1.00 | 0.15 | # | 0.15 |
| Sjöstrand ED 2013 | 0 | 0 | 13 | 18 | 0.00 (0.00 to 0.25) | 1.00 (0.81 to 1.00) | # | 0.58 | # | 1.00 | 0.42 | # | 0.42 | |
| 145) Nausea: ≥ moderate | Sjöstrand Healthy 2013 | 0 | 0 | 2 | 11 | 0.00 (0.00 to 0.84) | 1.00 (0.72 to 1.00) | # | 0.85 | # | 1.00 | 0.15 | # | 0.15 |
| Sjöstrand ED 2013 | 0 | 0 | 13 | 18 | 0.00 (0.00 to 0.25) | 1.00 (0.81 to 1.00) | # | 0.58 | # | 1.00 | 0.42 | # | 0.42 | |
| 146) Nausea: any degree | Sjöstrand Healthy 2013 | 0 | 0 | 2 | 11 | 0.00 (0.00 to 0.84) | 1.00 (0.72 to 1.00) | # | 0.85 | # | 1.00 | 0.15 | # | 0.15 |
| Sjöstrand ED 2013 | 0 | 4 | 13 | 14 | 0.00 (0.00 to 0.25) | 0.78 (0.52 to 0.94) | 0.00 | 0.52 | 0.00 | 1.29 | 0.42 | 0.00 | 0.48 | |
| 147) Muscle weakness: severe | Sjöstrand Healthy 2013 | 0 | 0 | 2 | 11 | 0.00 (0.00 to 0.84) | 1.00 (0.69 to 1.00) | # | 0.85 | # | 1.00 | 0.15 | # | 0.15 |
| Sjöstrand ED 2013 | 0 | 1 | 13 | 17 | 0.00 (0.00 to 0.25) | 0.94 (0.73 to 1.00) | 0.00 | 0.57 | 0 | 1.06 | 0.42 | 0.00 | 0.43 | |
| 148) Muscle weakness: ≥ moderate | Sjöstrand Healthy 2013 | 1 | 1 | 1 | 10 | 0.50 (0.01 to 0.99) | 0.91 (0.59 to 1.00) | 0.5 | 0.91 | 5.5 | 0.55 | 0.15 | 0.5 | 0.09 |
| Sjöstrand ED 2013 | 0 | 2 | 13 | 16 | 0.00 (0.00 to 0.25) | 0.89 (0.65 to 0.99) | 0.00 | 0.55 | 0.00 | 1.13 | 0.42 | 0.00 | 0.45 | |
| 149) Muscle weakness: any degree | Sjöstrand Healthy 2013 | 1 | 1 | 1 | 10 | 0.50 (0.01 to 0.99) | 0.91 (0.59 to 1.00) | 0.5 | 0.91 | 5.5 | 0.55 | 0.15 | 0.5 | 0.09 |
| Sjöstrand ED 2013 | 2 | 5 | 11 | 13 | 0.15 (0.02 to 0.45) | 0.72 (0.47 to 0.90) | 0.29 | 0.54 | 0.55 | 1.17 | 0.42 | 0.29 | 0.46 | |
| 150) Dizziness: severe | Sjöstrand Healthy 2013 | 0 | 0 | 2 | 11 | 0.00 (0.00 to 0.84) | 1.00 (0.72 to 1.00) | # | 0.85 | # | 1.00 | 0.15 | # | 0.15 |
| Sjöstrand ED 2013 | 1 | 1 | 12 | 17 | 0.08 (0.00 to 0.36) | 0.94 (0.73 to 1.00) | 0.50 | 0.59 | 1.38 | 0.98 | 0.42 | 0.50 | 0.41 | |
| 151) Dizziness: ≥ moderate | Sjöstrand Healthy 2013 | 1 | 0 | 1 | 11 | 0.50 (0.01 to 0.99) | 1.00 (0.72 to 1.00) | 1.00 | 0.92 | # | 0.50 | 0.15 | 1.00 | 0.08 |
| Sjöstrand ED 2013 | 2 | 2 | 11 | 16 | 0.15 (0.02 to 0.45) | 0.89 (0.65 to 0.99) | 0.50 | 0.59 | 1.38 | 0.95 | 0.42 | 0.50 | 0.41 | |
| 152) Dizziness: any degree | Sjöstrand Healthy 2013 | 1 | 0 | 1 | 11 | 0.50 (0.01 to 0.99) | 1.00 (0.72 to 1.00) | 1.00 | 0.92 | # | 0.50 | 0.15 | 1.00 | 0.08 |
| Sjöstrand ED 2013 | 3 | 5 | 10 | 13 | 0.23 (0.05 to 0.54) | 0.72 (0.47 to 0.90) | 0.38 | 0.57 | 0.83 | 1.07 | 0.42 | 0.38 | 0.43 |
$Current dehydration includes those with serum osmolality >300 mOsm/kg
# ‐ incalculable; BIA ‐ bioelectrical impedance analysis; BPM ‐ beats per minute; DOR ‐ diagnostic odds ratio; ECW ‐ extracellular water; FP ‐ false positive; FN ‐ false negative; ICW ‐ intracellular water; MMSE ‐ mini‐mental state exam; Neechum ‐ Neecham confusion scale; NITBUT ‐ non‐invasive tear film breakup time; NLR ‐ negative likelihood ratio; NPV negative predictive value; PLR positive likelihood ratio; PPV ‐ positive predictive value; T+ ‐ positive test result to T‐ = negative test result to TP ‐ true positive; TN ‐ true negative; TBW ‐ total body water; USG ‐ urine specific gravity; VAS ‐ visual analogue scale
No data included from Gaspar 2011a or Mack 1994 (as no participants had serum osmolality >300 mOsm/kg) to McGarvey 2010 (as no participants lost over 5% of body weight) or Shimizu 2012 or Eaton 1994 (as we only used published data to and the cut‐off for dehydration was used in the publication was 295 mOsm/kg)
Adequate sensitivity and specificity for impending dehydration (serum osmolality 295 to 300 mOsm/kg or equivalent); secondary target condition
As we had already carried out a large number of analyses assessing clinical symptoms, signs and tests of water‐loss dehydration and also tests of current water‐loss dehydration we decided not to run analyses of clinical symptoms, signs and tests of impending water‐loss dehydration (the other secondary target condition). As few tests were useful for water‐loss dehydration, or for current water‐loss dehydration, the lack of power involved in excluding those with current dehydration, at the same time as searching for tests of the less severe impending dehydration, suggested that there was little point in running a further set of analyses.
Clinical symptoms, signs and tests that are not useful in screening for water‐loss dehydration in older people
There was enough evidence to suggest that several stand‐alone tests that are often used to assess dehydration in older people were not useful, in that of at least four studies assessing the test none suggested appropriate sensitivity and specificity in any study for either water‐loss dehydration or current dehydration at any cut‐off. Additionally none of the studies suggested any efficacy in the ROC plots (post‐hoc analyses). The tests that were not appropriate to use and should not be relied on individually as ways of assessing presence or absence of dehydration in older people included assessments of fluid intake, USG, urine colour, urine volume, heart rate, dry mouth, feeling thirsty and BIA assessment of ICW or ECW.
Comparison between promising tests for water‐loss dehydration
We aimed to directly compare promising index tests (sensitivity ≥ 0.60 and specificity ≥ 0.75) where two or more were measured in a single study (direct comparison). There were only two promising measures for diagnosis of impending dehydration that could be compared: missing drinks between meals and expressing fatigue (each assessed in the same study, Kajii 2006). For missing drinks between meals Kajii 2006 studied 71 frail elderly people living at home in Japan and found sensitivity of 1.00 (95% CI 0.59 to 1.00) and specificity of 0.77 (95% CI 0.64 to 0.86), with a PLR of 4.27 and a NLR of zero. With a pre‐test probability of 10% a positive test took the probability to 32%, and a negative test the post‐test probability to 0%. For fatigue the point estimates of sensitivity (0.71, 95% CI 0.29 to 0.96) and specificity (0.75, 95% CI 0.63 to 0.85) were slightly less good, as were positive and NLRs (2.86 and 0.38). The pre‐test probability was of course also 10%, and the positive post‐test probability was less useful at 24%, and the negative post‐test probability 4%. It should be noted that Kajii 2006 was a small study and included only five older people with impending dehydration, and two with current dehydration.
No other studies assessed the utility of missing drinks between meals, but fatigue (any degree of fatigue) was assessed in two studies, neither of which suggested high levels of diagnostic utility (Sjöstrand Healthy 2013 found sensitivity of 0.30 (95% CI 0.07 to 0.65) but specificity of 1.00 (95% CI 0.29 to 1.00), and Sjöstrand ED 2013 found sensitivity of 0.42 (95% CI 0.23 to 0.63) and specificity of 0.80 (95% CI 0.28 to 0.99)).
We also planned bivariate meta‐regression to explore including a binary covariate for index test to understand if the expected sensitivity and specificity or both differed between index tests; however, there were insufficient studies with data on potentially useful tests to make this appropriate.
Combining several tests
We planned to carry out an exploratory analysis to assess the value of combining the best three index tests where the each had some predictive ability of their own, and individual studies included participants who had all three tests. There were no relevant three tests, but we did carry out an exploratory analysis to combine missing drinks between meals and expressing fatigue in the Kajii 2006 study dataset (Table 6).
5. Diagnostic accuracy of combining tests from a single study$.
| Test | Studies | TP | FP | FN | TN | Sensitivity | Specificity | PPV | NPV | PLR | NLR | Pre‐test probability | Post‐test probability given T+ | Post‐test probability given T‐ |
| 8) Misses drinks between meals | Kajii 2006 | 7 | 15 | 0 | 49 | 1.00 (0.59 to 1.00) | 0.77 (0.64 to 0.86) | 0.32 | 1 | 4.27 | 0 | 0.10 | 0.32 | 0 |
| 78) Fatigue | Kajii 2006 | 5 | 16 | 2 | 48 | 0.71 (0.29 to 0.96) | 0.75 (0.63 to 0.85) | 0.24 | 0.96 | 2.86 | 0.38 | 0.10 | 0.24 | 0.04 |
| 153) Combined fatigue AND missing drinks between meals | Kajii 2006 | 5 | 5 | 2 | 59 | 0.71 (0.29 to 0.96) | 0.92 (0.83 to 0.97) | 0.50 | 0.97 | 9.14 | 0.31 | 0.10 | 0.50 | 0.03 |
| 154) Either fatigue OR missing drinks between meals | Kajii 2006 | 7 | 26 | 0 | 38 | 1.00 (0.59 to 1.00) | 0.59 (0.46 to 0.71) | 0.21 | 1.00 | 2.46 | 0 | 0.10 | 0.21 | 0 |
$These are all assessing water‐loss dehydration to which includes those with impending (serum osmolality 295 to 300 mOsm/kg) and current (serum osmolality >300 mOsm/kg) dehydration
DOR ‐ diagnostic odds ratio; FP ‐ false positive; FN ‐ false negative; NLR ‐ negative likelihood ratio; NPV ‐ negative predictive value; PLR ‐ positive likelihood ratio; PPV ‐ positive predictive value; T+ ‐ is a positive test result to T‐ = is a negative test result; TN ‐ true negative; TP ‐ true positive
Combining two tests so that a person had to both miss some drinks between meals and express fatigue to be labelled as dehydrated, the test was both sensitive at 0.71 (95% CI 0.29 to 0.96) and specific 0.92 (95% CI 0.83 to 0.97), with PLRs of 9.14 and NLR of 0.31. From a pre‐test probability of 10% the probability of dehydration with a positive test jumped to 50%, and fell to 3% with a negative test. The DOR was 29.5. Combining tests so that a positive test was represented by an individual expressing either fatigue or missing drinks between meals had high sensitivity of 1.00 (95% CI 0.59 to 1.00), but specificity fell to 0.59 (95% CI 0.46 to 0.71) (below our threshold).
Discussion
Summary of main results
We aimed to determine the diagnostic accuracy of state (one time), minimally invasive clinical symptoms, signs and tests (collectively referred to as tests) to be used in screening for water‐loss dehydration (and current dehydration) in older people by systematically reviewing studies that have measured a reference standard and at least one index test in people aged 65 years and over. There are few published studies of the diagnostic accuracy of state, minimally invasive clinical symptoms, signs and tests to screen for water‐loss dehydration, so to complete the review we sought, analysed and included raw datasets that measured a reference standard and at least one index test in people aged 65 years and over.
We found three studies with published diagnostic accuracy data and a further 21 datasets that we analysed and included (using individual participant data).
There were 67 tests assessed (often at three cut‐offs) for diagnostic accuracy of water‐loss dehydration. Only three tests showed any ability to diagnose water‐loss dehydration (impending or current dehydration, serum osmolality ≥ 295 mOsm/kg) as stand‐alone tests (with sensitivity ≥ 0.60 and specificity ≥ 0.75).
Expressing fatigue (sensitivity 0.71 (95% CI 0.29 to 0.96), specificity 0.75 (95% CI 0.63 to 0.85), in 71 participants, Kajii 2006, but we found two additional studies with lower sensitivity, Sjöstrand ED 2013; Sjöstrand Healthy 2013)
Missing drinks between meals (sensitivity 1.00 (95% CI 0.59 to 1.00), specificity 0.77 (95% CI 0.64 to 0.86), 71 participants, one study only Kajii 2006)
BIA resistance at 50 kHz (sensitivities 1.00 (95% CI 0.48 to 1.00) and 0.71 (95% CI 0.44 to 0.90) and specificities of 1.00 (95% CI 0.69 to 1.00) and 0.80 (95% CI 0.28 to 0.99) in 15 and 22 people respectively for Allison 2005 and Powers 2012, but with sensitivities of 0.54 (95% CI 0.25 to 0.81) and 0.69 (95% CI 0.56 to 0.79) and specificities of 0.50 (95% CI0.16 to 0.84) and 0.19 (95% CI0.17 to 0.21) in 21 and 1947 people respectively in Kafri 2013 and Stookey 2005).
Post‐hoc ROC plot analyses suggested that drink intake, urine osmolality and axillial moisture may also have some diagnostic utility.
There was sufficient evidence to suggest that several stand‐alone tests often used to assess water‐loss dehydration in older people are not useful, and should not be relied upon. For these tests we found no individual studies, and no meta‐analyses at any cut‐off point, and no post‐hoc ROC plot where estimates of sensitivity were ≥ 60% and specificity ≥ 75%. These tests that should not be used individually included fluid intake, USG, urine colour, urine volume, heart rate, dry mouth, feeling thirsty and BIA assessment of ICW or ECW.
Missing drinks between meals and expressing fatigue were both assessed in a single study, and using a combination of these two tests improved the diagnostic utility of the assessment of impending dehydration, suggesting that combining tests may be a useful strategy to develop a diagnostic tool in future.
No tests were clearly useful in diagnosing current water‐loss dehydration (serum osmolality > 300 mOsm/kg).
Strengths and weaknesses of the review
Strengths of the review included searching out and including data that could help to elucidate diagnostic accuracy of tests of dehydration in older people, but where diagnostic accuracy had not been previously analysed or published. Weaknesses of the review included some heterogeneity in the reference standards accepted, the (potential lack of) equivalence of different levels of cut‐offs for the different reference standards, combining index tests that may have been carried out differently in different studies and with different equipment (in the case of bioelectrical impedance), having insufficient published data to confidently pre‐set three appropriate cut‐offs for continuous index tests, and lacking power to combine tests and develop a combined diagnostic test (which could be more powerful).
We accepted serum and plasma osmolality, serum osmolarity and weight change within seven days as reference standards. Serum and plasma osmolality are the ideal, and were used as the reference standard in 13/24 included studies (Bossingham 2005; Fletcher 1999; Fortes 2011; Gaspar 2011a; Johnson 2003; Kafri 2013; Kajii 2006; Lindner 2009; Mack 1994; Sjöstrand ED 2013; Sjöstrand Healthy 2013; Stookey 2005; Stotts 2009). A further seven included studies used calculated serum osmolarity. Most of these were studies that had collected serum data (Chassagne 2006; Culp 2003; Powers 2012; Rowat 2011; Source Study 2000), so we applied a standard osmolarity equation (2Na + 2K + urea + glucose, where all measures were in mmol/L). However, two studies that were included as published (where we had no access to the dataset) used different formulae. Shimizu 2012 used the formula 2Na + glucose/18 + BUN/2.8 (units were not stated, but presumably glucose was measured in mg/dL). The formula used by Allison 2005 was not provided. Eaton 1994, whose dataset was not obtainable, used a combination reference standard which declared dehydration when both serum osmolality was greater than 295 mOsm/kg and a urea/creatinine (mmol/L/μmol/L) ratio > 0.1. McGarvey 2010, Monahan 2006 and Perren 2011 measured body weight at baseline and again within seven days, and the reviewers used the change in weight over this period to assess dehydration, with weight change (up or down) of 3 to 5% of body weight indicating impending dehydration, and ≥ 5% current dehydration.
It was not clear that in older people there is a direct equivalence between serum or plasma osmolality at 295 mOsm/kg, serum osmolarity at 295 mOsm/L and a 3% weight loss (these were all the boundaries between being well hydrated and having impending dehydration), and there is debate over the best formula to use for osmolarity.
A great number of formulae have been published, but not tested in community‐dwelling older people to our knowledge (Fazekas 2013). Once a better understanding of the best formula to convert serum measures to predict measured osmolality is clear it may be appropriate to re‐run the analyses within this review that use serum osmolarity, and until then any limitations in the formula may cause some bias in the predicted diagnostic accuracy of potential tests.
Where weight change was used as the reference standard we assessed weight change in the time gap provided, but it may be that within a given time span dehydration develops and then corrects itself, so the time span may not be ideal for picking up all cases of dehydration.
Another danger is that dehydration in older people may develop gradually over time, so that although the 3% weight change within any seven day period is never achieved, dehydration occurs gradually. Weight change works very well in children and the sports context, where fluid change and so weight change is rapid, but may be less helpful in older people (Armstrong 2007). Conversely, during the conduct of this systematic review, an author published data on weight change in well hydrated hospitalised older people (Vivanti 2013). Weight fluctuation of each of the 10 participants (mean age 80.2 years, SD 4.2 years) over three days ranged from 1.1% to 3.6%, with 20% having weight fluctuations of more than 3%. This variability appeared to be due to daily fluctuations, and weights measured at the same time each day were least variable. This suggests that unless weights were assessed at the same time each day in our studies that weight change may be misleading as an indicator of dehydration. Some of the differences in sensitivity and specificity of individual tests may be due to differing reference standards.
Serum and plasma osmolality cut‐offs at 295 mOsm/kg (for impending dehydration) and > 300 mOsm/kg (for current dehydration) are widely used and recommended, but they are useful only if they are helpful in predicting health and well‐being of older people. There is some research that serum tonicity > 300 mOsm/L predicts mortality and disability in older people (Stookey 2004a), but more information is needed to assess whether osmolality or tonicity and at which cut‐offs are better predictors. Further work is needed to ensure that our reference standards for dehydration in older people are truly useful. We chose the boundary from hydration to impending dehydration (serum or plasma osmolality 295 mOsm/kg) for our primary analysis because we felt that tests of dehydration would ideally alert us to problems early, enabling remediation, and dehydration averted, before health consequences accrue.
A danger in having pre‐set cut‐offs for index tests, at which to assess diagnostic accuracy for this review, was that if we pre‐chose poorly for the continuous measures (highly likely given very limited information available on appropriate cut‐offs for most tests) that lack of diagnostic accuracy may simply reflect incorrect cut‐offs. For this reason we decided to carry out post‐hoc analyses to check the ROC plots in case diagnostic accuracy was actually high at another cut‐off. These are post‐hoc analyses, but can form the basis of further research on promising tests. These plots suggested that further research on measures of drinks intake, urinary osmolality, axillial moisture meters and BIA resistance at 50 kHz would be warranted.
Another potential weakness of the review is that we carried out a large number of analyses, increasing the probability of spurious raised sensitivity and specificity (although not many encouraging results were seen despite the large number of analyses). An advantage of assessing clinical symptoms, signs and tests of water‐loss dehydration (including those with either impending or current dehydration, so using the cut‐off for the reference tests of ≥ 295 mOsm/kg) is that it could be expected that any marker of impending dehydration would also work as a marker of current dehydration (cut‐off > 300 mOsm/kg). When we found that missing drinks between meals appeared to be a good a marker of water‐loss dehydration in Kajii 2006 (sensitivity 100% and specificity 77%) as well as of current dehydration (sensitivity 100% and specificity 71%) this encouraged us to feel that this may be a useful marker of dehydration. Similarly, the sensitivity (71%) and specificity (75%) of fatigue for water‐loss dehydration in Kajii 2006 were echoed for current dehydration (sensitivity 100%, specificity 72%). BIA resistance at 50 kHz with a cut‐off of ≥ 450 ohm in Allison 2005 and Powers 2012 showed good sensitivity and specificity for both water‐loss (Allison 2005 100%, 100% and Powers 2012 71%, 80%) and current dehydration (Allison 2005 100%, 85%, and Powers 2012 73%, 45%). However, it should be noted that sensitivity and specificity did not improve for current dehydration over water‐loss dehydration as might be expected, so did not clearly confirm the utility of these index tests. Additionally these may be artefactual correlations from within the same studies, so may not reinforce the suggestion of useful diagnostic accuracy. For post‐hoc ROC analyses drinks intake and BIA resistance at 50 kHz were positive at both water‐loss dehydration and current dehydration cut‐offs, but this was not the case for BIA TBW and we do not have any data for axillial moisture for current dehydration (so were unable to check).
None of the simple tests such as skin turgor or dry mouth were shown to be useful tests for water‐loss dehydration (although not all were excluded). Those that had a better chance of being useful were nursing‐type assessments (requiring an interviewer to ask about missing drinks between meals or feeling fatigue), that need response and recollection on the part of the older person, or were more technological (BIA resistance). If we are to use these tests with older people they will require careful attention to how any questions are asked or observations made, and whether the results can be generalised to other populations.
In clinical practice several tests may be intuitively or implicitly combined. This approach was not used in the review; we isolated single tests, removed from the patient‐frame or other signs or characteristics. We hoped to partially overcome this issue by combining potentially useful tests. This was possible for missing drinks between meals and expressing fatigue where a combination of these (so participants both missing some drinks between meals and expressing fatigue) produced a test with better sensitivity and specificity than either alone. This confirmed a promising avenue for exploring tests for dehydration in the future ‐ to combine tests with some level of diagnostic accuracy (and possibly also taking into account particular participant characteristics).
Timing may be important. It has been suggested that urinary measures will reflect effects of plasma osmolality and fluid intake over the previous 60 to 90 minutes, but early morning collections may be a better reflection of hydration status than those during the day when status may change more quickly. However, the timing of most urine samples used in this review was unclear, and often samples appeared to have been pooled over several hours or days.
It was not clear how generalisable the findings were that missing some drinks between meals and expressing fatigue may be useful tests for indicating impending dehydration. Missing some drinks between meals was only assessed in one high quality study of Japanese frail elderly people (Kajii 2006). Expressing fatigue was tested in three studies, but only achieved useful levels of diagnostic accuracy in one (Kajii 2006). Two studies in elderly Swedish volunteers (Sjöstrand Healthy 2013) and attending an emergency department (Sjöstrand ED 2013) also found high specificity, but lower levels of sensitivity (Kajii 2006 (71%, 75%); Sjöstrand ED 2013 (42%, 80%); Sjöstrand Healthy 2013 (30%, 100%)). This is perhaps surprising because fatigue could be expected to be a very common symptom in the elderly, relating to a variety of chronic illnesses. Therefore, it would seem likely that specificity (proportion of correctly identified true negatives) would be low, if one starts at a general population of frail older subjects; however, this was not seen, and specificity remained consistently high. Sensitivity (proportion of true positives which are correctly identified by the test) was lower in the Swedish studies. This consistent ability to identify older people (in healthy or frail community dwelling participants, and those attending an emergency department in Japan and Sweden) who did not have impending or current dehydration could be a very useful part of a composite set of tests to identify dehydration risk in older people.
While effort was made to ensure that all relevant studies were included, we are aware of several datasets that exist (or existed) but could not be included because original data could not be supplied. In many cases original datasets could not be found or shared for a variety of reasons including loss over time, computer problems that lost data or made data unreadable or institutional rules that precluded sharing of data (Albert 1989; Bowser‐Wallace 1985; Davies 1995; Faull 1993; Fredrix 1990; Gross 1992; Meuleman 1992; O'Neill 1992; O'Neill 1997; Olde Rikkert 1997; Olde Rikkert 1998; Rikkert 1997; Schut 2005; Telfer 1965; Thomas 2003; Tonstad 2006; Wakefield 2002a; Wakefield 2002b; Wakefield 2008). Furthermore, we were unable to establish contact with some authors to obtain datasets that almost certainly included relevant data (Bourdel‐Marchasson 2004; Bruzzone 2004; Chen 2006; Gil Cama 2003; Leiper 2005; Martof 1997; Morgan 2002; Morgan 2003; Piccoli 2000; Roberts 1991; Roos 1995; Rosher 2004; Shiraki 1980; Sugaya 2008; van Kraaij 1999).
Although several of these papers refer to the same individual datasets, it was likely that further studies were not located. Because most publications (including those actually included in the review) were not focused on diagnostic accuracy it is possible that this level of missing data did not reflect any particular publication or data bias in the included data, but this is not certain. It was not possible to formally assess publication bias (or small study bias) in this review. We would be delighted to incorporate data from these studies, and any others we have missed in future updates of this review.
There may well be other clinical symptoms, signs and tests that can help identify water‐loss dehydration in older people. Ongoing research is assessing a variety of measures including saliva flow and osmolality (Fortes 2014a) and an e‐nose (electronic sensing) tool for the diagnosis of dehydration (Olde Rikkert 2013 [pers comm]), and duplication of promising tests is also underway (Hooper 2012a).
Other types of assessments (such as ultrasound to assess inferior vena cava or right ventricular diameter), have been suggested to have some diagnostic ability in hypovolaemia of people of mixed ages in emergency departments (de Lorenzo 2012; Zengin 2013). However, water‐loss dehydration is primarily intracellular dehydration, rather than hypovolaemia, so is unlikely to be assessable in the same way. Datasets are being created in which composite tools or classification trees for assessment of impending dehydration may be developed (Hooper 2012a). We hope to incorporate these results into future updates of this review.
Applicability of findings to the review question
Our primary objective was to determine the diagnostic accuracy of state (one time), minimally invasive clinical symptoms, signs and tests to screen for water‐loss dehydration in older people by systematically reviewing studies that have measured a reference standard and at least one index test in people aged 65 years and over. We have assessed the diagnostic accuracy of a very long list of potential clinical symptoms, signs and tests in older people, and found limited evidence for the utility of missing some drinks between meals, expressing fatigue and a combination of these two tests, with weaker evidence for BIA resistance at 50 kHz. Further potentially useful tests (identified in post‐hoc analyses) include drinks intake, urine osmolality and axillial moisture.
Secondary objectives included:
To assess the effect of different cut‐offs of index test results assessed using continuous data on sensitivity and specificity in diagnosis of impending or current water‐loss dehydration. We achieved this by pre‐specifying cut‐offs for our index tests and applying post‐hoc analyses checking ROC plots where we may have missed useful cut‐offs. These plots suggested that further research on measures of drinks intake, urine osmolality, axillial moisture meters and BIA resistance at 50 kHz would be warranted
To identify clinical symptoms, signs and tests that may be used in screening for impending or current water‐loss dehydration in older people. There was insufficient evidence to clarify any single or combined tests that can be confidently used to identify impending or current dehydration in older people, but several promising tests have been highlighted. Potentially useful tests include missing some drinks between meals, expressing fatigue and a combination of these two tests, with weaker evidence for BIA resistance at 50 kHz, drinks intake, urine osmolality and axillial moisture.
To identify clinical symptoms, signs and tests that are not useful in screening for impending or current water‐loss dehydration in older people. Several tests that are commonly used by health professionals to assess dehydration in older people have been shown to be unhelpful, and their use misleading. These include urinary measures such as specific gravity and colour, orthostatic hypotension, skin turgor, capillary refill, dry mouth assessments, sunken eyes, thirst and headache. These should not be used as single measures to assess dehydration, however some of them may contribute to diagnostic accuracy in future combined tools.
To assess clinical symptoms, signs and tests of current dehydration (including all those with serum osmolality > 300 mOsm/kg). These analyses were limited as few participants had current dehydration (and some included studies had no participants with current dehydration) although it should theoretically be easier to identify as it has a stronger effect on the body. The only test found to be potentially useful was BIA resistance at 50 kHz at 450 ohm, though this was only seen to be useful in one of the four studies that assessed it.
To assess clinical symptoms, signs and tests of impending dehydration (including all those with serum osmolality 295 to 300 mOsm/kg). These analyses were not carried out due to high numbers of analyses already completed and limited data.
To directly compare promising index tests (sensitivity ≥ 0.60 and specificity ≥ 0.75) where two or more are measured in a single study (direct comparison). We only had data to compare two tests which were both used in a single study (Kajii 2006): missing some drinks between meals and expressing fatigue. In this direct comparison missing drinks between meals (sensitivity 100%, specificity 77%) appeared slightly better than expressing fatigue (sensitivity 71%, specificity 75%), but given the small size of the study, this needs to be clarified.
To carry out an exploratory analysis to assess the value of combining the best three index tests where the three tests each have some predictive ability of their own, and individual studies include participants who had all three tests. We found that combining the two tests above (participants both missing some drinks between meals and expressing fatigue) produced a stronger test than either alone (sensitivity 71%, specificity 92%), but this needs to be confirmed.
Authors' conclusions
Implications for practice.
At present there is no clear evidence for the use of any single clinical symptom, sign or test of water‐loss dehydration in older people. Where healthcare professionals currently rely on single tests in their assessment of dehydration in this population this practice should cease because it is likely to miss cases of dehydration (as well as misclassify those without water‐loss dehydration).
Implications for research.
Further research is needed to assess the utility of the promising single tests highlighted by this review (including missing drinks between meals, expressing fatigue, BIA resistance at 50 kHz, axillial moisture, urinary osmolality and assessment of drinks intake). Additionally, it will be useful to explore novel tests of dehydration in older people (including salivary and e‐nose measures). It is feasible that combinations or classification trees of tests will create useful composite tools for identification of impending or current dehydration.
We suggest that being able to use simple tests to pick up impending dehydration is important as a public health measure as it will enable us to work with older people to prevent the health impacts of dehydration and prevent more serious dehydration. Screening for current dehydration is also important, and will help us to treat older people, but the most clinically relevant target condition for screening tools needed in future research is impending dehydration.
We need to improve our understanding of the comparability of serum osmolarity and osmolarity (using different formulae), as well as changes in weight, to improve our understanding of the comparability of different reference standards in older adults. Even more fundamentally we need to better understand how serum osmolality, osmolarity and weight change, as indicators of dehydration, are linked to future health and wellbeing of older people.
Once a useful test or composite tool for detection of impending or current water‐loss dehydration has been identified and verified (by duplication in similar and less similar populations of older people), its place in the clinical and non‐clinical setting needs to be considered. In community settings such a test or tool may be used as an indicator to initiate support to improve drinking and/or assess medications to improve hydration. In the clinical setting, this may be used as a triage test for assessment of dehydration by measuring serum or plasma osmolality, which might be followed by intravenous fluids where hydration is compromised. Randomised trials of screening for dehydration using the verified test or tool will be needed to ensure that screening (along with protocols to help older people to improve their hydration when problems are identified) delivers benefits for health and well‐being (di Ruffano 2012).
Feedback
Reader comment, 7 May 2015
Summary
I enter all research uncertainties at the end of Cochrane reviews into UK DUETs, and was entering your review. We always enter any ongoing studies, so the end user of the database can decide if more research is required, or if they should wait to see what ongoing research is already being funded. In your review, it is near on impossible to find the studies you mention, and when they could be identified, they had already completed and should be listed in your review as awaiting assessment rather then ongoing. It does help the end user if they are listed correctly.
Reply
Dear Mark, these two studies were not yet analysed at the date of review submission (late 2013). At the suggestion of the Renal Group editors I have moved them to "Studies awaiting assessment". They will be added to the review when it is updated. Thank you for the feedback! All best wishes, Lee
Contributors
Comment: Mark Fenton. Editor, UK Database of Uncertainties about the Effects of Treatments (DUETs)
What's new
| Date | Event | Description |
|---|---|---|
| 2 July 2015 | Feedback has been incorporated | Feedback added |
Acknowledgements
We wish to thank the referees for their comments and feedback during the preparation of this review.
Many thanks to the following researchers for their helpful answers to our queries about their studies:
Stewart Albert, St Louis University (Albert 1989)
Robert D Allison, QVDSI, Waco (Allison 2005)
Elaine Bannerman, Queen Margaret University (Cunneen 2011)
Jill Bennett, Oregon Health & Science University (Bennett 2004)
Maciej S Buchowski, Vanderbilt University School of Medicine (Powers 2012)
Cheryl Chia‐Hui Chen, National Taiwan University (Chen 2010)
John B Cone, University of Arkansas for Medical Sciences (Bowser‐Wallace 1985)
Martin J Connolly, University of Auckland (Eaton 1994)
James Cooper, University of Georgia (Cooper 1991)
Mary Cushman, University of Vermont (REGARDS Study 2010)
Ioan Davies, Manchester Medical School (Davies 1995)
Christophe Faisy, European Georges Pompidou Hospital, Paris (Savalle 2012)
Christina M Faull, Leicestershire and Rutland Hospice (Faull 1993)
Dena Fischer, University of Illinois (Ship 1997)
Diane McNally Forsyth, Winona State University (Forsyth 2008)
Lily Fredrix, Open Universiteit Nederland (Fredrix 1990)
Cynthia Gross, University of Minnesota (Gross 1992)
David H Holben, Ohio University (Holben 1999)
George Howard, UAB School of Medicine (REGARDS Study 2010)
Peter Johnson, Södertälje Hospital (Johnson 2012 [pers comm]; Johnson 2013 [pers comm])
Tony Johnson, Orbimed Advisors LLC (Johnson 1994)
Theodore M Johnson, Birmingham/Atlanta VA GRECC, Atlanta VA/Emory University (Johnson 2003)
Jeanie Kayser‐Jones, University of California San Francisco (Kayser‐Jones 1999)
Joseph J Kehayias, Tufts University (Kehayias 2012)
Arthur Leibovitz, Shmuel Harofe Hospital, Israel (Leibovitz 2007)
Iain Lennox, South Glasgow University Hospitals NHS Trust (Lennox 1980)
Constantine A Manthous, Yale University School of Medicine (Vazquez 2010)
Elisabetta Marini, University of Cagliari, (Buffa 2010)
James McGarvey, was Auckland University, now Unisports Sports Medicine Centre, (McGarvey 2010)
John Meuleman, University of Florida (Meuleman 1992)
Ruth Mitchell, Cochrane Kidney and Transplant Trials Search Co‐ordinator, who developed and ran the electronic searches
Ken Monahan, Vanderbilt University Medical Center (Monahan 2006)
Zobair Nagamia, Emory University School of Medicine (Johnson 2003)
Paul O'Neill, University of Manchester (O'Neill 1992; O'Neill 1997)
Paul M Palevsky, University of Pittsburgh (Palevsky 1996)
Michael Persoff, retired nephrologist (Telfer 1965)
Paddy Phillips, Chief Medical Officer, South Australia (Phillips 1984)
Alexander Rösler, University of Hamburg (Rosler 2010)
Barbara Rolls, Pennsylvania State University (Phillips 1984)
James L Rudolph, Brigham and Women's Hospital, Boston (Rudolph 2011)
Annemie Schols, Maastricht University (Schols 1991)
Lauri Seinelä, Services for Elderly People, Tampere (Seinela 2003)
Sandra F Simmons, Vanderbilt University (Simmons 2001)
Alice Spangler, Ball State University (Spangler 1998)
Parlindungan Siregar, University of Indonesia (Siregar 2010)
Manjula K Tamura, Stanford University School of Medicine (REGARDS Study 2010)
Serena Tonstad, Ullevål University Hospital (Tonstad 2006)
Jenny van der Steen, VU University Medical Center, Amsterdam (van der Steen 2007)
Jean‐Pierre Vincent, Hospitalier Emile Roux, France (Schut 2005)
Klaas Westerterp, Maastricht University (Fredrix 1990).
Appendices
Appendix 1. Electronic search strategy
| Database | Search terms |
| MEDLINE (OvidSP) |
|
| EMBASE (OvidSP) |
|
| CINAHL | S55 S51 NOT S54 S54 S53 NOT S52 S53 MH "Adult" OR MH "Middle Age" S52 (MH "Adult" OR MH "Middle Age") AND MH "Aged+" S51 S49 NOT S50 S50 (MH "Adolescence+") OR (MH "Young Adult") OR (MH"Child+") S49 S43 AND S48 S48 S21 OR S47 S47 S44 OR S45 OR S46 S46 AB ("65 and over" OR "sixty five years" OR geriatric OR geriatrics OR senile OR senility OR old age) S45 AB elder* S44 AB (older adult* OR older people OR older person OR older patient* OR older women OR older men) S43 S14 OR S42 S42 S23 or S24 or S25 or S26 or S27 or S28 or S29 or S30 or S31 or S32 or S33 or S34 or S35 or S36 or S37 or S38 or S39 or S40 or S41 S41 AB osmolalit* S40 AB (hemoconcentrat* OR haemoconcentrat*) S39 AB (water N3 intracellular) S38 AB (water N3 extracellular) S37 AB (water N3 body) S36 AB (water N3 status) S35 AB (water N3 imbalance*) S34 AB (water N3 balance*) S33 AB (plasma* N3 hypertonic*) S32 AB (plasma* N3 hypotonic*) S31 AB (plasma* N3 tonicit*) S30 AB (hypokal* OR hyperkal* OR hyponatr* OR hypernatr* OR hypovolemi* OR hypovolaemi*) S29 AB (fluid* N3 intracellular) S28 AB (fluid* N3 extracellular) S27 AB (fluid* N3 body) S26 AB (fluid* N3 status) S25 AB (fluid* N3 imbalance*) S24 AB (fluid* N3 balance*) S23 AB (dehydrat* OR hydrat*) S22 S14 and S21 S21 S15 or S16 or S17 or S18 or S19 or S20 S20 (MH "Gerontologic Nursing+") S19 TI ("65 and over" OR "sixty five years" OR geriatric OR geriatrics OR senile OR senility OR old age) S18 TI elder* S17 TI (older adult* OR older people OR older person OR older patient* OR older women OR older men) S16 (MH "Nursing Homes+") OR (MH "Nursing Home Patients") S15 (MH "Aged+") OR (MH "Aged, 80 and Over") OR (MH "Aged, Hospitalized") OR (MH "Assisted Living") OR (MH "Gerontologic Care") OR (MH "Gerontologic Nursing+") S14 S1 or S2 or S3 or S4 or S7 or S8 or S11 or S12 or S13 S13 TI smolalit* S12 TI (hemoconcentrat* OR haemoconcentrat*) S11 S9 and S10 S10 TI (tonicit* OR hypertonic* OR hypotonic*) S9 TI plasma* S8 TI (hypokal* OR hyperkal* OR hyponatr* OR hypernatr* OR hypovolemi* OR hypovolaemi*) S7 S5 and S6 S6 TI balance* OR TI imbalance* OR TI status OR TI body OR TI extracellular OR TI intracellular S5 TI fluid* OR TI water S4 TI dehydrat* OR TI hydrat* S3 (MH "Osmolar Concentration+") S2 (MH "Fluid‐Electrolyte Imbalance") OR (MH "Fluid‐Electrolyte Balance+") S1 (MH "Dehydration") OR (MH "Hyperkalemia") OR (MH "Hypokalemia") OR (MH "Hypernatremia") OR (MH "Hyponatremia") |
MEDLINE
Lines 1‐17: terms for the participants
Lines 18‐34: terms for the target condition
Line 35: participants and target condition
Lines 36 to 88: index tests to grouped by type
Line 89: participants and target condition and index tests
Lines 90‐91: removing studies indexed as Animal/ only from search (retains Humans/ and Animals/ to or studies with neither index term)
Line 92‐93: removes studies with case report in the title of the article
EMBASE
This strategy has been constructed along similar lines to MEDLINE, but using available EMTREE terms
CINAHL
Due to current difficulties in searching the EBSCO interface for CINAHL (the only interface available) we have used terms only for participants and target condition. Title words/phrases and abstract words/phrases are grouped separately. This was done to get some idea of the yield from leaving out the index tests. There is a risk that some relevant studies may have been missed, but the search interface cannot cope with complex boolean searching or large numbers of search lines, and failed when this was attempted.
Lines S1‐S14: CINAHL headings and word in title for the target condition
Lines S15‐S21: CINAHL headings and words in title for participants
Lines S22: target condition and participants combined (to get some idea of yield)
Lines S23‐S42: abstract words for target condition
Line S43: CINAHL headings or title or abstract words for target condition
Lines S44‐S47: abstract words for participants
Line S48: CINAHL headings or title or abstract words for participants
Line S49: target condition and participants
Line S50‐S55: removal of articles indexed only with CINAHL headings for people younger than 65 years
Appendix 2. Criteria for assessment of study validity
| Quality assessment area | Score | Criteria |
| Representative spectrum | Yes | Where participants were older people living in the community independently or with care (for example, sheltered housing, communities for older people or in residential care homes, NOT in hospital or other medical settings or where people were chosen for the presence of a risk factor, medical condition or illness) AND the method of recruitment was consecutive, or random samples were taken from consecutive series |
| No | One or more of the above criteria clearly not met | |
| Unclear | Where it is unclear whether either or both criteria were met | |
| Acceptable reference standard | Yes | Cut‐offs used to define dehydration
|
| No | The definition was similar, but not exactly the same OR serum osmolality was calculated rather than measured, or the reference standard was weight change | |
| Unclear | It is not clear whether the definition is exactly the same, or that the serum osmolality was measured (rather than calculated) | |
| Acceptable delay between tests | Yes | Delay ≤ 2 hours between the index text(s) and the reference standard (for at least 90% of participants) |
| No | Delay > 2 hours for over 10% of the participants | |
| Unclear | Any delay not stated or variable | |
| Partial verification avoided |
Yes | All, or a random selection of, participants who received the index test went on to receive verification of their disease status using a reference standard, even if the reference standard was not the same for all participants. For this to be assumed the study design should be prospective |
| No | Some patients who received the index test did not receive the reference standard, and the selection of patients to receive the reference standard was not random | |
| Unclear | Unclear | |
| Differential verification avoided | Yes | The same reference standard was used in all patients |
| No | Different reference standards were used in some patients | |
| Unclear | Unclear | |
| Incorporation avoided | Yes | The index test did not form part of the reference standard |
| No | The index test was formally part of the reference standard | |
| Unclear | Unclear | |
| Reference standard results blinded | Yes | Reference standard results were interpreted blind to the results of the index test(s), or blinding was dictated by the test order |
| No | The reference standard results were interpreted with knowledge of the index test(s) results | |
| Unclear | Unclear | |
| Index test results blinded | Yes | Index test results were interpreted blind to the results of the reference test, or blinding was dictated by the test order |
| No | The index test results were interpreted with knowledge of the reference test results | |
| Unclear | Unclear | |
| Relevant clinical information | Yes | Interpretation of the index and reference tests were without reference to other potentially relevant clinical data, such as knowledge of previously dehydrated episodes and/or current risk factors for dehydration (such as fever, vomiting, diarrhoea, lack of appetite, dementia, depression etc) |
| No | Data were interpreted only with added clinical data | |
| Unclear | Unclear | |
| Uninterpretable test results reported | Yes | The number of uninterpretable test results was stated, or the number of results reported agreed with the number of patients recruited (indicating no uninterpretable test results) |
| No | Uninterpretable test results occurred or were excluded but it was not reported how many tests were uninterpretable | |
| Unclear | It is unclear uninterpretable results occurred | |
| Withdrawals explained | Yes | It was clear what happened to all patients who entered the study (e.g. flow diagram of study participants explains any withdrawals or exclusions), or the numbers recruited match those in the analysis |
| No | Some of the people who entered the study did not receive both index test and reference standard, or were not included in the analysis, and were not accounted for | |
| Unclear | Unclear | |
| Was the study free of commercial funding? | Yes | Funding was stated, and it was clear that this was not from a source likely to benefit from a specific study result AND author allegiances stated and none allied to a source likely to benefit from specific study result |
| No | Study funding or author allegiance from a source likely to benefit from a specific study result | |
| Unclear | Funding and/or allegiances not stated or their link to study results not clear |
Data
Presented below are all the data for all of the tests entered into the review.
Tests. Data tables by test.
1. Test.
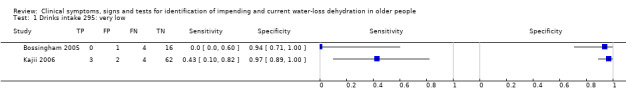
Drinks intake 295: very low.
2. Test.
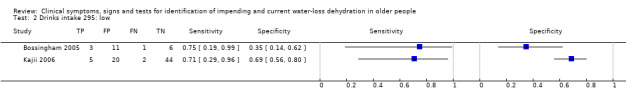
Drinks intake 295: low.
3. Test.
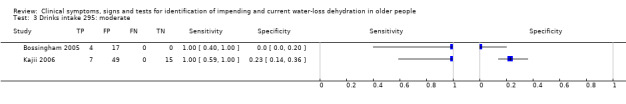
Drinks intake 295: moderate.
4. Test.
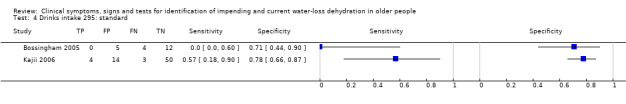
Drinks intake 295: standard.
5. Test.
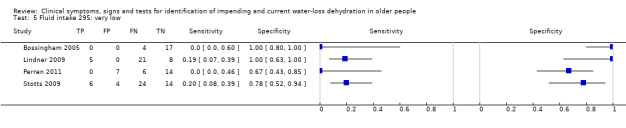
Fluid intake 295: very low.
6. Test.
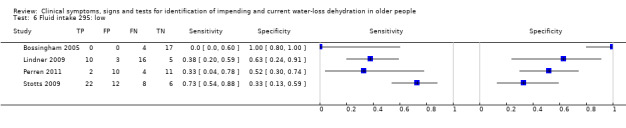
Fluid intake 295: low.
7. Test.
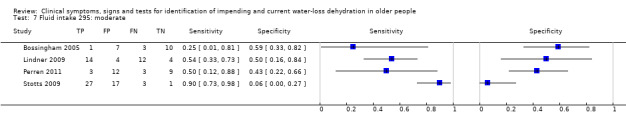
Fluid intake 295: moderate.
8. Test.
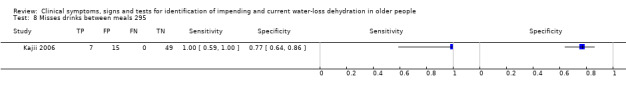
Misses drinks between meals 295.
9. Test.
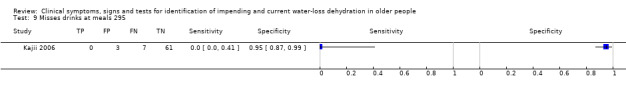
Misses drinks at meals 295.
10. Test.
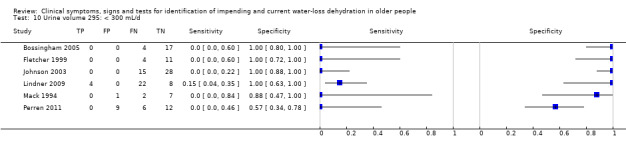
Urine volume 295: < 300 mL/d.
11. Test.
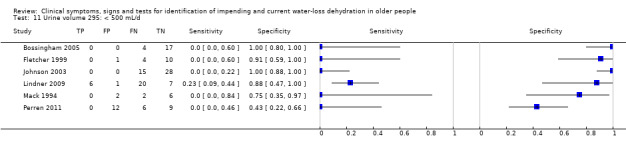
Urine volume 295: < 500 mL/d.
12. Test.
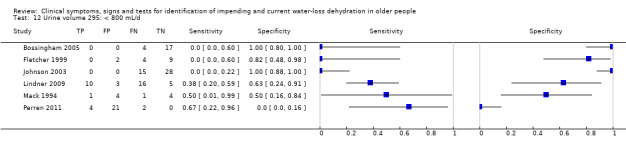
Urine volume 295: < 800 mL/d.
13. Test.
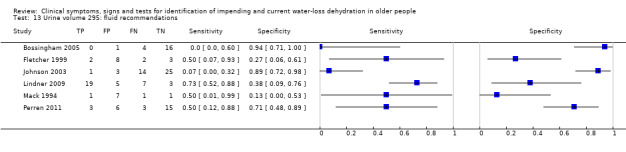
Urine volume 295: fluid recommendations.
14. Test.
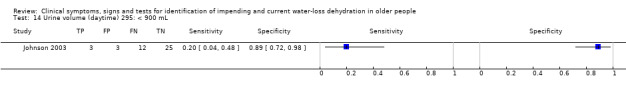
Urine volume (daytime) 295: < 900 mL.
15. Test.
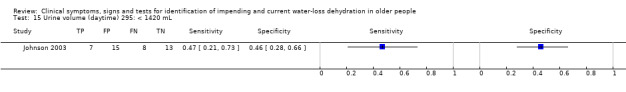
Urine volume (daytime) 295: < 1420 mL.
16. Test.
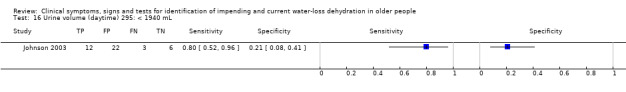
Urine volume (daytime) 295: < 1940 mL.
17. Test.
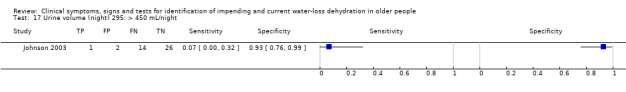
Urine volume (night) 295: > 450 mL/night.
18. Test.
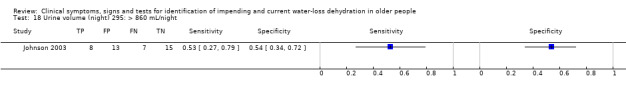
Urine volume (night) 295: > 860 mL/night.
19. Test.
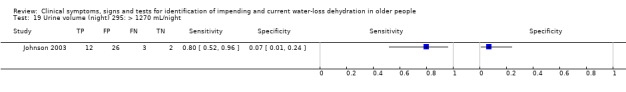
Urine volume (night) 295: > 1270 mL/night.
20. Test.
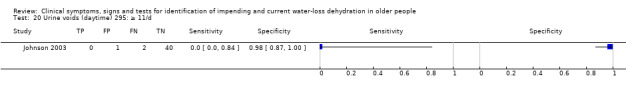
Urine voids (daytime) 295: ≥ 11/d.
21. Test.
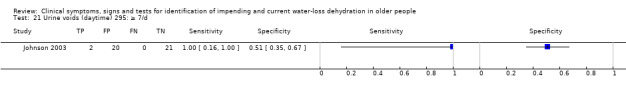
Urine voids (daytime) 295: ≥ 7/d.
22. Test.
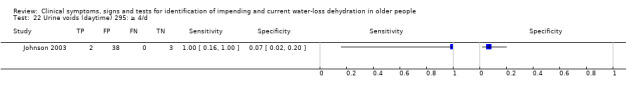
Urine voids (daytime) 295: ≥ 4/d.
23. Test.
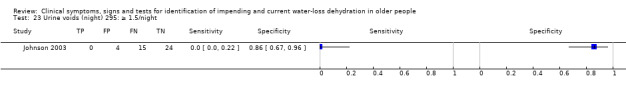
Urine voids (night) 295: ≥ 1.5/night.
24. Test.
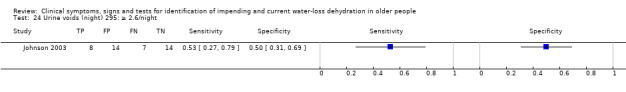
Urine voids (night) 295: ≥ 2.6/night.
25. Test.
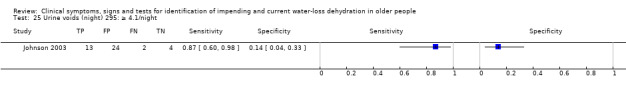
Urine voids (night) 295: ≥ 4.1/night.
26. Test.
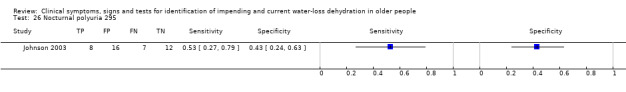
Nocturnal polyuria 295.
27. Test.
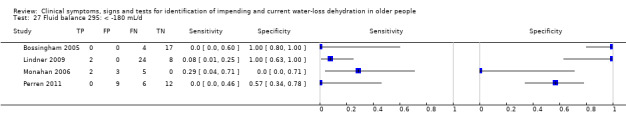
Fluid balance 295: < ‐180 mL/d.
28. Test.
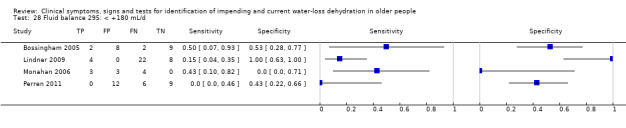
Fluid balance 295: < +180 mL/d.
29. Test.
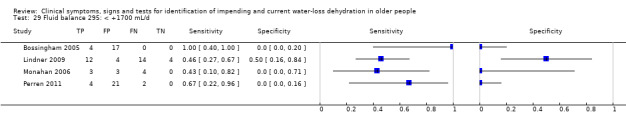
Fluid balance 295: < +1700 mL/d.
30. Test.
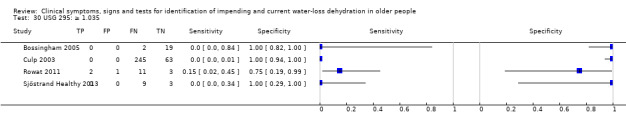
USG 295: ≥ 1.035.
31. Test.
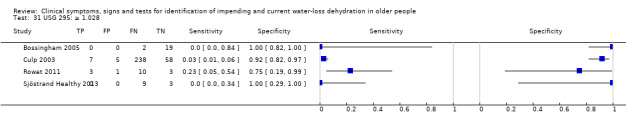
USG 295: ≥ 1.028.
32. Test.
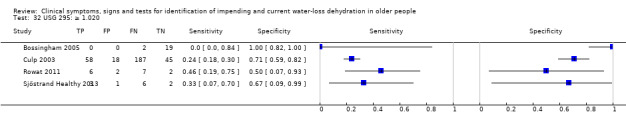
USG 295: ≥ 1.020.
33. Test.
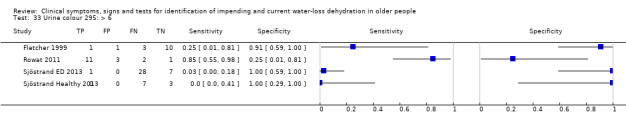
Urine colour 295: > 6.
34. Test.
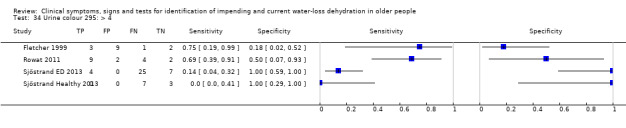
Urine colour 295: > 4.
35. Test.
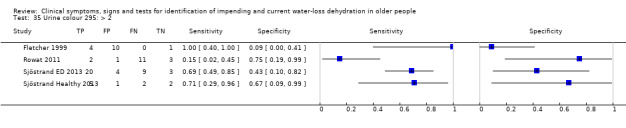
Urine colour 295: > 2.
36. Test.
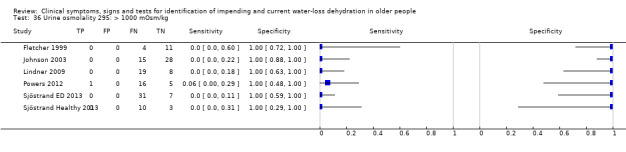
Urine osmolality 295: > 1000 mOsm/kg.
37. Test.
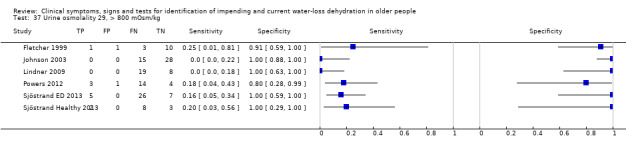
Urine osmolality 29, > 800 mOsm/kg.
38. Test.
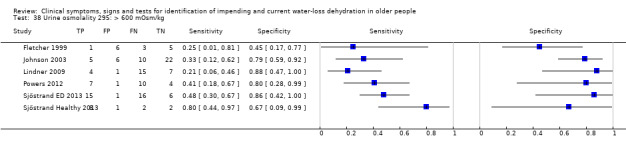
Urine osmolality 295: > 600 mOsm/kg.
39. Test.
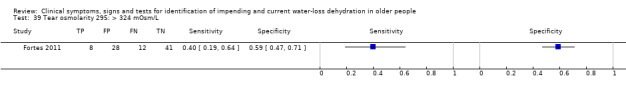
Tear osmolarity 295: > 324 mOsm/L.
40. Test.
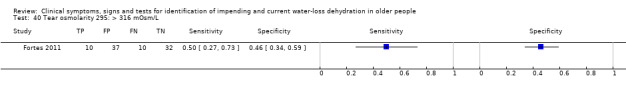
Tear osmolarity 295: > 316 mOsm/L.
41. Test.

Tear osmolarity 295: > 310 mOsm/L.
42. Test.
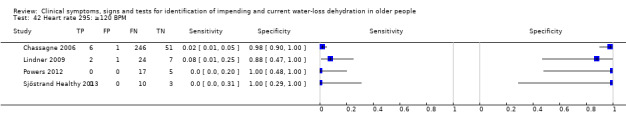
Heart rate 295: ≥120 BPM.
43. Test.
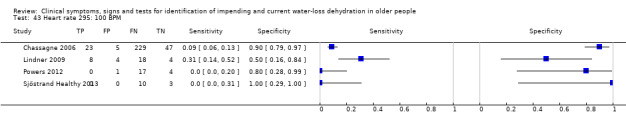
Heart rate 295: 100 BPM.
44. Test.
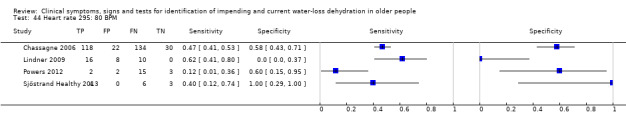
Heart rate 295: 80 BPM.
45. Test.
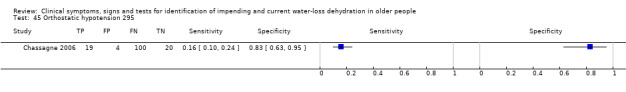
Orthostatic hypotension 295.
46. Test.
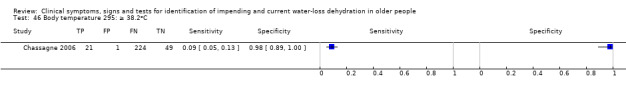
Body temperature 295: ≥ 38.2oC.
47. Test.
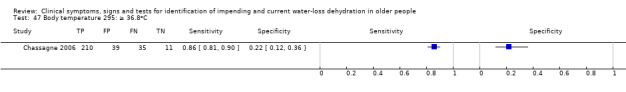
Body temperature 295: ≥ 36.8oC.
48. Test.
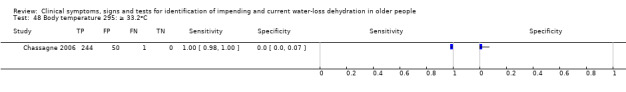
Body temperature 295: ≥ 33.2oC.
49. Test.
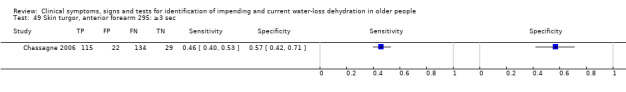
Skin turgor, anterior forearm 295: ≥3 sec.
50. Test.
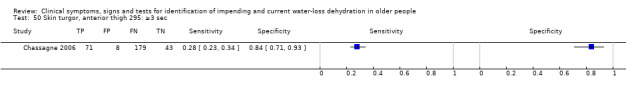
Skin turgor, anterior thigh 295: ≥3 sec.
51. Test.
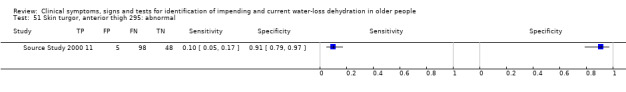
Skin turgor, anterior thigh 295: abnormal.
52. Test.
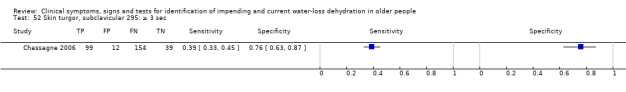
Skin turgor, subclavicular 295: ≥ 3 sec.
53. Test.
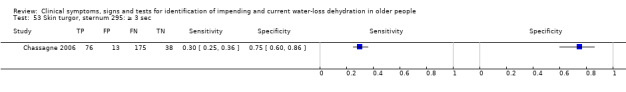
Skin turgor, sternum 295: ≥ 3 sec.
54. Test.
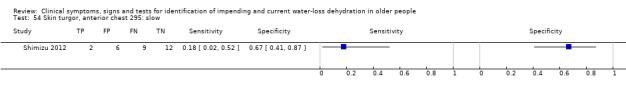
Skin turgor, anterior chest 295: slow.
55. Test.
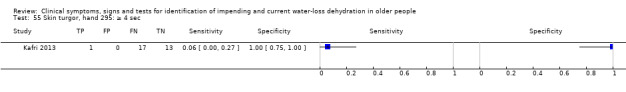
Skin turgor, hand 295: ≥ 4 sec.
56. Test.
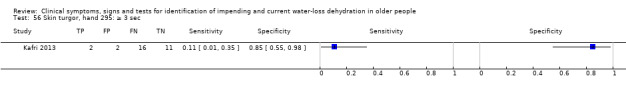
Skin turgor, hand 295: ≥ 3 sec.
57. Test.
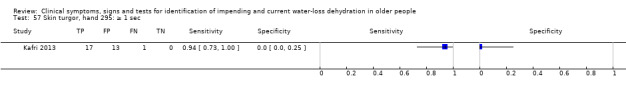
Skin turgor, hand 295: ≥ 1 sec.
58. Test.
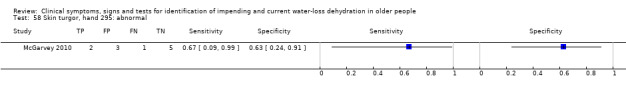
Skin turgor, hand 295: abnormal.
59. Test.
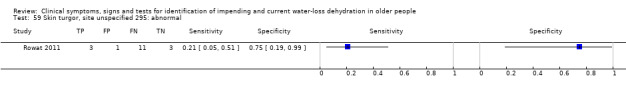
Skin turgor, site unspecified 295: abnormal.
60. Test.

Capillary refill 295: ≥ 4 sec.
61. Test.
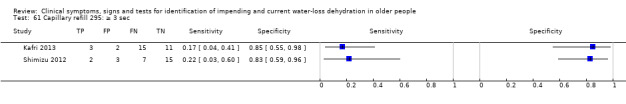
Capillary refill 295: ≥ 3 sec.
62. Test.
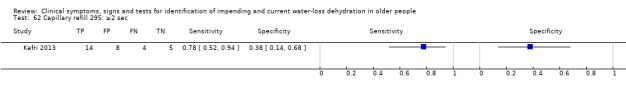
Capillary refill 295: ≥2 sec.
63. Test.
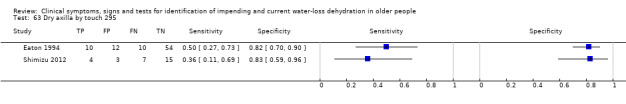
Dry axilla by touch 295.
64. Test.
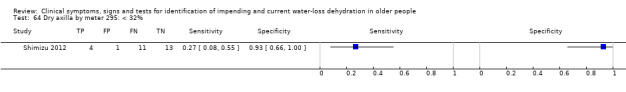
Dry axilla by meter 295: < 32%.
65. Test.
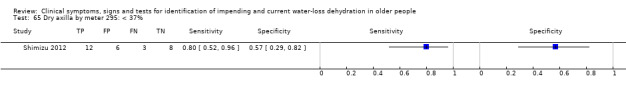
Dry axilla by meter 295: < 37%.
66. Test.
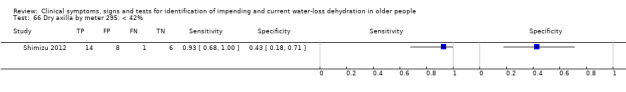
Dry axilla by meter 295: < 42%.
67. Test.
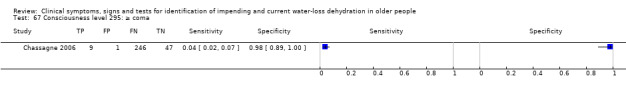
Consciousness level 295: ≥ coma.
68. Test.
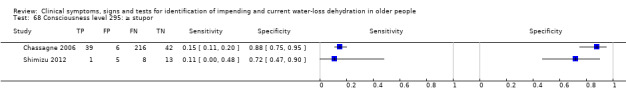
Consciousness level 295: ≥ stupor.
69. Test.
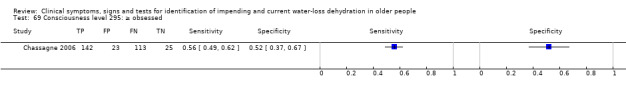
Consciousness level 295: ≥ obsessed.
70. Test.
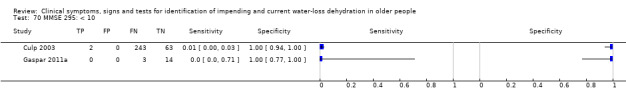
MMSE 295: < 10.
71. Test.
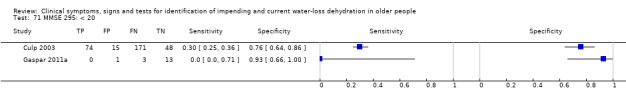
MMSE 295: < 20.
72. Test.
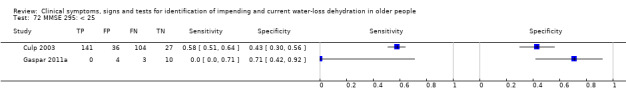
MMSE 295: < 25.
73. Test.
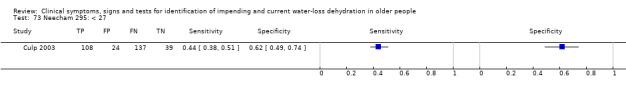
Neecham 295: < 27.
74. Test.
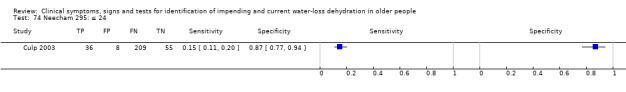
Neecham 295: ≤ 24.
75. Test.
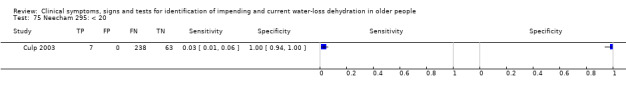
Neecham 295: < 20.
76. Test.
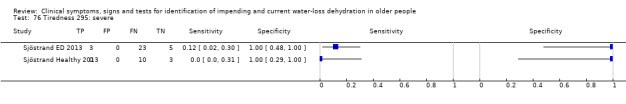
Tiredness 295: severe.
77. Test.
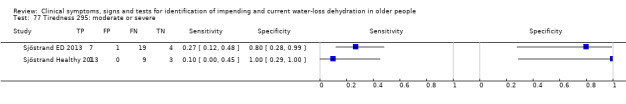
Tiredness 295: moderate or severe.
78. Test.
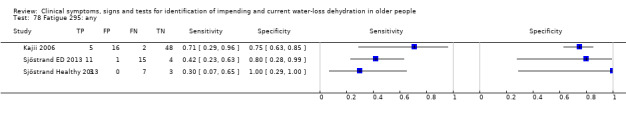
Fatigue 295: any.
79. Test.
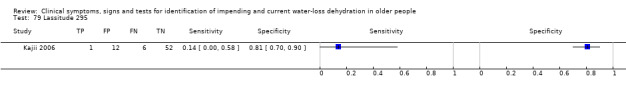
Lassitude 295.
80. Test.
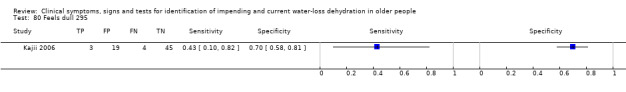
Feels dull 295.
81. Test.
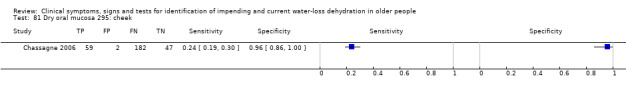
Dry oral mucosa 295: cheek.
82. Test.
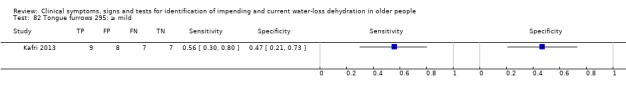
Tongue furrows 295: ≥ mild.
83. Test.
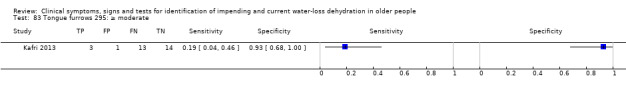
Tongue furrows 295: ≥ moderate.
84. Test.
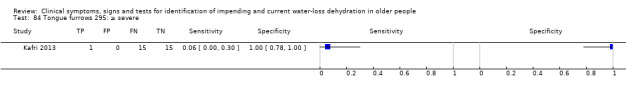
Tongue furrows 295: ≥ severe.
85. Test.
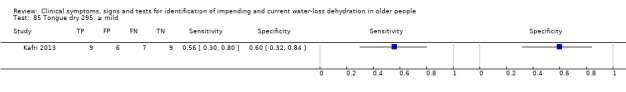
Tongue dry 295: ≥ mild.
86. Test.
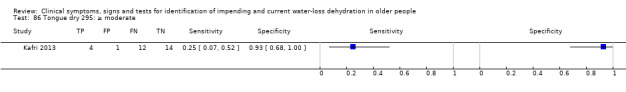
Tongue dry 295: ≥ moderate.
87. Test.
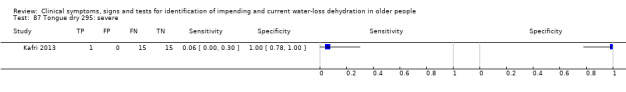
Tongue dry 295: severe.
88. Test.
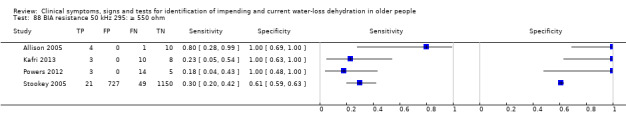
BIA resistance 50 kHz 295: ≥ 550 ohm.
89. Test.
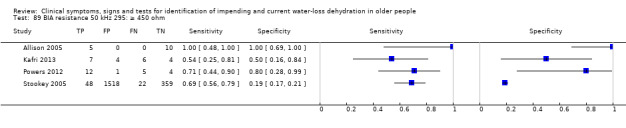
BIA resistance 50 kHz 295: ≥ 450 ohm.
90. Test.
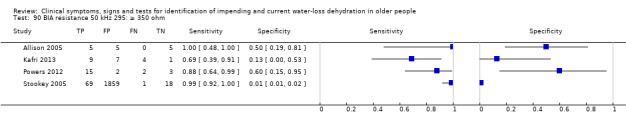
BIA resistance 50 kHz 295: ≥ 350 ohm.
91. Test.
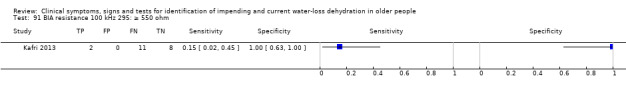
BIA resistance 100 kHz 295: ≥ 550 ohm.
92. Test.
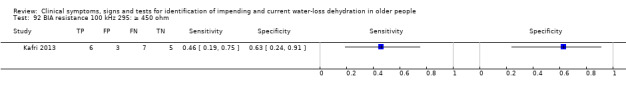
BIA resistance 100 kHz 295: ≥ 450 ohm.
93. Test.
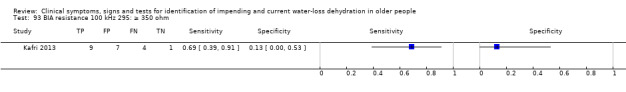
BIA resistance 100 kHz 295: ≥ 350 ohm.
94. Test.
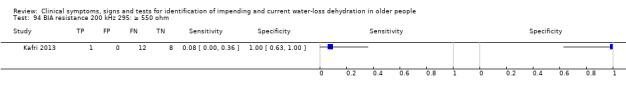
BIA resistance 200 kHz 295: ≥ 550 ohm.
95. Test.
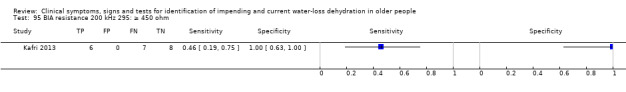
BIA resistance 200 kHz 295: ≥ 450 ohm.
96. Test.
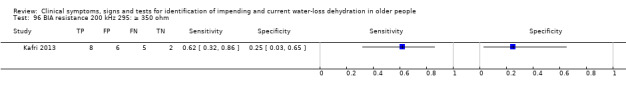
BIA resistance 200 kHz 295: ≥ 350 ohm.
97. Test.
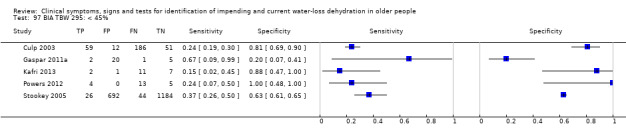
BIA TBW 295: < 45%.
98. Test.
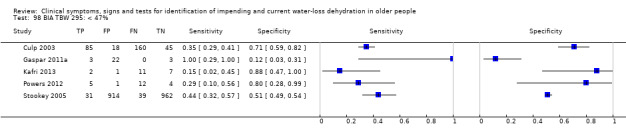
BIA TBW 295: < 47%.
99. Test.
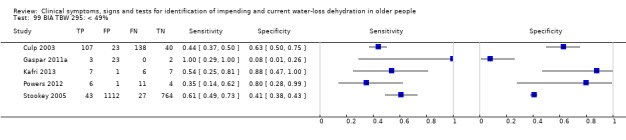
BIA TBW 295: < 49%.
100. Test.
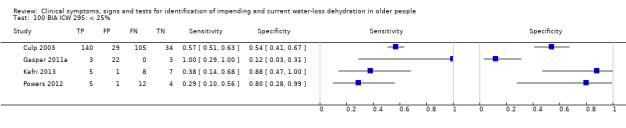
BIA ICW 295: < 25%.
101. Test.
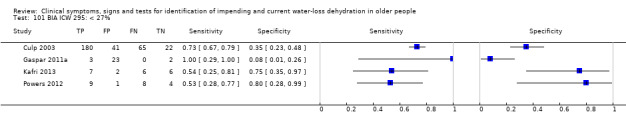
BIA ICW 295: < 27%.
102. Test.
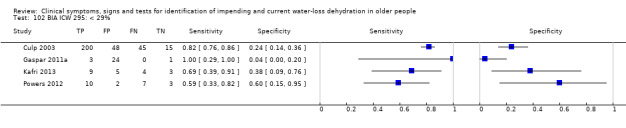
BIA ICW 295: < 29%.
103. Test.
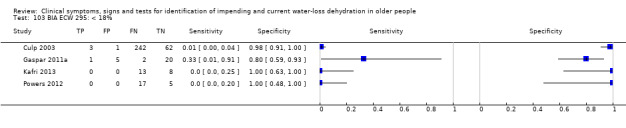
BIA ECW 295: < 18%.
104. Test.
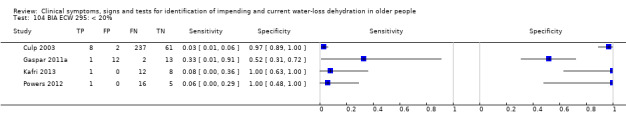
BIA ECW 295: < 20%.
105. Test.
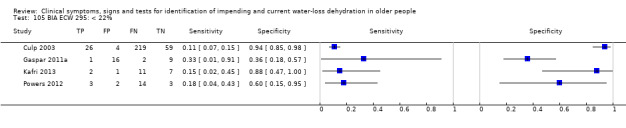
BIA ECW 295: < 22%.
106. Test.
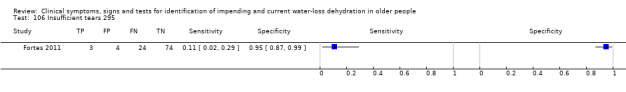
Insufficient tears 295.
107. Test.
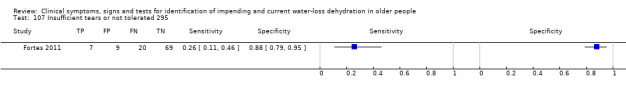
Insufficient tears or not tolerated 295.
108. Test.
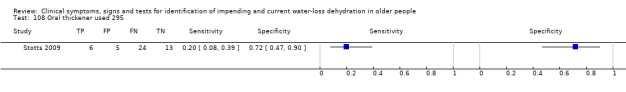
Oral thickener used 295.
109. Test.
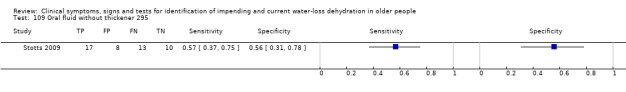
Oral fluid without thickener 295.
110. Test.
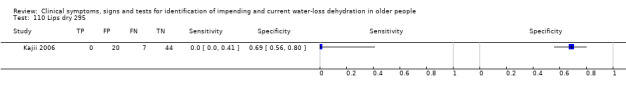
Lips dry 295.
111. Test.
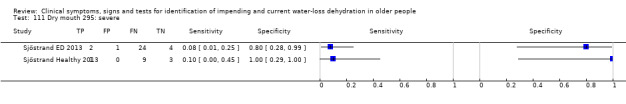
Dry mouth 295: severe.
112. Test.
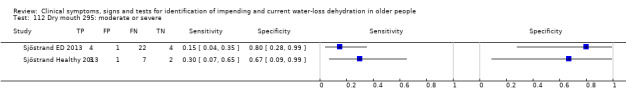
Dry mouth 295: moderate or severe.
113. Test.
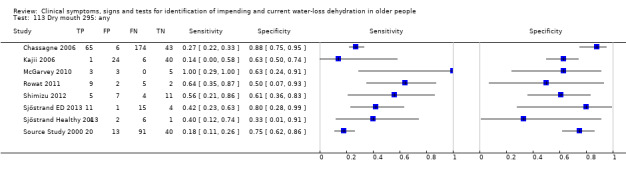
Dry mouth 295: any.
114. Test.
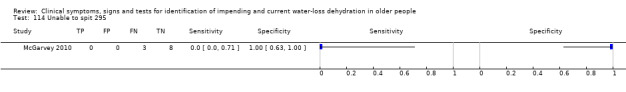
Unable to spit 295.
115. Test.
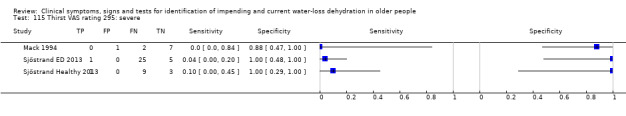
Thirst VAS rating 295: severe.
116. Test.
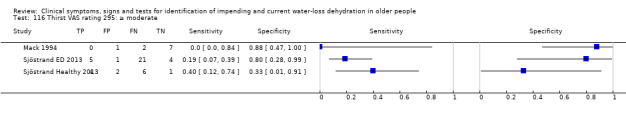
Thirst VAS rating 295: ≥ moderate.
117. Test.
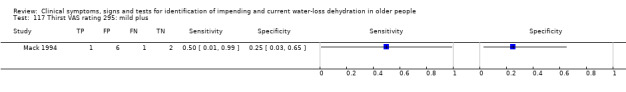
Thirst VAS rating 295: mild plus.
118. Test.
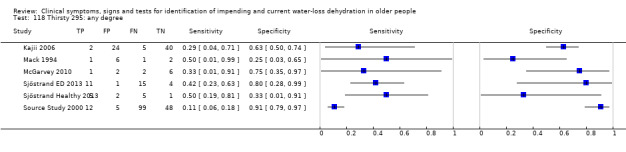
Thirsty 295: any degree.
119. Test.
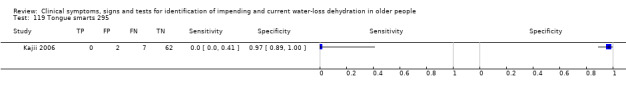
Tongue smarts 295.
120. Test.
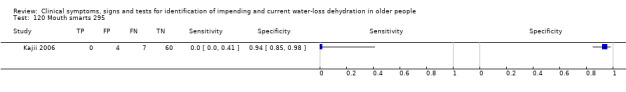
Mouth smarts 295.
121. Test.
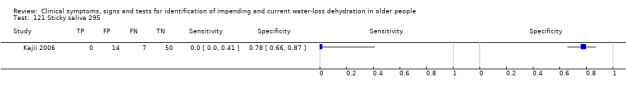
Sticky saliva 295.
122. Test.

Sticky mouth 295.
123. Test.
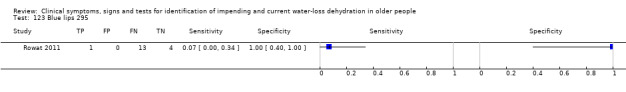
Blue lips 295.
124. Test.
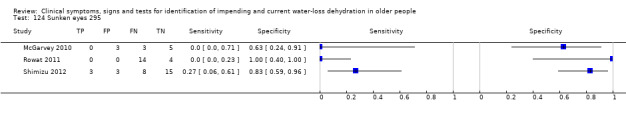
Sunken eyes 295.
125. Test.
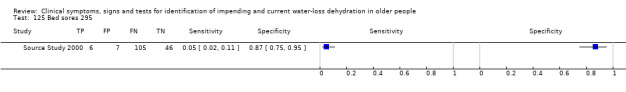
Bed sores 295.
126. Test.
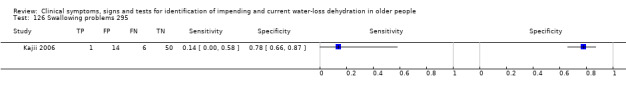
Swallowing problems 295.
127. Test.
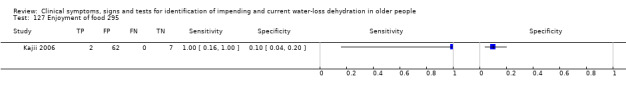
Enjoyment of food 295.
128. Test.
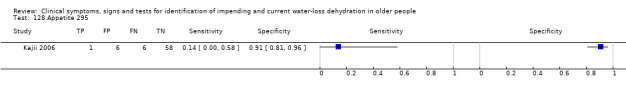
Appetite 295.
129. Test.
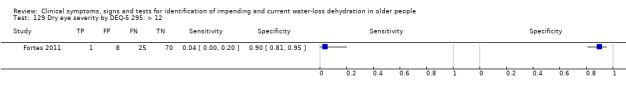
Dry eye severity by DEQ‐5 295: > 12.
130. Test.
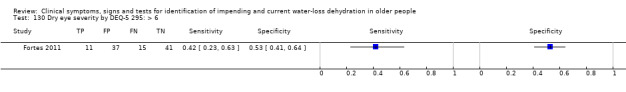
Dry eye severity by DEQ‐5 295: > 6.
131. Test.
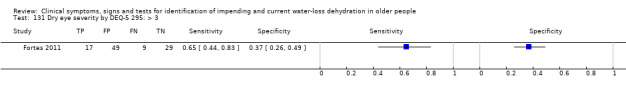
Dry eye severity by DEQ‐5 295: > 3.
132. Test.
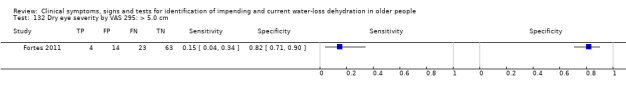
Dry eye severity by VAS 295: > 5.0 cm.
133. Test.
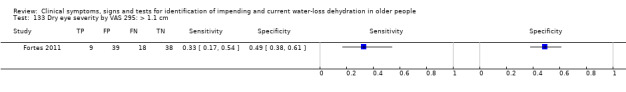
Dry eye severity by VAS 295: > 1.1 cm.
134. Test.
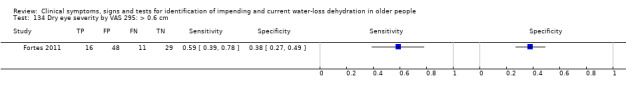
Dry eye severity by VAS 295: > 0.6 cm.
135. Test.
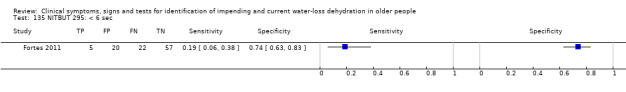
NITBUT 295: < 6 sec.
136. Test.
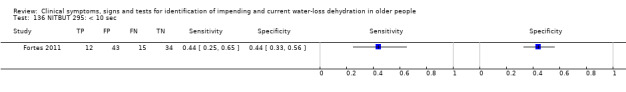
NITBUT 295: < 10 sec.
137. Test.
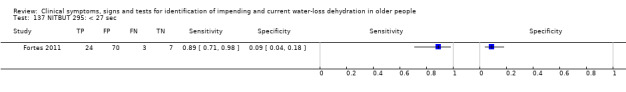
NITBUT 295: < 27 sec.
138. Test.
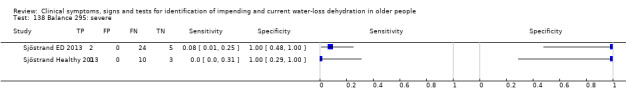
Balance 295: severe.
139. Test.
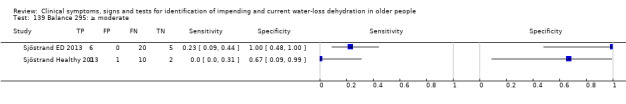
Balance 295: ≥ moderate.
140. Test.
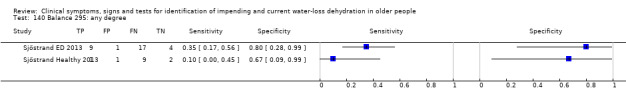
Balance 295: any degree.
141. Test.

Headache 295: severe.
142. Test.
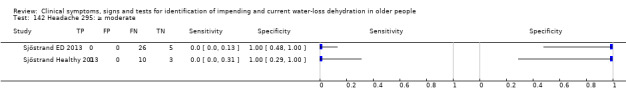
Headache 295: ≥ moderate.
143. Test.
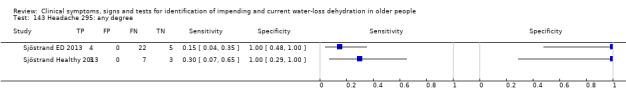
Headache 295: any degree.
144. Test.
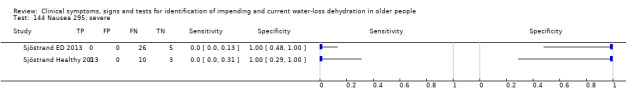
Nausea 295: severe.
145. Test.
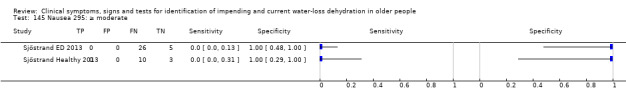
Nausea 295: ≥ moderate.
146. Test.
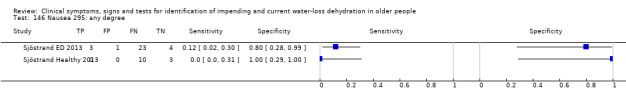
Nausea 295: any degree.
147. Test.
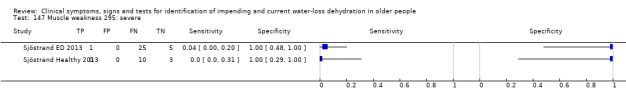
Muscle weakness 295: severe.
148. Test.
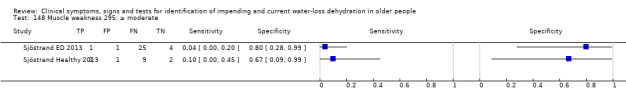
Muscle weakness 295: ≥ moderate.
149. Test.
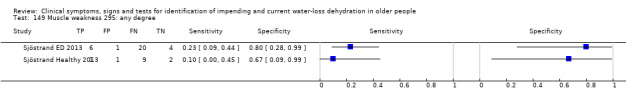
Muscle weakness 295: any degree.
150. Test.
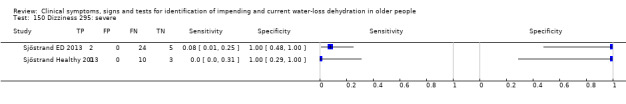
Dizziness 295: severe.
151. Test.
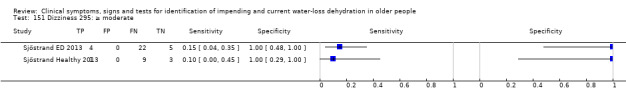
Dizziness 295: ≥ moderate.
152. Test.
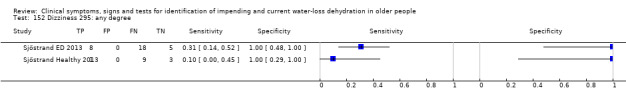
Dizziness 295: any degree.
153. Test.
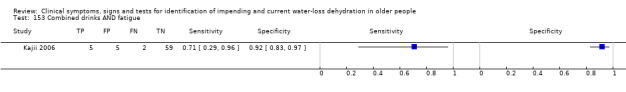
Combined drinks AND fatigue.
154. Test.
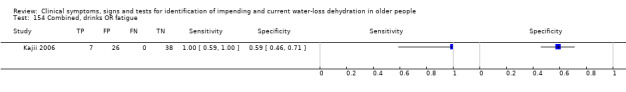
Combined, drinks OR fatigue.
Characteristics of studies
Characteristics of included studies [ordered by study ID]
Allison 2005.
| Clinical features and settings |
|
|
| Participants |
|
|
| Study design |
|
|
| Target condition and reference standard(s) |
|
|
| Index and comparator tests | Total body resistance at 50kHz, by BIA
|
|
| Follow‐up | Flow
|
|
| Notes | ||
| Table of Methodological Quality | ||
| Item | Authors' judgement | Description |
| Representative spectrum? All tests | Unclear | Yes: older people living in care Unclear: method of recruitment unclear and only 22 of 1225 represented in data |
| Acceptable reference standard? All tests | No | Serum osmolarity (calculated rather than measured serum osmolality) |
| Acceptable delay between tests? All tests | No | Delay up to 3 months between reference standard and index tests |
| Partial verification avoided? All tests | No | Serum osmolarity assessment was based on clinical criteria so was probably not random, and reference standard data were accessed retrospectively |
| Differential verification avoided? All tests | Unclear | Yes: reviewers chose the cut‐off level used Unclear: method of measuring osmolarity unclear and may have differed between participants as based in different facilities |
| Incorporation avoided? All tests | Yes | The index test did not form any part of the reference standard |
| Reference standard results blinded? All tests | Yes | Biochemical measures used, reviewers set cut‐offs |
| Index test results blinded? All tests | Unclear | Yes: reviewers chose cut‐off levels Unclear whether any interpretation of total body resistance occurred |
| Relevant clinical information? All tests | Yes | Assessments made without reference to clinical data |
| Uninterpretable results reported? All tests | Unclear | Not stated |
| Withdrawals explained? All tests | No | > 1000 participants not represented in dataset |
| Free of commercial funding? | No | Study funding not stated, but first author worked for company that produce BIA equipment, another worked for the company that produce the software used |
Bossingham 2005.
| Clinical features and settings |
|
|
| Participants |
|
|
| Study design |
|
|
| Target condition and reference standard(s) |
|
|
| Index and comparator tests | Ad lib water intake
Fluid intake
Urine volume
Water balance
USG
*Also TBW measured by deuterium oxide dilution method, but not presented as a clinical symptom, sign or test. *Also thirst assessed (participants asked "how strong is your feeling of thirst?" indicated by a 100 mm VAS scale) but only asked of some participants, and data not presented in dataset, so not used |
|
| Follow‐up | Flow
|
|
| Notes | ||
| Table of Methodological Quality | ||
| Item | Authors' judgement | Description |
| Representative spectrum? All tests | Yes | Older people living in the community Method of recruitment was sequential, including those who fit the inclusion criteria |
| Acceptable reference standard? All tests | Yes | Serum osmolality (measured) Reviewers set our own cut‐offs |
| Acceptable delay between tests? All tests | No | > 2 hours for all tests |
| Partial verification avoided? All tests | Yes | Study prospective, all participants received all tests except for question on thirst (introduced part way through the study, when all women had completed) |
| Differential verification avoided? All tests | Yes | Serum osmolality assessed in all |
| Incorporation avoided? All tests | Yes | Index tests did not form any part of the reference standard |
| Reference standard results blinded? All tests | Yes | Biochemical measures used, reviewers set cut‐offs |
| Index test results blinded? All tests | Yes | Reference standard measured after index tests |
| Relevant clinical information? All tests | Yes | Assessments made without reference to clinical data |
| Uninterpretable results reported? All tests | Yes | Gaps in the dataset clear (full dataset provided) |
| Withdrawals explained? All tests | Yes | 3 did not complete and were excluded |
| Free of commercial funding? | Yes | Funded by NIH and US Dept of Agriculture, all authors worked for Purdue University |
Chassagne 2006.
| Clinical features and settings |
|
|
| Participants |
|
|
| Study design |
|
|
| Target condition and reference standard(s) |
|
|
| Index and comparator tests | Heart rate, beats/min (305 participants)
Orthostatic blood pressure (44 participants)
Body temperature (297 participants)
Consciousness states (305 participants)
Dry oral mucosa (292 participants)
Skin turgor, subclavicular (306 participants), anterior forearm (302 participants), anterior thigh (303 participants), sternum (304 participants)
|
|
| Follow‐up | Flow
|
|
| Notes | ||
| Table of Methodological Quality | ||
| Item | Authors' judgement | Description |
| Representative spectrum? All tests | No | No: all participants were hospitalised Unclear: unclear whether recruitment was of consecutive patients |
| Acceptable reference standard? All tests | No | No: serum osmolarity (calculated) had to be used as the reference standard as measured serum osmolality was only available for cases (who all had raised serum osmolality by definition) Yes: reviewers set our own cut‐offs as we had access to the full dataset |
| Acceptable delay between tests? All tests | Unclear | Tests assessed within 24 hours of blood sample in cases and controls, but unclear if within 2 hours |
| Partial verification avoided? All tests | No | Yes: study prospective No: only cases had measured serum osmolality, 12 controls were missing some relevant data allowing calculation of serum osmolarity |
| Differential verification avoided? All tests | Yes | Serum osmolarity could be calculated for all included participants, so this was used as the reference standard |
| Incorporation avoided? All tests | Yes | The index tests did not form part of the reference standard |
| Reference standard results blinded? All tests | No | Cases chosen on the basis of serum sodium levels (closely related to serum osmolality and osmolarity) |
| Index test results blinded? All tests | Unclear | Tests may have been assessed in the knowledge of whether a participant was a case or a control |
| Relevant clinical information? All tests | Yes | Assessments made without reference to clinical data |
| Uninterpretable results reported? All tests | Yes | Gaps in the dataset clear (full dataset provided) |
| Withdrawals explained? All tests | Unclear | While the numbers included were clear it was not clear why some data were missing |
| Free of commercial funding? | Yes | The author stated that the study was unfunded |
Culp 2003.
| Clinical features and settings |
|
|
| Participants |
|
|
| Study design |
|
|
| Target condition and reference standard(s) | Serum osmolarity, mOsm/L (calculated)
|
|
| Index and comparator tests | TBW, ECF, ICF (L), and as % body weight by single frequency BIA (308 participants)
USG (308 participant)
Heart rate (BPM) (data not in dataset)
Blood pressure (mm Hg) (data not in dataset)
MMSE (308 participants)
Neecham confusion scale (308 participants)
CAM (308 participants)
Vigilance A (data not in dataset)
Body temperature (data not in dataset)
|
|
| Follow‐up | Flow
|
|
| Notes | Data on body temperature, heart rate, blood pressure and vigilance A not presented in dataset, so not useable in analyses. Data on CAM were assessed as any positive measure over 4 weeks, so not necessarily at a time point near the reference standard, so not included in analyses | |
| Table of Methodological Quality | ||
| Item | Authors' judgement | Description |
| Representative spectrum? All tests | Yes | Older people living in long term care facilities Random sampling used |
| Acceptable reference standard? All tests | No | No: calculated serum osmolarity Yes: reviewers set our own cut‐offs as we had access to the full dataset |
| Acceptable delay between tests? All tests | Unclear | All on same day of assessment (except CAM) but no indication that assessment would have been within 2 hours |
| Partial verification avoided? All tests | Yes | Study prospective All received both index tests and reference standard. |
| Differential verification avoided? All tests | Yes | Serum osmolarity could be calculated for all included participants |
| Incorporation avoided? All tests | Yes | The index tests did not form part of the reference standard |
| Reference standard results blinded? All tests | Yes | Biochemical measures used, reviewers set cut‐offs |
| Index test results blinded? All tests | Unclear | No information provided. |
| Relevant clinical information? All tests | Yes | Assessments made without reference to clinical data |
| Uninterpretable results reported? All tests | Yes | Gaps in the dataset clear (full dataset provided) |
| Withdrawals explained? All tests | No | 311/313 participants reported, 311 in dataset (reasons for 2 missing unclear) |
| Free of commercial funding? | Yes | Funded in part by National Institute on Aging, authors all worked in medical or academic settings |
Eaton 1994.
| Clinical features and settings |
|
|
| Participants |
|
|
| Study design |
|
|
| Target condition and reference standard(s) | Serum osmolality, mOsm/kg (directly measured) plus serum urea/ creatinine ratio (mmol/L/μmol/L)
|
|
| Index and comparator tests | Axillary moisture, weighed (data not reported)
Axillary moisture, by touch (86 participants)
|
|
| Follow‐up | Flow
|
|
| Notes | Data on weighed moisture not presented in usable format, and data on duplicate assessments of axillary moisture by touch not presented in usable format | |
| Table of Methodological Quality | ||
| Item | Authors' judgement | Description |
| Representative spectrum? All tests | No | No: participants had acute medical conditions Yes: consecutive recruitment |
| Acceptable reference standard? All tests | No | Was a combination of serum osmolality and urea/ creatinine ratio |
| Acceptable delay between tests? All tests | No | Index test was within 24 hours of admission, but the timing of the duplicate assessments were 1 to 6 hours apart and timing of reference standard was not stated |
| Partial verification avoided? All tests | Unclear | Yes: study prospective Unclear: unclear whether all received both index tests and reference standard, or in what order |
| Differential verification avoided? All tests | Yes | The same reference standard was used for all participants |
| Incorporation avoided? All tests | Yes | The index tests did not form part of the reference standard |
| Reference standard results blinded? All tests | Unclear | Not stated |
| Index test results blinded? All tests | Unclear | Not stated |
| Relevant clinical information? All tests | Unclear | Unclear what clinical information was available or used |
| Uninterpretable results reported? All tests | Unclear | The cause of missing data was unclear |
| Withdrawals explained? All tests | No | Unclear why data from 86 participants were presented, when 100 were recruited |
| Free of commercial funding? | Unclear | Probably, funding source not stated but appears to be part of medical school training and all worked for health or academic bodies |
Fletcher 1999.
| Clinical features and settings |
|
|
| Participants |
|
|
| Study design |
|
|
| Target condition and reference standard(s) | Serum osmolality, mOsm/kg (directly measured)
|
|
| Index and comparator tests | Urine colour (15 participants)
Urine output (15 participants)
Urine osmolality (15 participants)
|
|
| Follow‐up | Flow
|
|
| Notes | Central venous pressure was also measured, but as this requires use of a central venous catheter it is not non‐invasive, so data not included | |
| Table of Methodological Quality | ||
| Item | Authors' judgement | Description |
| Representative spectrum? All tests | No | No: participants were acutely ill in high dependency units Yes: consecutive recruitment |
| Acceptable reference standard? All tests | Yes | Serum osmolality (measured) Reviewers set our own cut‐offs |
| Acceptable delay between tests? All tests | Yes | Urine sample and central venous pressure taken in hour before blood sample taken |
| Partial verification avoided? All tests | Yes | Study prospective All received both index tests and reference standard |
| Differential verification avoided? All tests | Yes | The same reference standard was used for all participants |
| Incorporation avoided? All tests | Yes | The index tests did not form part of the reference standard |
| Reference standard results blinded? All tests | Yes | Biochemical measures used, reviewers set cut‐offs |
| Index test results blinded? All tests | Unclear | Not stated |
| Relevant clinical information? All tests | Yes | Assessments made by reviewers without reference to clinical data |
| Uninterpretable results reported? All tests | Yes | Gaps in the dataset clear (full dataset provided) |
| Withdrawals explained? All tests | Yes | All participants were included that fit our inclusion criteria |
| Free of commercial funding? | Yes | Funding by a hospital fund, and all authors worked for the hospital |
Fortes 2011.
| Clinical features and settings |
|
|
| Participants |
|
|
| Study design |
|
|
| Target condition and reference standard(s) | Plasma osmolality, mOsm/kg (directly measured)
|
|
| Index and comparator tests | DEQ‐5 (104 participants)
VAS (104 participants)
NITBUT (104 participants)
Tear osmolarity, mOsm/L (89 participants)
|
|
| Follow‐up |
|
|
| Notes | ||
| Table of Methodological Quality | ||
| Item | Authors' judgement | Description |
| Representative spectrum? All tests | No | No: participants were admitted to an acute medical unit Unclear: unclear how recruitment occurred |
| Acceptable reference standard? All tests | Yes | Measured plasma osmolality Reviewers set our own cut‐offs as we had access to the full dataset |
| Acceptable delay between tests? All tests | Yes | All measures (index and then reference standard) taken within 30 minutes |
| Partial verification avoided? All tests | Yes | Study prospective All received the reference standard |
| Differential verification avoided? All tests | Yes | The same reference standard was used for all participants |
| Incorporation avoided? All tests | Yes | The index tests did not form part of the reference standard |
| Reference standard results blinded? All tests | Yes | Biochemical measures used, reviewers set cut‐offs |
| Index test results blinded? All tests | Yes | Continuous data, reviewers set cut‐offs |
| Relevant clinical information? All tests | Yes | Assessments made by reviewers without reference to clinical data |
| Uninterpretable results reported? All tests | Yes | Gaps in the dataset clear (full dataset provided) |
| Withdrawals explained? All tests | Yes | Withdrawals were explained (12 did not have appropriate tear osmolality data, 7 were unable to tolerate the test, 5 were unable to provide sufficient volume of eye fluid), aside from reviewer exclusions |
| Free of commercial funding? | No | This study was a bolt‐on study to a larger study funded by HydraDX, but the company did not benefit from these results |
Gaspar 2011a.
| Clinical features and settings |
|
|
| Participants |
|
|
| Study design |
|
|
| Target condition and reference standard(s) | Serum osmolality, mOsm/kg (directly measured)
|
|
| Index and comparator tests |
TBW, ECF and ICF as %body weight by multi‐frequency BIA (28 participants)
MMSE (17 participants)
|
|
| Follow‐up | Flow
|
|
| Notes |
|
|
| Table of Methodological Quality | ||
| Item | Authors' judgement | Description |
| Representative spectrum? All tests | No | No: while some participants were living in long term care facilities, some were in hospital for ECG treatment Unclear if recruitment was consecutive, or a random sample |
| Acceptable reference standard? All tests | Yes | Serum osmolality (measured) Reviewers set our own cut‐offs |
| Acceptable delay between tests? All tests | Yes | BIA measures were taken within 2 hours of serum osmolality sample, BUT timing of MMSE and CAM were unclear as these were taken from notes. |
| Partial verification avoided? All tests | Yes | Study prospective All received the reference standard |
| Differential verification avoided? All tests | Yes | The same reference standard was used for all participants |
| Incorporation avoided? All tests | Yes | The index tests did not form part of the reference standard |
| Reference standard results blinded? All tests | Yes | Biochemical measures used, reviewers set cut‐offs |
| Index test results blinded? All tests | Yes | Data were continuous, reviewers set cut‐offs |
| Relevant clinical information? All tests | Yes | Assessments made by reviewers without reference to clinical data |
| Uninterpretable results reported? All tests | Yes | Gaps in the dataset clear (full dataset provided) |
| Withdrawals explained? All tests | Yes | All participants were included that fit our inclusion criteria |
| Free of commercial funding? | Unclear | Funded by the Gerontological Nursing Interventions Research Center, Hartford Center of Geriatric Nursing Excellence and Graduate Program Mayo Research Funds (co‐PIs Gaspar and Forsyth) |
Johnson 2003.
| Clinical features and settings |
|
|
| Participants |
|
|
| Study design |
|
|
| Target condition and reference standard(s) | Serum osmolality, mOsm/kg (directly measured)
|
|
| Index and comparator tests | 24 hour urine volume (43 participants)
Urine volume during day (43 participants)
Urine volume during night (43 participants)
Urine voids during day (43 participants)
Urine voids during night (43 participants)
Urine osmolality (43 participants)
|
|
| Follow‐up | Flow
|
|
| Notes | ||
| Table of Methodological Quality | ||
| Item | Authors' judgement | Description |
| Representative spectrum? All tests | Yes | Participants were resident in the community Consecutive recruitment |
| Acceptable reference standard? All tests | Yes | Serum osmolality (measured) Reviewers set our own cut‐offs |
| Acceptable delay between tests? All tests | Unclear | Serum osmolality and urinary osmolality appear to have been taken around the same time on the same day, but urine volume and voiding were averaged over the 4 days of stay at the research facility |
| Partial verification avoided? All tests | Yes | Study prospective All received the reference standard |
| Differential verification avoided? All tests | Yes | The same reference standard was used for all participants |
| Incorporation avoided? All tests | Yes | The index tests did not form part of the reference standard |
| Reference standard results blinded? All tests | Yes | Biochemical measures used, reviewers set cut‐offs |
| Index test results blinded? All tests | Yes | Data were continuous, reviewers set cut‐offs |
| Relevant clinical information? All tests | Yes | Assessments made by reviewers without reference to clinical data |
| Uninterpretable results reported? All tests | Yes | Gaps in the dataset clear (full dataset provided) |
| Withdrawals explained? All tests | Yes | All participants were included that fit our inclusion criteria |
| Free of commercial funding? | Yes | Funding from National Institute on Aging, Emory University and Atlanta Veterans Affairs Rehabilitation R&D Center and Birmingham Geriatrics Research Education and Clinical Center, authors all affiliated to healthcare or academic centres |
Kafri 2013.
| Clinical features and settings |
|
|
| Participants |
|
|
| Study design |
|
|
| Target condition and reference standard(s) | Serum osmolality, mOsm/kg (directly measured)
|
|
| Index and comparator tests | Impedances at 5, 50 and 100 kHz, TBW as % of body weight, ECF and ICF as % of TBW by multi‐frequency BIA (21 participants)
Dry tongue (31 participants)
Tongue furrowed (31 participants)
Skin turgor, back of hand (31 participants)
Capillary refill time, fingernail (31 participants)
|
|
| Follow‐up | Flow
|
|
| Notes | Intended to assess for presence of orthostatic hypotension, but almost none of the participants were able to stand up, so this was abandoned | |
| Table of Methodological Quality | ||
| Item | Authors' judgement | Description |
| Representative spectrum? All tests | No | No: participants were hospitalised (following a stroke) Yes: consecutive recruitment |
| Acceptable reference standard? All tests | Yes | Serum osmolality (measured) Reviewers set our own cut‐offs |
| Acceptable delay between tests? All tests | Yes | Serum osmolality sample taken within 20 minutes of BIA and 1 hour of other index tests. |
| Partial verification avoided? All tests | Yes | Study prospective All received the reference standard |
| Differential verification avoided? All tests | Yes | The same reference standard was used for all participants |
| Incorporation avoided? All tests | Yes | The index tests did not form part of the reference standard |
| Reference standard results blinded? All tests | Yes | Biochemical measures used, reviewers set cut‐offs |
| Index test results blinded? All tests | Yes | Data were continuous, reviewers set cut‐offs |
| Relevant clinical information? All tests | Yes | Assessments made by reviewers without reference to clinical data |
| Uninterpretable results reported? All tests | Yes | Gaps in the dataset clear (full dataset provided) |
| Withdrawals explained? All tests | Yes | All participants were included that fit our inclusion criteria |
| Free of commercial funding? | No | Funding provided by European Hydration Institute (independent but funded by some commercial interests), authors were employed in health care or academic institutions and the primary author was a PhD student |
Kajii 2006.
| Clinical features and settings |
|
|
| Participants |
|
|
| Study design |
|
|
| Target condition and reference standard(s) | Serum osmolality, mOsm/kg (directly measured)
|
|
| Index and comparator tests | All index tests (71 participants)
Lips dry (71 participants)
Mouth dry (71 participants)
Feeling thirsty (71 participants)
Tongue smarts (71 participants)
Mouth smarts (71 participants)
Sticky mouth (71 participants)
Sticky saliva (71 participants)
Fatigue (71 participants)
Lassitude (71 participants)
Dull (71 participants)
Swallowing problems (71 participants)
Enjoying food (71 participants)
Appetite (71 participants)
Total daily intake of drinks (including drinks at and between meals) (71 participants)
Ever misses drinking at meals? (71 participants)
Ever misses drinking between meals? (71 participants)
|
|
| Follow‐up | Flow
|
|
| Notes |
|
|
| Table of Methodological Quality | ||
| Item | Authors' judgement | Description |
| Representative spectrum? All tests | Unclear | Yes: participants were resident in the community Unclear: recruitment was from a community centre for older people, otherwise not described in English |
| Acceptable reference standard? All tests | Yes | Serum osmolality (measured) Reviewers set our own cut‐offs |
| Acceptable delay between tests? All tests | Yes | Serum osmolality sample was taken at same home visit as index tests, within 2 hours |
| Partial verification avoided? All tests | Yes | Study prospective All received the reference standard |
| Differential verification avoided? All tests | Yes | The same reference standard was used for all participants |
| Incorporation avoided? All tests | Yes | The index tests did not form part of the reference standard |
| Reference standard results blinded? All tests | Yes | Biochemical measures used, reviewers set cut‐offs |
| Index test results blinded? All tests | Yes | Data were continuous, reviewers set cut‐offs |
| Relevant clinical information? All tests | Yes | Assessments made by reviewers without reference to clinical data |
| Uninterpretable results reported? All tests | Yes | Gaps in the dataset clear (full dataset provided) |
| Withdrawals explained? All tests | Yes | All participants were included that fit our inclusion criteria |
| Free of commercial funding? | Yes | Funded by Grants–in‐Aid for Scientific Research <KAKENHI>, Japan Society for the Promotion of Science (http://www.jsps.go.jp/english/e‐grants/index.html) |
Lindner 2009.
| Clinical features and settings |
|
|
| Participants |
|
|
| Study design |
|
|
| Target condition and reference standard(s) | Serum osmolality, mOsm/kg (directly measured)
|
|
| Index and comparator tests | Heart rate (34 participants)
Fluid intake over 24 hours (34 participants)
Urine volume over 24 hours (34 participants)
Fluid balance over 24 hours (34 participants)
Urine osmolality (27 participants)
|
|
| Follow‐up | Flow
|
|
| Notes |
|
|
| Table of Methodological Quality | ||
| Item | Authors' judgement | Description |
| Representative spectrum? All tests | No | No: participants were hospitalised Yes: all appropriate patients were included over a specified time period |
| Acceptable reference standard? All tests | Yes | Measured serum osmolality Reviewers set our own cut‐offs as we had access to the full dataset |
| Acceptable delay between tests? All tests | Yes | Serum osmolality sample taken within 1 hour of all index tests. |
| Partial verification avoided? All tests | No | No: study retrospective Yes: all received the reference standard |
| Differential verification avoided? All tests | Yes | The same reference standard was used for all participants |
| Incorporation avoided? All tests | Yes | The index tests did not form part of the reference standard |
| Reference standard results blinded? All tests | Yes | Biochemical measures used, reviewers set cut‐offs |
| Index test results blinded? All tests | Yes | Data were continuous, reviewers set cut‐offs |
| Relevant clinical information? All tests | Yes | Assessments made by reviewers without reference to clinical data |
| Uninterpretable results reported? All tests | Yes | Gaps in the dataset clear (full dataset provided) |
| Withdrawals explained? All tests | Yes | All participants were included that fit our inclusion criteria |
| Free of commercial funding? | Yes | Paper states that no funding was used |
Mack 1994.
| Clinical features and settings |
|
|
| Participants |
|
|
| Study design |
|
|
| Target condition and reference standard(s) | Serum osmolality, mOsm/kg (directly measured)
|
|
| Index and comparator tests | All data used were taken from the 30 min recovery period (when mean serum osmolality was highest) Urine volume (10 participants)
Thirst (10 participants)
|
|
| Follow‐up | Flow
|
|
| Notes |
|
|
| Table of Methodological Quality | ||
| Item | Authors' judgement | Description |
| Representative spectrum? All tests | Unclear | Yes: participants were living independently in the community Unclear: unclear how recruitment occurred |
| Acceptable reference standard? All tests | Yes | Measured serum osmolality Reviewers set our own cut‐offs as we had access to the full dataset |
| Acceptable delay between tests? All tests | Yes | Urine and blood samples taken at the same time |
| Partial verification avoided? All tests | Yes | Study prospective All received the reference standard |
| Differential verification avoided? All tests | Yes | The same reference standard was used for all participants |
| Incorporation avoided? All tests | Yes | The index tests did not form part of the reference standard |
| Reference standard results blinded? All tests | Yes | Biochemical measures used, reviewers set cut‐offs |
| Index test results blinded? All tests | Yes | Data were continuous, reviewers set cut‐offs |
| Relevant clinical information? All tests | Yes | Assessments made by reviewers without reference to clinical data |
| Uninterpretable results reported? All tests | Yes | Gaps in the dataset clear (full dataset provided) |
| Withdrawals explained? All tests | Yes | There did not appear to be any withdrawals |
| Free of commercial funding? | Yes | Funding was from National Institute on Aging, and all authors have academic affiliations |
McGarvey 2010.
| Clinical features and settings |
|
|
| Participants |
|
|
| Study design |
|
|
| Target condition and reference standard(s) | Weight change
|
|
| Index and comparator tests | Sunken eyes (11 participants)
Dry oral mucous membranes (11 participants)
Reduced skin turgor on back of hand (11 participants)
Unable to spit (11 participants)
Feels thirsty (11 participants)
|
|
| Follow‐up | Flow
|
|
| Notes | ||
| Table of Methodological Quality | ||
| Item | Authors' judgement | Description |
| Representative spectrum? All tests | Yes | Participants were living in community All appropriate participants appear to have been included |
| Acceptable reference standard? All tests | No | Reference standard was weight change, and while exercise was not unusual in these participants (they will have trained for the marathon) it was not usual exercise for this age group. Weight change was measured 12‐72 hours before the race commenced, and compared to immediately post‐race |
| Acceptable delay between tests? All tests | No | Pre‐marathon weight was measured at registration 12 to 72 hours before the race, however the index tests were measured just before the second assessment of weight |
| Partial verification avoided? All tests | Yes | Prospective, and all received index tests and reference standard |
| Differential verification avoided? All tests | Yes | The same reference standard was used in all participants |
| Incorporation avoided? All tests | Yes | Index tests and reference standard were distinct |
| Reference standard results blinded? All tests | Yes | The second weight was measured after the index tests by a study volunteer who did not assess the index tests and was not aware of the results of these tests |
| Index test results blinded? All tests | Yes | Index tests assessed by first author, before the second weight was measured (by a study volunteer) |
| Relevant clinical information? All tests | Yes | Assessments made by reviewers without reference to clinical data |
| Uninterpretable results reported? All tests | Yes | No un interpretable data appeared in the dataset as provided |
| Withdrawals explained? All tests | Yes | Exclusions were explained. |
| Free of commercial funding? | Yes | Funding not mentioned in paper, but first author states he covered the costs (which were not high), all authors were employed by academic or health institutions |
Monahan 2006.
| Clinical features and settings |
|
|
| Participants |
|
|
| Study design |
|
|
| Target condition and reference standard(s) | Weight change within 7 days
|
|
| Index and comparator tests | Fluid balance over 24 hours (10 participants)
|
|
| Follow‐up |
|
|
| Notes | ||
| Table of Methodological Quality | ||
| Item | Authors' judgement | Description |
| Representative spectrum? All tests | No | No: participants hospitalised Unclear: chosen retrospectively for BNP measurements |
| Acceptable reference standard? All tests | No | No: weight change Yes: reviewers set our own cut‐offs as we had access to the full dataset |
| Acceptable delay between tests? All tests | Yes | Mean fluid balance over same period of weight assessment |
| Partial verification avoided? All tests | No | Study retrospective All did not have weight assessment |
| Differential verification avoided? All tests | Yes | The same reference standard was used for all participants |
| Incorporation avoided? All tests | No | Fluid balance will affect weight change |
| Reference standard results blinded? All tests | Unclear | Weight measured, reviewers set cut‐offs |
| Index test results blinded? All tests | Yes | Data were continuous, reviewers set cut‐offs |
| Relevant clinical information? All tests | Yes | Assessments made by reviewers without reference to clinical data |
| Uninterpretable results reported? All tests | Unclear | Of the 60 participants in the dataset, we had data for 40 |
| Withdrawals explained? All tests | Unclear | Of the 60 participants in the dataset, we had data for 40 (unclear why 20 missing) |
| Free of commercial funding? | Unclear | Funding (or lack of it) not reported, authors provided academic affiliations |
Perren 2011.
| Clinical features and settings |
|
|
| Participants |
|
|
| Study design |
|
|
| Target condition and reference standard(s) | Weight change between admission and discharge to ICU
|
|
| Index and comparator tests | Fluid balance (27 participants)
Fluid intake (27 participants)
Urine output (27 participants)
|
|
| Follow‐up |
|
|
| Notes | ||
| Table of Methodological Quality | ||
| Item | Authors' judgement | Description |
| Representative spectrum? All tests | No | No: participants hospitalised Yes: consecutive patients were eligible, but excluded if body weight was not measured at admission or discharge, or if any one fluid balance chart was incomplete |
| Acceptable reference standard? All tests | No | No: weight change Yes: reviewers set our own cut‐offs as we had access to the full dataset |
| Acceptable delay between tests? All tests | Yes | Mean fluid balance over same period of weight assessment |
| Partial verification avoided? All tests | Unclear | Yes: study prospective No: those who did not have weight assessment at admission or discharge were excluded (unclear how many) |
| Differential verification avoided? All tests | Yes | The same reference standard was used for all participants |
| Incorporation avoided? All tests | No | Fluid balance will affect weight change |
| Reference standard results blinded? All tests | Unclear | Weight measured, reviewers set cut‐offs |
| Index test results blinded? All tests | Yes | Data were continuous, reviewers set cut‐offs |
| Relevant clinical information? All tests | Yes | Assessments made by reviewers without reference to clinical data |
| Uninterpretable results reported? All tests | Unclear | No un interpretable data found in the dataset offered |
| Withdrawals explained? All tests | Yes | Exclusions explained |
| Free of commercial funding? | Yes | The authors stated that the study was unfunded |
Powers 2012.
| Clinical features and settings |
|
|
| Participants |
|
|
| Study design |
|
|
| Target condition and reference standard(s) | Serum osmolarity, mOsm/L (calculated)
|
|
| Index and comparator tests | Urine osmolality (22 participants)
Heart rate (22 participants)
BIA resistance at 50kHz (22 participants)
TBW by BIA at 50kHz (22 participants)
ECW by BIA at 50kHz (22 participants)
|
|
| Follow‐up |
|
|
| Notes |
|
|
| Table of Methodological Quality | ||
| Item | Authors' judgement | Description |
| Representative spectrum? All tests | No | No: mixture of inpatient (hospitalised) and outpatient (community dwelling) older people Unclear: randomly recruited between 2005 and 2010 |
| Acceptable reference standard? All tests | No | No: calculated serum osmolarity Yes: reviewers set our own cut‐offs as we had access to the full dataset |
| Acceptable delay between tests? All tests | Unclear | Unclear whether all tests conducted at same time, but were conducted on the same day for each participant |
| Partial verification avoided? All tests | No | Prospective, but 37/63 participants did not have serum osmolarity data |
| Differential verification avoided? All tests | Yes | The same reference standard was used for all participants |
| Incorporation avoided? All tests | Yes | The index tests did not form part of the reference standard |
| Reference standard results blinded? All tests | Yes | Biochemical measures used, reviewers set cut‐offs |
| Index test results blinded? All tests | Yes | Reviewers set cut‐offs |
| Relevant clinical information? All tests | Yes | Assessments made by reviewers without reference to clinical data |
| Uninterpretable results reported? All tests | Yes | Gaps in the dataset clear (full dataset provided) |
| Withdrawals explained? All tests | Yes | There did not appear to be any withdrawals, aside from reviewer exclusions |
| Free of commercial funding? | Yes | National Institutes of Health and the Bureau of Health Professions |
Rowat 2011.
| Clinical features and settings |
|
|
| Participants |
|
|
| Study design |
|
|
| Target condition and reference standard(s) | Serum osmolarity, mOsm/L (calculated)
|
|
| Index and comparator tests | USG: dipstick (18 participants) & refractometer (17 participants)
Urine colour (17 participants)
Skin turgor (18 participants)
Dry mouth (18 participants)
Blue lips (18 participants)
Sunken eyes (18 participants)
|
|
| Follow‐up |
|
|
| Notes |
|
|
| Table of Methodological Quality | ||
| Item | Authors' judgement | Description |
| Representative spectrum? All tests | No | No: participants hospitalised Yes: all relevant patients assessed for inclusion, sequential recruitment |
| Acceptable reference standard? All tests | No | Serum osmolarity (calculated rather than measured serum osmolality) |
| Acceptable delay between tests? All tests | Unclear | All measurements appear to have been taken during the day of admission |
| Partial verification avoided? All tests | Yes | Study prospective All received the reference standard |
| Differential verification avoided? All tests | Yes | The same reference standard was used for all participants |
| Incorporation avoided? All tests | Yes | The index tests did not form part of the reference standard |
| Reference standard results blinded? All tests | Yes | Biochemical measures used, reviewers set cut‐offs |
| Index test results blinded? All tests | Yes | Reviewers set cut‐offs |
| Relevant clinical information? All tests | Yes | Assessments made by reviewers without reference to clinical data |
| Uninterpretable results reported? All tests | Yes | Gaps in the dataset clear (full dataset provided) |
| Withdrawals explained? All tests | Yes | There did not appear to be any withdrawals, aside from reviewer exclusions |
| Free of commercial funding? | Yes | Funded by NHS Lothian Research and Development, authors employed as health professionals or academics |
Shimizu 2012.
| Clinical features and settings |
|
|
| Participants |
|
|
| Study design |
|
|
| Target condition and reference standard(s) | Serum osmolarity, mOsm/L (calculated)
|
|
| Index and comparator tests | Dry mouth (27 participants)
Dry axilla to touch (29 participants)
Dry axilla to skin moisture meter (29 participants)
Sunken eyes (29 participants)
Skin turgor (29 participants)
Capillary refill time (27 participants)
Consciousness level (27 participants)
|
|
| Follow‐up |
|
|
| Notes |
|
|
| Table of Methodological Quality | ||
| Item | Authors' judgement | Description |
| Representative spectrum? All tests | No | No: participants were in hospital and acutely ill Unclear: all those who were eligible and were consecutively enrolled, but differing numbers unclear |
| Acceptable reference standard? All tests | No | Serum osmolarity (calculated rather than measured serum osmolality) |
| Acceptable delay between tests? All tests | Unclear | Timing unclear |
| Partial verification avoided? All tests | Yes | Study prospective All received the reference standard |
| Differential verification avoided? All tests | Yes | The same reference standard was used for all participants |
| Incorporation avoided? All tests | Yes | The index tests did not form part of the reference standard |
| Reference standard results blinded? All tests | Yes | Biochemical measures used, standard cut‐off |
| Index test results blinded? All tests | Yes | Dichotomous and continuous data, researchers set cut‐offs, blood test taken after tests assessed |
| Relevant clinical information? All tests | Unclear | Unclear whether clinical information was used to inform any judgements by researchers |
| Uninterpretable results reported? All tests | Unclear | 2 participants missing for some index tests |
| Withdrawals explained? All tests | Unclear | 2 participants missing for some index tests |
| Free of commercial funding? | No | One author worked for Terumo Corporation which manufactures and sells medical products and equipment |
Sjöstrand ED 2013.
| Clinical features and settings |
|
|
| Participants |
|
|
| Study design |
|
|
| Target condition and reference standard(s) | Serum osmolality, mOsm/kg (directly measured)
|
|
| Index and comparator tests | Urine colour (36 participants)
Urine osmolality (38 participants)
Participant expression of symptoms (31 participants)
|
|
| Follow‐up |
|
|
| Notes |
|
|
| Table of Methodological Quality | ||
| Item | Authors' judgement | Description |
| Representative spectrum? All tests | No | No: participants were attending an emergency room Unclear: unclear how recruitment occurred |
| Acceptable reference standard? All tests | Yes | Measured serum osmolality Reviewers set our own cut‐offs as we had access to the full dataset |
| Acceptable delay between tests? All tests | Yes | Data were all taken from study baseline, before intervention, within 30 minutes of each other |
| Partial verification avoided? All tests | Yes | All received reference standard Prospective |
| Differential verification avoided? All tests | Yes | All had serum osmolality (directly measured) as the reference standard |
| Incorporation avoided? All tests | Yes | The index tests did not form any part of the reference standard |
| Reference standard results blinded? All tests | Yes | Biochemical measures used, reviewers set cut‐offs |
| Index test results blinded? All tests | Yes | Reviewers set cut‐offs |
| Relevant clinical information? All tests | Yes | Assessments made by reviewers without reference to clinical data |
| Uninterpretable results reported? All tests | Yes | Gaps in the dataset clear (full dataset provided) |
| Withdrawals explained? All tests | Yes | Missing data on urine colour, urine osmolality, and symptoms were due to participants being too ill, not being able to get to the toilet, and lack of an examination room in the emergency department (so that some interviews took place in the corridor where privacy could not be assured) |
| Free of commercial funding? | Yes | Financial support was provided through the regional agreement on medical training and clinical research (ALF) between Stockholm County Council and Karolinska Institutet and an unrestricted grant by Masimo Inc., Irvine, CA. (Masimo Inc produce the spectrophotometric adhesive sensor used to monitor haemoglobin concentration, peripheral perfusion index, oxygen saturation, and pulse rate). These measures were not relevant to our review |
Sjöstrand Healthy 2013.
| Clinical features and settings |
|
|
| Participants |
|
|
| Study design |
|
|
| Target condition and reference standard(s) | Serum osmolality, mOsm/kg (directly measured)
|
|
| Index and comparator tests | USG (12 participants)
Urine colour (10 participants)
Urine osmolality (13 participants)
Heart rate (13 participants)
Participant expression of symptoms (13 participants)
|
|
| Follow‐up |
|
|
| Notes |
|
|
| Table of Methodological Quality | ||
| Item | Authors' judgement | Description |
| Representative spectrum? All tests | Unclear | Yes: participants were free‐living volunteers Unclear: unclear how recruitment occurred |
| Acceptable reference standard? All tests | Yes | Measured serum osmolality Reviewers set our own cut‐offs as we had access to the full dataset |
| Acceptable delay between tests? All tests | Yes | Data were all taken from study baseline, before intervention, within several minutes of each other |
| Partial verification avoided? All tests | Yes | All received reference standard Prospective |
| Differential verification avoided? All tests | Yes | All had serum osmolality (directly measured) as the reference standard |
| Incorporation avoided? All tests | Yes | The index tests did not form any part of the reference standard |
| Reference standard results blinded? All tests | Yes | Biochemical measures used, reviewers set cut‐offs |
| Index test results blinded? All tests | Yes | Reviewers set cut‐offs |
| Relevant clinical information? All tests | Yes | Assessments made by reviewers without reference to clinical data |
| Uninterpretable results reported? All tests | Yes | Gaps in the dataset clear (full dataset provided) |
| Withdrawals explained? All tests | Yes | Author reports no withdrawals |
| Free of commercial funding? | Yes | Funded by Stockholm County (PickUp Funding) |
Source Study 2000.
| Clinical features and settings |
|
|
| Participants |
|
|
| Study design |
|
|
| Target condition and reference standard(s) | Serum osmolarity, mOsm/L (calculated)
|
|
| Index and comparator tests | Skin turgor, thigh (162 participants)
Mucosal dryness (164 participants)
Feeling of Thirst (164 participants)
Presence of bed sores (164 participants)
TBW assessed by 18O isotope dilution as % body weight (157 participants)
ECW assessed by bromide dilution as % of TBW (76 participants)
|
|
| Follow‐up |
|
|
| Notes |
|
|
| Table of Methodological Quality | ||
| Item | Authors' judgement | Description |
| Representative spectrum? All tests | Unclear | Yes: participants were living in long‐term or step‐down care Unclear: unclear how recruitment occurred |
| Acceptable reference standard? All tests | No | Serum osmolarity (calculated rather than measured serum osmolality) |
| Acceptable delay between tests? All tests | Unclear | All measurements appear to have been taken over 5 hours |
| Partial verification avoided? All tests | Yes | Study prospective All (except 5 with no potassium data) received the reference standard |
| Differential verification avoided? All tests | Yes | The same reference standard was used for all participants |
| Incorporation avoided? All tests | Yes | The index tests did not form part of the reference standard |
| Reference standard results blinded? All tests | Yes | Biochemical measures used, reviewers set cut‐offs |
| Index test results blinded? All tests | Unclear | Yes: for continuous data reviewers set cut‐offs Unclear: for dichotomous data (yes/no) |
| Relevant clinical information? All tests | Yes | Assessments made by reviewers without reference to clinical data |
| Uninterpretable results reported? All tests | Yes | Gaps in the dataset clear (full dataset provided) |
| Withdrawals explained? All tests | Yes | There did not appear to be any withdrawals, aside from reviewer exclusions |
| Free of commercial funding? | No | Supported by the Institut de l'Eau Perrier Vittel |
Stookey 2005.
| Clinical features and settings |
|
|
| Participants |
|
|
| Study design |
|
|
| Target condition and reference standard(s) | Serum osmolality, mOsm/kg (directly measured)
|
|
| Index and comparator tests | TBW assessed by BIA as % body weight (1946 participants)
BIA resistance at 50 kHz (1947 participants)
|
|
| Follow‐up |
|
|
| Notes |
|
|
| Table of Methodological Quality | ||
| Item | Authors' judgement | Description |
| Representative spectrum? All tests | Yes | Participants were living in the community Recruitment ensured a representative sample of the population |
| Acceptable reference standard? All tests | Yes | Measured serum osmolality Reviewers set our own cut‐offs as we had access to the full dataset |
| Acceptable delay between tests? All tests | Unclear | BIA and blood sample for serum osmolarity taken during a single mobile centre interview |
| Partial verification avoided? All tests | Yes | Study prospective All those included received the reference standard so long as there was a large enough blood sample (877 did not have serum osmolality measured) |
| Differential verification avoided? All tests | Yes | The same reference standard was used for all participants |
| Incorporation avoided? All tests | Yes | The index tests did not form part of the reference standard |
| Reference standard results blinded? All tests | Yes | Biochemical measures used, reviewers set cut‐offs |
| Index test results blinded? All tests | Yes | Data were continuous, reviewers set cut‐offs |
| Relevant clinical information? All tests | Yes | Assessments made by reviewers without reference to clinical data |
| Uninterpretable results reported? All tests | Yes | Gaps in the dataset clear (full dataset provided) |
| Withdrawals explained? All tests | Yes | Some data were missing but this appeared to be due to blood sample handling |
| Free of commercial funding? | Yes | NHANES was funded by the National Center for Health Statistics, Stookey's analysis by the National Heart, Lung and Blood Institute |
Stotts 2009.
| Clinical features and settings |
|
|
| Participants |
|
|
| Study design |
|
|
| Target condition and reference standard(s) | Serum osmolality, mOsm/kg (directly measured)
|
|
| Index and comparator tests | Fluid intake over 24 hours (48 participants)
Type of fluid intake (48 participants)
|
|
| Follow‐up |
|
|
| Notes |
|
|
| Table of Methodological Quality | ||
| Item | Authors' judgement | Description |
| Representative spectrum? All tests | Yes | Participants were living in nursing homes All those who were eligible and gave consent were enrolled |
| Acceptable reference standard? All tests | Yes | Measured serum osmolality Reviewers set our own cut‐offs as we had access to the full dataset |
| Acceptable delay between tests? All tests | No | Serum osmolality on day 1, 24‐hour fluid intake on day 2 of the study baseline |
| Partial verification avoided? All tests | Yes | Study prospective All received the reference standard |
| Differential verification avoided? All tests | Yes | The same reference standard was used for all participants |
| Incorporation avoided? All tests | Yes | The index tests did not form part of the reference standard |
| Reference standard results blinded? All tests | Yes | Biochemical measures used, reviewers set cut‐offs |
| Index test results blinded? All tests | Yes | Data were continuous, reviewers set cut‐offs, data collectors were not informed of lab findings, so were blinded |
| Relevant clinical information? All tests | Yes | Assessments made by reviewers without reference to clinical data |
| Uninterpretable results reported? All tests | Yes | Gaps in the dataset clear (full dataset provided) |
| Withdrawals explained? All tests | Yes | Most exclusions were by reviewers (only 2 lost from dataset) |
| Free of commercial funding? | Yes | Funding from National Institute of Nursing Research, all authors appear affiliated to health or academic institutions |
ACEi ‐ angiotensin‐converting enzyme; BIA ‐ bioelectrical impedance analysis; BMI ‐ body mass index; BNP‐ B‐type natriuretic peptide; CAM ‐ confusion assessment method; DEQ ‐ dry eye questionnaire; ECF ‐ extracellular fluid; ICF ‐ intracellular fluid; ICU ‐ intensive care unit; IV ‐ intravenous; M/F ‐ male/female; MMSE ‐ mini‐mental state exam; NITBUT ‐ non‐invasive tear film break up time; TBW ‐ total body water; USG ‐ urine specific gravity; VAS ‐ visual analogue scale
Characteristics of excluded studies [ordered by study ID]
| Study | Reason for exclusion |
|---|---|
| Albert 1989 | Authors replied that they could not find the dataset, but would forward it if found |
| Bennett 2004 | Authors confirmed that they did not collect data on serum osmolality, short term weight change or serum data that would allow calculation of serum osmolarity |
| Bourdel‐Marchasson 2004 | It appears that the dataset includes a reference standard (serum osmolality) and index tests (thirst, dry mouth, axillary dryness, ocular membrane dryness, skin elasticity and body temperature) but not in a format that can be utilised in the review, and no dataset received |
| Bowser‐Wallace 1985 | Contact replied that main collaborators have died, so no‐one has access to the dataset any longer |
| Bruzzone 2004 | The published paper suggests that data were collected on a reference standard (weight change) and at least one index test (fluid balance, which is likely to include assessment of fluid intake), however data are not in a format that can be used for this review and contact not established with author |
| Buffa 2010 | Authors confirmed that they did not collect data on serum osmolality, short term weight change or serum data that would allow calculation of serum osmolarity |
| Chen 2006 | The published paper suggests that data were collected on a reference standard (plasma osmolality) and at least one index test (urine volume), however data were not in a format that could be used for this review, and contact with the authors could not be established |
| Chen 2010 | Authors confirmed that they did not collect data on serum osmolality, short term weight change or serum data that would allow calculation of serum osmolarity |
| Cooper 1991 | Author replied that they did collect relevant reference standard data, but no longer have access to the dataset |
| Cunneen 2011 | The contact author replied that they did not collect a relevant reference standard |
| Davies 1995 | The first author replied that he is no longer able to find the dataset |
| Dijkstra 1998 | It is not clear from the published paper whether data were collected on a reference standard and/ or at least one index test (as it was not clear how dehydration status was assessed), and contact not established with author |
| Faull 1993 | Authors state that they no longer have access to the original dataset, and the thesis did not contain enough data for our analysis |
| Forsyth 2008 | Authors confirmed that they did not collect data on serum osmolality, short term weight change or serum data that would allow calculation of serum osmolarity |
| Fredrix 1990 | The authors replied that the data are no longer available |
| Fuller 1996 | Dataset received in full, but no data available on serum osmolality, short term weight change or serum data that would allow calculation of serum osmolarity |
| Gaspar 2009 | Full dataset provided by author. 70 religious sisters had serum osmolality and BIA measured but none had serum osmolality of at least 295 mOsm/kg, so the data could not be used |
| Gaspar 2011b | Author confirmed that none of our reference standards was measured |
| Gil Cama 2003 | The published paper suggests that data were collected on a reference standard (weight change) and at least one index test (fluid balance, which is likely to include assessment of fluid intake), however data are not in a format that can be used for this review and contact could not be established with author |
| Gross 1992 | Author replied that they no longer had the data |
| Hodkinson 1981 | The study appears to have assessed an index test (mental test score and "assessment of dehydration", method unclear) and may have assessed serum osmolarity (calculated, if serum sodium, potassium, glucose and urea are all available) but contact not established with the authors to confirm |
| Holben 1999 | Authors confirmed that they did not collect data on serum osmolality, short term weight change or serum data that would allow calculation of serum osmolarity |
| Hoyle 2011 | The published paper suggests that data were collected on at least one index test (BIA assessment of TBW, orthostatic hypotension), however it was not clear whether data were collected on at least one reference standard, and contact could not be established with the author |
| Johnson 1994 | The first author replied to our query and stated that the raw data for his study had not been kept, and are no longer available |
| Kayser‐Jones 1999 | Authors confirmed that they did not collect data on serum osmolality, short term weight change or serum data that would allow calculation of serum osmolarity |
| Kehayias 2012 | Author confirmed that they did not collect reference standard data |
| Kuo 2002 | The published paper suggests that data were collected on at least one index test (USG), however it was not clear whether data were collected on at least one reference standard, and contact could not be established with the author |
| Leibovitz 2007 | The author replied that the person who carried out the statistical analyses and kept the data is no longer available, so the data are no longer accessible |
| Leiper 2005 | The published paper suggests that data were collected on a reference standard (weight change) and at least one index test (urine volume, urine osmolality), however data are not in a format that can be used for this review and contact could not be established with author |
| Lennox 1980 | Authors confirmed that they did not collect data on serum osmolality, short term weight change or serum data that would allow calculation of serum osmolarity. |
| Martof 1997 | The published paper suggests that data were collected on a reference standard (serum osmolality and weight change) and at least one index test (fluid balance, fluid intake, urine volume, sunken eyes, dry mucous membranes, tenting), however data are not in a format that can be used for this review and contact could not be established with author |
| Mentes 2003 | Authors state that they did not collect any reference standard data |
| Mentes 2008 | Saliva osmolality collected, but no reference standard measured |
| Meuleman 1992 | Authors state that they no longer have access to the dataset |
| Morgan 2002 | The published paper suggests that data were collected on a reference standard (serum osmolality) and at least one index test (heart rate), however data are not in a format that can be used for this review and contact could not be established with author |
| Morgan 2003 | The published paper suggests that data were collected on a reference standard (serum osmolality) and at least one index test (urine osmolality, USG), however data are not in a format that can be used for this review and contact could not be established with author |
| Norman 2007 | The published paper suggests that data were collected on at least one index test (BIA assessment of TBW), however it was not clear whether data were collected on at least one reference standard, and contact could not be established with the author |
| O'Neill 1992 | Authors replied that they no longer have access to the dataset |
| O'Neill 1997 | Authors replied that they no longer have access to the dataset |
| Olde Rikkert 1997 | Authors replied that datasets have been lost in computer upgrades |
| Olde Rikkert 1998 | Authors replied that datasets have been lost in computer upgrades |
| Palevsky 1996 | Authors confirmed that they did not collect data on serum osmolality, short term weight change or serum data that would allow calculation of serum osmolarity |
| Perrier 2013 | Participants were aged 25 to 40 years, none were aged ≥ 65 years |
| Phillips 1984 | Professor Rolls posted us the PhD thesis that this paper was based on, but unfortunately it did not contain enough detail for us to create 2x2 tables (for serum osmolality versus. thirst, dry mouth, water intake and bad taste). Professor Phillips confirmed that the original datasets could not be located |
| Piccoli 2000 | The published paper suggests that data were collected on a reference standard (plasma osmolality) and at least one index test (BIA), however data are not in a format that can be used for this review and contact could not be established with author |
| Powers 2009 | Authors confirmed that they did not collect data on serum osmolality, short term weight change or serum data that would allow calculation of serum osmolarity |
| REGARDS Study 2010 | Primary investigator, George Howard, replied and Mary Cushman confirmed, that this study did not collect a reference standard |
| Rhodes 1995 | The published paper suggests that data were collected on at least one index test (intra ocular pressure, orthostatic hypotension), however it was not clear whether data were collected on at least one reference standard, and contact could not be established with the author |
| Rikkert 1997 | Authors replied that datasets have been lost in computer upgrades |
| Roberts 1991 | The published paper suggests that data were collected on a reference standard (weight change) and at least one index test (urine osmolality, urine output), however data are not in a format that can be used for this review and contact could not be established with author |
| Robinson 1985 | The published paper suggests that data were collected on at least one index test (orthostatic hypotension, skin turgor, axillial moisture, tongue, vein filling), however it was not clear whether data were collected on at least one reference standard, and contact could not be established with the author |
| Roos 1995 | It appears that the dataset includes a reference standard (weight change) and index tests (BIA assessment of TBW, skin turgor, dry mucous membranes, sunken eyes) but not in a format that can be utilised in the review, and no contact could be established with researchers |
| Rosher 2004 | It appears that the dataset includes a reference standard (weight change) and index tests (BIA assessment of TBW, ECW, foot vein filling, skin turgor, dry mucous membranes, sunken eyes, tongue furrows, pulse rate) but not in a format that can be utilised in the review, and no contact could be established with researchers |
| Rosler 2010 | Authors confirmed that they did not collect data on serum osmolality, short term weight change or serum data that would allow calculation of serum osmolarity |
| Rudolph 2011 | Authors replied that they did not collect any data we could use as a reference standard (no serum osmolality or components of osmolarity) |
| Savalle 2012 | Corresponding author replied to say that no reference standard was collected |
| Schols 1991 | Authors replied that the data were gathered too long ago to be recollected |
| Schut 2005 | It appears that the dataset includes a reference standard (plasma osmolality) and index tests (BIA assessment of TBW, dry tongue, tongue furrows, thirst perception, heart rate, orthostatic hypotension, dry mucous membranes) but not in a format that can be utilised in the review, and no dataset received (researcher stated he was ill and would consider this when he recovered) |
| Seinela 2003 | Authors confirmed that they did not collect data on serum osmolality, short term weight change or serum data that would allow calculation of serum osmolarity |
| Shim 1987 | It appears that the dataset aimed to induce dehydration but this was not clearly confirmed using a reference standard. Index tests (sputum production and elasticity) were assessed. No contact could be established with the authors |
| Ship 1997 | Dena Fischer replied that she had no access to the raw data, and that her colleague, J Ship, had died |
| Shiraki 1980 | It appears that the dataset includes a reference standard (serum osmolality) and index tests (urine output) but not in a format that can be utilised in the review, and no dataset received as contact could not be established with the authors |
| Simmons 2001 | The authors replied that they no longer have access to the original dataset |
| Singh 2013 | No participants were aged at least 65 years |
| Siregar 2010 | Urine osmolality assessed in elderly people but no reference standard collected |
| Spangler 1998 | The published paper suggests that data were collected on at least one index test (fluid intake), however it was not clear whether data were collected on at least one reference standard. The authors suggested that no reference standard was collected, but did not confirm this |
| Sugaya 2008 | It appears that the dataset includes a reference standard (serum osmolality) and index tests (urine osmolality) but not in a format that can be utilised in the review, and no dataset received as contact could not be established with the authors |
| Suhr 2004 | Authors confirmed that they did not collect data on serum osmolality, short term weight change or serum data that would allow calculation of serum osmolarity |
| Suhr 2010 | Authors confirmed that they did not collect data on serum osmolality, short term weight change or serum data that would allow calculation of serum osmolarity |
| Szewczyk 2008 | The published paper suggests that data were collected on at least one index test (fluid intake), however it was not clear whether data were collected on at least one reference standard, and contact could not be established with the author |
| Takahashi 1997 | The published paper suggests that data were collected on at least one reference standard (serum osmolality and osmolarity) and index test (BIA, TBW) but the data were not in a format that could be used directly in the review, the ages of participants were unclear, and contact could not be established with the authors |
| Telfer 1965 | Authors replied that data are now missing and could not be found following extensive contact with several possible institutions. |
| Thomas 2003 | It appears that the dataset includes a reference standard (serum osmolality) and index tests (orthostatic blood pressure change) but not in a format that can be utilised in the review, and no dataset received (discs containing statistical data not found, and new statistical programme now used) |
| Tonstad 2006 | Authors replied that they were not able to access the dataset due to computer problems (also, few aged > 65 years) |
| Vache 1998 | The only index tests used were TBW as a percentage of body weight by 18O isotope dilution and ECW as a percentage of TBW by bromide dilution. These methods were decided to be too complex to be useful signs to use in the community |
| van der Steen 2007 | Authors confirmed that they did not collect data on serum osmolality, short term weight change or serum data that would allow calculation of serum osmolarity |
| van Kraaij 1999 | It appears that the dataset includes a reference standard (weight change and plasma osmolality) and index tests (dry oral mucosa, thirst, blood pressure, heart rate) but not in a format that can be utilised in the review, and contact could not be established with the authors |
| Vazquez 2010 | Authors confirmed that they did not collect data on serum osmolality, short term weight change or serum data that would allow calculation of serum osmolarity |
| Vivanti 2008 | Authors provided dataset including serum osmolality, but none of the participants serum osmolality measures was greater than 291 mOsm/kg (so none had impending or current dehydration) so the data could not be used |
| Vivanti 2010 | Authors confirmed that they did not collect data on serum osmolality, short term weight change or serum data that would allow calculation of serum osmolarity |
| Wakefield 2002a | The dataset includes a reference standard (serum osmolality) and index tests (urine colour, urine osmolality, USG) in 89 cognitively intact older people aged at least 65 years and staying in an acute care or rehabilitation unit, however authors are unable to share the dataset with the review |
| Wakefield 2002b | The dataset includes a reference standard (calculated serum osmolarity) and index tests (fluid balance, which may include fluid intake and urine output) in 117 older people aged at least 65 years admitted to general medical units, however authors are unable to share the dataset with the review |
| Wakefield 2008 | The dataset includes a reference standard (calculated serum osmolarity and measured serum osmolality) and index tests (skin turgor, dryness of oral mucosa, urine output) in people admitted to hospital with dehydration or who developed dehydration during their stay. Some participants were aged at least 65 years, however authors are unable to share the dataset with the review |
| Waldreus 2010 | The first author replied that they did not collect a reference standard |
| Weinberg 1994a | It appears that the dataset includes a reference standard (serum osmolality) but not necessarily an index test and no contact could be established with the authors |
| Weinberg 1994b | It appears that the dataset includes a reference standard (serum osmolality) but not necessarily an index test and no contact could be established with the authors |
| Weiss 2012 | Unclear whether any reference standard was measured, but index tests (nocturia, sleep quality) were assessed. Contact could not be established with the authors |
| Wise 2000 | It appears that the dataset includes a reference standard (weight change) and index tests (fluid balance) but not in a format that can be utilised in the review, and no contact could be established with the researchers |
| Yoshihara 2007 | The published paper suggests that data were collected on at least one index test (saliva spinability), however it was not clear whether data were collected on at least one reference standard, and contact could not be established with the author |
| Yoshikawa 2012 | Unclear whether any reference standard was collected, contact could not be established with study authors |
BIA ‐ bioelectrical impedance analysis; ECW ‐ extracellular water; TBW ‐ total body water; USG ‐ urine specific gravity
Characteristics of studies awaiting classification [ordered by study ID]
El‐Sharkwi 2014.
| Clinical features and settings | |
| Participants | |
| Study design | |
| Target condition and reference standard(s) | |
| Index and comparator tests | |
| Follow‐up | |
| Notes |
Fortes 2014.
| Clinical features and settings | |
| Participants | |
| Study design | |
| Target condition and reference standard(s) | Plasma osmolality, mOsm/kg (directly measured)
|
| Index and comparator tests | Heart rate (130 participants)
Low resting systolic blood pressure (130 participants)
Dry mucous membrane (130 participants)
Axillary dryness (130 participants)
Poor skin turgor (130 participants)
Sunken eyes (130 participants)
Long capillary refill time (130 participants)
Assessment of dehydration (130 participants)
Saliva flow rate (130 participants)
Saliva osmolality
Urine colour
USG
Timing
|
| Follow‐up | |
| Notes | Protocol provided as personal communication, data collection and analysis complete and being prepared for publication as of November 2013 |
Hooper 2012.
| Clinical features and settings | |
| Participants | |
| Study design | |
| Target condition and reference standard(s) | Plasma osmolality, mOsm/kg (directly measured)
|
| Index and comparator tests | Heart rate and blood pressure
Tongue and mouth
Axillary dryness
Skin turgor
Sunken eyes
Capillary refill time
Assessment of dehydration
Urine volume, colour, USG and dipsticks Questions
Drinks
MMSE
Timing
|
| Follow‐up | |
| Notes | This is an ongoing study, recruiting 200 care home residents in the UK. Data collection is due to be completed in July 2013. Protocol can be downloaded from http://driestudy.appspot.com/cohort.html. Data collection complete and analysis about to commence as of November 2013. |
Ooi 1997.
| Clinical features and settings | |
| Participants | |
| Study design | |
| Target condition and reference standard(s) | |
| Index and comparator tests | |
| Follow‐up | |
| Notes |
Characteristics of ongoing studies [ordered by study ID]
Johnson 2012 [pers comm].
| Trial name or title | Dehydration study |
| Target condition and reference standard(s) |
|
| Index and comparator tests | Urine colour
Urinary components
Plasma creatinine Plasma CRP Haemoglobin Pulse rate Resting blood pressure Fluid balance assessment |
| Starting date | July 2012 |
| Contact information | Dr Peter Johnson, Department of Internal Medicine and Geriatrics, Södertälje Hospital, SE‐152 86 Södertälje, Sweden. Email: peter.johnson@sodertaljesjukhus.se |
| Notes | This study recruited 317 acutely admitted patients aged over 65 years. Data collection was completed and analyses are underway as of January 2014. |
Johnson 2013 [pers comm].
| Trial name or title | SÄBO study |
| Target condition and reference standard(s) |
|
| Index and comparator tests | Urine colour
Urinary components
Plasma CRP
Haemoglobin
Pulse rate Resting blood pressure Thirst
Dry mucous membranes
Dry or furrowed tongue
Skin turgor
Sunken eyes
Staff assessment
|
| Starting date | May 2013 |
| Contact information | Dr Peter Johnson, Department of Internal Medicine and Geriatrics, Södertälje Hospital, SE‐152 86 Södertälje, Sweden. Email: peter.johnson@sodertaljesjukhus.se |
| Notes | This study aims to recruit 100 nursing home patients, 60 currently recruited as of January 2014. |
Olde Rikkert 2013 [pers comm].
| Trial name or title | Diagnosis of dehydration in elderly patients by electronic nose analysis of exhaled air: a pilot study |
| Target condition and reference standard(s) |
|
| Index and comparator tests | eNose sensor
Tongue and oral mucous membranes
Axillary dryness Skin turgor
Heart rate and blood pressure
Weight and weight change Body temperature |
| Starting date | July 2013 |
| Contact information | Marcel Olde Rikkert, Marcel.OldeRikkert@Radboudumc.nl |
| Notes | This study recruited patients admitted to a geriatric department, and dehydrated patients from the emergency department. Data collection was completed in October 2013, and analysis and writing up is underway as of November 2013. |
CRP ‐ C‐reactive protein; USG ‐ urine specific gravity; VAS ‐ visual analogue scale
Differences between protocol and review
We introduced the following changes to the review after agreement and publication of the protocol:
Inclusion of serum osmolarity as a second reference standard
Post‐hoc ROC plot analyses to check whether cut‐offs other than the original three were diagnostically useful
At the suggestion of referees, we changed the title from Clinical and physical signs for identification of impending and current water‐loss dehydration in older people toClinical symptoms, signs and tests for identification of impending and current water‐loss dehydration in older people.
Contributions of authors
Lee Hooper conceived the review, drafted the protocol, organised the review, proposed initial cut‐offs for index tests, carried out the initial data analysis for this review, data extracted each study and wrote the first draft of this review. All authors contributed to refining and correcting the protocol, and/or contributed data to the review (Wayne W Campbell (Bossingham 2005); Philippe Chassagne (Chassagne 2006); Kennith R Culp, Janet C Mentes and Bonnie J Wakefield (Culp 2003); Stephen J Fletcher (Fletcher 1999); Phyllis M Gaspar (Gaspar 2011a); Lee Hooper and Mohannad Kafri (Kafri 2013); Theodore M Johnson II (Johnson 2003); Fumiko Kajii (Kajii 2006); Gregor Lindner (Lindner 2009); Gary W Mack (Mack 1994); Paolo Merlani and Andreas Perren (Perren 2011); James S Powers (Powers 2012); Anne M Rowat (Rowat 2011); Patrick Ritz (Source Study 2000): Fredrik Sjöstrand and Nana Waldréus (Sjöstrand ED 2013; Sjöstrand Healthy 2013); Jodi JD Stookey (Stookey 2005); Nancy Stotts (Stotts 2009); Neil Walsh and Matt Fortes (Fortes 2011)). All authors commented on the cut‐offs of the index tests and/or duplicated data extraction and analysis, and all authors have commented on, discussed and agreed the review process and final text of the review.
Sources of support
Internal sources
-
University of East Anglia, UK.
The review was unfunded, and the authors used some work time and resources (access to electronic journals and printing) to complete the review.
External sources
-
National Institute for Health Research, UK.
This report is independent research arises in part from a Career Development Fellowship to LH (NIHR‐CDF‐2011‐04‐025) supported by the National Institute for Health Research. The views expressed in this publication are those of the authors and not necessarily those of the NHS, the National Institute for Health Research or the Department of Health.
Declarations of interest
Asmaa Abdelhamid: none known
Natalie J Attreed: none known
Wayne W Campbell: none Known
Adam M Channell: none known
Philippe Chassagne: none known
Kennith R Culp: none known
Stephen J Fletcher: none known
Matthew B Fortes: none known
Nigel Fuller: none known
Phyllis M Gaspar: none of the consulting or research funding received presents a potential conflict of interest
Daniel J: Gilbert: none known
Adam C Heathcote: none known
Lee Hooper: LH's institution has received funding to allow her and her PhD student to investigate dehydration in older people ‐ this primary research follows on from this systematic review.
Paul R Hunter: PRH has been chair of the executive board of the Institute of Public Health and Water Research, Chicago, and was chair of the Science Advisory Council for Suez Environment until 2010. He has also given expert medical opinion in relation to outbreaks of waterborne disease
Mohannad W Kafri: none known
Fumiko Kajii: none known
Gregor Lindner: none known
Gary W Mack: The work reported in this project was funded by a grant from the National Institutes of Aging
Janet C Mentes: none known
Paolo Merlani: none known
Rowan A Needham: none known
Marcel GM Olde Rikkert: none known
Andreas Perren: none known
John F Potter: none known
James Powers: The work reported was funded by the National Institutes of Health and the Bureau of Health Professions. Dr Powers has given lectures to educational seminars, provided expert legal testimony, and has served on the HealthSpring Pharmacy Advisory Committee.
Sheila C Ranson: none known
Patrick Ritz: the work I did that is included in this review was performed at a time when I had no relationship with any company involved in hydration
Anne M Rowat: none known
Fredrik Sjöstrand: none known
Alexandra C Smith: none known
Jodi JD Stookey: JDS has received unrestricted research funding from Nestle Waters and Danone Waters to study hydration status
Nancy A Stotts: none known
David R Thomas: Dr Thomas has given lectures to educational seminars, provided expert legal testimony, and is author of a textbook Geriatric Nutrition.
Angela Vivanti: No money was paid, but airfares (Dietitians Association of Australia) and accommodation support (American Academy of Nutrition and Dietetics) were provided by professional associations to attend the International Nutrition and Dietetic Terminology meeting for eventual inclusion in SNOMED
Bonnie J Wakefield: none known
Nana Waldréus: none known
Neil Peter Walsh: I have no conflicts of interest. HydraDx who funded some of the data collection we mention in the Cochrane review had no interest in the mentioned variables (tear fluid composition)
Sean Ward: none known
New, comment added to review
References
References to studies included in this review
Allison 2005 {published data only (unpublished sought but not used)}
- Allison RD, Ray Lewis A, Liedtke R, Buchmeyer ND, Frank H. Early identification of hypovolemia using total body resistance measurements in long‐term care facility residents. Gender Medicine 2005;2(1):19‐34. [MEDLINE: ] [DOI] [PubMed] [Google Scholar]
Bossingham 2005 {published and unpublished data}
- Bossingham MJ, Carnell NS, Campbell WW. Water balance, hydration status, and fat‐free mass hydration in younger and older adults. American Journal of Clinical Nutrition 2005;81(6):1342‐50. [MEDLINE: ] [DOI] [PMC free article] [PubMed] [Google Scholar]
Chassagne 2006 {published and unpublished data}
- Chassagne P, Druesne L, Capet C, Menard JF, Bercoff E. Clinical presentation of hypernatremia in elderly patients: a case control study. Journal of the American Geriatrics Society 2006;54(8):1225‐30. [MEDLINE: ] [DOI] [PubMed] [Google Scholar]
Culp 2003 {published and unpublished data}
- Culp K, Mentes J, Wakefield B. Hydration and acute confusion in long‐term care residents. Western Journal of Nursing Research 2003;25(3):251‐66. [MEDLINE: ] [DOI] [PubMed] [Google Scholar]
- Culp KR, Wakefield B, Dyck MJ, Cacchione PZ, DeCrane S, Decker S. Bioelectrical impedance analysis and other hydration parameters as risk factors for delirium in rural nursing home residents. Journals of Gerontology Series A‐Biological Sciences & Medical Sciences 2004;59(8):813‐7. [MEDLINE: ] [DOI] [PubMed] [Google Scholar]
Eaton 1994 {published data only (unpublished sought but not used)}
- Eaton D, Bannister P, Mulley GP, Connolly MJ. Axillary sweating in clinical assessment of dehydration in ill elderly patients. BMJ 1994;308(6939):1271. [MEDLINE: ] [DOI] [PMC free article] [PubMed] [Google Scholar]
Fletcher 1999 {published and unpublished data}
- Fletcher SJ, Slaymaker AE, Bodenham AR, Vucevic M. Urine colour as an index of hydration in critically ill patients. Anaesthesia 1999;54(2):189‐92. [MEDLINE: ] [DOI] [PubMed] [Google Scholar]
Fortes 2011 {published and unpublished data}
- Fortes MB, Diment BC, Felice U, Gunn AE, Kendall JL, Esmaeelpour M, et al. Tear fluid osmolarity as a potential marker of hydration status. Medicine & Science in Sports & Exercise 2011;43(8):1590–7. [MEDLINE: ] [DOI] [PubMed] [Google Scholar]
- Walsh NP, Fortes MB, Purslow C, Esmeelpour M. Author response: Is whole‐body hydration an important consideration in dry eye?. Investigative Ophthalmology & Visual Science 2013;54(3):1713–4. [MEDLINE: ] [DOI] [PubMed] [Google Scholar]
- Walsh NP, Fortes MB, Raymond‐Barker P, Bishop C, Owen J, Tye E, et al. Is whole‐body hydration an important consideration in dry eye?. Investigative Ophthalmology & Visual Science 2012;53(10):6622‐7. [MEDLINE: ] [DOI] [PubMed] [Google Scholar]
Gaspar 2011a {published and unpublished data}
- Ellenbecker SM, Stimpert PM, Gaspar PM, Forsyth D. Hydration status of the elderly: validity of non‐invasive measures for assessment. 25th Anniversary Minnesota Geriatric Care Conference; 2008 27 March; Rochester MN, USA. 2008.
- Gaspar P, Forsyth D. Hydration status of the elderly: validity of non‐invasive assessment measures. 31st Annual Midwest Nursing Research Society Conference; 2007 March‐April; Omaha, NE, USA. 2007. [http://hdl.handle.net/10755/158527]
- Gaspar PM. Comparison of four standards for determining adequate water intake of nursing home residents. Research & Theory for Nursing Practice 2011;25(1):11‐22. [MEDLINE: ] [PubMed] [Google Scholar]
Johnson 2003 {published and unpublished data}
- Johnson TM 2nd, Miller M, Pillion DJ, Ouslander JG. Arginine vasopressin and nocturnal polyuria in older adults with frequent nighttime voiding. Journal of Urology 2003;170(2 Pt 1):480‐4. [MEDLINE: ] [DOI] [PubMed] [Google Scholar]
Kafri 2013 {published and unpublished data}
- Kafri MW, Myint PK, Doherty D, Wilson AH, Potter JF, Hooper L. Hydration status following stroke and the relationship between hydration and functional status at discharge. Scientific Report to the European Hydration Institute. January 2012. www.europeanhydrationinstitute.org/wp‐content/uploads/2012/08/Abstract_M_Kafri.pdf (accessed 14 April 2015).
- Kafri MW, Myint PK, Doherty D, Wilson AH, Potter JF, Hooper L. The diagnostic accuracy of multi‐frequency bioelectrical impedance analysis in diagnosing dehydration after stroke. Medical Science Monitor 2013;19:548‐70. [MEDLINE: ] [DOI] [PMC free article] [PubMed] [Google Scholar]
Kajii 2006 {published and unpublished data}
- Kajii F, Gomi I, Sugiyama M. Dehydration and water intake in frail elderly at home. Bulletin of St.Luke's College of Nursing 2006;32:43‐50. [CINAHL: 2009164516] [Google Scholar]
Lindner 2009 {published and unpublished data}
- Lindner G, Kneidinger N, Holzinger U, Druml W, Schwarz C. Tonicity balance in patients with hypernatremia acquired in the intensive care unit. American Journal of Kidney Diseases 2009;54(4):674‐9. [MEDLINE: ] [DOI] [PubMed] [Google Scholar]
Mack 1994 {published and unpublished data}
- Mack GW, Weseman CA, Langhans GW, Scherzer H, Gillen CM, Nadel ER. Body fluid balance in dehydrated healthy older men: thirst and renal osmoregulation. Journal of Applied Physiology 1994;76(4):1615‐23. [MEDLINE: ] [DOI] [PubMed] [Google Scholar]
McGarvey 2010 {published and unpublished data}
- McGarvey J, Thompson J, Hanna C, Noakes TD, Stewart J, Speedy D. Sensitivity and specificity of clinical signs for assessment of dehydration in endurance athletes. British Journal of Sports Medicine 2010;44(10):716‐9. [MEDLINE: ] [DOI] [PubMed] [Google Scholar]
Monahan 2006 {published and unpublished data}
- Monahan K, Zhou C, Rose J, Adler D. Determinants of changes in B‐type natriuretic peptide levels in hospitalized patients. Journal of Clinical and Basic Cardiology 2006;9(1‐4):31‐6. [EMBASE: 2008493123] [Google Scholar]
Perren 2011 {published and unpublished data}
- Perren A, Markmann M, Merlani G, Marone C, Merlani P. Fluid balance in critically ill patients ‐ should we really rely on it?. Minerva Anestesiologica 2011;77(8):802‐11. [MEDLINE: ] [PubMed] [Google Scholar]
Powers 2012 {published and unpublished data}
- Powers JS, Buchowski M, Wang L, Otoo‐Boameh A. Total body water in elderly adults ‐ assessing hydration status by bioelectrical impedance analysis vs. urine osmolality. Journal of the American Geriatrics Society 2012;60(2):388‐90. [MEDLINE: ] [DOI] [PMC free article] [PubMed] [Google Scholar]
Rowat 2011 {published and unpublished data}
- Rowat A, Smith L, Graham C, Lyle D, Horsburgh D, Dennis M. A pilot study to assess if urine specific gravity and urine colour charts are useful indicators of dehydration in acute stroke patients. Journal of Advanced Nursing 2011;67(9):1976‐83. [MEDLINE: ] [DOI] [PubMed] [Google Scholar]
Shimizu 2012 {published data only (unpublished sought but not used)}
- Kinoshita K, Hattori K, Ota Y, Kanai T, Shimizu M, Kobayashi H, et al. The measurement of axillary moisture for the assessment of dehydration among older patients: a pilot study. Experimental Gerontology 2013;48(2):255‐8. [MEDLINE: ] [DOI] [PubMed] [Google Scholar]
- Shimizu M, Kinoshita K, Hattori K, Ota Y, Kanai T, Kobayashi H, et al. Physical signs of dehydration in the elderly. Internal Medicine 2012;51(10):1207‐12. [MEDLINE: ] [DOI] [PubMed] [Google Scholar]
Sjöstrand ED 2013 {published and unpublished data}
- Sjöstrand F, Rodhe P, Berglund E, Lundström N, Svensen C. The use of a noninvasive hemoglobin monitor for volume kinetic analysis in an emergency room setting. Anesthesia & Analgesia 2013;116(2):337‐42. [MEDLINE: ] [DOI] [PubMed] [Google Scholar]
Sjöstrand Healthy 2013 {unpublished data only}
- Rodhe PM. Mathematical modelling of clinical applications in fluid therapy [PhD thesis]. Karolinska Institutet, 2010. [ISBN: 917457017X, 9789174570175; http://publications.ki.se/xmlui/handle/10616/39713?locale‐attribute=en</body></html>] [Google Scholar]
Source Study 2000 {published and unpublished data}
- Ritz P. Body water spaces and cellular hydration during healthy aging. Annals of the New York Academy of Sciences 2000;904:474‐83. [MEDLINE: ] [DOI] [PubMed] [Google Scholar]
- Ritz P, Source Study. Bioelectrical impedance analysis estimation of water compartments in elderly diseased patients: the source study. Journals of Gerontology Series A‐Biological Sciences & Medical Sciences 2001;56(6):M344‐8. [MEDLINE: ] [DOI] [PubMed] [Google Scholar]
- Ritz P, Source Study. Chronic cellular dehydration in the aged patient. Journals of Gerontology ‐ Series A Biological Sciences and Medical Sciences 2001;56(6):M349‐52. [MEDLINE: ] [DOI] [PubMed] [Google Scholar]
Stookey 2005 {published and unpublished data}
- Stookey JD. High prevalence of plasma hypertonicity among community‐dwelling older adults: results from NHANES III. Journal of the American Dietetic Association 2005;105(8):1231‐9. [MEDLINE: ] [DOI] [PubMed] [Google Scholar]
Stotts 2009 {published and unpublished data}
- Stotts NA, Hopf HW, Kayser‐Jones J, Chertow GM, Cooper BA, Wu HS. Increased fluid intake does not augment capacity to lay down new collagen in nursing home residents at risk for pressure ulcers: a randomized, controlled clinical trial. Wound Repair & Regeneration 2009;17(6):780‐8. [MEDLINE: ] [DOI] [PubMed] [Google Scholar]
References to studies excluded from this review
Albert 1989 {published data only}
- Albert SG, Nakra BR, Grossberg GT, Caminal ER. Vasopressin response to dehydration in Alzheimer's disease. Journal of the American Geriatrics Society 1989;37(9):843‐7. [MEDLINE: ] [DOI] [PubMed] [Google Scholar]
Bennett 2004 {published data only}
- Bennett JA, Thomas V, Riegel B. Unrecognized chronic dehydration in older adults: examining prevalence rate and risk factors. Journal of Gerontological Nursing 2004;30(11):22‐8. [MEDLINE: ] [DOI] [PubMed] [Google Scholar]
Bourdel‐Marchasson 2004 {published data only}
- Bourdel‐Marchasson I, Proux S, Dehail P, Muller F, Richard‐Harston S, Traissac T, et al. One‐year incidence of hyperosmolar states and prognosis in a geriatric acute care unit. Gerontology 2004;50(3):171‐6. [MEDLINE: ] [DOI] [PubMed] [Google Scholar]
Bowser‐Wallace 1985 {published data only}
- Bowser‐Wallace BH, Cone JB, Caldwell FT Jr. Hypertonic lactated saline resuscitation of severely burned patients over 60 years of age. Journal of Trauma‐Injury Infection & Critical Care 1985;25(1):22‐6. [MEDLINE: ] [DOI] [PubMed] [Google Scholar]
Bruzzone 2004 {published data only}
- Bruzzone P, Chiumello D, Altavilla P, Saia G, Scopacasa F, Gattinoni L. The fluid balance in the critically ill patient [Il bilancio idrico nel malato di terapia intensiva]. Minerva Anestesiologica 2004;70(5):431‐6. [MEDLINE: ] [PubMed] [Google Scholar]
Buffa 2010 {published data only}
- Buffa R, Mereu RM, Putzu PF, Floris G, Marini E. Bioelectrical impedance vector analysis detects low body cell mass and dehydration in patients with Alzheimer's disease. Journal of Nutrition, Health & Aging 2010;14(10):823‐7. [MEDLINE: ] [DOI] [PubMed] [Google Scholar]
Chen 2006 {published data only}
- Chen LK, Lin MH, Hwang SJ, Chen TW. Hyponatremia among the institutionalized elderly in 2 long‐term care facilities in Taipei. Journal of the Chinese Medical Association: JCMA 2006;69(3):115‐9. [MEDLINE: ] [DOI] [PubMed] [Google Scholar]
Chen 2010 {published data only}
- Chen CC, Dai Y, Yen C, Huang G, Wang C. Shared risk factors for distinct geriatric syndromes in older Taiwanese inpatients. Nursing Research 2010;59(5):340‐7. [MEDLINE: ] [DOI] [PubMed] [Google Scholar]
Cooper 1991 {published data only (unpublished sought but not used)}
- Cooper JW. Renal function assessment in nursing home patients: a prospective 6‐month study in 282 patients. Journal of Geriatric Drug Therapy 1991;5(3):59‐71. [EMBASE: 1991224723] [Google Scholar]
Cunneen 2011 {published data only (unpublished sought but not used)}
- Cunneen S, Jones J, Davidson I, Bannerman E. An investigation of food provision and consumption in a care home setting. British Journal of Community Nursing 2011;16(5):22‐8. [ISSN: 1462‐4753] [Google Scholar]
Davies 1995 {published data only (unpublished sought but not used)}
- Davies I, O'Neill PA, McLean KA, Catania J, Bennett D. Age‐associated alterations in thirst and arginine vasopressin in response to a water or sodium load. Age & Ageing 1995;24(2):151‐9. [MEDLINE: ] [DOI] [PubMed] [Google Scholar]
Dijkstra 1998 {published data only}
- Dijkstra A, Sipsma DH, Dassen TWN. Care dependency and survival among female patients with Alzheimer's disease: a two‐year follow‐up. Croatian Medical Journal 1998;39(3):365‐70. [MEDLINE: ] [PubMed] [Google Scholar]
Faull 1993 {published data only}
- Faull CM. Anatomical and physiological relationships between central serotonin and vasopressin [MD thesis]. Newcastle: University of Newcastle upon Tyne, 1992. [Google Scholar]
- Faull CM, Holmes C, Baylis PH. Water balance in elderly people: is there a deficiency of vasopressin?. Age & Ageing 1993;22(2):114‐20. [MEDLINE: ] [DOI] [PubMed] [Google Scholar]
Forsyth 2008 {published data only}
- Forsyth DM, Lapid MI, Ellenbecker SM, Smith LK, O'Neil ML, Low DJ, et al. Hydration status of geriatric patients in a psychiatric hospital. Issues in Mental Health Nursing 2008;29(8):853‐62. [MEDLINE: ] [DOI] [PubMed] [Google Scholar]
Fredrix 1990 {published data only}
- Fredrix EW, Saris WH, Soeters PB, Wouters EF, Kester AD, Meyenfeldt MF, et al. Estimation of body composition by bioelectrical impedance in cancer patients. European Journal of Clinical Nutrition 1990;44(10):749‐52. [MEDLINE: ] [PubMed] [Google Scholar]
Fuller 1996 {published data only}
- Fuller NJ, Sawyer MB, Laskey MA, Paxton P, Elia M. Prediction of body composition in elderly men over 75 years of age. Annals of Human Biology 1996;23(2):127‐47. [MEDLINE: ] [DOI] [PubMed] [Google Scholar]
Gaspar 2009 {unpublished data only}
- Gaspar P. Hydration status of independent dwelling and assisted living women: a comparison of assessment measures and associated factors. Midwest Nursing Research Society 33rd Annual Conference; 2009 March; Minneapolis (MN), USA. 2009. [http://www.nursinglibrary.org/vhl/handle/10755/158955]
Gaspar 2011b {published and unpublished data}
- Gaspar PM. Comparison of four standards for determining adequate water intake of nursing home residents. Research and Theory for Nursing Practice 2011;25(1):11‐22. [MEDLINE: ] [PubMed] [Google Scholar]
Gil Cama 2003 {published data only}
- Gil Cama A, Mendoza Delgado D. Accumulated fluid balance in patients admitted to the ICU: is it really reliable? [Balance liquido acumulado en los enfermos ingresados en la UCI: ?es realmente fiable?]. Enfermeria Intensiva 2003;14(4):148‐55. [MEDLINE: ] [DOI] [PubMed] [Google Scholar]
Gross 1992 {published data only}
- Gross CR, Lindquist RD, Woolley AC, Granieri R, Allard K, Webster B. Clinical indicators of dehydration severity in elderly patients. Journal of Emergency Medicine 1992;10(3):267‐74. [MEDLINE: ] [DOI] [PubMed] [Google Scholar]
Hodkinson 1981 {published data only (unpublished sought but not used)}
- Hodkinson HM, Piper M. Clinical and laboratory profile information in the prediction of death in elderly patients. Age & Ageing 1981;10(1):10‐13. [MEDLINE: ] [DOI] [PubMed] [Google Scholar]
Holben 1999 {published data only}
- Holben DH, Hassell JT, Williams JL, Helle B. Fluid intake compared with established standards and symptoms of dehydration among elderly residents of a long‐term‐care facility. Journal of the American Dietetic Association 1999;99(11):1447‐50. [MEDLINE: ] [DOI] [PubMed] [Google Scholar]
- Huszagh VA. Fluid needs of older adults. Journal of the American Dietetic Association 2000;100(7):768. [MEDLINE: ] [DOI] [PubMed] [Google Scholar]
Hoyle 2011 {published data only}
- Hoyle GE, Chua M, Soiza RL. Volaemic assessment of the elderly hyponatraemic patient: reliability of clinical assessment and validation of bioelectrical impedance analysis. Qjm 2011;104(1):35‐9. [MEDLINE: ] [DOI] [PubMed] [Google Scholar]
Johnson 1994 {published data only (unpublished sought but not used)}
- Johnson AG, Crawford GA, Kelly D, Nguyen TV, Gyory AZ. Arginine vasopressin and osmolality in the elderly. Journal of the American Geriatrics Society 1994;42(4):399‐404. [MEDLINE: ] [DOI] [PubMed] [Google Scholar]
Kayser‐Jones 1999 {published data only}
- Kayser‐Jones J, Schell ES, Porter C, Barbaccia JC, Shaw H. Factors contributing to dehydration in nursing homes: inadequate staffing and lack of professional supervision. Journal of the American Geriatrics Society 1999;47(10):1187‐94. [MEDLINE: ] [DOI] [PubMed] [Google Scholar]
Kehayias 2012 {published data only (unpublished sought but not used)}
- Kehayias JJ, Ribeiro SM, Skahan A, Itzkowitz L, Dallal G, Rogers G, et al. Water homeostasis, frailty and cognitive function in the nursing home. Journal of Nutrition, Health & Aging 2012;16(1):35‐9. [MEDLINE: ] [DOI] [PubMed] [Google Scholar]
Kuo 2002 {published data only}
- Kuo HC. Efficacy of desmopressin in treatment of refractory nocturia in patients older than 65 years. Urology 2002;59(4):485‐9. [MEDLINE: ] [DOI] [PubMed] [Google Scholar]
Leibovitz 2007 {published data only}
- Leibovitz A, Baumoehl Y, Lubart E, Yaina A, Platinovitz N, Segal R. Dehydration among long‐term care elderly patients with oropharyngeal dysphagia. Gerontology 2007;53(4):179‐83. [MEDLINE: ] [DOI] [PubMed] [Google Scholar]
Leiper 2005 {published data only}
- Leiper JB, Seonaid Primrose C, Primrose WR, Phillimore J, Maughan RJ. A comparison of water turnover in older people in community and institutional settings. Journal of Nutrition, Health & Aging 2005;9(3):189‐93. [MEDLINE: ] [PubMed] [Google Scholar]
Lennox 1980 {published data only}
- Lennox IM, Williams BO. Postural hypotension in the elderly. Journal of Clinical & Experimental Gerontology 1980;2(4):313‐28. [EMBASE: 1981094701] [Google Scholar]
Martof 1997 {published data only}
- Martof MT, Knox DK. The effect of xanthines on fluid balance. Clinical Nursing Research 1997;6(2):186‐96. [MEDLINE: ] [DOI] [PubMed] [Google Scholar]
Mentes 2003 {published data only (unpublished sought but not used)}
- Mentes JC, Culp K. Reducing hydration‐linked events in nursing home residents. Clinical Nursing Research 2003;12(3):210‐25. [MEDLINE: ] [DOI] [PubMed] [Google Scholar]
Mentes 2008 {published and unpublished data}
- Mentes J. Feasibility of using salivary osmolality as a marker for hydration status in nursing home residents. 61st Annual Scientific Meeting of the Gerontological Society of America; 2008, November; National Harbor (MD), USA. 2008:430‐2.
Meuleman 1992 {published data only}
- Meuleman JR, Hoffman NB, Conlin MM, Lowenthal DT, Delafuente JC, Graves JE. Health status of the aged: Medical profile of a group of functional elderly. Southern Medical Journal 1992;85(5):464‐8. [MEDLINE: ] [DOI] [PubMed] [Google Scholar]
Morgan 2002 {published data only}
- Morgan AL, Sinning WE, Weldy DL. Age effects on body fluid distribution during exercise in the heat. Aviation Space & Environmental Medicine 2002;73(8):750‐7. [MEDLINE: ] [PubMed] [Google Scholar]
Morgan 2003 {published data only}
- Morgan AL, Masterson MM, Fahlman MM, Topp RV, Boardley D. Hydration status of community‐dwelling seniors. Aging‐Clinical & Experimental Research 2003;15(4):301‐4. [MEDLINE: ] [DOI] [PubMed] [Google Scholar]
Norman 2007 {published data only}
- Norman K, Smoliner C, Valentini L, Lochs H, Pirlich M. Is bioelectrical impedance vector analysis of value in the elderly with malnutrition and impaired functionality?. Nutrition 2007;23(7‐8):564‐9. [MEDLINE: ] [DOI] [PubMed] [Google Scholar]
O'Neill 1992 {published data only}
- O'Neill PA, Davies I, Fullerton KJ, Bennett D, O'Neill PA, Davies I, et al. Fluid balance in elderly patients following acute stroke. Age & Ageing 1992;21(4):280‐5. [MEDLINE: ] [DOI] [PubMed] [Google Scholar]
O'Neill 1997 {published data only}
- O'Neill PA, Duggan J, Davies I. Response to dehydration in elderly patients in long‐term care. Aging‐Clinical & Experimental Research 1997;9(5):372‐7. [MEDLINE: ] [DOI] [PubMed] [Google Scholar]
Olde Rikkert 1997 {published data only}
- Olde Rikkert MG, Deurenberg P, Jansen RW, van't Hof MA, Hoefnagels WH. Validation of multi‐frequency bioelectrical impedance analysis in detecting changes in fluid balance of geriatric patients. Journal of the American Geriatrics Society 1997;45(11):1345‐51. [MEDLINE: ] [DOI] [PubMed] [Google Scholar]
Olde Rikkert 1998 {published data only}
- Olde Rikkert MG, VaN'T Hof MA, Baadenhuysen H, Hoefnagels WH. Individuality and responsiveness of biochemical indices of dehydration in hospitalized elderly patients. Age & Ageing 1998;27(3):311‐9. [EMBASE: 1998251762] [Google Scholar]
Palevsky 1996 {published data only (unpublished sought but not used)}
- Palevsky PM, Bhagrath R, Greenberg A. Hypernatremia in hospitalized patients. Annals of Internal Medicine 1996;124(2):197‐203. [MEDLINE: ] [DOI] [PubMed] [Google Scholar]
Perrier 2013 {published data only}
- Perrier E, Vergne S, Klein A, Poupin M, Rondeau P, Bellego L, et al. Hydration biomarkers in free‐living adults with different levels of habitual fluid consumption. British Journal of Nutrition 2013;109(9):1678‐87. [MEDLINE: ] [DOI] [PMC free article] [PubMed] [Google Scholar]
Phillips 1984 {published data only}
- Crowe MJ, Forsling ML, Rolls BJ, Phillips PA, Ledingham JG, Smith RF. Altered water excretion in healthy elderly men. Age & Ageing 1987;16(5):285‐93. [MEDLINE: ] [DOI] [PubMed] [Google Scholar]
- Phillips PA, Rolls BJ, Ledingham JG, Forsling ML, Morton JJ, Crowe MJ, et al. Reduced thirst after water deprivation in healthy elderly men. New England Journal of Medicine 1984;311(12):753‐9. [MEDLINE: ] [DOI] [PubMed] [Google Scholar]
Piccoli 2000 {published data only}
- Piccoli A, Pittoni G, Facco E, Favaro E, Pillon L. Relationship between central venous pressure and bioimpedance vector analysis in critically ill patients. Critical Care Medicine 2000;28(1):132‐7. [MEDLINE: ] [DOI] [PubMed] [Google Scholar]
Powers 2009 {published data only}
- Powers JS, Choi L, Bitting R, Gupta N, Buchowski M. Rapid measurement of total body water to facilitate clinical decision making in hospitalized elderly patients. Journals of Gerontology Series A‐Biological Sciences & Medical Sciences 2009;64(6):664‐9. [MEDLINE: ] [DOI] [PMC free article] [PubMed] [Google Scholar]
REGARDS Study 2010 {published data only (unpublished sought but not used)}
- Tamura MK, Wadley VG, Newsome BB, Zakai NA, McClure LA, Howard G, Warnock DG, McClellan W. Hemoglobin concentration and cognitive impairment in the Renal REasons for Geographic And Racial Differences in Stroke (REGARDS) Study. Journal of Gerontology A Biol Sci Med Sci 2010;65A(12):1380‐6. [DOI] [PMC free article] [PubMed] [Google Scholar]
Rhodes 1995 {published data only}
- Rhodes KM. Can the measurement of intraocular pressure be useful in assessing dehydration and rehydration?. Journal of the American Geriatrics Society 1995;43(5):589‐90. [MEDLINE: ] [DOI] [PubMed] [Google Scholar]
Rikkert 1997 {published data only}
- Rikkert MG, Bercken JH, Have HA, Hoefnagels WH. Experienced consent in geriatrics research: A new method to optimize the capacity to consent in frail elderly subjects. Journal of Medical Ethics 1997;23(5):271‐6. [MEDLINE: ] [DOI] [PMC free article] [PubMed] [Google Scholar]
Roberts 1991 {published data only}
- Roberts SB, Ferland G, Young VR, Morrow F, Heyman MB, Melanson KJ, et al. Objective verification of dietary intake by measurement of urine osmolality. American Journal of Clinical Nutrition 1991;54(5):774‐82. [MEDLINE: ] [DOI] [PubMed] [Google Scholar]
Robinson 1985 {published data only}
- Robinson SB, Demuth PL. Diagnostic studies for the aged: what are the dangers?. Journal of Gerontological Nursing 1985;11(6):6‐9. [MEDLINE: ] [DOI] [PubMed] [Google Scholar]
Roos 1995 {published data only}
- Roos AN, Westendorp RG, Brand R, Souverijn JH, Frolich M, Meinders AE. Predictive value of tetrapolar body impedance measurements for hydration status in critically ill patients. Intensive Care Medicine 1995;21(2):125‐31. [MEDLINE: ] [DOI] [PubMed] [Google Scholar]
Rosher 2004 {published data only}
- Rosher RB, Robinson SB. Use of foot veins to monitor hydration in the elderly. Journal of the American Geriatrics Society 2004;52(2):322‐4. [MEDLINE: ] [DOI] [PubMed] [Google Scholar]
Rosler 2010 {published data only}
- Rosler A, Lehmann F, Krause T, Wirth R, Renteln‐Kruse W. Nutritional and hydration status in elderly subjects: Clinical rating versus bioimpedance analysis. Archives of Gerontology & Geriatrics 2010;50(3):e81‐5. [MEDLINE: ] [DOI] [PubMed] [Google Scholar]
Rudolph 2011 {published data only (unpublished sought but not used)}
- Rudolph JL, Harrington MB, Lucatorto MA, Chester JG, Francis J, Shay KJ, et al. Validation of a medical record‐based delirium risk assessment. Journal of the American Geriatrics Society 2011;59 Suppl 2:S289‐94. [MEDLINE: ] [DOI] [PMC free article] [PubMed] [Google Scholar]
Savalle 2012 {published data only (unpublished sought but not used)}
- Savalle M, Gillaizeau F, Maruani G, Puymirat E, Bellenfant F, Houillier P, et al. Assessment of body cell mass at bedside in critically ill patients. American Journal of Physiology ‐ Endocrinology & Metabolism 2012;303(3):E389‐96. [MEDLINE: ] [DOI] [PubMed] [Google Scholar]
Schols 1991 {published data only}
- Schols AM, Wouters EF, Soeters PB, Westerterp KR. Body composition by bioelectrical‐impedance analysis compared with deuterium dilution and skinfold anthropometry in patients with chronic obstructive pulmonary disease. American Journal of Clinical Nutrition 1991;53(2):421‐4. [MEDLINE: ] [DOI] [PubMed] [Google Scholar]
Schut 2005 {published data only}
- Schut A, Dascendo V, Giraud K, Chatap G, Royand F, Blonde‐Cynober F, et al. Is biolectrical impedance analysis a tool at bedside, during heat waves to assist geriatricians with discriminative diagnosis of hypertonic dehydration?. Journal of Nutrition, Health & Aging 2005;9(6):441‐5. [MEDLINE: ] [PubMed] [Google Scholar]
Seinela 2003 {published data only}
- Seinela L, Pehkonen E, Laasanen T, Ahvenainen J. Bowel preparation for colonoscopy in very old patients: a randomized prospective trial comparing oral sodium phosphate and polyethylene glycol electrolyte lavage solution. Scandinavian Journal of Gastroenterology 2003;38(2):216‐20. [MEDLINE: ] [PubMed] [Google Scholar]
Shim 1987 {published data only}
- Shim C, King M, Williams MH Jr. Lack of effect of hydration on sputum production in chronic bronchitis. Chest 1987;92(4):679‐82. [MEDLINE: ] [DOI] [PubMed] [Google Scholar]
Ship 1997 {published data only}
- Ship JA, Fischer DJ. The relationship between dehydration and parotid salivary gland function in young and older healthy adults. Journals of Gerontology Series A‐Biological Sciences & Medical Sciences 1997;52(5):M310‐9. [MEDLINE: ] [DOI] [PubMed] [Google Scholar]
Shiraki 1980 {published data only}
- Shiraki M, Takahashi R, Itoh H. The clinical study of hyponatremia in the elderly. Part two. Renal function in the aged hyponatremia. Nippon Ronen Igakkai Zasshi [Japanese Journal of Geriatrics] 1980;17(1):1‐6. [MEDLINE: ] [DOI] [PubMed] [Google Scholar]
Simmons 2001 {published data only}
- Simmons SF, Alessi C, Schnelle JF. An intervention to increase fluid intake in nursing home residents: prompting and preference compliance. Journal of the American Geriatrics Society 2001;49(7):926‐33. [MEDLINE: ] [DOI] [PubMed] [Google Scholar]
Singh 2013 {published data only}
- Singh NR, Peters EM. Markers of hydration status in a 3‐day trail running event. Clinical Journal of Sport Medicine 2013;23(5):354‐64. [MEDLINE: ] [DOI] [PubMed] [Google Scholar]
Siregar 2010 {published data only}
- Siregar P, Setiati S. Urine osmolality in the elderly. Acta Medica Indonesiana 2010;42(1):24‐6. [MEDLINE: ] [PubMed] [Google Scholar]
Spangler 1998 {published data only}
- Spangler AA, Chidester JC. Age, dependency and other factors influencing fluid intake by long term care residents. Journal of Nutrition for the Elderly 1998;18(2):21‐35. [DOI: 10.1300/J052v18n02_02] [DOI] [Google Scholar]
Sugaya 2008 {published data only (unpublished sought but not used)}
- Sugaya K, Nishijima S, Oda M, Owan T, Miyazato M, Ogawa Y. Biochemical and body composition analysis of nocturia in the elderly. Neurology & Urodynamics 2008;27(3):205‐211. [MEDLINE: ] [DOI] [PubMed] [Google Scholar]
Suhr 2004 {published data only}
- Suhr JA, Hall J, Patterson SM, Niinisto RT. The relation of hydration status to cognitive performance in healthy older adults. International Journal of Psychophysiology 2004;53(2):121‐5. [MEDLINE: ] [DOI] [PubMed] [Google Scholar]
Suhr 2010 {published data only}
- Suhr JA, Patterson SM, Austin AW, Heffner KL. The relation of hydration status to declarative memory and working memory in older adults. Journal of Nutrition, Health & Aging 2010;14(10):840‐3. [MEDLINE: ] [DOI] [PubMed] [Google Scholar]
Szewczyk 2008 {published data only}
- Szewczyk MT, Jawien A, Kedziora‐Kornatowska K, Moscicka P, Cwajda J, Cierzniakowska K, et al. The nutritional status of older adults with and without venous ulcers: a comparative, descriptive study. Ostomy Wound Management 2008;54(9):34‐42. [MEDLINE: ] [PubMed] [Google Scholar]
Takahashi 1997 {published data only}
- Takahashi N. Circannual variations in physical and laboratory data of the outpatients. Journal of the Japanese Association of Physical Medicine Balneology & Climatology 1997;60(4):240‐8. [EMBASE: 1997293807] [Google Scholar]
Telfer 1965 {published data only}
- Telfer N, Persoff M. The effect of tube feeding on the hydration of elderly patients. Journal of Gerontology 1965;20(4):536‐43. [4953659] [PubMed] [Google Scholar]
Thomas 2003 {published data only}
- Thomas DR, Tariq SH, Makhdomm S, Haddad R, Moinuddin A. Physician misdiagnosis of dehydration in older adults. Journal of the American Medical Directors Association 2003;4(5):251‐4. [MEDLINE: ] [DOI] [PubMed] [Google Scholar]
Tonstad 2006 {published data only}
- Tonstad S, Klemsdal TO, Landaas S, Hoieggen A. No effect of increased water intake on blood viscosity and cardiovascular risk factors. British Journal of Nutrition 2006;96(6):993‐6. [MEDLINE: ] [DOI] [PubMed] [Google Scholar]
Vache 1998 {published and unpublished data}
- Vache C, Rousset P, Gachon P, Gachon AM, Morio B, Boulier A, et al. Bioelectrical impedance analysis measurements of total body water and extracellular water in healthy elderly subjects. International Journal of Obesity 1998;22(6):537‐43. [MEDLINE: ] [DOI] [PubMed] [Google Scholar]
van der Steen 2007 {published data only (unpublished sought but not used)}
- Steen JT, Mehr DR, Kruse RL, Ribbe MW, Wal G. Dementia, lower respiratory tract infection, and long‐term mortality. Journal of the American Directors Association 2007;8(6):396‐403. [MEDLINE: ] [DOI] [PubMed] [Google Scholar]
van Kraaij 1999 {published data only}
- Kraaij DJ, Jansen RW, Hoefnagels WH. Monitoring hypovolemia in healthy elderly subjects by measuring blood pressure response to Valsalva's maneuver. Geriatric Nephrology & Urology 1999;9(2):73‐9. [MEDLINE: ] [DOI] [PubMed] [Google Scholar]
Vazquez 2010 {published data only}
- Vazquez R, Gheorghe C, Kaufman D, Manthous CA. Accuracy of bedside physical examination in distinguishing categories of shock: a pilot study. Journal of Hospital Medicine (Online) 2010;5(8):471‐4. [MEDLINE: ] [DOI] [PubMed] [Google Scholar]
Vivanti 2008 {published and unpublished data}
- Vivanti A, Harvey K, Ash S, Battistutta D. Clinical assessment of dehydration in older people admitted to hospital: what are the strongest indicators?. Archives of Gerontology & Geriatrics 2008;47(3):340‐55. [MEDLINE: ] [DOI] [PubMed] [Google Scholar]
Vivanti 2010 {published data only (unpublished sought but not used)}
- Vivanti A, Harvey K, Ash S. Developing a quick and practical screen to improve the identification of poor hydration in geriatric and rehabilitative care. Archives of Gerontology & Geriatrics 2010;50(2):156‐64. [MEDLINE: ] [DOI] [PubMed] [Google Scholar]
Wakefield 2002a {published data only (unpublished sought but not used)}
- Wakefield B, Mentes J, Diggelmann L, Culp K. Monitoring hydration status in elderly veterans. Western Journal of Nursing Research 2002;24(2):132‐42. [MEDLINE: ] [DOI] [PubMed] [Google Scholar]
Wakefield 2002b {published data only (unpublished sought but not used)}
- Wakefield BJ. Risk for acute confusion on hospital admission. Clinical Nursing Research 2002;11(2):153‐72. [MEDLINE: ] [DOI] [PubMed] [Google Scholar]
Wakefield 2008 {published data only (unpublished sought but not used)}
- Wakefield BJ, Mentes J, Holman JE, Culp K. Postadmission dehydration: risk factors, indicators, and outcomes. Rehabilitation Nursing Journal 2009;34(5):209‐16. [MEDLINE: ] [DOI] [PubMed] [Google Scholar]
- Wakefield BJ, Mentes J, Holman JE, Culp K. Risk factors and outcomes associated with hospital admission for dehydration. Rehabilitation Nursing Journal 2008;33(6):233‐41. [MEDLINE: ] [DOI] [PubMed] [Google Scholar]
Waldreus 2010 {published and unpublished data}
- Waldréus N, Sjöstrand F, Hahn RG. Thirst in the elderly with and without heart failure. Archives of Gerontology & Geriatrics 2011;53(2):174‐8. [MEDLINE: ] [DOI] [PubMed] [Google Scholar]
Weinberg 1994a {published data only}
- Weinberg AD, Pals JK, Levesque PG, Beal LF, Cunningham TJ, Minaker KL. Dehydration and death during febrile episodes in the nursing home. Journal of the American Geriatrics Society 1994;42(9):968‐71. [MEDLINE: ] [DOI] [PubMed] [Google Scholar]
Weinberg 1994b {published data only}
- Weinberg AD, Pals JK, McGlinchey‐Berroth R, Minaker KL. Indices of dehydration among frail nursing home patients: highly variable but stable over time. Journal of the American Geriatrics Society 1994;42(10):1070‐3. [MEDLINE: ] [DOI] [PubMed] [Google Scholar]
Weiss 2012 {published data only (unpublished sought but not used)}
- Weiss JP, Zinner NR, Klein BM, Norgaard JP. Desmopressin orally disintegrating tablet effectively reduces nocturia: results of a randomized, double‐blind, placebo‐controlled trial. Neurourology & Urodynamics 2012;31(4):441‐7. [MEDLINE: ] [DOI] [PubMed] [Google Scholar]
Wise 2000 {published data only}
- Wise LC, Mersch J, Racioppi J, Crosier J, Thompson C. Evaluating the reliability and utility of cumulative intake and output. Journal of Nursing Care Quality 2000;14(3):37‐42. [MEDLINE: ] [DOI] [PubMed] [Google Scholar]
Yoshihara 2007 {published data only}
- Yoshihara A, Hirotomi T, Takano N, Kondo T, Hanada N, Miyazaki H. Serum markers of chronic dehydration are associated with saliva spinability. Journal of Oral Rehabilitation 2007;34(10):733‐8. [MEDLINE: ] [DOI] [PubMed] [Google Scholar]
Yoshikawa 2012 {published and unpublished data}
- Yoshikawa T, Kanazawa H. Association of plasma adiponectin levels with cellular hydration state measured using bioelectrical impedance analysis in patients with COPD. International Journal of Copd 2012;7:515‐21. [MEDLINE: ] [DOI] [PMC free article] [PubMed] [Google Scholar]
References to studies awaiting assessment
El‐Sharkwi 2014 {published data only}
- El‐Sharkawy AM, Sahota O, Maughan RJ, Lobo DN. Hydration in the older hospital patient ‐ is it a problem?. Age & Ageing 2014;43:i33‐5. [DOI: 10.1093/ageing/afu046] [DOI] [Google Scholar]
Fortes 2014 {published data only}
- Fortes MB, Owen JA, Raymond‐Barker P, Bishop C, Elghenzai S, Oliver SJ, et al. Is this elderly patient dehydrated? Diagnostic accuracy of hydration assessment using physical signs, urine, and saliva markers. Journal of the American Medical Directors Association 2014;16(3):221‐8. [MEDLINE: ] [DOI] [PubMed] [Google Scholar]
Hooper 2012 {published and unpublished data}
- Hooper L, Bunn D. DRIE (Dehydration Recognition In our Elders). Development of a simple tool for diagnosis of water‐loss dehydration: a diagnostic accuracy and cohort study. 2012. driestudy.appspot.com/index.html (accessed 14 April 2015).
Ooi 1997 {published data only}
- Ooi SB, Koh‐Tai B‐C, Aw TC, Lau TC, Chan ST. Assessment of dehydration in adults using hematologic and biochemical tests. Academic Emergency Medicine 1997;4(8):840‐4. [MEDLINE: ] [PubMed] [Google Scholar]
References to ongoing studies
Johnson 2012 [pers comm] {unpublished data only}
- Dehydration study. Ongoing study July 2012.
Johnson 2013 [pers comm] {unpublished data only}
- SÄBO study. Ongoing study May 2013.
Olde Rikkert 2013 [pers comm] {unpublished data only}
- Diagnosis of dehydration in elderly patients by electronic nose analysis of exhaled air: a pilot study. Ongoing study July 2013.
Additional references
Abdelhamid 2014
- Abdelhamid A, Bunn D, Dickinson A, Killett A, Poland F, Potter J, et al. Effectiveness of interventions to improve, maintain or faciltate oral food and/or drink intake in people with dementia. PROSPERO 2014:CRD42014007611. www.crd.york.ac.uk/PROSPERO/display_record.asp?ID=CRD42014007611 (accessed 14 April 2015).
Arampatzis 2012
- Arampatzis S, Frauchiger B, Fiedler GM, Leichtle AB, Buhl D, Schwarz C, et al. Characteristics, symptoms, and outcome of severe dysnatremias present on hospital admission. American Journal of Medicine 2012;125(11):1125.e1‐1125.e7. [MEDLINE: ] [DOI] [PubMed] [Google Scholar]
Armstrong 1998
- Armstrong LE, Soto JA, Hacker FT Jr, Casa DJ, Kavouras SA, Maresh CM. Urinary indices during dehydration, exercise, and rehydration. International Journal of Sport Nutrition 1998;8(4):345‐55. [MEDLINE: ] [DOI] [PubMed] [Google Scholar]
Armstrong 2007
- Armstrong LE. Assessing hydration status: the elusive gold standard. Journal of the American College of Nutrition 2007;26(5 Suppl):575S‐84S. [MEDLINE: ] [DOI] [PubMed] [Google Scholar]
Bhalla 2000
- Bhalla A, Sankaralingam S, Dundas R, Swaminathan R, Wolfe CD, Rudd AG. Influence of raised plasma osmolality on clinical outcome after acute stroke. Stroke 2000;31(9):2043‐8. [MEDLINE: ] [DOI] [PubMed] [Google Scholar]
Bunn 2014
- Bunn D, Jimoh F, Howard Wilsher S, Hooper L. Effectiveness of external factors to reduce the risk of dehydration in older people living in residential care: a systematic review. BMC health Services Research 2014;14(Suppl 2):11. [PCIMD: PMC4122880] [Google Scholar]
Bunn 2015
- Bunn D, Jimoh F, Howard Wilsher SH, Hooper L. Increasing fluid intake and reducing dehydration risk in older people living in long‐term care: a systematic review. Journal of the American Medical Directors Association 2015;16(2):101‐13. [MEDLINE: ] [DOI] [PubMed] [Google Scholar]
Chan 2002
- Chan J, Knutsen SF, Blix GG, Lee JW, Fraser GE. Water, other fluids, and fatal coronary heart disease: the Adventist Health Study. American Journal of Epidemiology 2002;155(9):827‐33. [MEDLINE: ] [DOI] [PubMed] [Google Scholar]
Cheuvront 2010
- Cheuvront SN, Ely BR, Kenefick RW, Sawka MN. Biological variation and diagnostic accuracy of dehydration assessment markers. American Journal of Clinical Nutrition 2010;92(3):565‐73. [MEDLINE: ] [DOI] [PubMed] [Google Scholar]
Cheuvront 2013
- Cheuvront SN, Kenefick RW, Charkoudian N, Sawka MN. Physiologic basis for understanding quantitative dehydration assessment. American Journal of Clinical Nutrition 2013;97(3):455‐62. [MEDLINE: ] [DOI] [PubMed] [Google Scholar]
Chidester 1997
- Chidester JC, Spangler AA. Fluid intake in the institutionalized elderly. Journal of the American Dietetic Association 1997;97(1):23‐8. [MEDLINE: ] [DOI] [PubMed] [Google Scholar]
Churchill Livingstone 2008
- Brooker C (editor). Churchill Livingstone Medical Dictionary. 16th Edition. London: Royal Society of Medicine, 2008. [Google Scholar]
De Castro 1992
- Castro JM. Age‐related changes in natural spontaneous fluid ingestion. Journal of Gerontology 1992;47(5):321‐30. [MEDLINE: ] [DOI] [PubMed] [Google Scholar]
de Groot 2011
- Groot JAH, Bossuyt PM, Reitsma JB, Rutjes AW, Dendukuri N, Janssen KJ, et al. Verification problems in diagnostic accuracy studies: consequences and solutions. BMJ 2011;343:d4770. [MEDLINE: ] [DOI] [PubMed] [Google Scholar]
de Lorenzo 2012
- Lorenzo RA, Morris MJ, Williams JB, Haley TF, Straight TM, Holbrook‐Emmons VL, et al. Does a simple bedside sonographic measurement of the inferior vena cava correlate to central venous pressure?. Journal of Emergency Medicine 2012;42(4):429‐36. [MEDLINE: ] [DOI] [PubMed] [Google Scholar]
de Vet 2008
- Vet HC, Eisinga A, Riphagen II, Aertgeerts B, Pewsner D. Chapter 7: Searching for Studies. In: Cochrane Handbook for Systematic Reviews of Diagnostic Test Accuracy Version 0.4 [updated September 2008]. The Cochrane Collaboration, 2008. Available from http://srdta.cochrane.org.
di Ruffano 2012
- Ruffano LF, Hyde CJ, McCaffery KJ, Bossuyt PM, Deeks JJ. Assessing the value of diagnostic tests: a framework for designing and evaluating trials. BMJ 2012;344:e686. [MEDLINE: ] [DOI] [PubMed] [Google Scholar]
DoH and Nutrition Summit 2007
- Department of Health and the Nutrition Summit stakeholder group. Improving nutritional care: a joint action plan 2007. www.dh.gov.uk/en/Publicationsandstatistics/Publications/PublicationsPolicyAndGuidance/DH_079931 (accessed 14 April 2015).
EFSA 2010
- European Food Safety Authority Panel on Dietetic Products. Scientific opinion on dietary reference values for water. EFSA Journal 2010;8(3):1459. [www.efsa.europa.eu/en/scdocs/doc/1459.pdf] [Google Scholar]
El‐Sharkawy 2014
- El‐Sharkawy AM, Sahota O, Maughan RJ, Lobo DN. Hydration in the older hospital patient ‐ is it a problem?. Age & Ageing 2014;43(Suppl 1):i33‐i35. [DOI: 10.1093/ageing/afu046] [DOI] [Google Scholar]
Fazekas 2013
- Fazekas AS, Funk G‐C, Klobassa DS, Ruther H, Ziegler I, Zander R, et al. Evaluation of 36 formulas for calculating plasma osmolality. Intensive Care Medicine 2013;39(2):302‐8. [MEDLINE: ] [DOI] [PubMed] [Google Scholar]
Fortes 2011a
- Fortes MB, Diment BC, Felice U, Gunn AE, Kendall JL, Esmaeelpour M, et al. Tear fluid osmolarity as a potential marker of hydration status. Medicine & Science in Sports & Exercise 2011;43(8):1590‐7. [MEDLINE: ] [DOI] [PubMed] [Google Scholar]
Freeman 2011
- Freeman R, Wieling W, Axelrod FB, Benditt DG, Benarroch E, Biaggioni I, et al. Consensus statement on the definition of orthostatic hypotension, neurally mediated syncope and the postural tachycardia syndrome. Clinical Autonomic Research 2011;21(2):69‐72. [MEDLINE: ] [DOI] [PubMed] [Google Scholar]
Goldman 2004
- Goldman L, Ausiello DA. Cecil Textbook of Medicine. 22nd Edition. London: Saunders, 2004. [Google Scholar]
Hodgkinson 2003
- Hodgkinson B, Evans D, Wood J. Maintaining oral hydration in older adults: a systematic review. International Journal of Nursing Practice 2003;9(3):S19‐28. [MEDLINE: ] [DOI] [PubMed] [Google Scholar]
Hooper 2014
- Hooper L, Bunn D, Jimoh FO, Fairweather‐Tait SJ. Water‐loss dehydration and aging. Mechanisms of Ageing & Development 2014;136‐137:50‐58. [MEDLINE: ] [DOI] [PubMed] [Google Scholar]
Kenkmann 2010
- Kenkmann A, Price GM, Bolton J, Hooper L. Health, wellbeing and nutritional status of older people living in UK care homes: an exploratory evaluation of changes in food and drink provision. BMC Geriatrics 2010;10:28. [MEDLINE: ] [DOI] [PMC free article] [PubMed] [Google Scholar]
Leeflang 2009
- Leeflang MM, Bossuyt PM, Irwig L. Diagnostic test accuracy may vary with prevalence: implications for evidence‐based diagnosis. Journal of Clinical Epidemiology 2009;62(1):5‐12. [MEDLINE: ] [DOI] [PubMed] [Google Scholar]
Leeflang 2013
- Leeflang MM, Rutjes AW, Reitsma JB, Hooft L, Bossuyt PM. Variation of a test’s sensitivity and specificity with disease prevalence. Canadian Medical Association Journal 2013;185(11):e537‐44. [MEDLINE: ] [DOI] [PMC free article] [PubMed] [Google Scholar]
Lindeman 1985
- Lindeman RD, Tobin J, Shock NW. Longitudinal studies on the rate of decline in renal function with age. Journal of the American Geriatrics Society 1985;33(4):278‐85. [MEDLINE: ] [DOI] [PubMed] [Google Scholar]
Linnet 2012
- Linnet K, Bossuyt PM, Moons KG, Reitsma JB. Quantifying the accuracy of a diagnostic test or marker. Clinical Chemistry 2012;58(9):1292‐301. [MEDLINE: ] [DOI] [PubMed] [Google Scholar]
Luckey 2003
- Luckey AE, Parsa CJ. Fluid and electrolytes in the aged. Archives of Surgery 2003;138(10):1055‐60. [MEDLINE: ] [DOI] [PubMed] [Google Scholar]
Macaskill 2010
- Macaskill P, Gatsonis C, Deeks JJ, Harbord RM, Takwoingi Y. Chapter 10: Analysing and presenting results. In: Deeks JJ, Bossuyt PM, Gatsonis C (editors), Cochrane Handbook for Systematic Reviews of Diagnostic Test Accuracy Version 1.0. The Cochrane Collaboration, 2010. Available from http://srdta.cochrane.org.
McGee 1999
- McGee S, Abernethy WB 3rd, Simel DL. Is this patient hypovolemic?. JAMA 1999;281(11):1022‐9. [MEDLINE: ] [DOI] [PubMed] [Google Scholar]
Mentes 2006a
- Mentes JC. Oral hydration in older adults. American Journal of Nursing 2006;106(6):40‐9. [MEDLINE: ] [DOI] [PubMed] [Google Scholar]
Mentes 2006b
- Mentes JC, Wakefield B, Culp K. Use of a urine color chart to monitor hydration status in nursing home residents. Biological Research for Nursing 2006;7(3):197‐203. [MEDLINE: ] [DOI] [PubMed] [Google Scholar]
National Care Homes 2007
- National Care Homes Research and Development Forum. My home life. Quality of life in care homes. A review of the literature. 2007. www.scie.org.uk/publications/guides/guide15/files/myhomelife‐litreview.pdf?res=true. London: Help the Aged, (accessed 14 April 2015).
NHS 2013
- NHS. Dehydration ‐ Symptoms. 2013. www.nhs.uk/Conditions/Dehydration/Pages/Symptoms.aspx (accessed 14 April 2015).
O'Bryant 2008
- O'Bryant SE, Humphreys JD, Smith GE, Ivnik RJ, Graff‐Radford NR, Petersen RC, et al. Detecting dementia with the mini‐mental state examination in highly educated individuals. Archives of Neurology 2008;65(7):963‐67. [MEDLINE: ] [DOI] [PMC free article] [PubMed] [Google Scholar]
Olde Rikkert 2009
- Olde Rikkert MG, Melis RJ, Claassen JA. Heat waves and dehydration in the elderly. BMJ 2009;339:b2663. [MEDLINE: ] [DOI] [PubMed] [Google Scholar]
Panel on Dietary Reference Intakes 2004
- Panel on Dietary Reference Intakes for Electrolytes, Water. Dietary reference intakes for water, potassium, sodium, chloride, and sulfate. Washington DC, USA: National Academies Press; 2004. www.nal.usda.gov/fnic/DRI/DRI_Water/water_full_report.pdf. Washington DC, USA: National Academies Press, (accessed 14 April 2015).
Reid 2004
- Reid J. Speech by Rt Hon John Reid MP, Secretary of State for Health, 11 March 2004: Managing new realities: integrating the care landscape. webarchive.nationalarchives.gov.uk/+/www.dh.gov.uk/en/MediaCentre/Speeches/Speecheslist/DH_4076406 (accessed 14 April 2015).
Reitsma 2005
- Reitsma JB, Glas AS, Rutjes AW, Scholten RJ, Bossuyt PM, Zwinderman AH. Bivariate analysis of sensitivity and specificity produces informative summary measures in diagnostic reviews. Journal of Clinical Epidemiology 2005;58(10):982‐90. [MEDLINE: ] [DOI] [PubMed] [Google Scholar]
Reitsma 2009a
- Reitsma JB, Rutjes AW, Whiting P, Vlassov VV, Leeflang MM, Deeks JJ. Chapter 9: Assessing methodological quality. In: Deeks JJ, Bossuyt PM, Gatsonis C (editors), Cochrane Handbook for Systematic Reviews of Diagnostic Test Accuracy Version 1.0.0. The Cochrane Collaboration, 2009. Available from http://srdta.cochrane.org.
Reitsma 2009b
- Reitsma JB, Rutjes AW, Khan KS, Coomarasamy A, Bossuyt PM. A review of solutions for diagnostic accuracy studies with an imperfect or missing reference standard. Journal of Clinical Epidemiology 2009;62(8):797‐806. [MEDLINE: ] [DOI] [PubMed] [Google Scholar]
RevMan 5.3 [Computer program]
- The Nordic Cochrane Centre, The Cochrane Collaboration. Review Manager (RevMan). Version 5.3. Copenhagen: The Nordic Cochrane Centre, The Cochrane Collaboration, 2014.
Robinson 2002
- Robinson SB, Rosher RB. Can a beverage cart help improve hydration?. Geriatric Nursing 2002;23(4):208‐11. [MEDLINE: ] [DOI] [PubMed] [Google Scholar]
Rolland 2006
- Rolland Y, Kim MJ, Gammack JK, Wilson MM, Thomas DR, Morley JE. Office management of weight loss in older persons. American Journal of Medicine 2006;119(12):1019‐26. [MEDLINE: ] [DOI] [PubMed] [Google Scholar]
Rushing 2009
- Rushing J. Assessing for dehydration in adults. Nursing 2009;39(4):14. [MEDLINE: ] [DOI] [PubMed] [Google Scholar]
Schloerb 1950
- Schloerb PR, Friis‐Hansen BJ, Edelman IS, Solomon AK, Moore FD. The measurement of total body water in the human subject by deuterium oxide dilution; with a consideration of the dynamics of deuterium distribution. Journal of Clinical Investigation 1950;29(10):1296‐310. [MEDLINE: ] [DOI] [PMC free article] [PubMed] [Google Scholar]
Shirreffs 2003
- Shirreffs SM. Markers of hydration status. European Journal of Clinical Nutrition 2003;57 Suppl 2:S6‐9. [MEDLINE: ] [DOI] [PubMed] [Google Scholar]
Siervo 2014
- Siervo M, Bunn D, Prado C, Hooper L. Accuracy of prediction equations for serum osmolarity in frail older people with and without diabetes. American Journal for Clinical Nutrition 2014;100(3):867‐76. [MEDLINE: ] [DOI] [PMC free article] [PubMed] [Google Scholar]
Simard 1998
- Simard M. The mini‐mental state examination: strengths and weaknesses of a clinical instrument. The Canadian Alzheimer Disease Review. 1998. www.stacommunications.com/customcomm/Back‐issue_pages/AD_Review/adPDFs/december1998/10.pdf. http://www.stacommunications.com/customcomm/Back‐issue_pages/AD_Review/adPDFs/december1998/10.pdf, (accessed 14 April 2015).
StataCorp [Computer program]
- StataCorp LP. Stata Statistical Software. Release 11.1. College Station, TX: StataCorp LP, 2009.
Stookey 2004a
- Stookey JD, Purser JL, Pieper CF, Cohen HJ. Plasma hypertonicity: Another marker of frailty?. Journal of the American Geriatric Society 2004;52(8):1313‐20. [MEDLINE: ] [DOI] [PubMed] [Google Scholar]
Stookey 2005b
- Stookey JD, Pieper CF, Cohen HJ. Is the prevalence of dehydration among community‐dwelling older adults really low? Informing current debate over the fluid recommendation for adults aged 70 + years. Public Health Nutrition 2005;8(8):1275‐85. [MEDLINE: ] [DOI] [PubMed] [Google Scholar]
Stookey 2005c
- Stookey JD. High prevalence of plasma hypertonicity among community‐dwelling older adults: results from NHANES III. Journal of the American Dietetics Association 2005;105(8):1231‐9. [MEDLINE: ] [DOI] [PubMed] [Google Scholar]
Sund‐Levander 2002
- Sund‐Levander M, Forsberg C, Wahren LK. Normal oral, rectal, tympanic and axillary body temperature in adult men and women: a systematic literature review. Scandinavian Journal of Caring Sciences 2002;16(2):122‐8. [MEDLINE: ] [DOI] [PubMed] [Google Scholar]
Thomas 2008
- Thomas DR, Cote TR, Lawhorne L, Levenson SA, Rubenstein LZ, Smith DA, et al. Understanding clinical dehydration and its treatment. Journal of the American Medical Directors Association 2008;9(5):292‐301. [MEDLINE: ] [DOI] [PubMed] [Google Scholar]
Vivanti 2013
- Vivanti A, Yu L, Palmer M, Dakin L, Sun J, Campbell K. Short‐term body weight fluctuations in older well‐hydrated hospitalised patients. Journal of Human Nutrition & Dietetics 2013;26(5):429–35. [MEDLINE: ] [DOI] [PubMed] [Google Scholar]
Wachtel 1991
- Wachtel TJ, Tetu‐Mouradjian LM, Goldman DL, Ellis SE, O'Sullivan PS. Hyperosmolarity and acidosis in diabetes mellitus: a three‐year experience in Rhode Island. Journal of General Internal Medicine 1991;6(6):495‐502. [MEDLINE: ] [DOI] [PubMed] [Google Scholar]
Waikar 2009
- Waikar SS, Mount DB, Curhan GC. Mortality after hospitalization with mild, moderate, and severe hyponatremia. American Journal of Medicine 2009;122(9):857‐65. [MEDLINE: ] [DOI] [PMC free article] [PubMed] [Google Scholar]
Walsh 2004a
- Walsh NP, Laing SJ, Oliver SJ, Montague JC, Walters R, Bilzon JL. Saliva parameters as potential indices of hydration status during acute dehydration. Medicine & Science in Sports & Exercise 2004;36(9):1535‐42. [MEDLINE: ] [DOI] [PubMed] [Google Scholar]
Walsh 2004b
- Walsh NP, Montague JC, Callow N, Rowlands AV. Saliva flow rate, total protein concentration and osmolality as potential markers of whole body hydration status during progressive acute dehydration in humans. Archives of Oral Biology 2004;49(2):149‐54. [MEDLINE: ] [DOI] [PubMed] [Google Scholar]
Warren 1994
- Warren JL, Bacon WE, Harris T, McBean AM, Foley DJ, Phillips C. The burden and outcomes associated with dehydration among US elderly, 1991. American Journal of Public Health 1994;84(8):1265‐9. [MEDLINE: ] [DOI] [PMC free article] [PubMed] [Google Scholar]
Water UK 2006
- Water UK. Water and healthy Ageing. Hydration best practice toolkit for care homes. www.2ndchance.info/oldcathydration2005.pdf (accessed 14 April 2015).
WebMD 2014
- WebMD. Dehydration in adults. www.webmd.com/a‐to‐z‐guides/dehydration‐adults. 2014 (accessed 14 April 2015).
Wedro 2014
- Wedro B. How is dehydration diagnosed?. www.medicinenet.com/dehydration/page5.htm (accessed 14 April 2015).
Weinberg 1995
- Weinberg AD, Minaker KL. Dehydration: evaluation and management in older adults. Council on Scientific Affairs, American Medical Association. JAMA 1995;274(19):1552‐6. [MEDLINE: ] [DOI] [PubMed] [Google Scholar]
Whiting 2006
- Whiting PF, Westwood ME, Rutjes AW, Reitsma JB, Bossuyt PN, Kleijnen J. Evaluation of QUADAS, a tool for the quality assessment of diagnostic accuracy studies. BMC Medical Research Methodology 2006;6:9. [MEDLINE: ] [DOI] [PMC free article] [PubMed] [Google Scholar]
Whiting 2011
- Whiting P, Westwood M, Beynon R, Burke M, Sterne JAC, Glanville J. Inclusion of methodological filters in searches for diagnostic test accuracy studies misses relevant studies. Journal of Clinical Epidemiology 2011;64(6):602‐7. [MEDLINE: ] [DOI] [PubMed] [Google Scholar]
Wotton 2008
- Wotton K, Crannitch K, Munt R. Prevalence, risk factors and strategies to prevent dehydration in older adults. Contemporary Nurse 2008;31(1):44‐56. [MEDLINE: ] [DOI] [PubMed] [Google Scholar]
Xiao 2004
- Xiao H, Barber J, Campbell ES. Economic burden of dehydration among hospitalized elderly patients. American Journal of Health‐System Pharmacy 2004;61(23):2534‐40. [MEDLINE: ] [DOI] [PubMed] [Google Scholar]
Zengin 2013
- Zengin S, Al B, Genc S, Yildirim C, Ercan S, Dogan M, et al. Role of inferior vena cava and right ventricular diameter in assessment of volume status: a comparative study: ultrasound and hypovolemia. American Journal of Emergency Medicine 2013;31(5):763‐7. [MEDLINE: ] [DOI] [PubMed] [Google Scholar]
References to other published versions of this review
Hooper 2012
- Hooper L, Attreed NJ, Campbell WW, Channell AM, Chassagne P, Culp KR, et al. Clinical and physical signs for identification of impending and current water‐loss dehydration in older people. Cochrane Database of Systematic Reviews 2012, Issue 2. [DOI: 10.1002/14651858.CD009647] [DOI] [PMC free article] [PubMed] [Google Scholar]