

Key Points
Hybridization between complementary strands of DNA enables the interrogation of unknown DNA by comparison with DNA of known sequence or genomic context.
DNA microarrays containing hundreds of thousands or millions of probes can be used to interrogate genomic sequence. Advances in array-based approaches have enabled detection of the main forms of genomic variation: amplifications, deletions, insertions, rearrangements and base-pair changes.
Structural variation in the genome — deletions and duplications, copy number variation, insertions, inversions and chromosomal translocations — can be detected using array comparative genome hybridization. For this application it is often sufficient to have large probes (such as PCR products, cDNA clones or long oligonucleotides) that allow for hybridization despite some sequence differences.
When DNA probes are short, hybridization efficiency is acutely sensitive to mismatches; such probes therefore facilitate comparison of genomes at the nucleotide level.
Global mapping of insertion sites is performed by isolating the insertion element and its immediately neighbouring DNA. The DNA is then hybridized to a whole-genome array to identify its genomic location.
Comprehensive detection of mutations in a complex genome is carried out using whole-genome overlapping tiling arrays, which provide multiple measurements of the effect of an SNP on hybridization.
Resequencing arrays use at least four probes per interrogated base and have been used to resequence small genomes.
Microarrays offer a relatively inexpensive and efficient means of comparing all known classes of genomic diversity between closely related genomes. However, they are not appropriate for some applications, such as detecting unknown sequences or interrogating highly repetitive or low-complexity sequences.
Microarray-based approaches are a fast, flexible and inexpensive alternative to genome sequencing for characterizing the genomes of many individuals within a species. This article reviews the advances that are making microarrays a viable choice for detecting all forms of genetic diversity.
Abstract
The rapid accumulation of complete genomic sequences offers the opportunity to carry out an analysis of inter- and intra-individual genome variation within a species on a routine basis. Sequencing whole genomes requires resources that are currently beyond those of a single laboratory and therefore it is not a practical approach for resequencing hundreds of individual genomes. DNA microarrays present an alternative way to study differences between closely related genomes. Advances in microarray-based approaches have enabled the main forms of genomic variation (amplifications, deletions, insertions, rearrangements and base-pair changes) to be detected using techniques that are readily performed in individual laboratories using simple experimental approaches.
Main
Since the early 1990s a large amount of effort has focused on determining the complete genomic DNA sequence of many diverse organisms. Remarkably, virtually all this sequencing has been done using a single method: chain termination sequencing using dideoxynucleosides1, usually referred to as Sanger sequencing. From the determination of the first complete genome sequence of an organism, the bacteriophage φX174 (Ref. 2), to the completion of 95% of the human genome sequence3,4 many technical advances in methodologies, automation and computing rapidly increased the rate at which DNA sequence was obtained5. The availability of genomic sequences has led to the development of many genome-scale analytical techniques that have greatly enriched modern biology — for example, techniques to measure global mRNA abundance6,7, systematically knock out all genes8, perturb their function9 and generate comprehensive clone collections10,11 — and together they constitute the new field of genomics.
Studies of sequence variation in the same or similar species have many potential applications, ranging from understanding complex human diseases to analysing the products of experimental evolution. However, to realize fully the potential of this science, the task of characterizing genomes should be reduced to a routine procedure that can be done on hundreds of samples. To this end, the research and commercial community is accelerating towards new approaches to genome sequencing12,13,14 that are increasingly less expensive, more rapid and efficient, and more widely available. Nevertheless, determining even modest numbers of complete genomic sequences is still a substantial undertaking, entailing equipment, infrastructure and running expenses beyond the resources of most individual laboratories, and the study of sequence variation through direct genome sequencing remains the province of a minority of biologists.
The applications that are envisioned for cheap and rapid sequencing technology do not actually require repeated determination of entire genomic sequences. Methods that efficiently detect genomic differences, be they structural rearrangements, polymorphisms or mutations, often suffice to reduce the sequencing requirement to a tiny fraction of the genome, a capability that is routine in most modern biology laboratories. Several technologies that use hybridization to DNA microarrays are effective for detecting genomic variation in closely related samples. Thus, questions in which a researcher aims to compare normal and diseased tissues from the same individual or mutant and wild-type DNA from the same experimental organism can often be addressed by microarray-based experimental comparison as opposed to exhaustive sequencing of entire genomes.
This Review is focused on the global characterization of differences between closely related genomes — an approach that is ideally suited to microarrays. We describe the various forms of genomic variation that can be detected using microarray-based approaches and discuss some of the important experimental considerations, ranging from experimental design to data analysis and visualization. We highlight the versatility of these approaches, their applicability to various questions and organisms, and briefly describe how global views of genomic diversity are revealing new biological insights.
Hybridization technology
DNA microarrays are a collection of DNA probes that are arrayed on a solid support and are used to assay, through hybridization, the presence of complementary DNA that is present in a sample (see Boxes 1,2). The experimental conditions for annealing complementary strands of DNA was reported15 within a decade of the determination of the structure of DNA, and it was quickly realized that in vitro hybridization of DNA presented a means for comparing genomes. One initial exemplar was the visualization of hybridization products between two entire bacteriophage genomes using electron microscopy16. The development of blotting techniques, which use labelled DNA probes for visualization, presaged the fabrication of synthetic nucleotides on a solid support17,18. Moreover, the effect of single mismatches on hybridization efficiency was soon appreciated and was used to detect mutations in bacteriophage19 and human DNA20 well before the advent of DNA microarrays.
DNA microarrays are made either by chemically synthesizing DNA probes on a solid surface or by attaching pre-made DNA probes to a solid surface. Maksos and Southern21 first demonstrated the synthesis of arrays of oligonucleotides on a solid support in situ. From these initial experiments, advances in technology and chemistry resulted in increasingly higher density oligonucleotide microarrays synthesized in situ using techniques such as photolithography22 and ink-jet deposition23. Simultaneously, the development of printing techniques24 allowed the robotic arraying of PCR products, pre-synthesized oligonucleotides, or genomic clones such as cDNA or BAC clones — often referred to as spotted microarrays.
For genomic analysis a tiling array design is desirable, in which DNA probes are chosen from contiguous stretches of the genome. Whereas only short-oligonucleotide microarrays are appropriate for detecting sequence changes, all types of microarray can be used to detect structural variation. An important distinction is between microarrays that provide truly comprehensive coverage of the genome (whole genome) and those that provide partial coverage across the genome (genome scale). Until recently, whole-genome coverage using oligonucleotide arrays had only been available for small genomes such as those of viruses25 or the human mitochondrion26,27. At present, whole-genome coverage of larger genomes can only be achieved using large probes such as BACs28,29. However, advances in engineering and chemistry, largely made by the commercial manufacturers of microarrays, have enabled the construction of increasingly dense oligonucleotide arrays with 105–106 probes per microarray. Thus, it is already possible to manufacture short-oligonucleotide microarrays that cover the entire (although relatively small) genomes of eukaryotic organisms such as Saccharomyces cerevisiae30,31 and larger genomes such as Arabidopsis thaliana32,33. Using dozens of arrays, complete coverage of even mammalian genome sequences has been achieved quite recently34.
The availability of high-density microarrays has facilitated the development of rapid and comprehensive approaches to characterizing genomes. These methods are being applied to a myriad of questions — from explaining the genetic basis of phenotypic variation to describing the extent and nature of genomic diversity.
Detection of structural variation
Structural variation in the genome refers to microscopic and submicroscopic alterations of the genome and includes deletions and duplications, copy number variation (CNV), insertions, inversions and chromosomal translocations35. This broad class of variants constitute a diverse and pervasive source of variation with known functional consequences, including increased pathogenicity and antibiotic resistance of microorganisms36, a range of human developmental disorders37 and association with human cancers38.
In contrast to targeted methods for detecting structural variation, such as fluorescent in situ hybridization (FISH) and quantitative PCR, microarray-based approaches allow structural variation to be assessed across the entire genome in an unbiased manner. The approach that is used is known as array comparative genome hybridization (aCGH): here, microarrays consisting of BAC39 or cDNA clones40, PCR products41 or oligonucleotides42 (Box 1) are used to compare probe signal intensities within or between arrays, corresponding to quantitative differences in the amount of material hybridizing at a particular probe (Fig. 1). Recently, genome-scale approaches using microarrays have revealed the impressive extent and diversity of non-disease-related structural variation in the human genome43,44, and there is increasing evidence that small-scale structural variation might be associated with a far greater number of developmental disorders than previously appreciated45,46,47. Similarly, in model organisms, copy number changes underlie adaptive events in experimental evolution studies41,48, act as suppressor mutations49 in yeast, and are an important and pervasive source of variation in worms50 and mice51. Thus, structural variation is of broad importance across all species.
Figure 1. Identifying copy number variation in genomes using array comparative genome hybridization.
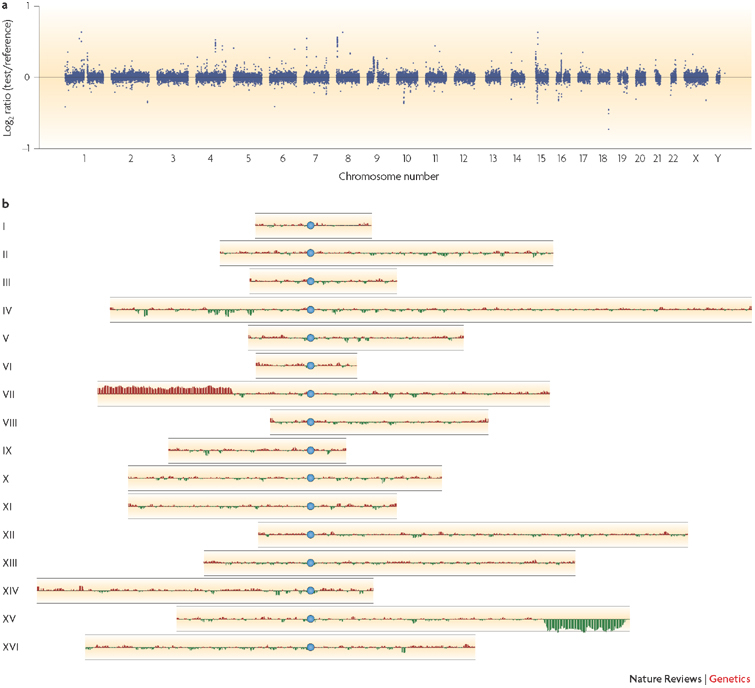
a | Copy number variation in the human genome. Whole-genome microarrays enable copy number variation to be compared across the human genome. The log2 ratio of the test to reference signal for 22 autosomes and 2 sex chromosomes of the human genome are shown, chromosome by chromosome. The data are from a comparison between two male genomes hybridized to a BAC microarray, using a two-colour approach. b | Structural variation in the yeast genome that was identified using microarrays. In this example, the sixteen chromosomes (I–XVI) of Saccharomyces cerevisiae are shown. Blue circles represent the centromeres. The data from a PCR microarray containing ∼6,000 probes are smoothed over 5 adjacent probes. Black lines above and below each chromosome indicate a twofold change in copy number. This clonal isolate is a product of the experimental evolution of a diploid strain growing under glucose-limiting conditions. When this strain is compared with its ancestral strain using a two-colour microarray, it shows clear evidence of an amplification of the left arm of chromosome VII (red), resulting in a 3:2 ratio of DNA (log2 ratio = 0.58), and loss of the right arm of chromosome XV (green), resulting in a 1:2 ratio of DNA (log2 ratio = −1). Image for part a is reproduced courtesy of M. Hurles, Sanger Institute, UK. Image for part b uses data originally published in Ref. 41 and is modified, with permission, from Nature Ref. 57 © (2006) Macmillan Publishers Ltd.
Distinguishing signal from noise. The analysis of aCGH data requires methods that distinguish the signals of real biological variation from those that are due to experimental variation. In the absence of multiple controlled experimental replicates, the signal from a single probe is usually considered insufficient evidence of a copy number change. In the simplest of situations, a running average across a number of contiguous probes is used to smooth the data and distinguish signal from noise40,41. In this case, a CNV is usually identified through a consistent increase or decrease in signal beyond a threshold value that corresponds to an integer change in copy number. This approach is applicable in only a minority of cases, such as homogeneous samples of microbial genomes or highly amplified loci.
To reliably detect more subtle variation or to analyse non-clonal material (for example, mixed microbial samples or heterogeneous tumour samples) more rigorous statistical methods are required. Usually these methods compare the results obtained for a sample with a measure of probe variance from control experiments in an effort to identify statistically significant differences. Various algorithmic approaches have been developed to identify the CNVs and their boundaries29,52,53. Some researchers have found that the use of oligonucleotide probes for human aCGH suffers owing to higher genome complexity. It was thought that DNA-complexity reduction methods would need to be developed to obviate this problem42, but more recent studies have suggested that this step is not necessary54,55,56.
Increasing resolution. The ultimate aims of structural variation detection are to identify variants that are only tens or hundreds base pairs in size and to resolve sequences corresponding to chromosomal breakpoints. The latter is important for understanding the mechanism by which this source of variation is generated and for predicting how genomic elements that are encoded at junction sites might be affected. BAC probes provide the greatest coverage of the genome and are currently the most comprehensive microarray platform available for human genome analysis; they do not detect small variants, however, and breakpoint resolution is limited to the size of the probe. Thus, the application of microarrays using oligonucleotide probes is appealing as this enables both greater resolution and greater sensitivity. For smaller genomes, such as those of microorganisms, complete coverage of the genome using short oligonucleotide probes is already commonplace30,31. Coverage of the human genome using short oligonucleotide probes continues to increase, either through the use of dedicated array platforms54 or the use of microarrays that were originally designed for genotyping57,58, thereby enabling the detection of smaller variants with higher resolution. Moreover, some types of structural variation that do not change the copy number — such as inversions and reciprocal translocations, which are not detected using large probes — should in principle be identified with oligonucleotide probes by virtue of the sequence change at the junction site.
Although experimental and analytical approaches using microarrays continue to improve, it is often desirable to confirm at least a subset of structural variation using an independent experimental method. Various methods exist for this purpose, including southern blotting, FISH and quantitative PCR. Whereas these methods are well suited to follow up on focused regions of interest, the use of two independent microarray platforms to analyse the same samples provides a means of global verification57. Similarly, detecting CNV using high-throughput paired-end sequencing is a valuable complement to microarray-based methods59. High-throughput sequencing methods also provide an opportunity to precisely identify breakpoint junctions.
Detecting nucleotide variation
Differences at the level of DNA sequence are the most abundant source of genomic variation. This class of variant, typically referred to as SNPs, is comprised of alternative nucleoside bases at a particular genomic location, in addition to the deletion or addition of single bases. The identification of SNPs is crucial for determining the underlying genetic basis of phenotypic traits in experimental and natural organisms, and in human disease. Often, genetic studies require both the discovery of sequence variants and determination of the allelic states in a large number of individuals (that is, genotyping). Microarray-based approaches are well suited to both tasks; however, here we shall limit our discussion to the discovery phase only. Excellent reviews of SNP genotyping using microarrays can be found elsewhere60,61.
It was recognized early on that a single mismatch between sample and probe DNA greatly decreases hybridization efficiency when the probe is short (Box 1). After it was shown that this held true when an oligonucleotide probe was immobilized on a solid-phase support62, the development of high-density arrays of oligonucleotides opened the door to detecting sequence variants on a genome-wide scale by virtue of a decreased hybridization signal by comparison with hybridization signal from perfect match DNA. The first whole-genome approach to sequence comparison using this method was applied to human mitochondrial DNA26. In this study, the authors co-hybridized two differentially labelled samples to a microarray of 135,000 probes of 16–19 bp, and detected sequence differences between them on the basis of the deviation of the ratio of the two signals.
Resequencing microarrays. In contrast to a design in which a single probe is used to interrogate a given nucleotide position, resequencing microarrays are designed so that a probe is provided for every possible single-base-pair mismatch (Fig. 2a). Because four probes — representing all four possible bases at the central nucleotide position — are considered, the increased signal at one of the four probes provides evidence for the correct complementary base. Algorithms to analyse resequencing microarray data thus make use of the gain of signal at perfectly matched probes as well as the loss of signal at non-complementary probes. Although only 4 probes are necessary for each site in principle, up to 28 probes have been used in practice to interrogate each nucleotide position by including probes that target all possible sequence variants on both strands of DNA and various small insertion and deletion combinations63. Resequencing arrays have been used successfully for small viral genomes such as the severe acute respiratory syndrome (SARS) coronavirus25 as well as for human mitochondrial DNA27.
Figure 2. Detecting SNP variation using microarrays.
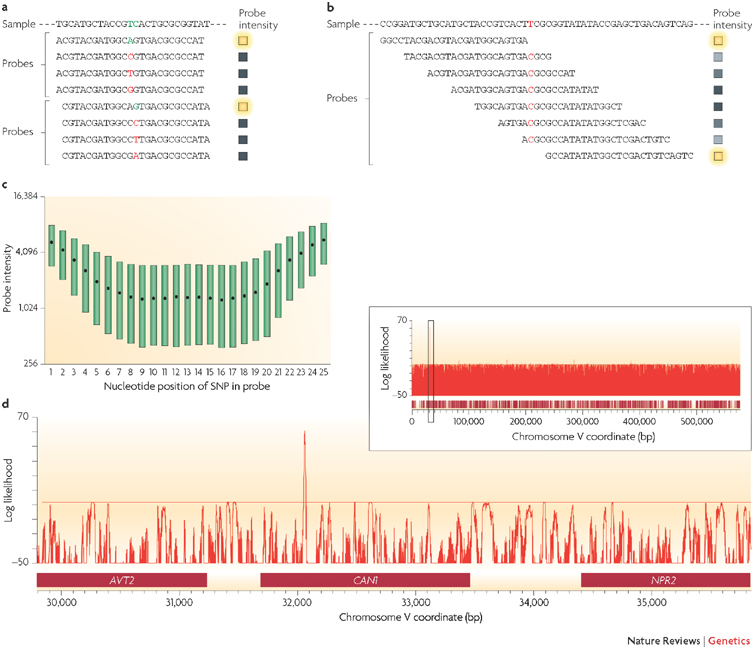
a | Resequencing microarrays are designed with short oligonucleotides in which every possible variant is represented at the central position of a probe (shown in coloured font). At least four probes are used to interrogate each nucleotide position (as shown here for two adjacent positions), but often eight or more are used to include both strands and other small insertions and deletions. The probe sequence that is exactly complementary to the sample will result in the greatest hybridization efficiency (indicated by a green letter) and thus a comparison among all probes can be used to determine the nucleotide sequence of the sample. The coloured boxes indicate the relative intensity of hybridization at each probe — yellow being the highest intensity. b | In the absence of resequencing arrays, hybridization of the sample to candidate sequence probes can be used. Mismatches resulting from mutations in sample DNA will result in a lower hybridization efficiency compared with hybridization to a sample with complete sequence complementarity. This approach has the advantage of requiring far fewer probes and is often sufficient to detect sequence variation. If a mismatch is inferred then small-scale sequencing is necessary to identify the variant nucleotide. c | The effect of a SNP on hybridization is related to its corresponding position in a probe. More central positions result in the greatest decrease, whereas SNPs positioned at the end of probes are much less likely to result in a significant decrease in hybridization. d | It is possible to use hybridization data obtained from a mutation detection array to compute a likelihood that a particular site is a sequence variant with respect to the reference genome. This approach facilitates the comparison of related individuals at the sequence level, allowing rapid scanning of the genome. The diagram illustrates the analysis of a drug-resistant mutant in the budding yeast, Saccharomyces cerevisiae. Candidate SNPs are identified by a positive log likelihood value. In this case, a small number of candidate SNPs are detected throughout the genome; one is shown here on chromosome V, which is representative of the entire 13 Mb of the yeast genome. The peak highlighted in the inset is shown at higher resolution in the main figure. A single signal in the CAN1 gene, which is known to confer resistance to the drug canavanine, was identified and subsequently verified using Sanger sequencing. AVT2, amino acid vacuolar transport 2; NPR2, nitrogen permease regulator 2. Images for parts c and d use data originally published in Ref. 31.
The great advantage of resequencing arrays is that they not only detect variation, but they also allow the variant sequence to be inferred. Although probe densities of commercially prepared oligonucleotide arrays have increased markedly over the past 10 years and now contain in the order of 106 features per array, most eukaryotic genomes are in the order of 107–109 nucleotides. Thus, to cover the entire genome of a higher organism using resequencing arrays it is necessary to use many individual arrays, as was done for resequencing the genome of A. thaliana33 and a significant subset of the human genome34. It is unclear what the upper limit is on the number of probes that can be placed on a microarray, but the rate of increase in probe density suggests that comprehensive resequencing arrays could eventually be available for larger genomes.
Genome-scale approaches for detecting sequence variation. In the absence of resequencing arrays for many organisms, including several important model organisms, microarrays that were designed for gene expression analysis have been used to identify candidate sequence changes. This approach entails the identification of sequence variation via the reduced hybridization signal — relative to some known non-polymorphic hybridization value — which results from mismatched DNA. Unlike resequencing arrays, these methods detect the positions of variation, often to high precision, but they do not provide the variant sequences. The first application of this approach was in S. cerevisiae using an Affymetrix array designed for probing gene expression64. This same approach has subsequently been used to probe sequence diversity in the genomes of A. thaliana65 and mosquitoes66. Candidate sequence variants — referred to as single feature polymorphisms — are identified as those probes that differ in intensity by some criterion defined using simple parametric tests (Fig. 2b). These studies offered, for the first time, the ability to rapidly characterize sequence diversity on a genome scale in a single microarray experiment; they also suggested that whole-genome analysis should be feasible with increased coverage.
Whole-genome microarrays. Microarrays that provide complete coverage of the genome by tiling short probes immediately adjacent to one another provide a means of interrogating the entire genomic sequence for variation. Such an array design has been applied to the bacteria Helicobacter pylori67 and Escherichia coli68. However, this design is not sufficient to reliably identify all sequence variation. This limitation can be attributed to the fact that the ability to detect sequence differences that correspond to the end of probes is poor (Fig. 2c).
A microarray design that addresses this problem contains overlapping probes spaced at a regular interval such that every nucleotide is covered by more than one probe, and the nucleotide position falls at a different position within each of those probes. The redundancy in coverage of this array format provides multiple measurements of the effect of a SNP on hybridization. Using a microarray that provides coverage of the entire S. cerevisiae genome it has been possible to characterize the loss of signal that is due to a SNP by studying a genome with some 25,000 known SNPs versus a reference sequence31. In this study, the authors modelled the loss of signal in the presence of a SNP and found that just four parameters explained >70% of the variance. Thus, it is possible to estimate the expected decrease in intensity for every probe given a mutation at each nucleotide position, and thereby test an unknown sample for the likelihood that it contains polymorphic sites. This approach has proved to be a robust means of comparing strains of yeast that are either closely related — that is, when genomes differ by as little as 0.000,01%31 (Fig. 2d) — or diverged69.
Following the detection of a likely SNP it is necessary to perform short-scale sequencing to identify the precise base change. This is usually feasible for a small number of mutations of interest. Even in the absence of precise sequence information it is often informative to examine the degree of sequence identity between different genomes to identify regions of high sequence identity and sequence divergence69.
The use of microarrays to assess sequence variation is inherently limited to the analysis of unique regions of the genome. Repetitive features and low-complexity DNA are generally avoided. In this respect, microarray-based mutation detection or resequencing is similar to new sequencing approaches that make use of millions of short sequence reads. One current advantage of a microarray-based approach over new sequencing approaches is the available throughput, although this is certain to change in the future. Moreover, although resequencing microarrays have been successfully applied to the detection of heterozygous mutations70, it is yet to be demonstrated that a loss-of-signal approach can be reliably applied to this problem.
Detecting insertion sequence variation
Mobile genetic elements provide one of the richest and most poorly understood sources of genetic variation. Transposons vary in copy number, type and location over virtually every genome, both between individuals and across species. In microorganisms, transposons are known to be associated with antibiotic resistance71. In humans, there is evidence that long interspersed nuclear element 1 (LINE1) retrotransposition is involved in generating neuronal diversity72 and variation in gene expression as well as being a source of disease-causing mutation73. In Saccharomyces yeasts, the Ty families of retrotransposons show substantial variation across strain backgrounds and species74,75, and novel transposon insertions can cause both adaptive76,77 and detrimental78 mutations. Retrotransposon proximity to genes can also modify gene expression and regulation79. Moreover, transposons are potentially a source of CNV as they are correlated with the breakpoints of genomic rearrangements from yeast41,80 to humans59.
Although these repetitive sequences are biologically important, they are poorly covered by all but the highest quality sequencing approaches. For example, many of the several hundred gaps remaining in the Saccharomyces bayanus sequence correlate with retrotransposon sequences in S. cerevisiae (M. Cherry, personal communication). Because of the technical issues that are involved with sequencing and assembling these repetitive elements they are often excluded from sequencing projects. Thus, methods for mapping these elements have been developed that rely on identifying the unique sequences abutting common repetitive sequences.
Mapping insertion sites. Global mapping of insertion sites is generally performed using a means of isolating the insertion element and its immediately neighbouring DNA. The DNA is then hybridized to a whole-genome array to identify its genomic location (Fig. 3). Sequence-specific isolation of insertion sites has been successfully demonstrated using oligonucleotide capture probes75, or by annealing linkers to fragmented DNA and using PCR81 by adapting a method that was developed to sequence the termini of genomic clones82. Thus far, analytical approaches to these data have simply entailed the identification of contiguous probes above some threshold value, although these methods are certain to evolve as the approaches mature.
Figure 3. Genome-wide mapping of loci by selective enrichment and detection using microarrays.
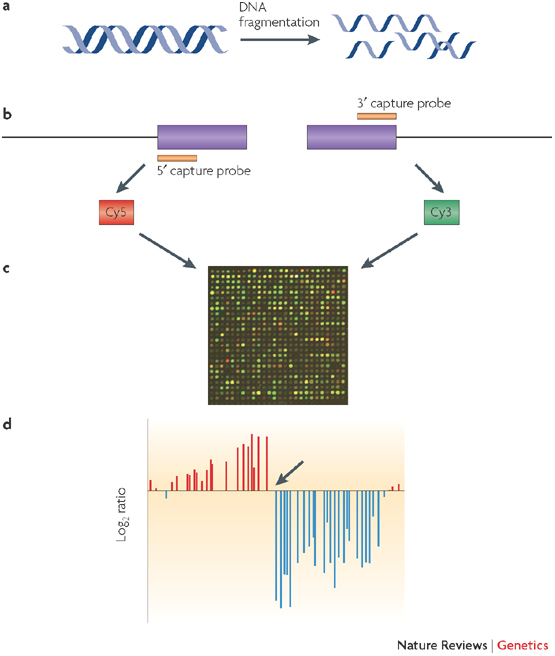
One way of mapping insertion sequence variation is to isolate the insertion element and its immediately neighbouring DNA. Specific regions of the genome are isolated using either a capture probe method (as illustrated in the diagram) or a PCR-based method. This approach is suited to mapping the location in the genome of mobile genetic elements, which are notoriously difficult to characterize using whole-genome sequencing approaches. As shown in the figure, DNA is fragmented in the first step (a). Two separate reactions selectively enrich for the 5′ and 3′ ends of the insertion sequence using sequence-specific capture probes (b). The 5′-enriched and the 3′-enriched fractions are labelled with different fluorophores (Cy5 and Cy3, respectively) and then hybridized to a microarray using a two-colour protocol (c). Finally, insertion sites are mapped on the basis of a transition (indicated by an arrow in d) from positive to negative log2 ratio, corresponding to sample that is enriched for DNA adjacent to the 5′ end of the insertion sequence and sample that is enriched for DNA adjacent to the 3′ end of the insertion sequence, respectively. The site of transition corresponds to the genomic location of the insertion sequence. Each red and blue bar represents a microarray probe in a contiguous region of the genome spanning ∼10 kb. The distance between each probe is ∼200 bp and therefore, in this case, the insertion site is detected between two probes corresponding to a mapping resolution of ∼200 bp.
Transposons are also used extensively as large-scale mutagenesis tools, in model organisms ranging from bacteria83 and yeast84,85 to zebrafish86 and mice87. Identifying the locations of experimentally mobilized transposons poses a similar challenge to identifying endogenous transposons. Isolation of the insertion sites of these artificial transposons in E. coli83,88 and H. pylori89 makes use of a T7 RNA polymerase promoter that is engineered into the transposon construct to selectively transcribe RNA from the region that is adjacent to the insertion site, which is then analysed using microarrays. This method is sufficiently quantitative that the relative abundance of mutants in a complex mixture can be followed over several rounds of genetic selection88, allowing the simultaneous identification of enriched and depleted mutants.
Most genome sequencing methods are not well suited to the problems posed by repetitive sequences. The shorter read lengths of next-generation sequencing methods exacerbate the problems of standard sequencing approaches with respect to coverage and assembly. Combining an enrichment method with sequencing rather than using microarrays presents one possibility. Conceptually, this approach is analogous to chromatin immunoprecipitation (ChIP), but rather than enriching loci using an antibody that is targeted to a DNA-bound protein of interest, an oligonucleotide would be used to enrich specific loci in the genome. As global ChIP has already been adapted to new sequencing platforms90,91, transposon mapping could in principle also be done this way.
Technical considerations
Experimental issues: the advantages of an internal control. When dealing with millions of data points it is important to ensure that data quality and processing are managed effectively. To obtain robust data, experimental and analytical considerations need to be made at all stages of the protocol. A fundamental difference between experimental platforms is whether there is an internal control for each probe, which is achieved by co-hybridizing differentially labelled sample and reference DNA (a two-colour microarray), or whether only a single sample is analysed (a one-colour microarray) (Box 2). Recent comparative studies have indicated that two-colour and one-colour microarray experiments produce concordant results for gene expression analysis92. However, in contrast with gene expression experiments (in which data from multiple probes can be used to determine a gene expression value) comparative genomic analyses are more sensitive to spurious probe values.
There are two arguments for the use of a co-hybridized reference in order to maximize the sensitivity of individual probe data. The first reason is the need for an internal control for probe quality. Microarray probes can be created in several different ways and the manufacturing of microarrays can result in significant variation in probe quality and quantity. This is particularly acute for the 'homemade' variety of microarrays, such as the BAC arrays used for aCGH, in which probe quality can vary greatly between microarrays. However, even leading microarray manufacturers frequently provide microarrays with variable probe quality93. The presence of an internal reference provides a means of controlling the variation that is due to probe quality because the measurement of interest is the relative binding efficiency between the reference (often a standard reference used over and over again) and sample. Therefore, this experimental design enables a ratiometric approach to data analysis rather than a reliance on absolute measurements between microarray experiments.
The second experimental concern addressed by a ratiometric approach is geographic variation across the microarray due to the conditions in which the hybridization occurred. Most microarrays are mixed by placing the array in a rotating hybridization oven or some device designed to provide agitation of the reactants. Variation in mixing and the concomitant differential time of exposure to reagents across the microarray can result in variable hybridization efficiency across the array. This too is readily controlled by the presence of an internal reference. An additional requirement for minimizing geographic artefacts in microarray data is the randomization of probe locations on the microarray with respect to genome location. This simple adjustment in array design reduces the chance that experimental artefacts are conflated with biological significance.
Several normalization methods that attempt to address inter- and intra-array variation for one-colour microarrays have been developed94. The use of a ratiometric approach greatly simplifies the task of extracting signal from noise because each measurement at every probe is internally controlled (Box 2). Nonetheless, two-colour experiments also have a potential limitation: they require the use of two different dyes, which can introduce a dye-specific bias. This effect can be mitigated either by repeating experiments with the dyes interchanged, by performing control experiments that explicitly study the effect of dye bias95 or by addressing the effect using statistical approaches96.
Data analysis considerations. A first step in data processing is normalizing data for comparison with or between microarrays. The methods that are used in both one-colour and two-colour microarray experiments usually assume that there is an equal quantity of DNA in all samples. However, this assumption is incorrect in the case of aneuploid samples and, to a lesser extent, samples with differing CNV content. Simple linear corrections have been applied in the case of yeast that carry extra chromosomes97, but most methods for normalization do not account for this possibility thereby underestimating values for regions that differ between the two genomes. Similarly, normalization methods for the sequence-level comparison of genomes using short-oligonucleotide microarrays require approaches that do not assume that total hybridization across the array is always equal between samples.
A key to validating any microarray approach is an assessment of false positive and false negative rates. This is challenging insofar as it requires knowledge of variation in another genome from the same species that can be used as a test case. For a small number of organisms, multiple sequenced genomes are available, which facilitates testing of a method against a gold standard. Where this is not possible methods must rely on comparisons between datasets.
The value of visualizing and exploring genome-scale data cannot be understated. A number of software options exist for visualizing data (Table 1). These include visualization tools in programs such as MeV and Java TreeView. Modules in the Bioconductor package can also be used for visualizing aCGH data. In our experience the freeware application, Integrated Genome Browser, provides a great deal of flexibility in terms of the data types that can be imported and viewed and is versatile for viewing multiple diverse datasets simultaneously.
Table 1.
Software for analyzing and visualizing microarray data for genome comparisons
| Software | Website | Use | Variant class | Examples | Refs |
|---|---|---|---|---|---|
| Java TreeView | http://jtreeview.sourceforge.net | Visualization | Structural | See Fig. 1 | 110 |
| Integrated Genome Browser | http://www.affymetrix.com/support/developer/ tools/download_igb.affx | Visualization | Structural and SNP | See Fig. 2 | – |
| MeV | http://www.tm4.org/mev.html | Data analysis and visualization | Structural | – | 111 |
| Bioconductor | http://www.bioconductor.org | Data analysis and visualization | Structural and SNP | – | 112 |
| SNPScanner | http://genomics-pubs.princeton.edu/SNPscanner | SNP detection | SNP | See Fig. 2 | 31 |
Inherent limitations. Although microarray-based methods are a powerful and simple approach to characterizing genomic variation, there are a number of limitations. The greatest limitation in comparison with de novo sequencing methods is the fact that only known sequence is interrogated. Most microarrays have been made using a reference sequence that was obtained using whole-genome Sanger sequencing of one or a few members of a species. Therefore, if additional individuals that contain genomic loci that were not detected in the initial sequencing are analysed using these arrays then these genomic regions will be completely missed in the analysis. This is likely to represent a small proportion of any genome, but in yeast there are a number of cases of genes that are found in some strains but that are not present in the reference sequence98. It seems likely that this will be a general case for many species. Once such genes have been found in other individuals it makes sense to incorporate them into subsequent microarray designs.
An additional limitation for microarrays is the analysis of highly repetitive regions. This includes regions or features of the genome that are present in multiple copies, such as transposons and telomeres as well as low-complexity DNA that contains repetitive motifs. Low-complexity DNA poses a particular problem for detecting sequence variation because hybridization efficiency seems to be much more variable in these regions and is a common source of false positives.
The future
As more attention moves from determining genomic sequences de novo to comparing large numbers of individual variants of the same sequences, the need to simplify and reduce the cost and effort will increase. In most of the main areas of investigation (for example, disease and evolution) the changes will involve a miniscule fraction of the total genomic sequence (for the human genome sequence, as little as 1 base in 3 billion); here, the prospect of truly efficient DNA-microarray-based surveys of variant sequences, followed by local sequencing, promises reductions in cost that make it entirely possible to study thousands of samples in a single laboratory. We expect that even though sequencing will continue to be made cheaper and more effective, the evolution of DNA-microarray technology will keep pace or better, resulting in a situation in which the 'detect, map and locally sequence' strategy, which is essentially a combination of approaches, will continue to outperform complete resequencing for some time to come.
An explicit example of an innovative combination of a microarray-based approach coupled with sequencing was the capture of the SARS coronavirus using a microarray of 70mer oligonucleotides followed by sequence confirmation99. This approach has now been extended to selective enrichment of the entire coding fraction of the human genome, enabling targeted resequencing using high-throughput methods100,101,102. Clearly, these applications suggest the feasibility of a generic approach in which regions of interest that are identified using microarrays can be directly isolated and further investigated.
The use of microarrays to resequence the small genomes of pathogens has been one of the most productive uses of array-based approaches to sequence-level comparisons. With increasing flexibility in array manufacturing and improved methods for detecting variation this approach should be readily applicable to various organisms. With a growing interest in the human microbiome103,104 and its role in normal and disease states, studying the role of genomic variation in these microorganisms will become increasingly important.
Surprisingly, the ability to localize sequence changes cheaply has generated considerable demand in traditional experimental settings, such as the identification of suppressor mutations and as an adjunct to positional cloning. In practice, a single microarray experiment can save many years of laborious work. Moreover, the ability to assess global variation in an unbiased manner allows questions regarding the genetic consequences of experimental techniques, such as the mutagenic cost on the host genome of genetic engineering manipulations, and of natural phenomena, such as ageing, to be effectively addressed on a global scale.
The application of these methods will accelerate current areas of research and allow new questions to be asked in all organisms, including humans (Box 3). For example, studying the role of intra-individual somatic cell genomic variation might prove insightful for investigating the genomic basis of somatic tissue disease. This is clearly relevant to known genetic diseases such as cancer, in which the current state of the art is Sanger sequencing105,106. However, it is also likely to be of great importance to the study of other diseases of somatic origin, in which the identification of causative mutations is refractory to typical genetic approaches. Similarly, identifying global sites of viral integration, for example, with human immunodeficiency virus107, and identifying natural variation in insertion sequences in species is a comparatively under-explored area of biology in which microarray-based approaches have much to offer.
Conclusion
Although the advent of generic, 'gold standard' genomic sequences has indeed produced a radical change in biological research, only a fraction of the potential biological insight of genomic sequences is available from this source: the remainder will require genomic comparisons of many types. All forms of genomic diversity — structural, sequence and insertional — can be detected using microarrays. In contrast with the cost, labour and time that is involved in whole-genome sequencing, microarray-based approaches are fast, flexible and inexpensive. It seems likely that the co-evolution of DNA microarray and direct-sequencing strategies will make the power of genomic comparison accessible to any and all researchers who might benefit from it.
Box 1 | The chemical basis of genome comparison.
As with all intermolecular reactions, the rate of formation of the DNA duplex that is formed between the probe and the sample is a function of both the concentration of reactants and temperature. To use hybridization to compare genomes at the sequence level it is necessary to maximize the difference between the Tm of the perfectly matched DNA and the Tm of the mismatched DNA. This difference is highly dependent on the length of the oligonucleotide and in practice is likely to only be within the range of detection for oligonucleotides that are shorter than 50 bp. Therefore, short probes are required to interrogate sequence differences between genomes. Longer probes — such as those provided by BAC clones, cDNA clones or PCR products — provide greater coverage of the genome and allow detection of structural variation, even in the presence of a small number of sequence differences (see table; IV, insertional variation; SV, structural variation).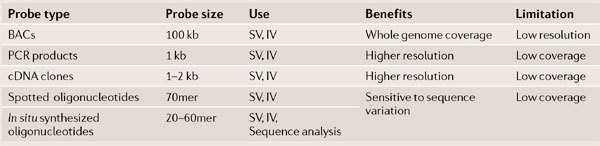
Box 2 | Outline of a typical microarray experiment.
In a two-colour experiment (panel a in the figure) DNA from individuals of the same species or different tissue from a single individual (for example, normal and diseased cells) is extracted and differentially labelled with compatible fluorophores (for example, Cy3 and Cy5). Equal amounts of labelled DNA is hybridized to the microarray, and the hybridization reaction is allowed to come to equilibrium over a period of >12 hours. At most probes, equal amounts of the two samples will hybridize (yellow features on the array), reflecting the fact that most loci in the two genomes are present in equal amounts (for example region 3). Regions that are deleted in the sample genome (region 1 of sample A) will result in probes with increased relative Cy3 signal (green features). Alternatively, amplified regions in the sample (region 2 of sample A) will result in features with an increased relative Cy5 signal (red features). Over the entire microarray, the signal ratios at each feature follow a Gaussian distribution, and candidate copy number variations are identified on the basis of deviation of a particular probe ratio, using statistical cut-offs. Although the diagram illustrates the protocol for array comparative genome hybridization, all array procedures, including SNP discovery and insertion site mapping, are carried out in this way.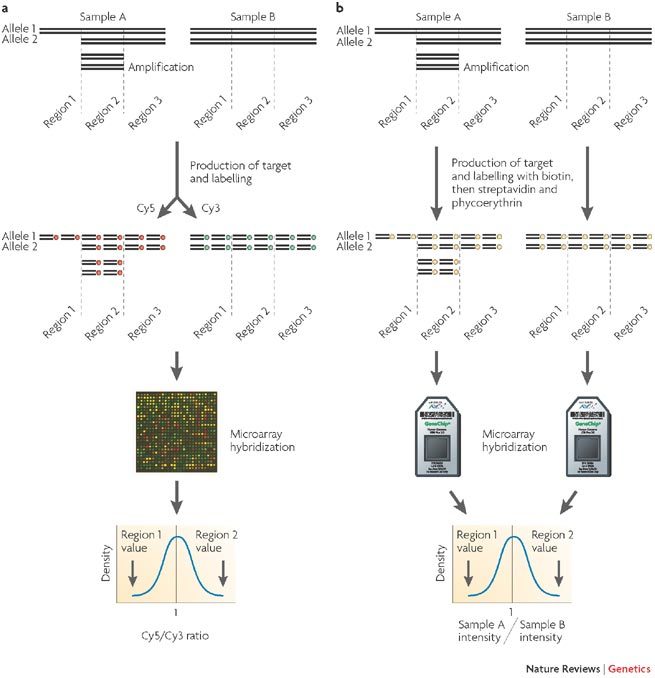
One-colour experiments (panel b in the figure) are performed in a similar manner, except that the DNA is labelled with a single colour and hybridized to a microarray without a reference sample. The difference between two-colour and one-colour experiments is that in the former case two samples are compared within an experiment whereas in the latter case two separate experiments are required to compare the samples. For Affymetrix-manufactured microarrays, the method entails labelling DNA with biotin, then adding streptavidin conjugated to phycoerythrin after hybridization (represented by yellow circles). Rather than a ratio, an absolute value of hybridization is determined; following normalization, this value is compared with other experiments to detect genomic variation.
A single two-colour hybridization gives less variation at each probe than two independent one-colour hybridizations because the detailed conditions at every probe, such as salt concentration and temperature, are identical in the two-colour experiment but are not necessarily identical in the two independent one-colour experiments.
Part a of the figure is modified, with permission, from Nature Reviews Genetics Ref. 108 © (2006) Macmillan Publishers Ltd.
Box 3 | The potential of microarrays to provide insights into human genome variation.
Microarrays are being applied to a wide range of questions regarding genomic diversity in humans. Whereas microarrays have so far been used predominantly for SNP genotyping60, we believe that microarrays will continue to provide a powerful means of discovering new genomic variation and assaying its frequency in the human genome.
Below is a list of some of the applications of microarray-based approaches to studying human genome diversity that have already commenced — and some questions that should be tractable using the approaches discussed in this Review.
Studying the nature and extent of structural variation in the human genome. The recent discovery of widespread copy number variation (CNV) in the human genome44,57 has ignited a new interest in this class of genomic variation, which is amenable to discovery using array comparative genome hybridization.
The relationship between structural variation and human disease. It has long been known that human disease can be caused by gene amplification or deletion37, but it is only recently that genome-scale approaches have revealed the high frequency of de novo CNV and its potential association with autism46.
The role of gene amplification in human evolution. Recently, it has been discovered that CNV at the AMY1 locus, encoding the salivary enzyme, amylase, has been under selective pressure through human history109. It is likely that selection for or against CNV of particular loci will be a general theme in the human genome as it is in other organisms.
Genomic changes associated with cancers. Typically, genome-wide studies of somatic point mutations that are associated with cancers in humans have used Sanger sequencing approaches105,106. Microarray-based approaches have the potential to address the various genomics events, including base pair changes, structural variation and possibly insertion variation, that are associated with cancers far more rapidly and efficiently.
The role of insertion sequences (for example, long interspersed nuclear elements, or LINEs) in generating cellular diversity and disease. A study has reported the potential role of LINE1 elements in generating neuronal diversity72. This presents the tantalizing possibility that somatic mosaicism might be facilitated by mobile elements in the genome — a question that is readily amenable to microarray-based approaches.
The extent of insertional variation in humans. Mobile elements constitute most of the human genome. However, little is known about their variation throughout the human population. It is reasonable to expect that this variation is at least comparable to that observed for CNV.
Acknowledgements
We thank members of the Botstein and Dunham laboratories. Research is supported by the National Institute of General Medical Sciences Center for Quantitative Biology (GM-071508) grant.
Glossary
- Experimental evolution
The long-term selection of microorganisms or populations under laboratory conditions to model simple evolutionary scenarios.
- Detect
The identification of a genomic variant, the actual state of which is not known until further analysis.
- DNA probe
In the context of microarrays, DNA probe refers to the DNA oligonucleotide, PCR product or genomic clone that is attached to a microarray in order to probe a labelled genomic DNA sample that is added in solution. In the context of Southern blotting, DNA probe refers to the labelled DNA oligonucleotide that is added in solution to probe the genomic DNA sample that is immobilized on a membrane.
- Photolithography
The use of masks to selectively deprotect nascent oligonucleotides using light, allowing the parallel synthesis of millions of probes.
- Ink-jet deposition
The use of print cartridge heads to deposit one of the four DNA bases at a probe site on the microarray.
- Fluorescent in situ hybridization
(FISH). A technique in which a fluorescently labelled DNA probe is used to detect a particular chromosome or gene using fluorescence microscopy.
- Quantitative PCR
A procedure in which the products of a PCR reaction are measured by monitoring the signal that is produced by a fluorescent dye, which accumulates during each PCR cycle.
- Tm
The Tm (melting temperature) of an oligonucleotide is the temperature at which 50% of the duplex strands are separated.
- Suppressor mutations
Mutations that suppress, or alleviate, the phenotypic effect of another mutation.
- Genome complexity
The number of different DNA sequences in a genome, originally measured by the rate of re-association of heat-denatured DNA.
- Paired-end sequencing
Determination of the sequence at both ends of a fragment of DNA of known size.
- Resequencing
The determination of the exact DNA sequence by comparison with a known reference.
- Parametric tests
Statistical tests that assume an underlying distribution, which is usually Gaussian. The term Gaussian describes a continuous probability distribution that is symmetrical around a defined mean value, the shape of which is determined by the variance.
- Chromatin immunoprecipitation
(ChIP). Fractionation of DNA that is bound to a protein of interest by means of an antibody.
- Ratiometric approach
The use of methods that include an internal reference so that the ratio between sample and control is the metric of interest.
Biographies
David Gresham obtained a Ph.D. in human genetics from Edith Cowan University in Perth, Australia. His graduate work entailed medical and population genetic studies of the Roma (Gypsies). Following the completion of his Ph.D. he became a research editor at Nature Genetics from 2001–2004. He joined the laboratory of David Botstein at Princeton University (New Jersey, USA) as a Postdoctoral Fellow in 2004, where he has been training as a yeast biologist and genomic scientist. His current research focuses on experimental evolution, genetic networks and transcriptional regulation in Saccharomyces cerevisiae.
Maitreya Dunham received her undergraduate degree from the Massachusetts Institute of Technology (Massachusetts, USA) before heading to Stanford University (California, USA) for graduate school. She did her genetics Ph.D. research in David Botstein's laboratory, where she began work on genomic approaches to studying experimental evolution in yeast. As a Lewis–Sigler Fellow at Princeton University (New Jersey, USA), Maitreya has continued this work and expanded her laboratory to include interests in aneuploidy, other yeasts and their hybrids, and transposon biology. She also enjoys teaching as part of Princeton's Integrated Science curriculum. In the summer of 2008 she will move to the University of Washington in Seattle as an assistant professor in genome sciences.
David Botstein is Director of the Lewis–Sigler Institute of Integrative Genomics at Princeton University (New Jersey, USA). Previously he held positions as the Chair of the Genetics Department at Stanford University (California, USA), Vice President — Science at Genetech and Professor of Biology at the Massachusetts Institute of Technology (Massachusetts, USA). His research interests have spanned bacteriophage genetics, the yeast cytoskeleton, gene mapping in humans, genome sequencing, and the development and application of DNA-microarray technology for studying cell physiology and human disease. His current research is focused on experimental evolution, metabolism, cell cycle and systems biology using yeast as a model organism.
Related links
FURTHER INFORMATION
Contributor Information
David Gresham, Email: dgresham@genomics.princeton.edu, Email: maitreya@princeton.edu, Email: botstein@genomics.princeton.edu.
Maitreya J. Dunham, Email: dgresham@genomics.princeton.edu, Email: maitreya@princeton.edu, Email: botstein@genomics.princeton.edu
David Botstein, Email: dgresham@genomics.princeton.edu, Email: maitreya@princeton.edu, Email: botstein@genomics.princeton.edu.
References
- 1.Sanger F, Nicklen S, Coulson AR. DNA sequencing with chain-terminating inhibitors. Proc. Natl Acad. Sci. USA. 1977;74:5463–5467. doi: 10.1073/pnas.74.12.5463. [DOI] [PMC free article] [PubMed] [Google Scholar]
- 2.Sanger F, et al. Nucleotide sequence of bacteriophage φX174 DNA. Nature. 1977;265:687–695. doi: 10.1038/265687a0. [DOI] [PubMed] [Google Scholar]
- 3.Lander ES, et al. Initial sequencing and analysis of the human genome. Nature. 2001;409:860–921. doi: 10.1038/35057062. [DOI] [PubMed] [Google Scholar]
- 4.Venter JC, et al. The sequence of the human genome. Science. 2001;291:1304–1351. doi: 10.1126/science.1058040. [DOI] [PubMed] [Google Scholar]
- 5.Venter JC, Levy S, Stockwell T, Remington K, Halpern A. Massive parallelism, randomness and genomic advances. Nature Genet. 2003;33:219–227. doi: 10.1038/ng1114. [DOI] [PubMed] [Google Scholar]
- 6.DeRisi JL, Iyer VR, Brown PO. Exploring the metabolic and genetic control of gene expression on a genomic scale. Science. 1997;278:680–686. doi: 10.1126/science.278.5338.680. [DOI] [PubMed] [Google Scholar]
- 7.Velculescu VE, et al. Characterization of the yeast transcriptome. Cell. 1997;88:243–251. doi: 10.1016/S0092-8674(00)81845-0. [DOI] [PubMed] [Google Scholar]
- 8.Winzeler EA, et al. Functional characterization of the S. cerevisiae genome by gene deletion and parallel analysis. Science. 1999;285:901–906. doi: 10.1126/science.285.5429.901. [DOI] [PubMed] [Google Scholar]
- 9.Kamath RS, et al. Systematic functional analysis of the Caenorhabditis elegans genome using RNAi. Nature. 2003;421:231–237. doi: 10.1038/nature01278. [DOI] [PubMed] [Google Scholar]
- 10.Ghaemmaghami S, et al. Global analysis of protein expression in yeast. Nature. 2003;425:737–741. doi: 10.1038/nature02046. [DOI] [PubMed] [Google Scholar]
- 11.Reboul J, et al. C. elegans ORFeome version 1.1: experimental verification of the genome annotation and resource for proteome-scale protein expression. Nature Genet. 2003;34:35–41. doi: 10.1038/ng1140. [DOI] [PubMed] [Google Scholar]
- 12.Shendure J, et al. Accurate multiplex polony sequencing of an evolved bacterial genome. Science. 2005;309:1728–1732. doi: 10.1126/science.1117389. [DOI] [PubMed] [Google Scholar]
- 13.Margulies M, et al. Genome sequencing in microfabricated high-density picolitre reactors. Nature. 2005;437:376–380. doi: 10.1038/nature03959. [DOI] [PMC free article] [PubMed] [Google Scholar]
- 14.Bentley DR. Whole-genome re-sequencing. Curr. Opin. Genet. Dev. 2006;16:545–552. doi: 10.1016/j.gde.2006.10.009. [DOI] [PubMed] [Google Scholar]
- 15.Marmur J, Doty P. Thermal renaturation of deoxyribonucleic acids. J. Mol. Biol. 1961;3:585–594. doi: 10.1016/S0022-2836(61)80023-5. [DOI] [PubMed] [Google Scholar]
- 16.Davis RW, Davidson N. Electron-microscopic visualization of deletion mutations. Proc. Natl Acad. Sci. USA. 1968;60:243–250. doi: 10.1073/pnas.60.1.243. [DOI] [PMC free article] [PubMed] [Google Scholar]
- 17.Southern EM. Detection of specific sequences among DNA fragments separated by gel electrophoresis. J. Mol. Biol. 1975;98:503–517. doi: 10.1016/S0022-2836(75)80083-0. [DOI] [PubMed] [Google Scholar]
- 18.Kafatos FC, Jones CW, Efstratiadis A. Determination of nucleic acid sequence homologies and relative concentrations by a dot hybridization procedure. Nucleic Acids Res. 1979;7:1541–1552. doi: 10.1093/nar/7.6.1541. [DOI] [PMC free article] [PubMed] [Google Scholar]
- 19.Wallace RB, et al. Hybridization of synthetic oligodeoxyribonucleotides to φχ174 DNA: the effect of single base pair mismatch. Nucleic Acids Res. 1979;6:3543–3557. doi: 10.1093/nar/6.11.3543. [DOI] [PMC free article] [PubMed] [Google Scholar]
- 20.Conner BJ, et al. Detection of sickle cell β S-globin allele by hybridization with synthetic oligonucleotides. Proc. Natl Acad. Sci. USA. 1983;80:278–282. doi: 10.1073/pnas.80.1.278. [DOI] [PMC free article] [PubMed] [Google Scholar]
- 21.Maskos U, Southern EM. Oligonucleotide hybridizations on glass supports: a novel linker for oligonucleotide synthesis and hybridization properties of oligonucleotides synthesised. in situ. Nucleic Acids Res. 1992;20:1679–1684. doi: 10.1093/nar/20.7.1679. [DOI] [PMC free article] [PubMed] [Google Scholar]
- 22.Pease AC, et al. Light-generated oligonucleotide arrays for rapid DNA sequence analysis. Proc. Natl Acad. Sci. USA. 1994;91:5022–5026. doi: 10.1073/pnas.91.11.5022. [DOI] [PMC free article] [PubMed] [Google Scholar]
- 23.Hughes TR, et al. Expression profiling using microarrays fabricated by an ink-jet oligonucleotide synthesizer. Nature Biotechnol. 2001;19:342–347. doi: 10.1038/86730. [DOI] [PubMed] [Google Scholar]
- 24.Shalon D, Smith SJ, Brown PO. A DNA microarray system for analyzing complex DNA samples using two-color fluorescent probe hybridization. Genome Res. 1996;6:639–645. doi: 10.1101/gr.6.7.639. [DOI] [PubMed] [Google Scholar]
- 25.Wong CW, et al. Tracking the evolution of the SARS coronavirus using high-throughput, high-density resequencing arrays. Genome Res. 2004;14:398–405. doi: 10.1101/gr.2141004. [DOI] [PMC free article] [PubMed] [Google Scholar]
- 26.Chee M, et al. Accessing genetic information with high-density DNA arrays. Science. 1996;274:610–614. doi: 10.1126/science.274.5287.610. [DOI] [PubMed] [Google Scholar]
- 27.Maitra A, et al. The human MitoChip: a high-throughput sequencing microarray for mitochondrial mutation detection. Genome Res. 2004;14:812–819. doi: 10.1101/gr.2228504. [DOI] [PMC free article] [PubMed] [Google Scholar]
- 28.Ishkanian AS, et al. A tiling resolution DNA microarray with complete coverage of the human genome. Nature Genet. 2004;36:299–303. doi: 10.1038/ng1307. [DOI] [PubMed] [Google Scholar]
- 29.Fiegler H, et al. Accurate and reliable high-throughput detection of copy number variation in the human genome. Genome Res. 2006;16:1566–1574. doi: 10.1101/gr.5630906. [DOI] [PMC free article] [PubMed] [Google Scholar]
- 30.David L, et al. A high-resolution map of transcription in the yeast genome. Proc. Natl Acad. Sci. USA. 2006;103:5320–5325. doi: 10.1073/pnas.0601091103. [DOI] [PMC free article] [PubMed] [Google Scholar]
- 31.Gresham D, et al. Genome-wide detection of polymorphisms at nucleotide resolution with a single DNA microarray. Science. 2006;311:1932–1936. doi: 10.1126/science.1123726. [DOI] [PubMed] [Google Scholar]
- 32.Zhang X, et al. Genome-wide high-resolution mapping and functional analysis of DNA methylation in Arabidopsis. Cell. 2006;126:1189–1201. doi: 10.1016/j.cell.2006.08.003. [DOI] [PubMed] [Google Scholar]
- 33.Clark RM, et al. Common sequence polymorphisms shaping genetic diversity in Arabidopsis thaliana. Science. 2007;317:338–342. doi: 10.1126/science.1138632. [DOI] [PubMed] [Google Scholar]
- 34.Hinds DA, et al. Whole-genome patterns of common DNA variation in three human populations. Science. 2005;307:1072–1079. doi: 10.1126/science.1105436. [DOI] [PubMed] [Google Scholar]
- 35.Feuk L, Marshall CR, Wintle RF, Scherer SW. Structural variants: changing the landscape of chromosomes and design of disease studies. Hum. Mol. Genet. 2006;15:R57–R66. doi: 10.1093/hmg/ddl057. [DOI] [PubMed] [Google Scholar]
- 36.Craven SH, Neidle EL. Double trouble: medical implications of genetic duplication and amplification in bacteria. Future Microbiol. 2007;2:309–321. doi: 10.2217/17460913.2.3.309. [DOI] [PubMed] [Google Scholar]
- 37.Lupski JR. Genomic rearrangements and sporadic disease. Nature Genet. 2007;39:S43–S47. doi: 10.1038/ng2084. [DOI] [PubMed] [Google Scholar]
- 38.Bishop JM. The molecular genetics of cancer. Science. 1987;235:305–311. doi: 10.1126/science.3541204. [DOI] [PubMed] [Google Scholar]
- 39.Pinkel D, et al. High resolution analysis of DNA copy number variation using comparative genomic hybridization to microarrays. Nature Genet. 1998;20:207–211. doi: 10.1038/2524. [DOI] [PubMed] [Google Scholar]
- 40.Pollack JR, et al. Genome-wide analysis of DNA copy-number changes using cDNA microarrays. Nature Genet. 1999;23:41–46. doi: 10.1038/12640. [DOI] [PubMed] [Google Scholar]
- 41.Dunham MJ, et al. Characteristic genome rearrangements in experimental evolution of Saccharomyces cerevisiae. Proc. Natl Acad. Sci. USA. 2002;99:16144–16149. doi: 10.1073/pnas.242624799. [DOI] [PMC free article] [PubMed] [Google Scholar]
- 42.Lucito R, et al. Genetic analysis using genomic representations. Proc. Natl Acad. Sci. USA. 1998;95:4487–4492. doi: 10.1073/pnas.95.8.4487. [DOI] [PMC free article] [PubMed] [Google Scholar]
- 43.Iafrate AJ, et al. Detection of large-scale variation in the human genome. Nature Genet. 2004;36:949–951. doi: 10.1038/ng1416. [DOI] [PubMed] [Google Scholar]
- 44.Sebat J, et al. Large-scale copy number polymorphism in the human genome. Science. 2004;305:525–528. doi: 10.1126/science.1098918. [DOI] [PubMed] [Google Scholar]
- 45.Stankiewicz P, Beaudet AL. Use of array CGH in the evaluation of dysmorphology, malformations, developmental delay, and idiopathic mental retardation. Curr. Opin. Genet. Dev. 2007;17:182–192. doi: 10.1016/j.gde.2007.04.009. [DOI] [PubMed] [Google Scholar]
- 46.Sebat J, et al. Strong association of de novo copy number mutations with autism. Science. 2007;316:445–449. doi: 10.1126/science.1138659. [DOI] [PMC free article] [PubMed] [Google Scholar]
- 47.Weiss LA, et al. Association between microdeletion and microduplication at 16p11.2 and autism. N. Engl. J. Med. 2008;358:667–675. doi: 10.1056/NEJMoa075974. [DOI] [PubMed] [Google Scholar]
- 48.Brown CJ, Todd KM, Rosenzweig RF. Multiple duplications of yeast hexose transport genes in response to selection in a glucose-limited environment. Mol. Biol. Evol. 1998;15:931–942. doi: 10.1093/oxfordjournals.molbev.a026009. [DOI] [PubMed] [Google Scholar]
- 49.Hughes TR, et al. Widespread aneuploidy revealed by DNA microarray expression profiling. Nature Genet. 2000;25:333–337. doi: 10.1038/77116. [DOI] [PubMed] [Google Scholar]
- 50.Maydan JS, et al. Efficient high-resolution deletion discovery in Caenorhabditis elegans by array comparative genomic hybridization. Genome Res. 2007;17:337–347. doi: 10.1101/gr.5690307. [DOI] [PMC free article] [PubMed] [Google Scholar]
- 51.Graubert TA, et al. A high-resolution map of segmental DNA copy number variation in the mouse genome. PLoS Genet. 2007;3:e3. doi: 10.1371/journal.pgen.0030003. [DOI] [PMC free article] [PubMed] [Google Scholar]
- 52.Olshen AB, Venkatraman ES, Lucito R, Wigler M. Circular binary segmentation for the analysis of array-based DNA copy number data. Biostatistics. 2004;5:557–572. doi: 10.1093/biostatistics/kxh008. [DOI] [PubMed] [Google Scholar]
- 53.Marioni JC, Thorne NP, Tavare S. BioHMM: a heterogeneous hidden Markov model for segmenting array CGH data. Bioinformatics. 2006;22:1144–1146. doi: 10.1093/bioinformatics/btl089. [DOI] [PubMed] [Google Scholar]
- 54.Barrett MT, et al. Comparative genomic hybridization using oligonucleotide microarrays and total genomic DNA. Proc. Natl Acad. Sci. USA. 2004;101:17765–17770. doi: 10.1073/pnas.0407979101. [DOI] [PMC free article] [PubMed] [Google Scholar]
- 55.Selzer RR, et al. Analysis of chromosome breakpoints in neuroblastoma at sub-kilobase resolution using fine-tiling oligonucleotide array CGH. Genes Chromosomes Cancer. 2005;44:305–319. doi: 10.1002/gcc.20243. [DOI] [PubMed] [Google Scholar]
- 56.Urban AE, et al. High-resolution mapping of DNA copy alterations in human chromosome 22 using high-density tiling oligonucleotide arrays. Proc. Natl Acad. Sci. USA. 2006;103:4534–4539. doi: 10.1073/pnas.0511340103. [DOI] [PMC free article] [PubMed] [Google Scholar]
- 57.Redon R, et al. Global variation in copy number in the human genome. Nature. 2006;444:444–454. doi: 10.1038/nature05329. [DOI] [PMC free article] [PubMed] [Google Scholar]
- 58.Weir BA, et al. Characterizing the cancer genome in lung adenocarcinoma. Nature. 2007;450:893–898. doi: 10.1038/nature06358. [DOI] [PMC free article] [PubMed] [Google Scholar]
- 59.Korbel JO, et al. Paired-end mapping reveals extensive structural variation in the human genome. Science. 2007;318:420–426. doi: 10.1126/science.1149504. [DOI] [PMC free article] [PubMed] [Google Scholar]
- 60.Fan JB, Chee MS, Gunderson KL. Highly parallel genomic assays. Nature Rev. Genet. 2006;7:632–644. doi: 10.1038/nrg1901. [DOI] [PubMed] [Google Scholar]
- 61.Kallioniemi OP. Biochip technologies in cancer research. Ann. Med. 2001;33:142–147. doi: 10.3109/07853890109002069. [DOI] [PubMed] [Google Scholar]
- 62.Maskos U, Southern EM. Parallel analysis of oligodeoxyribonucleotide (oligonucleotide) interactions. I. Analysis of factors influencing oligonucleotide duplex formation. Nucleic Acids Res. 1992;20:1675–1678. doi: 10.1093/nar/20.7.1675. [DOI] [PMC free article] [PubMed] [Google Scholar]
- 63.Hacia JG, Brody LC, Chee MS, Fodor SP, Collins FS. Detection of heterozygous mutations in BRCA1 using high density oligonucleotide arrays and two-colour fluorescence analysis. Nature Genet. 1996;14:441–447. doi: 10.1038/ng1296-441. [DOI] [PubMed] [Google Scholar]
- 64.Winzeler EA, et al. Direct allelic variation scanning of the yeast genome. Science. 1998;281:1194–1197. doi: 10.1126/science.281.5380.1194. [DOI] [PubMed] [Google Scholar]
- 65.Borevitz JO, et al. Large-scale identification of single-feature polymorphisms in complex genomes. Genome Res. 2003;13:513–523. doi: 10.1101/gr.541303. [DOI] [PMC free article] [PubMed] [Google Scholar]
- 66.Turner TL, Hahn MW, Nuzhdin SV. Genomic islands of speciation in Anopheles gambiae. PLoS Biol. 2005;3:e285. doi: 10.1371/journal.pbio.0030285. [DOI] [PMC free article] [PubMed] [Google Scholar]
- 67.Albert TJ, et al. Mutation discovery in bacterial genomes: metronidazole resistance in Helicobacter pylori. Nature Methods. 2005;2:951–953. doi: 10.1038/nmeth805. [DOI] [PubMed] [Google Scholar]
- 68.Herring CD, et al. Comparative genome sequencing of Escherichia coli allows observation of bacterial evolution on a laboratory timescale. Nature Genet. 2006;38:1406–1412. doi: 10.1038/ng1906. [DOI] [PubMed] [Google Scholar]
- 69.Schacherer J, et al. Genome-wide analysis of nucleotide-level variation in commonly used Saccharomyces cerevisiae strains. PLoS ONE. 2007;2:e322. doi: 10.1371/journal.pone.0000322. [DOI] [PMC free article] [PubMed] [Google Scholar]
- 70.Cutler DJ, et al. High-throughput variation detection and genotyping using microarrays. Genome Res. 2001;11:1913–1925. doi: 10.1101/gr.197201. [DOI] [PMC free article] [PubMed] [Google Scholar]
- 71.Kleckner N. Transposable elements in prokaryotes. Annu. Rev. Genet. 1981;15:341–404. doi: 10.1146/annurev.ge.15.120181.002013. [DOI] [PubMed] [Google Scholar]
- 72.Muotri AR, et al. Somatic mosaicism in neuronal precursor cells mediated by L1 retrotransposition. Nature. 2005;435:903–910. doi: 10.1038/nature03663. [DOI] [PubMed] [Google Scholar]
- 73.Babushok DV, Kazazian HH., Jr. Progress in understanding the biology of the human mutagen LINE-1. Hum. Mutat. 2007;28:527–539. doi: 10.1002/humu.20486. [DOI] [PubMed] [Google Scholar]
- 74.Liti G, Peruffo A, James SA, Roberts IN, Louis EJ. Inferences of evolutionary relationships from a population survey of LTR-retrotransposons and telomeric-associated sequences in the Saccharomyces sensu stricto complex. Yeast. 2005;22:177–192. doi: 10.1002/yea.1200. [DOI] [PubMed] [Google Scholar]
- 75.Gabriel A, et al. Global mapping of transposon location. PLoS Genet. 2006;2:e212. doi: 10.1371/journal.pgen.0020212. [DOI] [PMC free article] [PubMed] [Google Scholar]
- 76.Blanc VM, Adams J. Evolution in Saccharomyces cerevisiae: identification of mutations increasing fitness in laboratory populations. Genetics. 2003;165:975–983. doi: 10.1093/genetics/165.3.975. [DOI] [PMC free article] [PubMed] [Google Scholar]
- 77.Aminetzach YT, Macpherson JM, Petrov DA. Pesticide resistance via transposition-mediated adaptive gene truncation in Drosophila. Science. 2005;309:764–767. doi: 10.1126/science.1112699. [DOI] [PubMed] [Google Scholar]
- 78.Wilke CM, Adams J. Fitness effects of Ty transposition in Saccharomyces cerevisiae. Genetics. 1992;131:31–42. doi: 10.1093/genetics/131.1.31. [DOI] [PMC free article] [PubMed] [Google Scholar]
- 79.Chisholm GE, Cooper TG. Ty insertions upstream and downstream of native DUR1,2 promoter elements generate different patterns of DUR1,2 expression in Saccharomyces cerevisiae. J. Bacteriol. 1992;174:2548–2559. doi: 10.1128/jb.174.8.2548-2559.1992. [DOI] [PMC free article] [PubMed] [Google Scholar]
- 80.Kellis M, Birren BW, Lander ES. Proof and evolutionary analysis of ancient genome duplication in the yeast Saccharomyces cerevisiae. Nature. 2004;428:617–624. doi: 10.1038/nature02424. [DOI] [PubMed] [Google Scholar]
- 81.Wheelan SJ, Scheifele LZ, Martinez-Murillo F, Irizarry RA, Boeke JD. Transposon insertion site profiling chip (TIP-chip) Proc. Natl Acad. Sci. USA. 2006;103:17632–17637. doi: 10.1073/pnas.0605450103. [DOI] [PMC free article] [PubMed] [Google Scholar]
- 82.Riley J, et al. A novel, rapid method for the isolation of terminal sequences from yeast artificial chromosome (YAC) clones. Nucleic Acids Res. 1990;18:2887–2890. doi: 10.1093/nar/18.10.2887. [DOI] [PMC free article] [PubMed] [Google Scholar]
- 83.Badarinarayana V, et al. Selection analyses of insertional mutants using subgenic-resolution arrays. Nature Biotechnol. 2001;19:1060–1065. doi: 10.1038/nbt1101-1060. [DOI] [PubMed] [Google Scholar]
- 84.Kumar A, et al. Large-scale mutagenesis of the yeast genome using a Tn7-derived multipurpose transposon. Genome Res. 2004;14:1975–1986. doi: 10.1101/gr.2875304. [DOI] [PMC free article] [PubMed] [Google Scholar]
- 85.Smith V, Chou KN, Lashkari D, Botstein D, Brown PO. Functional analysis of the genes of yeast chromosome V by genetic footprinting. Science. 1996;274:2069–2074. doi: 10.1126/science.274.5295.2069. [DOI] [PubMed] [Google Scholar]
- 86.Amsterdam A, Hopkins N. Retroviral-mediated insertional mutagenesis in zebrafish. Methods Cell Biol. 2004;77:3–20. doi: 10.1016/S0091-679X(04)77001-6. [DOI] [PubMed] [Google Scholar]
- 87.Dupuy AJ, Akagi K, Largaespada DA, Copeland NG, Jenkins NA. Mammalian mutagenesis using a highly mobile somatic Sleeping Beauty transposon system. Nature. 2005;436:221–226. doi: 10.1038/nature03691. [DOI] [PubMed] [Google Scholar]
- 88.Girgis HS, Liu Y, Ryu WS, Tavazoie S. A comprehensive genetic characterization of bacterial motility. PLoS Genet. 2007;3:1644–1660. doi: 10.1371/journal.pgen.0030154. [DOI] [PMC free article] [PubMed] [Google Scholar]
- 89.Salama NR, Shepherd B, Falkow S. Global transposon mutagenesis and essential gene analysis of Helicobacter pylori. J. Bacteriol. 2004;186:7926–7935. doi: 10.1128/JB.186.23.7926-7935.2004. [DOI] [PMC free article] [PubMed] [Google Scholar]
- 90.Johnson DS, Mortazavi A, Myers RM, Wold B. Genome-wide mapping of in vivo protein–DNA interactions. Science. 2007;316:1497–1502. doi: 10.1126/science.1141319. [DOI] [PubMed] [Google Scholar]
- 91.Robertson G, et al. Genome-wide profiles of STAT1 DNA association using chromatin immunoprecipitation and massively parallel sequencing. Nature Methods. 2007;4:651–657. doi: 10.1038/nmeth1068. [DOI] [PubMed] [Google Scholar]
- 92.Patterson TA, et al. Performance comparison of one-color and two-color platforms within the MicroArray Quality Control (MAQC) project. Nature Biotechnol. 2006;24:1140–1150. doi: 10.1038/nbt1242. [DOI] [PubMed] [Google Scholar]
- 93.Song JS, et al. Microarray blob-defect removal improves array analysis. Bioinformatics. 2007;23:966–971. doi: 10.1093/bioinformatics/btm043. [DOI] [PubMed] [Google Scholar]
- 94.Bolstad BM, Irizarry RA, Astrand M, Speed TP. A comparison of normalization methods for high density oligonucleotide array data based on variance and bias. Bioinformatics. 2003;19:185–193. doi: 10.1093/bioinformatics/19.2.185. [DOI] [PubMed] [Google Scholar]
- 95.Rosenzweig BA, et al. Dye bias correction in dual-labeled cDNA microarray gene expression measurements. Environ. Health Perspect. 2004;112:480–487. doi: 10.1289/ehp.6694. [DOI] [PMC free article] [PubMed] [Google Scholar]
- 96.Kelley R, Feizi H, Ideker T. Correcting for gene-specific dye bias in DNA microarrays using the method of maximum likelihood. Bioinformatics. 2008;24:71–77. doi: 10.1093/bioinformatics/btm347. [DOI] [PMC free article] [PubMed] [Google Scholar]
- 97.Torres EM, et al. Effects of aneuploidy on cellular physiology and cell division in haploid yeast. Science. 2007;317:916–924. doi: 10.1126/science.1142210. [DOI] [PubMed] [Google Scholar]
- 98.Omura F, Hatanaka H, Nakao Y. Characterization of a novel tyrosine permease of lager brewing yeast shared by Saccharomyces cerevisiae strain RM11–11a. FEMS Yeast Res. 2007;7:1350–1361. doi: 10.1111/j.1567-1364.2007.00310.x. [DOI] [PubMed] [Google Scholar]
- 99.Wang D, et al. Viral discovery and sequence recovery using DNA microarrays. PLoS Biol. 2003;1:e2. doi: 10.1371/journal.pbio.0000002. [DOI] [PMC free article] [PubMed] [Google Scholar]
- 100.Hodges E, et al. Genome-wide in situ exon capture for selective resequencing. Nature Genet. 2007;39:1522–1527. doi: 10.1038/ng.2007.42. [DOI] [PubMed] [Google Scholar]
- 101.Okou DT, et al. Microarray-based genomic selection for high-throughput resequencing. Nature Methods. 2007;4:907–909. doi: 10.1038/nmeth1109. [DOI] [PubMed] [Google Scholar]
- 102.Albert TJ, et al. Direct selection of human genomic loci by microarray hybridization. Nature Methods. 2007;4:903–905. doi: 10.1038/nmeth1111. [DOI] [PubMed] [Google Scholar]
- 103.Palmer C, Bik EM, Digiulio DB, Relman DA, Brown PO. Development of the human infant intestinal microbiota. PLoS Biol. 2007;5:e177. doi: 10.1371/journal.pbio.0050177. [DOI] [PMC free article] [PubMed] [Google Scholar]
- 104.Gill SR, et al. Metagenomic analysis of the human distal gut microbiome. Science. 2006;312:1355–1359. doi: 10.1126/science.1124234. [DOI] [PMC free article] [PubMed] [Google Scholar]
- 105.Sjoblom T, et al. The consensus coding sequences of human breast and colorectal cancers. Science. 2006;314:268–274. doi: 10.1126/science.1133427. [DOI] [PubMed] [Google Scholar]
- 106.Wood, L. D. et al. The genomic landscapes of human breast and colorectal cancers. Science (2007). [DOI] [PubMed]
- 107.Schroder AR, et al. HIV-1 integration in the human genome favors active genes and local hotspots. Cell. 2002;110:521–529. doi: 10.1016/S0092-8674(02)00864-4. [DOI] [PubMed] [Google Scholar]
- 108.Hoheisel JD. Microarray technology: beyond transcript profiling and genotype analysis. Nature Rev. Genet. 2006;7:200–210. doi: 10.1038/nrg1809. [DOI] [PubMed] [Google Scholar]
- 109.Perry GH, et al. Diet and the evolution of human amylase gene copy number variation. Nature Genet. 2007;39:1256–1260. doi: 10.1038/ng2123. [DOI] [PMC free article] [PubMed] [Google Scholar]
- 110.Saldanha AJ. Java Treeview — extensible visualization of microarray data. Bioinformatics. 2004;20:3246–3248. doi: 10.1093/bioinformatics/bth349. [DOI] [PubMed] [Google Scholar]
- 111.Saeed AI, et al. TM4 microarray software suite. Methods Enzymol. 2006;411:134–193. doi: 10.1016/S0076-6879(06)11009-5. [DOI] [PubMed] [Google Scholar]
- 112.Gentleman RC, et al. Bioconductor: open software development for computational biology and bioinformatics. Genome Biol. 2004;5:R80. doi: 10.1186/gb-2004-5-10-r80. [DOI] [PMC free article] [PubMed] [Google Scholar]