

Abstract
MRI is a powerful modality to detect neuroanatomical differences that result from mutations and treatments. Knowing which genes drive these differences is important in understanding etiology, but candidate genes are often difficult to identify. We tested whether spatial gene expression data from the Allen Brain Institute can be used to inform us about genes that cause neuroanatomical differences. For many single-gene-mutation mouse models, we found that affected neuroanatomy was not strongly associated with the spatial expression of the altered gene and there are specific caveats for each model. However, among models with significant neuroanatomical differences from their wildtype controls, the mutated genes had preferential spatial expression in affected neuroanatomy. In mice exposed to environmental enrichment, candidate genes could be identified by a genome-wide search for genes with preferential spatial expression in the altered neuroanatomical regions. These candidates have functions related to learning and plasticity. We demonstrate that spatial gene expression of single-genes is a poor predictor of altered neuroanatomy, but altered neuroanatomy can identify candidate genes responsible for neuroanatomical phenotypes.
1. Introduction
Neuroanatomical studies have revealed the remarkable organization of the brain and its relationship to both normal and pathological behaviour. For example, several studies have revealed changes in the sizes of structures in the autistic (Amaral et al., 2008) and Alzheimer’s (Bobinski et al., 1999; Bottino et al., 2002; Braak et al., 1993; Jack et al., 1992; Möller et al., 2016) brain, white-matter architecture changes in humans learning to juggle (Scholz et al., 2009), and cortical changes in musicians versus nonmusicians (Gaser and Schlaug, 2003). Studies in mouse models benefit from greater control of genetic and environmental influences and have demonstrated that although neuroanatomy is, to a certain extent, linked to genes (Ellegood et al., 2015), there is also a strong influence of environmental factors as well. Environmental influences of maze training (Lerch et al., 2011b), environmental enrichment (Scholz et al., 2015), and voluntary exercise (Cahill et al., 2015) have been shown to induce MRI-detectable neuroanatomical changes specific to the type of learning.
MRI-based neuroanatomical studies probe anatomy differences at the mesoscale (1 mm in humans, 50 μm in rodents). In rodents, these phenotypes have been studied using post-mortem histology to determine their cellular underpinnings, such as changes in neuronal number (Kempermann et al., 1997) and remodelling of processes like dendritic spines (Keifer et al., 2015). However, the gene expression changes driving these phenotypes remains hidden. For example, mice housed in enriched environments undergo gene expression changes after just a few hours of exploration (Rampon et al., 2000). It is strongly suspected that these early gene expression changes drive the neuroanatomical differences seen with MRI (Scholz et al., 2015) and similar mechanisms are responsible for human learning during novel experiences. It is unknown to what extent affected neuroanatomy can inform us about the important genes involved or, conversely, be predicted from known gene mutations. If there is a relationship between affected neuroanatomy and spatial gene expression, we could use affected neuroanatomy to inform selection of candidate genes that might be associated with the neuroanatomical phenotypes.
We investigated the statistical relationship between affected neuroanatomy and spatial gene expression. Extensive neuroanatomical data has previously been collected using MRI and published in literature. In particular, Ellegood et al. (2015) published data on the neuroanatomy of several single-gene-mutation mouse models of autism. Genome-wide spatial gene expression data in the mouse brain, obtained using in situ hybridization (ISH), can be freely downloaded from the Allen Brain Institute (Lein et al., 2007). The gene expression data has already been registered to a reference Nissl stain atlas (Dong, 2008). We registered the Nissl stain atlas to the Dorr et al. (2008) MR atlas. This allows us to transform any regions of interest (ROI) in neuroanatomical phenotype data—registered to the MR atlas—to gene expression data—registered to the Allen nissl-stain atlas.
We hypothesized that regions of affected neuroanatomy have preferential spatial expression of the causative gene. We tested this hypothesis using 20 single-gene-mutation mouse models published in existing literature. Since we know which gene causes the affected neuroanatomy in each mouse model, we can test whether affected neuroanatomy has preferential spatial expression of the altered gene in wildtype. We found that there is an association between the spatial expression of the mutated gene and affected neuroanatomy for 65% of the 20 mouse models analyzed. This relationship is stronger in models where both gene expression is high and affected neuroanatomy is statistically significant. Furthermore, we also found that neuroanatomical differences—that result from exposure to environmental enrichment—have preferential expression of several genes involved with learning and plasticity.
2. Methods
2.1. Registration of Nissl and MR atlases
The first step to relate the Allen Gene Expression data to MRI neuroanatomy data is to register the Allen Reference Atlas (Dong, 2008) and the MRI reference atlas (Dorr et al., 2008). Gene expression data is resampled to an isotropic resolution of 200 μm and registered to the nissl-stained coronal cross-sections that define the Allen Reference Atlas. Due to the differences in intensity and intensity profiles of neuroanatomical structures in MRI and nissl-stain atlases, a registration using cross-correlation and mutual information would be unsuccessful. Instead, we first created pseudo-atlases by identifying common labels in both atlases and giving them the same intensity values (Details in Supplementary 8.3). The two pseudo-atlasses were non-linearly registered using the mni_autoreg tools (Collins et al., 1994, 1995). This created a transform that allowed us to map MRI phenotype data to the Allen Brain Reference Atlas and the results are shown in Fig. 1. We assessed registration accuracy using the Kappa metric (Chakravarty et al., 2008) and found all the pseudo-atlas structures registered well (Details in Supplementary 8.3).
Fig. 1.

The MRI reference atlas was registered to the Allen Reference Atlas. The grid lines show the volumetric changes cause by the non-linear registration and are spaced 500 μm apart in the MRI Reference Space. Registration was sufficiently accurate to study Allen gene expression data, which has an isotropic resolution of 200 μm.
2.2. Sample preparation and statistics
The spatial gene expression data generated by the Allen Brain Institute were collected from 8-week-old C57BL/6J mice (Lein et al., 2007). Neuroanatomy data were collected from mice perfused as adults and most control mice were part of a background C57BL/6J strain or a C57BL/6J-129 cross (details listed in Supplementary Table S1).
The neuroanatomical phenotyping data analyzed in this paper used a consistent protocol for brain specimen preparation (Cahill et al., 2012), image acquisition (Nieman et al., 2005), and analysis (Lerch et al., 2011b). Brains were imaged using a 7-Tesla MRI scanner previously described in literature (Nieman et al., 2005, 2006). The majority of mouse models were investigated using a custom 16-coil solenoid array built for acquiring anatomical images in parallel of 16 samples in one overnight session at 3D isotropic resolution of 56 μm (Lerch et al., 2011a). Some of the models were imaged using a 32 μm resolution sequence (scanning 3 samples in parallel) and these images were resampled to 56 μm prior to registration. Details regarding strain and age can be found in Supplementary 8.1. Since only male mice have gene expression data from the Allen Brain Institute, we excluded female mice from the neuroanatomy analysis. The only exception was the Nf1(+/) mouse model where male and female data were pooled togetherþto achieve a sufficient sample size.
To identify regions with altered neuroanatomy, deformation-based morphometry was used. This technique has been described in several publications (Lerch et al., 2011b; Ellegood et al., 2013; Scholz et al., 2015; Cahill et al., 2015) and utilizes the mni_autoreg tools (Collins et al., 1994, 1995) and ANTS (Avants et al., 2010). Briefly, for each mouse model, the MRI images of the mutated mice and wildtype controls were registered together and resulting transforms were used to resample the images to a consensus average. The logarithmic jacobian determinants of the inverse transformations were then computed for statistical analysis. If a neuroanatomical region in a given subject was larger than the population mean, the log determinant in the region is positive and a negative log determinant implies the region was smaller than the population mean.
The registration was blind to details regarding treatment or genotype of the mice. Using the RMINC package (https://github.com/Mouse-Imaging-Centre/RMINC) in the R environment (R Core Team, 2016), the effects of genotype or treatment were determined by using either a Cohen’s d measure (Equation (1)) (Zakzanis, 2001) or linear model at each voxel (depending on the statistic chosen by the original studies). The result was a map of statistical significance that could then be overlaid onto the average to highlight regions with neuroanatomical volume differences. Additionally, Supplementary Table S2 details several R packages used in our analysis.
| (1) |
where ni, μi, are the number; mean; variance of values in sample i and i = 0 corresponds to the reference control sample
2.3. Preferential gene expression
To facilitate comparison across studies, we measured effect sizes using the Cohen’s d statistic (Zakzanis, 2001) (Equation (1)) as it is independent of sample size. We studied neuroanatomical changes in the 1000 voxels (~2% of the total brain) with the highest absolute Cohen’s d values. This was done to ensure a constant ROI volume for all the MRI-based neuroanatomical datasets analyzed. We varied the threshold to included the top 500 and the top 1500 voxels to ensure results were not dependent on the threshold used. Gene spatial expressions were downloaded from the Allen Brain Institute in raw format. We chose to work in ABI’s units of gene expression energy; which is the intensity of the ISH image integrated over an isotropic 200 μm voxel. Preferential spatial expression is quantified by a fold-change measure—mean gene expression energy in the ROI divided by the mean gene expression energy in the brain. A fold change above 1 indicates the gene is preferentially expressed in the ROI. The functions we used to read and analyze Allen Brain Institute gene expression data with MRI neuroanatomical phenotype have been made available online (https://github.com/DJFernandes/ABIgeneRMINC/).
We estimated strength of association between gene expression and neuroanatomy in three ways. First was a measure of voxel-wise significance by performing 1000 iterations of permutation testing. In each permutation, the genotype-wildtype labels were shuffled; then the neuroanatomical statistics and fold change recomputed. The ROI when computing the fold-change in each permutation still consisted of the top 1000 voxels with the highest absolute Cohen’s d values. The estimated p-value for preferential spatial expression is the fraction of permutations with higher fold-change values. Second was a measure of structure-wise significance. For each of the 649 annotated structures in the Allen Brain Atlas, we computed the Cohen’s d effect size of volume differences and mean gene expression energy, and tested their association using a linear model. An advantage of this measure was that we could visually observe different behaviours of regions with volume increases and decreases.
Third measure of association was based on volume overlap between regions with high gene expression and altered neuroanatomy. All brain voxels were classified as either altered or unaltered neuroanatomy—1000 voxels with highest absolute Cohen’s d were classified as altered with the remaining classified as unaltered. All brain voxels were also classified as either expressing or not expressing the gene—voxels with gene expression above the mean expression in the brain were classified as expressing. Based on these two classifications, we calculated four quantities: Positive Predictive Value (PPV) is the fraction of altered neuroanatomy with gene expression, True Positive Rate (TPR) is the fraction of expressing voxels with altered neuroanatomy, False Positive Rate (FPR) is the fraction of non-expressing voxels with altered neuroanatomy, False Ommision Rate (FOR) is the fraction of unaltered neuroanatomy with gene expression. To ensure observations regarding these quantities were not due to the thresholds set for classification, we selected two sets of thresholds; both using the standard optimization procedure of maximizing Youden’s Index (J) (Le, 2006; Youden, 1950). One set of thresholds maximize J = TPR–FPR and TPR calculated at these threshold is the Optimized-TPR. This represents the ‘best-case’ probability for predicting altered neuroanatomy from high gene expression. Similarly, the other set of thresholds maximize J = PPV–FOR, and the PPV calculated at these threshold is the Optimized-PPV; representing the ‘best-case’ probability of predicting high gene expression from altered neuroanatomy.
3. Results
3.1. Neuroanatomical differences reflects some gene expression changes
Our goal was to use preferential expression as an omnibus statistic to investigate the relationship between gene expression and neuroanatomy. We analyzed 20 single-gene-mutant mouse models in this study and tested whether the spatial expression of the mutated gene could predict affected neuroanatomy. Fig. 2 and Table 1 show that 65% of these models had preferential expression of the mutated gene in regions with high effect sizes. However, Fig. 2 also indicates how preferential expression was influenced by the gene expression energy and statistical significance of affected neuroanatomy. Points in the upper left quadrant of Fig. 2 represent models with statistically significant neuroanatomy (<10% FDR) and high gene expression (energy>10). 8/9 of these models showed preferential expression of the altered gene. Gtf2i Dp is the one model in this quadrant which doesn’t show preferential expression. However, this might just be an effect of the consistent thresholds used for all the models. With optimized thresholds, >80% significant neuroanatomy has an overlap with Gtf2i gene-expressing regions. It is worth noting that gene expression data was collected from C57BL/6J mice but not all the neuroanatomy data was collected from mouse models with C57BL/6J background strain. However, we did not find any relationship between gene preferential expression and the background strain of the mouse model.
Fig. 2.

Preferential spatial expression of mutated genes in affected neuroanatomy of single-gene mutant mouse models. Each point represents a different mouse model. Circular points indicates whether gene is preferentially expressed in altered neuroanatomy (1000 voxels with highest magnitude effect sizes) and triangular points indicate lack of preferential expression. Point colour indicates the probability altered neuroanatomy predicts high gene expression at optimal thresholds (Optimized PPV). Red/Blue colours indicate PPV values over/under arbitrarily selected 0.5. The minimum FDR is plotted on the x-axis; the more significant the altered neuroanatomy, the lower the minimum FDR. Vertical dashed line indicates 10% FDR threshold for significant effects. The maximum gene expression energy is plotted on the y-axis; the greater the ISH signal, the higher the maximum gene expression energy. Horizontal dashed line indicates arbitrary threshold for low gene expression energy. 65% of mouse models have preferential spatial expression of the mutated gene. Furthermore, preferential expression is found in 8 of 9 mouse models with significantly altered neuroanatomy and high gene expression energy.
Table 1.
Results from analysis of 20 mouse models. Minimum False Discovery Rate (FDR) is an estimate of the significance of neuroanatomical differences (lower value implies greater significance). Maximum gene expression energy estimates the ISH signal (higher energy implies greater gene expression). Preferential expression is the mean gene expression energy in the ROI (defined by the top 1000 voxels with highest Cohen’s |d|) divided by the mean gene expression energy in the brain. Positive Predictive Value (PPV) measures what fraction of the ROI has gene expression energy higher than the average expression energy in the brain and is a measure of how predictive significant neuroanatomical differences are of high gene expression energy. PPV is dependent on thresholds used to select significant neuroanatomy and high gene expression. Optimized PPV is the PPV after setting the thresholds to maximize PPV FOR (False Omission Rate). True Positive Rate (TPR) is the fraction of high gene expression voxels with significant neuroanatomical differences, and Optimized TPR is the TPR at thresholds where TPR FPR (False Positive Rate) is maximized.
| Mouse Models | Minimum FDR | Maximum Gene Expression Energy | Preferential Expression | PPV | Optimized PPV | Optimized TPR |
|---|---|---|---|---|---|---|
| Ar 12Q (Albertelli et al., 2008) | 0.7% | 19.2 | 1.08 | 34.3% | 78.0% | 21.2% |
| Ar 21Q (Albertelli et al., 2008) | 7.9% | 19.2 | 1.34 | 41.3% | 68.4% | 70.0% |
| Ar 48Q (Albertelli et al., 2008) | 4.0% | 19.2 | 1.08 | 29.3% | 61.0% | 15.9% |
| Cntnap2 KO (Penagarikaño et al., 2011) | 41.4% | 48.7 | 1.02 | 48.4% | 30.6% | 56.3% |
| En2 KO (Brielmaier et al., 2012) | <0.001% | 18.9 | 5.01 | 93.3% | 95.9% | 55.3% |
| Fmr1 KO (Ellegood et al., 2010) | 54.1% | 17.8 | 0.75 | 22.8% | 89.9% | 70.8% |
| Gtf2i Dp (Mervis et al., 2012) | 2.4% | 19.9 | 0.93 | 34.8% | 82.0% | 70.8% |
| Gtf2i GT (Mervis et al., 2012) | 57.7% | 19.9 | 1.16 | 57.8% | 62.5% | 57.2% |
| Itgb3 KO (Ellegood et al., 2012) | <0.001% | 4.7 | 0.55 | 14.5% | 89.8% | 96.9% |
| Itsn1 GT (Sengar et al., 2013) | <0.001% | 22.0 | 1.02 | 45.9% | 54.0% | 57.0% |
| Itsn1 KO (Sengar et al., 2013) | 32.5% | 10.1 | 1.07 | 34.9% | 65.0% | 58.8% |
| Mecp2-308 (Moretti et al., 2005, 2006) | 0.1% | 6.6 | 0.62 | 13.3% | 23.0% | 34.6% |
| Nf1 KO (Rosenbaum et al., 1999; Silva et al., 1997) | 19.7% | 17.8 | 1.18 | 41.8% | 37.8% | 81.2% |
| Ngn3 KI (Ellegood et al., 2011) | 0.5% | 66.7 | 1.33 | 64.4% | 84.1% | 80.0% |
| Nrxn1a Het (Etherton et al., 2009) | 3.0% | 53.9 | 1.01 | 51.8% | 35.0% | 71.0% |
| Nrxn1a KO (Etherton et al., 2009) | 0.4% | 53.9 | 1.05 | 53.4% | 84.1% | 50.6% |
| Slc6a4 KI (Kerr et al., 2013; Veenstra-VanderWeele et al., 2012) | >99.9% | 43.9 | 0.57 | 6.7% | 70.0% | 52.9% |
| Slc6a4 K0 (Kerr et al., 2013; Veenstra-VanderWeele et al., 2012) | 99.9% | 43.9 | 0.49 | 5.1% | 95.3% | 33.6% |
| Shank3 Het (Jaramillo et al., 2015) | 31.9% | 38.1 | 0.93 | 38.1% | 48.2% | 75.2% |
| Shank3 Hom (Jaramillo et al., 2015) | 14.4% | 38.1 | 0.93 | 36.0% | 75.2% | 62.3% |
Many of the remaining mouse models (7/11) did not show preferential expression. Mouse models located in the Fig. 2 upper-right quadrant—such as Fmr1 KO, Slc6a4 KI, Slc6a4 KO, Shank3 Het, and Shank3 KO—have neuroanatomical effect sizes with low significance (>10% FDR). Thus, the lack of preferential expression in these mouse models may be driven by noise in neuroanatomy data. Conversely, Itgβ3 KO and Mecp2-308 mouse models (Fig. 2 lower-left quadrant) have significant neuroanatomical effect sizes, but Itgbβ3 and Mecp2 have low gene expression signal (energy<10) in the brain, therefore these results could be susceptible to noise from ISH.
Despite most models showing preferential expression of the altered gene in neuroanatomical differences, moderate PPV (Table 1) indicates, on average, only 38% of regions with significant neuroanatomy have high gene expression. For many models, this can be improved upon by optimizing thresholds (median +27%). We also found that Optimized-PPV is generally higher than Optimized-TPR (median +6%)—implying that significant neuroanatomy predicts high gene expression better than high gene expression predicts significant neuroanatomy. To understand the properties of the preferential expression statistic better, we studied each mouse model in more detail. Presented below are mouse models with mutations in En2, Nrxn1, and Itsn1 genes—with the remaining models detailed in Supplementary 8.5.
3.2. Engrailed2
MRI neuroanatomical phenotyping on 11 Homeobox Transcription Factor Engrailed2 knockout (En2 KO) mice (Brielmaier et al., 2012; Genestine et al., 2015) and 9 wildtypes revealed large volume reductions in the cerebellum (Ellegood et al., 2013) as seen in Fig. 3A. Fig. 3B shows the gene expression of En2 downloaded from the Allen Brain institute (Experiment ID: 74988733), which is preferentially expressed in the cerebellum. Thus, neuroanatomical changes have a high preferential expression of En2. The mean expression energy of En2 in the brain is 0.3 and the mean expression in the ROI is 1.60 resulting in a foldchange of 5.01. Permutation testing showed high significance (p-value<0.001) and PPV showed >90% of regions with significant neuroanatomy have high gene expression. To check the dependence on statistic and threshold, we varied the threshold across a large range, and also performed the analysis using FDR instead of Cohen’s d. Supplementary Fig. S4 shows the choice of statistic did not make a difference and the more stringent the threshold criteria, the greater the preferential spatial expression measured. It is also worth noting that the more stringent the criteria, the smaller the ROI and the more variable the preferential spatial expression calculated.
Fig. 3.

A Altered neuroanatomy in En2 KO mice (n = 11) compared to wildtype controls (n = 9), highlighting the top 1000 voxels with the largest Cohen’s |d|. Negative (blue) voxels indicate regions have smaller volumes than controls. B En2 gene expression from the Allen Brain Atlas, with the mean gene expression energy as the threshold. The altered neuroanatomy has a preferential spatial expression of the En2 gene.
3.3. Neurexin1
Gene expression of Neurexin1 (Nrxn1) in the brain downloaded from the Allen Brain Institute is shown in Fig. 4C. There are two experiments conducted by the Allen Brain Institute looking at Nrxn1 gene expression in the whole mouse brain: Experiment ID 70301083 and 75988632. Since Experiment ID 70301083 was missing data in only 3.2% of the brain (by volume) compared to 10.4% in Experiment ID 75988632, we chose to examine Experiment ID 70301083 for our analysis (see Supplementary Fig. S5).
Fig. 4.

Neuroanatomical changes in mice with A one functioning copy of Nrxn1α (Het; n = 13) and B no functioning copies (KO; n = 9) compared to wildtype controls (n = 10). Neuroanatomical images are thresholded to include top 1000 voxels with highest Cohen’s |d| in Het. Gene expression of C Nrxn1 (Experiment ID: 70301083) and D Nlgn3 (Experiment ID: 70300559), thresholded to their mean expression in the brain. E Sensitivity of structure volume to Nrxn1α dosage versus Nrxn1 expression. Horizontal line is the average expression energy in structures. Regions with high gene expression are more likely to be bigger in mice with less Nrxn1α, as shown by the red line (p-value<8e-4). For example, PVT (E inset) has high Nrxn1 gene expression (mean energy 17.6) and is sensitive to Nrxn1α dosage (t-stat: −4.64). E Structures with high Nlgn3 expression also show similar, but weaker, dosage dependence (p-value = 0.095).
Fig. 4 shows the neuroanatomical changes in 13 mice with only one functioning copy of Nrxn1α (Het; Figure 4A) and 9 mice with no functioning copy of Nrxn1α (KO; Fig. 4B), compared to 10 wildtype controls (Ellegood et al., 2015). Both mutants showed growth in similar regions of the thalamus, cortex, cerebellum and pons, though the changes in the KO are more pronounced. The ROI defined by the top 1000 voxels with largest Cohen’s d magnitudes showed preferential expression for Nrxn1 with a fold change of 1.01 and 1.06 (Het and KO respectively). However, neither fold change was significant (p-values 0.45 and 0.26, Het and KO respectively), and PPV showed moderate overlap between gene expression regions and significant neuroanatomy (~50% for both models). Similar results were seen when we expanded and contracted the ROI to include the top 1500 and 500 voxels with largest Cohen’s d magnitudes, and when FDR statistic was used (summarized in Supplementary Fig. S6). We also saw that effect sizes are more pronounced in the KO than the Het and, preferential expression is higher in the KO ROI than the Het ROI. This indicates that the more significant the neuroanatomical data, the more likely there is preferential spatial expression of the altered gene.
Using the Allen Brain Institute’s structure annotations, we computed the dependence of structure volume on Nrxn1α gene dosage. For example, in Fig. 4E (inset), we computed the volumes of the Para-ventricular Nucleus of the Thalamus (PVT) and found a strong negative association with gene dosage (t-statistic:−4.64). We also computed the mean Nrxn1 expression in the PVT (mean energy: 17.6). We repeated these procedures for all the other annotated structures. In Fig. 4E, the t- statistic from the dosage-volume relationship is plotted against the mean expression energy in that structure. We saw that structures whose volumes shrink with dosage of Nrxn1α preferentially express Nrxn1 (red line:p-value<8e-4). Intriguingly, we noticed that negative dosage sensitivity (red line) has a stronger association than positive sensitivity (blue), indicating that positive and negative volume changes are influenced by different mechanisms.
We also wanted to explore whether our analysis could capture gene-network effects. NRXN1 and NLGN3 are connected across the synaptic cleft (Ichtchenko et al., 1996), and mutations in human Nrxn1, and Nlgn3 are associated with ASD (Jamain et al., 2003; Zahir et al., 2008). Since structures whose volumes shrink with Nrxn1α dosage preferentially express Nrxn1, we tested whether these structures also preferentially express Nlgn3. Fig. 4D shows spatial gene expression of Nlgn3 and we found negative dosage sensitivity is weakly associated with Nlgn3 gene expression (Fig. 4F, p-value = 0.095).
3.4. Intersectin
Mammals have two Intersectin genes: Itsn1 and Itsn2 (Sengar et al., 2013). Intersectin proteins are implicated in a variety of neuronal processes such as: endo- and exocytosis, dendritic spine maturation, neurite extension, and actin remodeling, axonal growth at the cortical midline, and spatial learning (Sengar et al., 2013). Fig. 5A illustrates the neuroanatomical differences between 7 mice homozygous for non-functional ITSN1 (Itsn1 GT) and 8 wildtype controls (Sengar et al., 2013). Large volume reductions can be seen in large white matter tracts, such as anterior commissure, the corpus callosum, and cerebral peduncle, suggesting a disorder of connectivity associated with non-functional ITSN1 (Sengar et al., 2013). Appropriately, ITSN1 mutants had impaired learning and memory (Sengar et al., 2013).
Fig. 5.
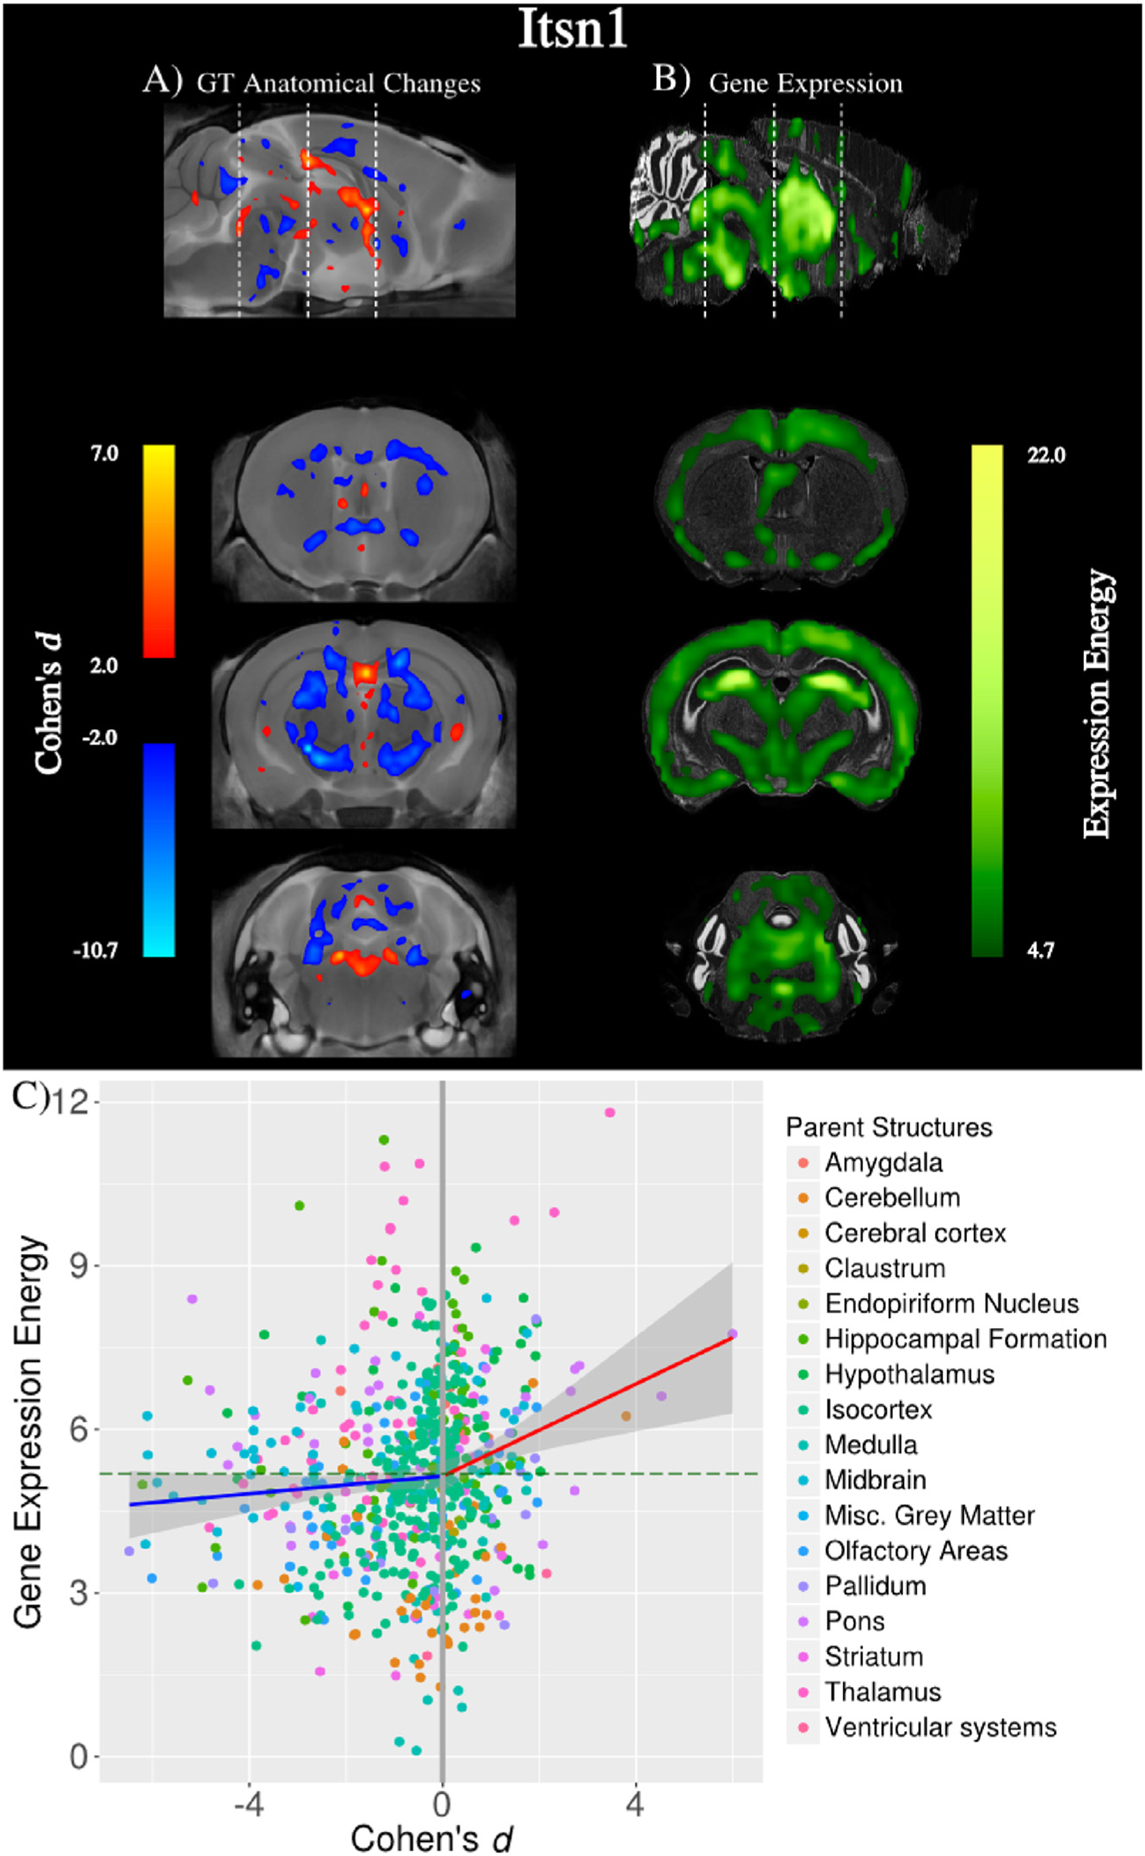
A Neuroanatomical changes in mice with a Itsn1 gene trap (Itsn1 GT) representing a complete loss-of-function mutant (n = 7) compared to wildtype controls (n = 8). B Gene expression of Itsn1 downloaded from the Allen Brain Institute (Experiment ID: 1365). There are large volume decreases in white matter, which do not have high gene expression. C Plotting the effect size of structure volumes against gene expression reveals volume increases are associated with gene expression (red line; p-value<0.002) but not volume decreases (blue line).
Fig. 5B also shows the expression of the Itsn1 gene downloaded from the Allen Brain Institute (Experiment ID: 1365). It is apparent that there is little preferential expression of Itsn1 in the neuroanatomical volume differences. Gene expression in the ROI defined by the top 1000 voxels with the highest Cohen’s |d| is 1.02 times greater than the mean expression in the brain. Reducing and expanding the ROI by 500 voxels yielded similar results.
We noticed that the low preferential expression is due to volume reductions in large white matter tracts, which don’t have high Itsn1 gene expression energy. However, we also noticed that neuroanatomical regions that are larger in Itsn1 GT do have preferential expression of Itsn1. To test this, we computed the anatomical volume of the 649 structures annotated in the Allen Brain Atlas and, then computed the Cohen’s |d| for each structure. In Fig. 5C, we plotted the structure’s d value against the mean Itsn1 gene expression energy in that structure, and found a difference in behaviour of positive and negative volume changes in Itsn1 GT mice. Structures with volume reductions do not have preferential expression of Itsn1, but structures with volume increases do have preferential expression of Itsn1 (p-value<0.002). We suspect then that positive and negative volume changes in mouse brains with non-functioning ITSN1 have different biological determinants. A possible explanation is that volume expansions are due to the localized disruption of ITSN1 protein function, whereas the volume contractions are due to improper connectivity and independent of local ITSN1 protein function.
Itsn2 gene had stronger preferential expression in the altered neuroanatomic of Itsn2 KO mice (see Supplementary Fig. S7). However, neuroanatomical differences in Itsn2 KO were much less than Itsn1 GT, and the max gene expression energy of Itsn2 (from Allen Experiment ID: 69873714) was much less than Itsn1 (22.0 vs 10.1). Thus, we are not as confident about the significant trends as they might be driven by variable probe affinity and noisy neuroanatomical data.
3.5. Genome-wide gene preferential spatial expression reveals important ontology
For 13 of the 20 single-gene-mutant mouse models analyzed, there was preferential expression of the causative gene in regions with affected neuroanatomy. There is, however, extensive neuroanatomical phenotype data for mouse models where the causative genes are unknown. In such models, we investigated whether candidate genes associated with the neuroanatomical phenotypes could be identified on the basis of high preferential expression in affected neuroanatomy. We applied this methodology to data from mice exposed to environmental enrichment and assessed what the candidate genes identified tell us about the biological processes involved.
We downloaded all the gene expression data available from the Allen Brain Institute as of Feb 23, 2015. We also obtained published data on neuroanatomical volume differences between 14 C57BL/6J mice raised in enriched environments and 14 C57BL/6J mice raised in standard laboratory housing (Scholz et al., 2015). Mice in enriched environments have larger regions in the hippocampus, motor cortex, and cerebellum; as illustrated in Fig. 6A. We thresholded this map to an absolute t-statistic value of 2, then computed the preferential expression for every ISH experiment in the Allen Brain Institute. Since most gene expression data only spans one hemisphere (for example: Nlgn3 Expression shown in Fig. 4D), we filled in the opposite hemisphere by reflecting the expression data across the sagittal midplane. Although gene expression in the mouse brain is not entirely symmetric, we think it is a suitable approximation given that we are conducting an exploratory analysis. Additionally, we also ignored 187 ISH experiments which contained data in less than 50% of the brain after sagittal reflection. The candidate list of genes are those with the highest preferential expression.
Fig. 6.

A Mice raised in enriched environments (n = 14) have larger regions in the hippocampus, motor cortex, and cerebellum compared to mice raised in normal lab cages (n = 14). We found many genes that are preferentially expressed in these regions and a GO enrichment analysis revealed genes are associated with learning. For example: B Nrp1 (fold change 1.36) is highly expressed in the hippocampus and is associated with axon guidance, C Bdnf (fold change 1.22) is expressed throughout the cerebral cortex and is associated with memory, and D Pcp2 (fold change 1.14) is highly expressed in the cerebellum and is associated with cerebellar plasticity.
We noticed that several genes associated with learning are preferentially expressed in the ROI, for example: Nrp1 (Fig. 6B) is associated with axon guidance (Suto et al., 2005), Bdnf (Fig. 6C) is associated with memory (Monteggia et al., 2004), and Pcp2 (Fig. 6D) is associated with cerebellar plasticity (Kloth et al., 2015). A full list of candidate genes can be found in Appendix Table 1. To assess what the identified genes do, we conducted a Gene Ontology (GO) enrichment analysis (Carlson, 2016b,a) of the top 1000 genes with the highest preferential expression (background gene set being all the genes in the Allen Brain Atlas). It revealed an enrichment of GO terms related to axon and dendritic processes, ion channel activity, neuron differentiation, and many other processes (Appendix Table 2) important for learning and plasticity. Thus, the candidate genes identified likely reflect underlying genetic influences as they are both spatially associated with neuroanatomical differences and functionally associated with known behavioural phenotypes.
4. Discussion
Extensive literature has shown how mutations in the mouse genome or treatments, such as environmental enrichment and exercise, cause MRI-detectable volume differences in regions of the brain. Our goal was to identify a candidate list of genes that would allow us to make inferences about the genes, pathways, and processes that drive these neuroanatomical differences. We hypothesized that altered neuroanatomy tends to have preferential spatial expression of the causative genes. If the hypothesis is true, then we can identify candidate genes by performing a genome-wide search for genes with preferential spatial expression in altered neuroanatomy.
Preferential expression is quantified by fold-change, which measures a gene’s expression in a region relative to its mean expression in the brain. A direct consequence and shortcoming of this property is that a fold-change measure would not show preferential expression of genes with ubiquitous expression in the brain—so called ‘housekeeping’ genes as they are required for the basal function of nearly all cells. However, normalizing to the mean expression is important to allow comparisons across genes as gene experiments could be influenced by independent factors such as probe affinity.
To test the hypothesis, we obtained published data on MRI neuroanatomy of mouse models with single-gene changes. For 13 of the 20 mouse models, this hypothesis holds as neuroanatomical differences in these mice have preferential spatial expression of the altered gene. The lack of consistent association between known gene expression changes and structural MRI measures were also observed in mice prenatally exposed to maternal infection by Richetto et al. (2016). In these mice, several genes associated with myelination were differentially expressed in medial prefrontal cortex and nucleus accumbens, and this agrees with immunohistochemistry analysis. However, there was no consistent association between gene differential expression and tissue properties measured with MRI, such as volume, relaxation times, and molecular water fraction. Due to the poor accuracy of our hypothesis, it is important to consider several aspects of the data before attempting to use preferntial expression as a means to identify genetic determinants of neuroanatomical phenotype.
Two factors that are particularly important are the statistical significance of neuroanatomy data and strength of gene expression signal. In mouse models where the hypothesis does not hold, neuroanatomical differences have little significance or the ISH gene expression signal is low. This points to two key shortcomings of existing data. Firstly, deformation-based morphometry may not be sensitive enough to capture subtle differences in neuroanatomy (van Eede et al., 2013). Secondly, while extensive quality control steps were taken by the Allen Brain Institute for their ISH gene expression studies, there are often several regions of the brain missing gene expression data. Gene expression data for most genes are typically only measured in one mouse. In the small subset of genes where two or more replicates exist (~4000 gene), correlation between replicates can be poor (Bohland et al., 2010). Furthermore, gene expression energy may not be appropriate measure of gene expression. For example, Mecp2 expression energy is among the lowest of the genes we analyzed. However, Mecp2 has a high abundance in neurons—expressed to near histone-octamer levels (Skene et al., 2010). This discrepancy might be due to the affinity of the probe used to the mRNA transcript. In our analysis, the inherent variability of ISH probe affinity and gene expression were somewhat mitigated by normalizing expression energy to the mean expression in the brain. However, these factors may still influence the preferential expression fold-change we measured. 8 of the 9 models with high gene expression and significant neuroanatomy had significant preferential expression of the altered gene. It is also worth noting that although we did not observe an association between a mouse model’s background strain and preferential spatial expression, differences in strain may play a role in the association of the mutated gene’s spatial expression and altered neuroanatomy.
By estimating p-values from permutations, we found only mouse models with mutations in En2, Nlgn3, and Ar have significant preferential expression. Low significance values could be due to altered neuroanatomy being influenced by factors other than local gene expression—such as gene expression in connecting structures, gene expression during development, and processes involved in compensatory mechanisms. In some cases, such as Cntnap2 mutations in humans, spatial gene expression could be related to the functional connectivity of a region (Scott-Van Zeeland et al., 2010), perhaps without grossly affecting neuroanatomy. In mouse models where preferential expression is not significant, we performed a structure-wise analysis and found that there is a significant association between structure volume differences and gene expression. Associations usually exists in one direction—ie. regions that are larger in mutants have preferential expression of the altered gene but not regions that are smaller (ex. Itsn1), or vise versa (ex. Nrxn1α). This indicates that positive and negative volume differences are influenced by different mechanisms.
We also observed that significant neuroanatomy predicts regions with high gene expression better that high gene expression predicts significant neuroanatomy. Even at optimum thresholds, there are regions with high gene expression where neuroanatomical differences are not prevalent. Though not explored in our analysis, this might help identify brain regions where the effects of the mutated gene are compensated by other genes. We instead focused on the more robust relationship of significant neuroanatomy predicting high gene expression. We could extend this relationship beyond the single-gene-mutations mouse models and study general mouse models where the genetic mechanisms are unknown.
By performing a genome-wide search to find which genes have preferential spatial expression in altered neuroanatomy, we can identify candidate genes that are associated with neuroanatomical differences. This is especially useful in mouse experiments where genetic mechanisms underlying the response to treatment are not well understood. A candidate list of genes can help formulate new hypothesis and further analysis. To illustrate, we obtained published data on neuroanatomical differences in mice raised in enriched environments compared to those raised in standard lab cages. We then found all genes in the Allen Brain Atlas that have a preferential expression in regions with neuroanatomical differences. Gene Ontology Enrichment analysis revealed the top 1000 genes with the greatest preferential expression are significantly involved with biological processes underlying learning and plasticity. Thus, the candidate list of genes reflect both the known behavioural and neuroanatomical differences in mice exposed to environmental enrichment.
5. Conclusion
By registering the MRI mouse brain atlas and Allen Nissl Reference Atlas, we were able to find genes preferentially expressed in neuroanatomical regions of interest. Affected neuroanatomy in mouse models with single-gene mutations are weakly biased towards regions where the mutated gene is expressed. This association is more pronounced when gene expression is high and neuroanatomical differences are significant. Looking at mouse models individually, we found that volume increases and decreases have different associations with gene expression—thereby suggesting different biological processes underlying these phenotypes. Given volume differences of regions in the mouse brain after treatments like environmental enrichment, we could determine a candidate list of genes that could be associated with these neuroanatomical changes and are consistent with known molecular and behavioural phenotypes. Thus, this work can help identify potential genes that underlie neuroanatomical changes due to treatment and genotype effects.
Supplementary Material
Acknowledgments
DJF was supported by an Ontario Graduate Scholarship and a Doctoral Postgraduate Scholarship from the Natural Sciences and Engineering Research Council of Canada. Funding from Ontario Brain Institute and Canadian Institutes of Health Research was used in generating the neuroanatomical data. The authors wish to thank Dr. Dan H. Geschwind for providing Cntnap2 KO mice.
Competing interests
J.V-VW. receives research funding from Seaside Therapeutics, Novartis, Roche Pharmaceuticals, Forest, Sunovion, and SynapDx and sits on the advisory board for Novartis and Roche Pharmaceuticals. The remaining authors declare no conflicts of interest.
Footnotes
Appendix A. Supplementary data
Supplementary data related to this article can be found at https://doi.org/10.1016/j.neuroimage.2017.08.065.
References
- Albertelli MA, O’Mahony OA, Brogley M, Tosoian J, Steinkamp M, Daignault S, Wojno K, Robins DM, 2008. Glutamine tract length of human androgen receptors affects hormone-dependent and-independent prostate cancer in mice. Hum. Mol. Genet 17, 98–110. [DOI] [PubMed] [Google Scholar]
- Amaral DG, Schumann CM, Nordahl CW, 2008. Neuroanatomy of autism. Trends Neurosci. 31, 137–145. [DOI] [PubMed] [Google Scholar]
- Avants BB, Yushkevich P, Pluta J, Minkoff D, Korczykowski M, Detre J, Gee JC, 2010. The optimal template effect in hippocampus studies of diseased populations. Neuroimage 49, 2457–2466. [DOI] [PMC free article] [PubMed] [Google Scholar]
- Bobinski M, de Leon MJ, Convit A, Santi SD, Wegiel J, Tarshish CY, Saint Louis L, Wisniewski HM, 1999. Mri of entorhinal cortex in mild alzheimer’s disease. Lancet 353, 38–40. [DOI] [PubMed] [Google Scholar]
- Bohland JW, Bokil H, Pathak SD, Lee CK, Ng L, Lau C, Kuan C, Hawrylycz M, Mitra PP, 2010. Clustering of spatial gene expression patterns in the mouse brain and comparison with classical neuroanatomy. Methods 50, 105–112. [DOI] [PubMed] [Google Scholar]
- Bottino CM, Castro CC, Gomes RL, Buchpiguel CA, Marchetti RL, Neto MRL, 2002. Volumetric mri measurements can differentiate alzheimer’s disease, mild cognitive impairment, and normal aging. Int. Psychogeriat 14, 59–72. [DOI] [PubMed] [Google Scholar]
- Braak H, Braak E, Bohl J, 1993. Staging of alzheimer-related cortical destruction. Eur. Neurol 33, 403–408. [DOI] [PubMed] [Google Scholar]
- Brielmaier J, Matteson PG, Silverman JL, Senerth JM, Kelly S, Genestine M, Millonig JH, DiCicco-Bloom E, Crawley JN, 2012. Autism-relevant social abnormalities and cognitive deficits in engrailed-2 knockout mice. PloS One 7, e40914. [DOI] [PMC free article] [PubMed] [Google Scholar]
- Cahill LS, Lalibert e CL, Ellegood J, Spring S, Gleave JA, van Eede MC, Lerch JP, Henkelman RM, 2012. Preparation of fixed mouse brains for mri. Neuroimage 60, 933–939. [DOI] [PubMed] [Google Scholar]
- Cahill LS, Steadman PE, Jones CE, Lalibert e CL, Dazai J, Lerch JP, Stefanovic B, Sled JG, 2015. Mri-detectable changes in mouse brain structure induced by voluntary exercise. NeuroImage 113, 175–183. [DOI] [PubMed] [Google Scholar]
- Carlson M, 2016a. GO.db: a Set of Annotation Maps Describing the Entire Gene Ontology. R package version 3.3.0
- Carlson M, 2016b. org.Mm.eg.db: Genome Wide Annotation for Mouse. R package version 3.3.0
- Chakravarty MM, Sadikot AF, Germann J, Bertrand G, Collins DL, 2008. Towards a validation of atlas warping techniques. Med. Image Anal 12, 713–726. [DOI] [PubMed] [Google Scholar]
- Collins DL, Holmes CJ, Peters TM, Evans AC, 1995. Automatic 3-d model-based neuroanatomical segmentation. Hum. Brain Mapp 3, 190–208. [Google Scholar]
- Collins DL, Neelin P, Peters TM, Evans AC, 1994. Automatic 3d intersubject registration of mr volumetric data in standardized talairach space. J. Comput. Assisted Tomogr 18, 192–205. [PubMed] [Google Scholar]
- Dong HW, 2008. The Allen Reference Atlas: a Digital Color Brain Atlas of the C57Bl/6J Male Mouse. John Wiley & Sons Inc; ). [Google Scholar]
- Dorr A, Lerch JP, Spring S, Kabani N, Henkelman RM, 2008. High resolution three-dimensional brain atlas using an average magnetic resonance image of 40 adult c57bl/6j mice. Neuroimage 42, 60–69. [DOI] [PubMed] [Google Scholar]
- van Eede MC, Scholz J, Chakravarty MM, Henkelman RM, Lerch JP, 2013. Mapping registration sensitivity in mr mouse brain images. Neuroimage 82, 226–236. [DOI] [PubMed] [Google Scholar]
- Ellegood J, Anagnostou E, Babineau B, Crawley J, Lin L, Genestine M, DiCicco-Bloom E, Lai J, Foster J, Penagarikano O, et al. , 2015. Clustering autism: using neuroanatomical differences in 26 mouse models to gain insight into the heterogeneity. Mol. Psychiatry 20, 118–125. [DOI] [PMC free article] [PubMed] [Google Scholar]
- Ellegood J, Babineau BA, Henkelman RM, Lerch JP, Crawley JN, 2013. Neuroanatomical analysis of the btbr mouse model of autism using magnetic resonance imaging and diffusion tensor imaging. Neuroimage 70, 288–300. [DOI] [PMC free article] [PubMed] [Google Scholar]
- Ellegood J, Henkelman RM, Lerch JP, 2012. Neuroanatomical assessment of the integrin β3 mouse model related to autism and the serotonin system using high resolution mri. Front. Psychiatry 3, 37. [DOI] [PMC free article] [PubMed] [Google Scholar]
- Ellegood J, Lerch JP, Henkelman RM, 2011. Brain abnormalities in a neuroligin3 r451c knockin mouse model associated with autism. Autism Res. 4, 368–376. [DOI] [PubMed] [Google Scholar]
- Ellegood J, Pacey LK, Hampson DR, Lerch JP, Henkelman RM, 2010. Anatomical phenotyping in a mouse model of fragile x syndrome with magnetic resonance imaging. Neuroimage 53, 1023–1029. [DOI] [PubMed] [Google Scholar]
- Etherton MR, Blaiss CA, Powell CM, Südhof TC, 2009. Mouse neurexin-1α deletion causes correlated electrophysiological and behavioral changes consistent with cognitive impairments. Proc. Natl. Acad. Sci 106, 17998–18003. [DOI] [PMC free article] [PubMed] [Google Scholar]
- Gaser C, Schlaug G, 2003. Brain structures differ between musicians and nonmusicians. J. Neurosci 23, 9240–9245. [DOI] [PMC free article] [PubMed] [Google Scholar]
- Genestine M, Lin L, Durens M, Yan Y, Jiang Y, Prem S, Bailoor K, Kelly B, Sonsalla PK, Matteson PG, et al. , 2015. Engrailed-2 (en2) deletion produces multiple neurodevelopmental defects in monoamine systems, forebrain structures and neurogenesis and behavior. Hum. Mol. Genet 24 (20), 5805–5827. [DOI] [PMC free article] [PubMed] [Google Scholar]
- Ichtchenko K, Nguyen T, Südhof TC, 1996. Structures, alternative splicing, and neurexin binding of multiple neuroligins. J. Biol. Chem 271, 2676–2682. [DOI] [PubMed] [Google Scholar]
- Jack CR, Petersen RC, O’Brien PC, Tangalos EG, 1992. Mr-based hippocampal volumetry in the diagnosis of alzheimer’s disease. Neurology 42, 183. [DOI] [PubMed] [Google Scholar]
- Jamain S, Quach H, Betancur C, Råstam M, Colineaux C, Gillberg IC, Soderstrom H, Giros B, Leboyer M, Gillberg C, et al. , 2003. Mutations of the x-linked genes encoding neuroligins nlgn3 and nlgn4 are associated with autism. Nat. Genet 34, 27–29. [DOI] [PMC free article] [PubMed] [Google Scholar]
- Jaramillo TC, Speed HE, Xuan Z, Reimers JM, Liu S, Powell CM, 2015. Altered striatal synaptic function and abnormal behaviour in shank3 exon4–9 deletion mouse model of autism. Autism Res. 9 (3), 350–375. [DOI] [PMC free article] [PubMed] [Google Scholar]
- Keifer O Jr., Hurt R, Gutman D, Keilholz S, Gourley S, Ressler K, 2015. Voxel-based morphometry predicts shifts in dendritic spine density and morphology with auditory fear conditioning . Nat. Commun 6. [DOI] [PMC free article] [PubMed] [Google Scholar]
- Kempermann G, Kuhn HG, Gage FH, 1997. More hippocampal neurons in adult mice living in an enriched environment. Nature 386, 493. [DOI] [PubMed] [Google Scholar]
- Kerr TM, Muller CL, Miah M, Jetter CS, Pfeiffer R, Shah C, Baganz N, Anderson GM, Crawley JN, Sutcliffe JS, et al. , 2013. Genetic background modulates phenotypes of serotonin transporter ala56 knock-in mice. Mol. Autism 4, 1. [DOI] [PMC free article] [PubMed] [Google Scholar]
- Kloth AD, Badura A, Li A, Cherskov A, Connolly SG, Giovannucci A, Bangash MA, Grasselli G, Penagarikaño O, Piochon C, et al. , 2015. Cerebellar associative sensory learning defects in five mouse autism models. Elife 4, e06085. [DOI] [PMC free article] [PubMed] [Google Scholar]
- Le CT, 2006. A solution for the most basic optimization problem associated with an roc curve. Stat. Methods Med. Res 15, 571–584. [DOI] [PubMed] [Google Scholar]
- Lein ES, Hawrylycz MJ, Ao N, Ayres M, Bensinger A, Bernard A, Boe AF, Boguski MS, Brockway KS, Byrnes EJ, et al. , 2007. Genome-wide atlas of gene expression in the adult mouse brain. Nature 445, 168–176. [DOI] [PubMed] [Google Scholar]
- Lerch JP, Sled JG, Henkelman RM, 2011a. Mri phenotyping of genetically altered mice. Magn. Reson. Neuroimag. Methods Protoc 349–361. [DOI] [PubMed] [Google Scholar]
- Lerch JP, Yiu AP, Martinez-Canabal A, Pekar T, Bohbot VD, Frankland PW, Henkelman RM, Josselyn SA, Sled JG, 2011b. Maze training in mice induces mri-detectable brain shape changes specific to the type of learning. Neuroimage 54, 2086–2095. [DOI] [PubMed] [Google Scholar]
- Mervis CB, Dida J, Lam E, Crawford-Zelli NA, Young EJ, Henderson DR, Onay T, Morris CA, Woodruff-Borden J, Yeomans J, et al. , 2012. Duplication of gtf2i results in separation anxiety in mice and humans. Am. J. Hum. Genet 90, 1064–1070. [DOI] [PMC free article] [PubMed] [Google Scholar]
- Möller C, Hafkemeijer A, Pijnenburg YA, Rombouts SA, van der Grond J, Dopper E, van Swieten J, Versteeg A, Steenwijk MD, Barkhof F, et al. , 2016. Different patterns of cortical gray matter loss over time in behavioral variant frontotemporal dementia and alzheimer’s disease. Neurobiol. Aging 38, 21–31. [DOI] [PubMed] [Google Scholar]
- Monteggia LM, Barrot M, Powell CM, Berton O, Galanis V, Gemelli T, Meuth S, Nagy A, Greene RW, Nestler EJ, 2004. Essential role of brain-derived neurotrophic factor in adult hippocampal function. Proc. Natl. Acad. Sci. U. S. A 101, 10827–10832. [DOI] [PMC free article] [PubMed] [Google Scholar]
- Moretti P, Bouwknecht JA, Teague R, Paylor R, Zoghbi HY, 2005. Abnormalities of social interactions and home-cage behavior in a mouse model of rett syndrome. Hum. Mol. Genet 14, 205–220. [DOI] [PubMed] [Google Scholar]
- Moretti P, Levenson JM, Battaglia F, Atkinson R, Teague R, Antalffy B, Armstrong D, Arancio O, Sweatt JD, Zoghbi HY, 2006. Learning and memory and synaptic plasticity are impaired in a mouse model of rett syndrome. J. Neurosci 26, 319–327. [DOI] [PMC free article] [PubMed] [Google Scholar]
- Nieman BJ, Bock NA, Bishop J, Chen XJ, Sled JG, Rossant J, Henkelman RM, 2005. Magnetic resonance imaging for detection and analysis of mouse phenotypes. NMR Biomed. 18, 447–468. [DOI] [PubMed] [Google Scholar]
- Nieman BJ, Flenniken AM, Adamson SL, Henkelman RM, Sled JG, 2006. Anatomical phenotyping in the brain and skull of a mutant mouse by magnetic resonance imaging and computed tomography. Physiol. Genomics 24, 154–162. [DOI] [PubMed] [Google Scholar]
- Penagarikaño O, Abrahams BS, Herman EI, Winden KD, Gdalyahu A, Dong H, Sonnenblick LI, Gruver R, Almajano J, Bragin A, et al. , 2011. Absence of cntnap2 leads to epilepsy, neuronal migration abnormalities, and core autism-related deficits. Cell 147, 235–246. [DOI] [PMC free article] [PubMed] [Google Scholar]
- R Core Team, 2016. R: a Language and Environment for Statistical Computing. R Foundation for Statistical Computing, Vienna, Austria: https://www.R-project.org/. [Google Scholar]
- Rampon C, Jiang CH, Dong H, Tang YP, Lockhart DJ, Schultz PG, Tsien JZ, Hu Y, 2000. Effects of environmental enrichment on gene expression in the brain. Proc. Natl. Acad. Sci 97, 12880–12884. [DOI] [PMC free article] [PubMed] [Google Scholar]
- Richetto J, Chesters R, Cattaneo A, Labouesse MA, Gutierrez AMC, Wood TC, Luoni A, Meyer U, Vernon A, Riva MA, 2016. Genome-wide transcriptional profiling and structural magnetic resonance imaging in the maternal immune activation model of neurodevelopmental disorders. Cereb. Cortex 27, 3397–3413. [DOI] [PubMed] [Google Scholar]
- Rosenbaum T, Engelbrecht V, Krölls W, van Dorsten FA, Hoehn-Berlage M, Lenard HG, 1999. Mri abnormalities in neurofibromatosis type 1 (nf1): a study of men and mice. Brain Dev. 21, 268–273. [DOI] [PubMed] [Google Scholar]
- Scholz J, Allemang-Grand R, Dazai J, Lerch JP, 2015. Environmental enrichment is associated with rapid volumetric brain changes in adult mice. NeuroImage 109, 190–198. [DOI] [PubMed] [Google Scholar]
- Scholz J, Klein MC, Behrens TE, Johansen-Berg H, 2009. Training induces changes in white-matter architecture. Nat. Neurosci 12, 1370–1371. [DOI] [PMC free article] [PubMed] [Google Scholar]
- Scott-Van Zeeland AA, Abrahams BS, Alvarez-Retuerto AI, Sonnenblick LI, Rudie JD, Ghahremani D, Mumford JA, Poldrack RA, Dapretto M, Geschwind DH, et al. , 2010. Altered functional connectivity in frontal lobe circuits is associated with variation in the autism risk gene cntnap2. Sci. Transl. Med 2, 56ra80–56ra80. [DOI] [PMC free article] [PubMed] [Google Scholar]
- Sengar AS, Ellegood J, Yiu AP, Wang H, Wang W, Juneja SC, Lerch JP, Josselyn SA, Henkelman RM, Salter MW, et al. , 2013. Vertebrate intersectin1 is repurposed to facilitate cortical midline connectivity and higher order cognition. J. Neurosci 33, 4055–4065. [DOI] [PMC free article] [PubMed] [Google Scholar]
- Silva AJ, Frankland PW, Marowitz Z, Friedman E, Lazlo G, Cioffi D, Jacks T, Bourtchuladze R, 1997. A mouse model for the learning and memory deficits associated with neurofibromatosis type i. Nat. Genet 15, 281–284. [DOI] [PubMed] [Google Scholar]
- Skene PJ, Illingworth RS, Webb S, Kerr AR, James KD, Turner DJ, Andrews R, Bird AP, 2010. Neuronal mecp2 is expressed at near histone-octamer levels and globally alters the chromatin state. Mol. Cell 37, 457–468. [DOI] [PMC free article] [PubMed] [Google Scholar]
- Suto F, Ito K, Uemura M, Shimizu M, Shinkawa Y, Sanbo M, Shinoda T, Tsuboi M, Takashima S, Yagi T, et al. , 2005. Plexin-a4 mediates axon-repulsive activities of both secreted and transmembrane semaphorins and plays roles in nerve fiber guidance. J. Neurosci 25, 3628–3637. [DOI] [PMC free article] [PubMed] [Google Scholar]
- Veenstra-VanderWeele J, Muller CL, Iwamoto H, Sauer JE, Owens WA, Shah CR, Cohen J, Mannangatti P, Jessen T, Thompson BJ, et al. , 2012. Autism gene variant causes hyperserotonemia, serotonin receptor hypersensitivity, social impairment and repetitive behavior. Proc. Natl. Acad. Sci 109, 5469–5474. [DOI] [PMC free article] [PubMed] [Google Scholar]
- Youden WJ, 1950. Index for rating diagnostic tests. Cancer 3, 32–35. [DOI] [PubMed] [Google Scholar]
- Zahir FR, Baross A, Delaney AD, Eydoux P, Fernandes ND, Pugh T, Marra MA, Friedman JM, 2008. A patient with vertebral, cognitive and behavioural abnormalities and a de novo deletion of nrxn1α. J. Med. Genet 45, 239–243. [DOI] [PubMed] [Google Scholar]
- Zakzanis KK, 2001. Statistics to tell the truth, the whole truth, and nothing but the truth: formulae, illustrative numerical examples, and heuristic interpretation of effect size analyses for neuropsychological researchers. Archives Clin. Neuropsychol 16, 653–667. [PubMed] [Google Scholar]
Associated Data
This section collects any data citations, data availability statements, or supplementary materials included in this article.