Abstract
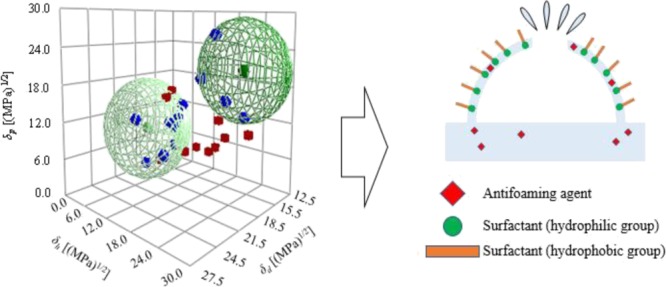
The appearance of foam in various industrial processes can cause challenges. Antifoaming agents are widely added to suppress foam. To exert a defoaming effect, affinity between the main foam-generating component and the antifoaming agent is an important criterion for selection of an antifoaming agent. The Hansen solubility parameter (HSP) can be used as an index to show the affinity between substances more quantitatively, simply, and accurately. The Hansen solubility sphere method was used to measure the HSPs of antifoaming agents and a foam-forming surfactant. Various antifoaming agents were added to a surfactant solution, and the defoaming effect was evaluated. Correlations of 0.953–0.860 confirmed a relationship between affinity of the antifoaming agents for the surfactant based on HSP theory and the defoaming effect. It is suggested that use of HSP as an indicator can facilitate selection of the most suitable antifoaming agent for the process.
1. Introduction
In the paint and food industries, among others, “foam” appears in various processes. Foam may be effectively used in separation operations such as flotation or foam fractionation;1 however, its appearance may also cause defects in the manufacturing process and product quality deterioration, such as a decrease in density, and therefore, it is often regarded as a problem. Antifoaming agents have been widely used as additives to suppress foam in such processes. When the component that produces the foam is a surfactant, it comprises regularly arranged hydrophilic and hydrophobic groups that face the liquid and air sides of a foam bubble, respectively; the forces are balanced, thus the foam has a constant film thickness and becomes stable. To exert an antifoaming effect, an antifoaming agent should be introduced between the surfactant groups to inhibit stabilization of the foam.2 The affinity between the component that generates the foam and the antifoaming agent is very important and is one of the criteria for selecting an antifoaming agent.3 In general, antifoaming agents are examined for their defoaming effect under actual conditions of use, by considering whether their action adversely affects the process, and selection of an antifoaming agent is usually based on empirical data. There is a wide and diverse range of commercially available antifoaming agents; hence, selection of the optimal reagent is often laborious. There is a need for an effective indicator that more simply and accurately enables selection of an antifoaming agent; thus, we focused on use of the Hansen solubility parameter (HSP).4,5 HSP can evaluate the affinity between substances quantitatively. Therefore, it is useful for application as an index in various systems that show dispersion stability, solubility, and the like.6−9
The solubility parameter δ ((MPa)1/2) is a physical property defined by Hildebrand as an indicator of the solubility of a material. The HSP is defined as the solubility parameter δt ((MPa)1/2) divided into three terms: a dispersion force term, a polar force term, and a hydrogen-bonding force term.4
Three methods are used to determine the HSP: the Hansen solubility sphere method,4 the molecular group contribution method,6 and a method involving calculations using correlations between physical properties and various parameters.10 The Hansen solubility sphere method calculates the HSP using an affinity evaluation that takes into consideration interactions with various organic solvents. This method can be used regardless of the state of the sample. The molecular group contribution method involves applying parameters for various molecular groups and is suitable for calculating the HSP of a single component with a known structure. The physical property estimation method is used to estimate an HSP from its correlation formulae for relationships with various physical properties and is suitable for calculating the HSP of a liquid sample.
In this study, the affinity between surfactant solutions that generate foam and various antifoaming agents was quantitatively evaluated using HSP. By showing a relationship between the defoaming effect and the HSP affinity, we propose the introduction of HSP theory to the industrial selection of antifoaming agents.
2. Theory
2.1. Solubility Parameter
The Hildebrand solubility parameter δ ((MPa)1/2) was defined by Hildebrand as an index describing solubility, expressed in terms of cohesive energy and molar volume. The Hildebrand solubility parameter is calculated using the equation4,5
| 1 |
where ΔE and Vm are the cohesive energy (J) and molar volume (cm3/mol) of a substance, respectively. The Hildebrand solubility parameter, which represents the cohesive energy density, has been used to evaluate the compatibilities and dispersibilities of materials. However, it is a nonspecific physical property parameter and does not distinguish between polar interactions, nonpolar interactions, and other interactions; therefore, the affinity between two similar materials, such as alcohols, cannot be appropriately evaluated, and the parameter does not conform to theory.
To solve this problem, C. M. Hansen divided the Hildebrand solubility parameter δ into three components, defined by the following equations5,10
| 2 |
where
| 3 |
in which ΔEd, ΔEp, and ΔEh are dispersion cohesion energy, polar cohesion energy, and hydrogen cohesion energy, respectively, and δd, δp, and δh are the dispersion force, polar force, and hydrogen-bonding force terms, respectively. The dispersion force term δd describes general van der Waals interactions between substances. There will be a powerful attractive force between any two molecules that are located a fraction of a nanometer apart. These forces are everywhere and thus tend to be ignored, but they dominate most interactions. The polar force term δp describes the familiar “positive attracts negative” electrical attraction caused by dipole moments. These forces are important for almost every type of molecule except some hydrocarbons and certain molecules that contain only carbon and fluorine. The hydrogen-bonding force term δh describes forces that are arguably polar, but their predictive value goes beyond that of simple polar forces, and therefore, they are considered to be distinct. Hydrogen-bonding forces can generally be considered to describe electron exchange, thus CO2 has strong hydrogen-bonding forces that make it a good solvent.5,9,10
Quantitatively evaluating the affinity between two substances can be achieved using Ra ((MPa)1/2), which reflects the distance between their HSPs. Ra can be calculated using the equation
| 4 |
in which subscripts 1 and 2 indicate components 1 and 2, respectively.4,5 A smaller Ra value will indicate that the HSPs for the two substances are similar, and the substances have more affinity for each other.
2.2. Hansen Solubility Sphere Method
The Hansen solubility sphere method is a method for calculating HSPs from the results of affinity evaluation tests with organic solvents. Affinities are initially evaluated using organic solvents with known HSPs. Affinity evaluation methods that consider compatibility, swelling properties, and dispersibility are available. A method suitable for the sample of interest is selected. HSPs for solvents with good and poor affinities are plotted on a three-dimensional Hansen graph. The smallest radius sphere (Hansen solubility sphere) is then created by ensuring that data for the good solvent fall within the sphere and that for the poor solvent fall outside the sphere. The center coordinates of the sphere and give the HSP of the target substance.4,5
The HSP of a substance will generally be a single value, that is, the Hansen solubility sphere gives one HSP. It has recently become clear that certain substances have two types of HSP (i.e., two Hansen solubility spheres). Abbott et al. found that a surfactant (a substance with both hydrophobic and hydrophilic properties) will have both hydrophilic and hydrophobic Hansen solubility spheres.11 Agata and Yamamoto found that an ionic liquid, which has both polar and nonpolar components, will also have two Hansen solubility spheres.12 In summary, substances with different components (e.g., surfactants and ionic liquids) will have two Hansen solubility spheres, one related to each component. HSPiP software (Steven Abbott TCNF Ltd., UK, version 5.1.07) is able to create two kinds of Hansen solubility spheres.
2.3. Foam Formation and Defoaming Mechanism
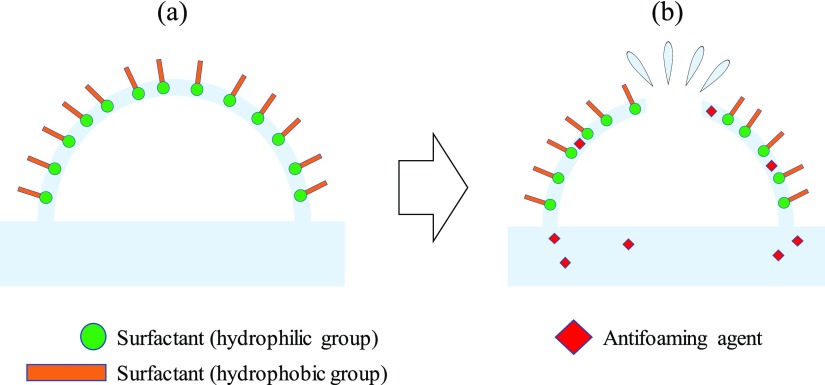
Foam occurs when a liquid forms a membrane that surrounds a gas. In pure water and pure organic solvents, foam hardly ever appears; if foam is generated, its stability is extremely small. When a second component such as a surfactant or polymer is added, foam tends to develop and stabilize.3,5 As shown in Figure 1, in a surfactant solution, hydrophilic groups are regularly arranged on the liquid side of the membrane and hydrophobic groups on the air side; therefore, the forces on the foam surface are balanced, so that the foam has a constant film thickness and becomes stable. By adding an antifoaming agent, the balance of the forces on the foam surface is broken because the antifoaming agent inserts between the hydrophilic groups of each surfactant molecule and the film thickness becomes uneven; as a result, the foam loses stability and disappears. One criterion for an effective antifoaming agent is that it can easily enter between the surfactant molecules. Its affinity for the foam component is important in considering whether the antifoaming agent can easily enter the foam. The affinity between the foaming component in a process and the antifoaming agent is, therefore, an important factor when selecting an antifoaming agent for industrial use.2,3,5
Figure 1.
(a) Foam formation by surfactants and (b) after adding antifoaming agents and defoaming.
3. Experimental Section
3.1. Materials and Affinity Evaluation Methods
Table 1 shows chemical samples used in this experiment. Chemical samples were used unpurified without modification.
Table 1. CAS Registry Number and Mass Fraction Purity of the Chemicals.
| chemicals | CAS reg. no. | suppliers | mass fraction purity (mass/mass) |
|---|---|---|---|
| Surfactant for Foam Component | |||
| PEL | 9002-92-0 | FUJIFILM Wako Pure Chemical Corp., Japan | ≤100 |
| Antifoaming Agents | |||
| KM-71 | private information | Shin-Etsu Chemical Co., Ltd., Japan | |
| KM-73 | private information | Shin-Etsu Chemical Co., Ltd., Japan | |
| KM-73A | private information | Shin-Etsu Chemical Co., Ltd., Japan | |
| KM-73E | private information | Shin-Etsu Chemical Co., Ltd., Japan | |
| Shirikaton-SN-400A | private information | Shin-Etsu Chemical Co., Ltd., Japan | |
| Organic Solvents Used in Affinity Evaluation for Measuring HSP | |||
| hexane | 110-54-3 | FUJIFILM Wako Pure Chemical Corp., Japan | >0.960 |
| toluene | 108-88-3 | FUJIFILM Wako Pure Chemical Corp., Japan | >0.995 |
| nitrobenzene | 98-95-3 | FUJIFILM Wako Pure Chemical Corp., Japan | >0.995 |
| methyl ethyl ketone | 78-93-3 | FUJIFILM Wako Pure Chemical Corp., Japan | >0.990 |
| acetone | 67-64-1 | FUJIFILM Wako Pure Chemical Corp., Japan | >0.995 |
| ethyl acetate | 141-78-6 | FUJIFILM Wako Pure Chemical Corp., Japan | >0.995 |
| tetrahydrofuran | 109-99-9 | FUJIFILM Wako Pure Chemical Corp., Japan | >0.995 |
| dimethyl sulfoxide | 67-68-5 | FUJIFILM Wako Pure Chemical Corp., Japan | >0.990 |
| aniline | 62-53-3 | FUJIFILM Wako Pure Chemical Corp., Japan | >0.990 |
| 1-methyl imidazole | 616-47-7 | FUJIFILM Wako Pure Chemical Corp., Japan | >0.980 |
| dimethyl formamide | 68-12-2 | FUJIFILM Wako Pure Chemical Corp., Japan | >0.995 |
| salicylaldehyde | 90-02-8 | FUJIFILM Wako Pure Chemical Corp., Japan | >0.970 |
| 1-hexanol | 111-27-3 | FUJIFILM Wako Pure Chemical Corp., Japan | >0.970 |
| benzyl alcohol | 100-51-6 | FUJIFILM Wako Pure Chemical Corp., Japan | >0.990 |
| 1-butanol | 71-36-3 | FUJIFILM Wako Pure Chemical Corp., Japan | >0.990 |
| n-methyl formamide | 123-39-7 | FUJIFILM Wako Pure Chemical Corp., Japan | >0.990 |
| 1-propanol | 71-23-8 | FUJIFILM Wako Pure Chemical Corp., Japan | >0.995 |
| ethanol | 64-17-5 | FUJIFILM Wako Pure Chemical Corp., Japan | >0.995 |
| methanol | 67-56-1 | FUJIFILM Wako Pure Chemical Corp., Japan | >0.998 |
| formamide | 75-12-7 | FUJIFILM Wako Pure Chemical Corp., Japan | >0.995 |
| ethanolamine | 141-43-5 | FUJIFILM Wako Pure Chemical Corp., Japan | >0.990 |
| ethylene glycol | 107-21-1 | FUJIFILM Wako Pure Chemical Corp., Japan | >0.995 |
| diethylene glycol | 111-46-6 | FUJIFILM Wako Pure Chemical Corp., Japan | >0.990 |
The nonionic surfactant, polyoxyethylene(23)lauryl ether (PEL; FUJIFILM Wako Pure Chemical Corp., Japan), was used as the foam component. This surfactant is a solid; therefore, we evaluated its affinity for organic solvents by HSP measurement using a dissolution test. Ten milliliters of each of 23 organic solvents were added to 0.3 g PEL. The affinity was visually evaluated after allowing the mixtures to stand for 1 h. The criteria for determining the affinity are described in Section 4. Poor and good solvents were judged, and HSP values were determined using the Hansen solubility sphere method.
The antifoaming agents (with their abbreviations given in brackets) were KM-71 (Af: A), KM-73 (Af: B), KM-73A (Af: C), and KM-73E (Af: D), supplied by Shin-Etsu Chemical Co., Ltd., Japan and Shirikaton-SN-400A (Af: E), supplied by Taki Chemical Co., Ltd., Japan. These are emulsion type antifoaming agents in which silicone oil compounds are emulsified with nonionic surfactants. The various antifoaming agents are liquids, therefore, the compatibility evaluation method was used to determine the affinity for HSP measurement. Two milliliters of each of the 23 organic solvents were added to 2 mL of various antifoaming agents. After sonication for 5 min, the mixtures were allowed to stand for 24 h, and the affinity was similarly visually evaluated. Poor and good solvents were judged from the affinity evaluation, and HSP values were determined using the Hansen solubility sphere method. The affinities between PEL and each antifoaming agent were compared using eq 4.
3.2. Defoaming Tests
A surfactant solution of 0.05% PEL was prepared with pure water. There are two methods for adding an antifoaming agent: one is premixing in the solution and the other is adding on top of foams, but the defoaming mechanism is considered to be almost the same. Therefore, in this experiment, the former was selected because of quantitative evaluation and ease of operation. Various antifoaming agents were added to give an active ingredient concentration of 10 ppm. After stirring each mixture for 30 min, 150 mL of the test solution was placed in a measuring cylinder and aerated for 30 s using a fixed amount of pure nitrogen gas. The foam height was measured at 0, 30, 90, 150, and 210 s after cessation of aeration. The highest position reached by the bubbles was taken as the bubble height. These experiments were performed at room temperature.
4. Results and Discussion
4.1. HSP Measurements of Surfactant and Antifoaming Agents
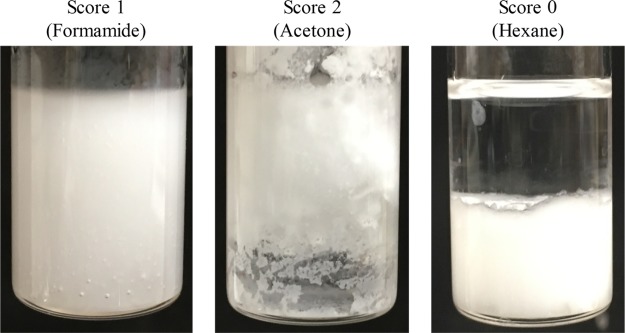
Table 2 shows the affinities of PEL and the antifoaming agents (Af) for the various organic solvents. Figure 2 shows evaluation criteria of PEL. In the affinity evaluation of PEL, the evaluation criteria were that the organic solvent in which PEL dissolved completely was assigned a score of 1 and that in which PEL was insoluble was assigned a score of zero.
Table 2. Affinity Evaluation Scores for PEL and the Antifoaming Agent (Af) with Various Organic Solvents.
| scores |
|||||||||
|---|---|---|---|---|---|---|---|---|---|
| solvents | δd [(MPa)1/2] | δp [(MPa)1/2] | δh [(MPa)1/2] | PEL | Af: A | Af: B | Af: C | Af: D | Af: E |
| hexane | 14.9 | 0.0 | 0.0 | 0 | 0 | 0 | 0 | 0 | 1 |
| toluene | 18.0 | 1.4 | 2.0 | 1 | 0 | 0 | 0 | 0 | 1 |
| nitrobenzene | 20.0 | 10.6 | 3.1 | 1 | 2 | 0 | 0 | 0 | 2 |
| methyl ethyl ketone | 16.0 | 9.0 | 5.1 | 1 | 0 | 0 | 0 | 0 | 1 |
| acetone | 15.5 | 10.4 | 7.0 | 1 | 2 | 2 | 2 | 1 | 2 |
| ethyl acetate | 15.8 | 5.3 | 7.2 | 0 | 0 | 0 | 0 | 0 | 2 |
| tetrahydrofuran | 16.8 | 5.7 | 8.0 | 1 | 2 | 2 | 2 | 2 | 1 |
| dimethyl sulfoxide | 18.4 | 16.4 | 10.2 | 0 | 1 | 1 | 1 | 1 | 0 |
| aniline | 20.1 | 5.8 | 11.2 | 1 | 2 | 0 | 0 | 0 | 2 |
| 1-methyl imidazole | 19.7 | 15.6 | 11.2 | 0 | 1 | 1 | 1 | 1 | 2 |
| dimethyl formamide | 17.4 | 13.7 | 11.3 | 1 | 1 | 0 | 1 | 1 | 1 |
| salicylaldehyde | 19.0 | 10.5 | 12.0 | 1 | 2 | 0 | 0 | 0 | 2 |
| 1-hexanol | 15.9 | 5.8 | 12.5 | 0 | 0 | 0 | 0 | 0 | 2 |
| benzyl alcohol | 18.4 | 6.3 | 13.7 | 0 | 2 | 0 | 2 | 0 | 2 |
| 1-butanol | 16.0 | 5.7 | 15.8 | 0 | 0 | 0 | 0 | 0 | 2 |
| n-methyl Formamide | 17.4 | 18.8 | 15.9 | 1 | 1 | 1 | 1 | 1 | 1 |
| 1-propanol | 16.0 | 6.8 | 17.4 | 0 | 2 | 0 | 2 | 2 | 2 |
| ethanol | 15.8 | 8.8 | 19.4 | 0 | 2 | 0 | 1 | 2 | 2 |
| methanol | 14.7 | 12.3 | 22.3 | 1 | 2 | 0 | 1 | 1 | 2 |
| formamide | 17.2 | 26.2 | 19.0 | 1 | 1 | 0 | 1 | 1 | 0 |
| ethanolamine | 17.0 | 15..5 | 21.0 | 1 | 1 | 2 | 1 | 1 | 0 |
| ethylene Glycol | 17.0 | 11.0 | 26.0 | 0 | 0 | 0 | 1 | 0 | 0 |
| diethylene Glycol | 16.6 | 12.0 | 19.0 | 0 | 0 | 0 | 1 | 0 | 0 |
Figure 2.
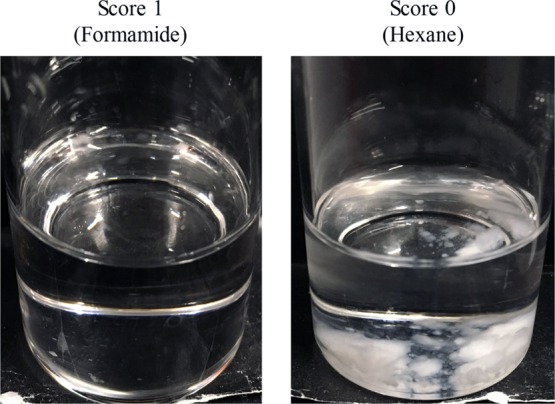
Examples of the affinity evaluation scores for PEL.
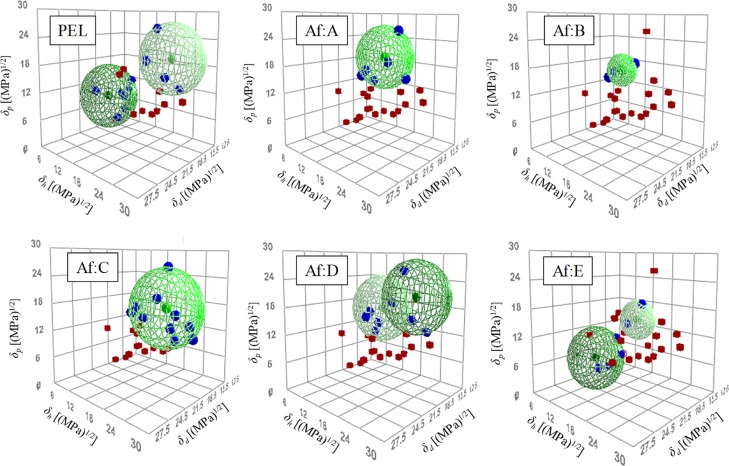
Good solvents in the Hansen solubility sphere method had a score of 1, which indicated that the affinity between PEL and the solvent was good; poor solvents had a score of zero, which indicated that the relative affinity was poor. The Hansen solubility sphere results obtained using the Hansen solubility sphere method are shown in Figure 4. PEL exhibited two spheres: one with a high δh and another with a low δh. The HSP values of the high δh sphere were δd = 15.3 (MPa)1/2, δp = 20.2 (MPa)1/2, and δh = 20.4 (MPa)1/2. It is considered that these values represent the hydrophilic group of the surfactant. HSP values of the low δh sphere were δd = 19.1 (MPa)1/2, δp = 9.7 (MPa)1/2, and δh = 5.3 (MPa)1/2; these are considered to indicate the hydrophobic group of the surfactant.11
Figure 4.
Hansen solubility spheres for PEL and antifoaming agents (Af).
Figure 3 shows evaluation criteria of antifoaming agents. In the affinity evaluation of antifoaming agents, the evaluation criteria for affinity were that a compatible system was assigned a score of 1, while the partially miscible system was scored as 2 and two-phase systems were scored as zero.
Figure 3.
Examples of the affinity evaluation scores for the antifoaming agent.
Good solvents in the Hansen solubility sphere method had scores of 1, which indicated that affinity between the antifoaming agent and solvent was good; poor solvents had a score of 2 and zero, which indicated that affinity was poor. The Hansen solubility sphere results of antifoaming agents obtained using the Hansen solubility sphere method are shown in Figure 4. Considering the positional relationship between the good and poor solvents, antifoaming agents D and E were represented by two spheres. The HSP values obtained from the abovementioned results are summarized in Table 3.
Table 3. HSP of Antifoaming Agents (Af) and HSP Distance (Ra) Between Each Antifoaming Agent and PEL.
| antifoaming agent (Af) | δd [(MPa)1/2] | δp [(MPa)1/2] | δh [(MPa)1/2] | Ra [(MPa)1/2] | |
|---|---|---|---|---|---|
| Af: A | 17.4 | 19.9 | 15.1 | 6.8 | |
| Af: B | 18.6 | 17.3 | 13.6 | 9.9 | |
| Af: C | 17.7 | 17.1 | 19.2 | 5.8 | |
| Af: D | low δh sphere | 16.1 | 16.8 | 10.6 | |
| high δh sphere | 15.0 | 20.1 | 19.6 | 1.0 | |
| Af: E | low δh sphere | 17.9 | 3.9 | 0.9 | |
| high δh sphere | 17.2 | 15.1 | 14.4 | 8.6 | |
4.2. Affinity Evaluation of Surfactant and Antifoaming Agents Using HSP Theory
The HSP distance Ra between PEL and the various antifoaming agents was calculated using eq 4. The results are shown in Table 3. A surfactant forms a bubble by arranging a hydrophobic group on the outside and a hydrophilic group on the inside; therefore, affinity between the hydrophilic group of the surfactant and the antifoaming agent is considered to be important in defoaming. We compared the HSPs of PEL high δh spheres and the antifoaming agents (high δh spheres in the case of two spheres). A smaller Ra value indicated that the HSPs for the two substances are similar and that the substances have more affinity. Table 3 indicates that the best affinity was exhibited by the Af: D system, with an Ra of 1.0 (MPa)1/2. Hence, it was inferred that antifoaming agent D exerted the best defoaming effect on PEL.
4.3. Defoaming Tests
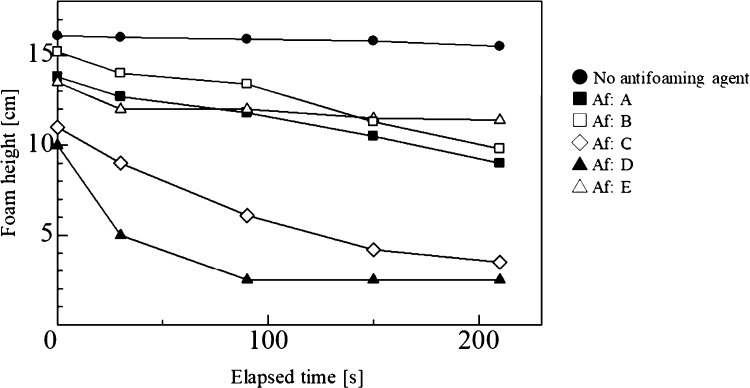
The results of defoaming tests for the five antifoaming agents are shown in Figure 5. In the test solution with no antifoaming agent, a slight decrease in foam height occurred immediately after nitrogen gas aeration, but, after a lapse of time, the foam height was stable without any change. When the antifoaming agent was added, the initial foam height and the height measured after all elapsed times tended to decrease. Differences were exhibited by the various antifoaming agents: for example, the foam heights of A and B continuously decreased immediately after addition, but those of C and E decreased and then became constant. It is believed that this behavior is affected by the rate of penetration of the antifoaming agent into the foam. In addition, this is because that the ratio of hydrophilicity and hydrophobicity in the defoamer is related. From Figure 4, Hansen solubility spheres of Af: E have a larger interaction radius in the low δh sphere than in the high δh sphere. In other words, it is presumed that Af: E also has a hydrophilic property but has a relatively dominant property of hydrophobicity. Therefore, some reduction of foam was observed in the initial stage of addition. But the hydrophobic part was dominant and the influence on the foam part was small, and the height of the foam was considered to be constant as in the case without the defoamer.
Figure 5.
Changes in the foam height over time when adding various antifoaming agents.
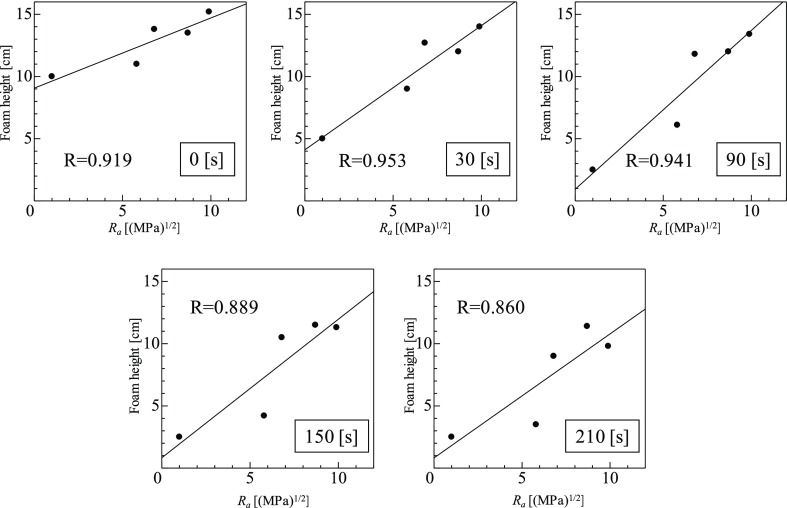
The relationships between the foam height at each time and Ra of the antifoaming agents are shown in Figure 6. A high correlation coefficient (R) was observed between Ra and the bubble height at each elapsed time. The best correlation was R = 0.953 at an elapsed time of 30 s; R decreased somewhat as the elapsed time increased. This is considered to be because of differences in foam stability with the elapsed time, as described above, but some correlation (R = 0.860) could be confirmed even after 210 s.
Figure 6.
Relationship between the foam height and affinity (Ra) of PEL and antifoaming agents at each time.
Confirmed correlations between the antifoaming agent and PEL affinity (Ra) and the defoaming effect at each elapsed time suggested that evaluation of the affinity between an antifoaming agent and the foaming liquid component by Ra using HSP can serve as a guideline for selecting the optimal antifoaming agent for a process. Moreover, it can be predicted that the best result can be obtained by designing an antifoaming agent having a small Ra with the foaming liquid.
5. Conclusions
Selection of an antifoaming agent using HSPs is discussed. The HSP of a surfactant, which is a foam component, and antifoaming agents were measured using the Hansen solubility sphere method, and a comparative study of their affinities was conducted. A correlation was confirmed between the defoaming effect and the affinity (Ra). It is suggested that use of HSP can be effective for selection of an antifoaming agent.
Acknowledgments
We thank Kathryn Sole, PhD, from Edanz Group (www.edanzediting.com/ac) for editing a draft of this manuscript.
The authors declare no competing financial interest.
References
- Shibata J.Interface and colloid chemistry, 4th ed.; Kansai University Press: Osaka, 2014; pp 57–81. [Google Scholar]
- Aoki K. A study on foam stabilization and defoaming mechanism. Paint Resin 2014, 156, 26–31. [Google Scholar]
- Ueda S.; Yamada T.; Sugishima M. Study on Solubility Parameter of Paint Additives. Paint Resin 2010, 152, 41–46. [Google Scholar]
- Tsutsumi S.; Kondo K.; Fujiwara N.; Yamamoto H.; Yamamoto H. Determination of Hansen solubility parameters of particles using a capillary penetration method. Chem. Phys. 2019, 521, 115–122. 10.1016/j.chemphys.2019.01.018. [DOI] [Google Scholar]
- Kato Y.; Tsutsumi S.; Fujiwara N.; Yamamoto H. Measurements of the Hansen solubility parameters of mites and cockroaches to improve pest control applications. Heliyon 2019, 5, e01853 10.1016/j.heliyon.2019.e01853. [DOI] [PMC free article] [PubMed] [Google Scholar]
- Fujiwara N.; Imai S.; Yamamoto H. Evaluation of the influence of fine particle surface modification with the Hansen solubility parameters. Mater. Chem. Phys. 2019, 229, 139–148. 10.1016/j.matchemphys.2019.02.091. [DOI] [Google Scholar]
- Sato T.; Hamada Y.; Sumikawa M.; Araki S.; Yamamoto H. Solubility of oxygen in organic solvents and calculation of the Hansen solubility parameters of oxygen. Ind. Eng. Chem. Res. 2014, 53, 19331–19337. 10.1021/ie502386t. [DOI] [Google Scholar]
- Sato T.; Araki S.; Morimoto M.; Tanaka R.; Yamamoto H. Comparison of hansen solubility parameter of asphaltenes extracted from bitumen produced in different geographical regions. Energy Fuels 2014, 28, 891–897. 10.1021/ef402065j. [DOI] [Google Scholar]
- Süß S.; Sobisch T.; Peukert W.; Lerche D.; Segets D. Determination of Hansen parameters for particles: A standardized routine based on analytical centrifugation. Adv. Powder Technol. 2018, 29, 1550–1561. 10.1016/j.apt.2018.03.018. [DOI] [Google Scholar]
- Hansen C. M.; Hansen Solubility Parameters: A User’s Handbook; CRC Press: Boca Raton, 1999; pp 1–42. [Google Scholar]
- Abbott S.; Hansen C. M.; Yamamoto H. S.; Richard Valpey C. III. Hansen Solubility Parameters in Practice Complete with eBook, Software and Data, 5th ed; The HSPiP Team, 2015. [Google Scholar]
- Agata Y.; Yamamoto H. Determination of Hansen solubility parameters of ionic liquids using double-sphere type of Hansen solubility sphere method. Chem. Phys. 2018, 513, 165–173. 10.1016/j.chemphys.2018.04.021. [DOI] [Google Scholar]


