

Abstract

This study was focused on the geometries and properties of the structural isomers obtained from a random walk of methylpentynol–HN3 clusters. The theoretical aspects of hydrogen bonding effects on the discussed 1,3-dipolar cycloaddition (1,3-DC) reactions [between methylpentynol (a) as a dipolarophile and azide (b) as a 1,3-dipole] have shown regioselective output concepts. The dipolarophile methylpentynol (a) was applied for the treatment of insomnia. Both methylpentynol (a) and azide (b) can be H-bond acceptor and H-bond donor agents. Because of this trait of them, structures of H-bonding arrays (c–f) and methylpentynol–azide clusters (g–m) can be probable. In this work, regioselectivity of the 1,3-DC reaction [between methylpentynol (a) as a dipolarophile and azide (b) as a 1,3-dipole] was determined based on these structures (c–m) using density functional theory (DFT). The energy levels of the reactants (a and b) and the structures of H-bonding arrays (c–f), methylpentynol–azide clusters (g–m), transition states, and products (1 and 2) were studied, and also, the free energies of the reaction (ΔrG and ΔG#, in kcal mol–1) and rate constants were determined using Eyring’s equation (k). Structural data were calculated and obtained by the DFT/B3LYP method. Seven different basis sets have been used to obtain the most appropriate results from comparison of data.
1. Introduction
The type of 1,3-dipolar cycloaddition (1,3-DC) reactions has been widely used in various fields.1,2 A lot of reports in the scientific literature have devoted to 1,3-DC reactions because of their interesting features and their products such as 1,2,3-triazole.3 The five-membered hetero-aromatic rings, which could be achieved by 1,3-DC reactions, widely played an important role in various biochemical processes.4
Stereochemistry
in these reactions is one of the important spotlights.2 The focus of attention has been attracted on the regio-,
diastereo-, and enantioselectivity of 1,3-DC reactions, which were
rationalized through frontier molecular orbital (FMO) theory.5−10 Choosing the appropriate substrates and electron-donating or electron-withdrawing
functional groups that are located on the reagents can lead to the
intended stereochemistry in these types of organic reactions. This
stereoselectivity would occur by altering the relative FMO energies.
It should be noted that another influential factor for selectivity
is steric restraint effects, which has been known as a substantial
factor.1,5,11,12 This demand was also realized by the purposeful use
of some special catalysts. The “canonical” 1,3-DC reaction
of terminal alkynes and azides was dramatically accelerated by the
Cu(I) catalyst which was first reported by Sharpless and co-workers13 and Meldal and co-workers as a click chemistry
approach.14 The copper ion catalyzes the
1,3-DC reactions and yields regioselectively in the 1,4-disubstituted
triazole ring. Therefore, several catalysts have been pursued to expand
the application of this reaction by forming the 1,5-disubstituted
product.11 This goal was recently achieved
using ruthenium-based catalysts.15 However,
the obtained research data on the regioselectivity performance of
1,3-DC reactions have not been reported using H-bonding arrays with
a topology of the cluster. Herein, regioselectivity has been attained
by “silico modeling” via hydrogen-bonding networks (HBNs).
In 1920, the term of hydrogen bonds was used in the literature for
the first time.16 The following form was
applied to represent the isolated hydrogen bond in HBNs (X is an electronegative
element and Y is a basic site):17![]()
The evolution of hydrogen-bonding concepts keeps extending over time;18−21 nowadays, hydrogen bonds are considered one of the most important noncovalent interactions.16,22 Although the structures of the isolated hydrogen bonds were discussed before, the main principles of topology in isolated H bonding may be useful for the application of H-bonding clusters to investigate the construction of the structures.23,24 One of the first articles about water clusters was published in 1969,25 and also, one of the first articles about HBNs was published in 1979 which dealt with the issue of how hydration water molecules and hydroxyl groups of macromolecules can cooperate to form a network-like pattern.26 However, such data could be grouped into gas-phase clusters. In a low-temperature gas-phase environment, this cluster on the HBNs has provided important information related to the structure of the cluster geometry.27−29 Extensive studies have been performed on water cluster structures and alcohol; as a result, a large amount of data on properties of clusters has appeared in the literature.24,30−41 These interests notably direct researchers’ attention toward clusters of different alcohols.36 As previously mentioned, in the X–H···:Y form of the hydrogen bond, X is an electronegative atom which comes from group IV–VII atoms. The halogen bond is a kind of hydrogen bond where the X atom is from group VII. This type has also been taken into consideration.42−44
In this investigation, methylpentynol (a) molecules were converged in a cluster of azide molecules (b) using an H-bonding array framework. The estimates of some arrays of methylpentynol–HN3 clusters will be presented here. The obtained data were calculated by the density functional theory (DFT)/B3LYP method. Parallel calculations at seven different basis sets were performed for all structures of reactants (a and b), H-bonding arrays (c, d, and f), methylpentynol–azide clusters (g–m), and products (1 and 2) for comparison. The reaction is presented in Scheme 1. In Figure 1, the schematic of the 1,3-DC reaction between methylpentynol (a) and azide (b) to achieve products (2) using an H-bonding array (c) has been shown as a sequential process.
Scheme 1. Overall Scheme of Reaction Energy (Shown Right) and the Structure of Reactants (a, b), H-Bonding Arrays (c–e), Products (1, 2), and Transition States (TSs) (Shown Left).

Figure 1.

Demonstration of the 1,3-DC reaction between methylpentynol (a) and azide (b) to achieve products (2) using an H-bonding array (c).
2. Results and Discussion
In the present work, there are two options to calculate ΔG# and ΔrG for the product (2). The first assumption is that there will be no interactions between the reactants before the 1,3-DC reaction. Meanwhile, in the second assumption, H-bonding arrays are being exhibited as reactants in the 1,3-DC reaction. The results of the reaction have shown that the species “c” and “d” as the precursor of the discussed reaction are more stable than the sum of the energies of “a” and “b” initiator ingredients because of hydrogen bonding between the reaction initiator in “c” and “d”. Because the formation of the H bond is with relative stability, the reactants tend to form the discussed H-bonding arrays and clusters. The computational results of the reaction demonstrated that the energy level of the “e” form is higher than what it should be possible to follow the reaction (see Scheme 1).
2.1. Structural Remarks and Topology of H-Bonding Networks
Any electron-rich group has been determined as an acceptor, so H-bonding arrays can be mapped out in three modes (c–e). Methylpentynol (a) can act as an acceptor of two hydrogen bonds and a donor of one hydrogen bond. With methylpentynol (M), azide (A), nA + M (MAn), and n = 2, two structures are conceivable: “f” (the open-chain structure with 2-docking N–H···:O) and “g” (3-fold).
However, about n ≥ 3 clusters with equal number of azides have a circular arrangement, in which docking is obvious in one of them: “h” (3-fold and docking), “i” (4-fold), “j” (4-fold and docking), “k” (5-fold), “l” (5-fold and docking), and “m” (6-fold).
The structural data [angle of X–H···:Y (°) and H-bond length of X–H···:Y (Å)] and topologies of H-bonding arrays (c, d, and f) and methylpentynol–azide clusters (g–m), which are obtained from calculations with seven different basis sets, are categorized in Tables 1 and 2. Because the polarization functions give more room for the electrons to get away from each other to minimize electron–electron repulsion, the augmented basis sets give remarkably good calculated geometries which can give results comparable to the simple basis sets.
Table 1. Structural Data of c and d, Which Are Obtained from Seven Different Basis Setsa.
| basis
sets |
|||||||
|---|---|---|---|---|---|---|---|
| structural data | DFT/B3LYP/6-31++G(2df,2p) | DFT/B3LYP/6-311++G** | DFT/B3LYP/6-311+G** | DFT/B3LYP/6-31+G* | DFT/B3LYP/6-311G* | DFT/B3LYP/6-31G** | DFT/B3LYP/6-31G* |
| angle of O–H···:N (deg) [d] | 176.79 | 176.30 | 176.30 | 176.68 | 175.57 | 174.41 | 175.30 |
| angle of N–H···:O (deg) [c] | 176.70 | 177.54 | 177.54 | 177.99 | 176.18 | 175.77 | 176.41 |
| H-bond length of O–H···:N (Å) [d] | 2.073 | 2.053 | 2.053 | 2.045 | 2.033 | 2.049 | 2.044 |
| H-bond length of N–H···:O (Å) [c] | 1.967 | 1.936 | 1.936 | 1.927 | 1.938 | 1.927 | 1.932 |
| stability of the structure (because of H bond) [d] | –3.287 | –3.943 | –3.950 | –4.538 | –5.087 | –4.798 | –4.904 |
| stability of the structure (because of H bond) [c] | –5.110 | –5.812 | –5.822 | –6.618 | –7.433 | –7.797 | –7.945 |
The two figures
of the “c” and “d”
array topologies (pictured right) and the three graphs to compare
results from seven different basis sets (pictured left)  .
.
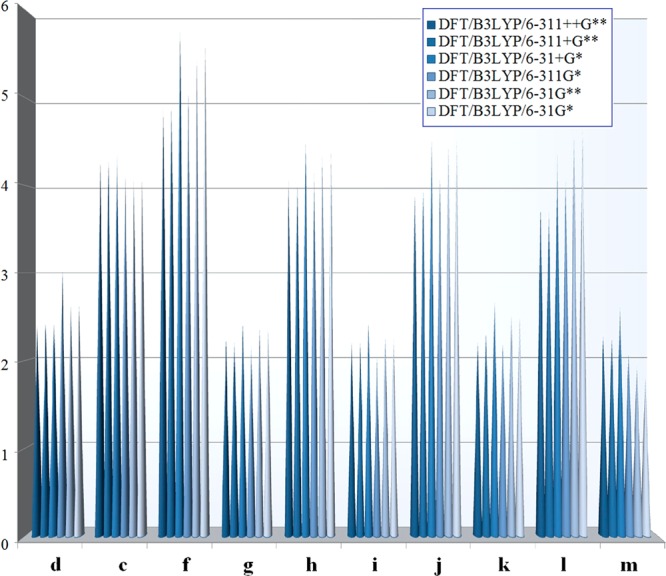
Table 2. H-Bond Length (Å) and Angle (°) of N–H···:O and O–H···:N in Methylpentynol–Azide Clusters (f–m) [Topologies of (f–m) Are Shown in the Embedded Figure]a,b.
| cluster |
||||||||
|---|---|---|---|---|---|---|---|---|
| structural data | f | g | h | i | j | k | l | m |
| angle of O–H···:N (deg) | 147.32 | 154.43 | 162.45 | 164.67 | 171.67 | 171.33 | 170.25 | |
| angle of N–H···:O (deg) | 153.23 | 149.86 | 165.49 | 161.95 | 169.78 | 169.16 | 174.25 | |
| angle of N–H···:O (deg) in docking position | 175.39 | 172.39 | 177.19 | 178.29 | ||||
| 162.67 | ||||||||
| H-bond length of O–H···:N (Å) | 2.131 | 2.010 | 1.990 | 1.918 | 1.942 | 1.894 | 1.935 | |
| H-bond length of N–H···:O (Å) | 1.932 | 2.119 | 1.850 | 1.929 | 1.817 | 1.905 | 1.812 | |
| H-bond length of N–H···:O (Å) in docking position | 2.045 | 1.995 | 2.014 | 2.010 | ||||
| 2.059 | ||||||||
Geometry details obtained by DFT/B3LYP/6-31++G(2df,2p).
The HBN topologies of the methylpentynol–azide
clusters (f–m) obtained by DFT/B3LYP/6-31++G(2df,2p)  .
.
The main interest of the DFT/B3LYP/6-31++G(2df,2p) method lies in the fact that it is more flexible and gives geometry optimization with high accuracy. Therefore, all used topology pictures given in Table 2 were obtained by DFT/B3LYP/6-31++G(2df,2p) (see Tables 1, S1 and S2). Table S1 demonstrates the HBN topologies of the methylpentynol–azide clusters (f–m) which were obtained by DFT/B3LYP/6-31++G(2df,2p). Table S2 shows the H-bond length (Å) and angle (°) of N–H···:O and O–H···:N in methylpentynol–azide clusters (f–m).
2.2. “X–H···:Y” Distances and Suitable Binding
The H-bond lengths (Å) and the H-bond angle (°) of the host–guest relations of N–H···:O and O–H···:N for H-bonding arrays (c, d, and f) and methylpentynol–azide clusters (g–m) are depicted in Tables 1 and 2. However, there are three graphs and two figures embedded in Table 1 to schematically compare “c” and “d” arrays. Almost all methods show great evidence. The trend of reviews from the first basis set to the seventh basis set shows that the methods which have diffuse “s” and “p” functions for heavy atoms presented more acceptable results. Furthermore, more evolved results are obtained by expanding the polarization functions in methods.
The comparison of the depicted results from seven different basis sets in Table 1 shows that the interactions of the H bond in the “c” array (N–H···:O) are more appropriate than the interactions of the H bond in the “d” array (O–H···:N). In almost all results, the values of the angle of N–H···:O (°) [c] are significantly larger than the values of the angle of O–H···:N (°) [d]. Therefore, the angle of N–H···:O (°) [c] tends to 180°. The bond angles of N–H···:O (°) [c] and O–H···:N (°) [d] were 176.41 and 175.30° (in the DFT/B3LYP/6-31G* method); 175.77 and 174.41° (in the DFT/B3LYP/6-31G** method); 176.18 and 175.57° (in the DFT/B3LYP/6-311G* method); 177.99 and 176.68° (in the DFT/B3LYP/6-31+G* method); 177.54 and 176.30° (in the DFT/B3LYP/6-311+G** method); 177.54 and 176.30° (in the DFT/B3LYP/6-311++G** method); and 176.70 and 176.79° (in the DFT/B3LYP/6-311++G(2df,2p) method), respectively. The H-bond length of N–H···:O (Å) [c] in all methods was clearly lower than the H-bond length of O–H···:N (Å) [d]. The H-bond lengths of N–H···:O (Å) [c] and O–H···:N (Å) [d] were 1.932 and 2.044 Å (in the DFT/B3LYP/6-31G* method); 1.927 and 2.049 Å (in the DFT/B3LYP/6-31G** method); 1.938 and 2.033 Å (in the DFT/B3LYP/6-311G* method); 1.927 and 2.045 Å (in the DFT/B3LYP/6-31+G* method); 1.936 and 2.053 Å (in the DFT/B3LYP/6-311+G** method); 1.936 and 2.053 Å (in the DFT/B3LYP/6-311++G** method); and 1.967 and 2.073 Å [in the DFT/B3LYP/6-311++G(2df,2p) method], respectively. This perception of H bonds is based on geometry and energy of N–H···:O and O–H···:N in the discussed system, which could be ascribed to a rather negative electrostatic charge of the oxygen atom (Oδ−). Two nonbonded electron pairs of oxygen atoms were considered to be immediate acceptors of the hydrogen bond, which is also expected to play a definite role in determining the geometrical arrangement in the HBNs.
Looking at the computational results of basis sets, from the first (6-31G*) to the seventh (6-31++G(2df,2p)), the downward trends in system stability for both “c” (N–H···:O form of the H bond) and “d” (O–H···:N form of the H bond) are quite evident (see Table 1). The values of stability of the structure (because of the H bond) for N–H···:O [c] and O–H···:N [d] (in kcal mol–1) were −7.945 and −4.904 (in the DFT/B3LYP/6-31G* method); −7.797 and −4.798 (in the DFT/B3LYP/6-31G** method); −7.433 and −5.087 (in the DFT/B3LYP/6-311G* method); −6.618 and −4.538 (in the DFT/B3LYP/6-31+G* method); −5.822 and −3.950 (in the DFT/B3LYP/6-311+G** method); −5.812 and −3.943 (in the DFT/B3LYP/6-311++G** method); and −5.110 and −3.287 [in the DFT/B3LYP/6-311++G(2df,2p) method], respectively. Also, these trends are entirely continuous for other structures of clusters (f–m). The comprehensive data about the stability of structure energy are shown in Table 3. If you would like to see these trends for the stability of structure energy per number of H bonds, the data are available in Table 4.
Table 3. Stability of Cluster Structures Energy for HBNs (kcal mol–1); c (Docking N–H···:O), d (Docking O–H···:N), f (the Open-Chain Structure with 2-Docking N–H···:O), g (3-Fold), h (3-Fold and Docking), i (4-Fold), j (4-Fold and Docking), k (5-Fold), l (5-Fold and Docking), and m (6-Fold)a.
| basis
sets |
|||||||
|---|---|---|---|---|---|---|---|
| cluster | DFT/B3LYP/6-31++G(2df,2p) | DFT/B3LYP/6-311++G** | DFT/B3LYP/6-311+G** | DFT/B3LYP/6-31+G* | DFT/B3LYP/6-311G* | DFT/B3LYP/6-31G** | DFT/B3LYP/6-31G* |
| d | –3.287 | –3.943 | –3.950 | –4.538 | –5.087 | –4.798 | –4.904 |
| c | –5.110 | –5.812 | –5.822 | –6.618 | –7.433 | –7.797 | –7.945 |
| f | –7.693 | –8.776 | –8.779 | –10.776 | –11.825 | –12.560 | –12.755 |
| g | –11.064 | –12.772 | –12.770 | –14.403 | –16.568 | –16.689 | –17.025 |
| h | –14.657 | –16.927 | –16.861 | –19.474 | –22.138 | –22.662 | –23.131 |
| I | –18.792 | –21.811 | –21.785 | –23.814 | –26.788 | –26.186 | –26.633 |
| J | –22.357 | –25.827 | –25.787 | –29.020 | –32.532 | –32.388 | –32.869 |
| K | –25.262 | –29.277 | –29.256 | –31.211 | –35.398 | –34.148 | –34.599 |
| L | –28.857 | –33.353 | –33.284 | –37.044 | –41.339 | –40.843 | –41.429 |
| M | –30.809 | –35.807 | –35.722 | –37.778 | –42.835 | –40.642 | –41.079 |
 .
.
Table 4. Stability of Cluster Structure Energy Per H Bonds (kcal mol–1); c (Docking N–H···:O), d (Docking O–H···:N), f (the Open-Chain Structure with 2-Docking N–H···:O), g (3-Fold), h (3-Fold and Docking), i (4-Fold), j (4-Fold and Docking), k (5-Fold), l (5-Fold and Docking), and m (6-Fold)a.
| basis
sets |
|||||||
|---|---|---|---|---|---|---|---|
| cluster | DFT/B3LYP/6-31++G(2df,2p) | DFT/B3LYP/6-311++G** | DFT/B3LYP/6311+G** | DFT/B3LYP/6-31+G* | DFT/B3LYP/6-311G* | DFT/B3LYP/6-31G** | DFT/B3LYP/6-31G* |
| d | –3.287 | –3.943 | –3.950 | –4.538 | –5.087 | –4.798 | –4.904 |
| c | –5.110 | –5.812 | –5.822 | –6.618 | –7.433 | –7.797 | –7.945 |
| f | –3.846 | –4.388 | –4.390 | –5.388 | –5.912 | –6.280 | –6.378 |
| g | –3.688 | –4.257 | –4.257 | –4.801 | –5.523 | –5.563 | –5.675 |
| h | –3.664 | –4.232 | –4.215 | –4.869 | –5.534 | –5.665 | –5.783 |
| i | –4.698 | –5.453 | –5.446 | –5.954 | –6.697 | –6.547 | –6.658 |
| j | –4.471 | –5.165 | –5.157 | –5.804 | –6.506 | –6.478 | –6.574 |
| k | –5.052 | –5.855 | –5.851 | –6.242 | –7.080 | –6.829 | –6.920 |
| L | –4.809 | –5.559 | –5.547 | –6.174 | –6.890 | –6.807 | –6.905 |
| M | –5.135 | –5.968 | –5.954 | –6.296 | –7.140 | –6.774 | –6.847 |
 .
.
2.3. Characterization of the Methylpentynol–Azide Clusters’ Potential Energy Surfaces
Here, we have presented level benchmark calculations of the interaction energies of the H-bonding cluster structures constituting methylpentynol–azide clusters to achieve the regiochemical outcome of 1,3-DC reactions. The obtained results highlighted the importance of the diffuse basis set functions for the accurate prediction of the energy data using the DFT functional. In terms of 6-31+G*, the functions of polarization and diffuse were just added to the heavier atoms. The basis set 6-31++G** puts the functions of polarization and diffuse on the hydrogen atoms as well. The results from 6-31+G* may be similar to those obtained with 6-31++G**, if the interactions do not involve hydrogen bonding (except for the lower absolute energies).
Tables 3 and 4 include the three-dimensional diagrams. The three dimensions are (1) the cluster structure energy per H bonds (kcal mol–1), (2) the applied basis sets in the benchmark calculations of the interaction energies of the H-bonding cluster structures, and (3) the cluster structures state (c to m) energy (in Table 4, this part was calculated and shown for per H bonds).
As briefly mentioned in the previous section, the H bond is along with relative stability for all studied cluster structures. Furthermore, the results depicted in Table 3 have shown the willingness of a downward trend of the cluster structure energy in each azide addition step, which means increase in the stability of the cluster structure. Eq 1 was applied to calculate the results shown in Table 3.
| 1 |
The results shown in Table 4 are based on the assumption that there is equal stability energy for all types of H bonds in H-bonding arrays (c, d, and f) and methylpentynol–azide clusters (g–m). Therefore, to achieve the data given in Table 4, the recorded data in Table 3 were divided based on number of H bonds in the structures.
Because of the results shown in Tables 3 and 4, it is possible to compare the seven used basis sets. The potential energies are explicitly sensitive to the basis set choice, but their change trends are almost the same for all clusters. In review of the basis sets from the first (1: 6-31G*; the simplest) to the seventh [7: 6-31++G(2df,2p); the most augmented], the observations are as follows:
In the comparison of (1) 6-31G* and (2) 6-31G** (in which 2: 6-31G** added “p” polarization functions for hydrogen to 1: 6-31G*), the results change somewhat toward the benchmark method [DFT/B3LYP/6-311++G(2df,2p) method]. However, these changes are minor. The obtained ΔE (in kcal mol–1) from these two basis sets (1: 6-31G* and 2: 6-31G**) for H-bonding arrays (d, c, and f) and methylpentynol–azide clusters (g–m) is as follows (see Table 3): 0.106 (for “d”); 0.148 (for “c”); 0.195 (for “f”); 0.336 (for “g”); 0.469 (for “h”); 0.447 (for “i”); 0.481 (for “j”); 0.451 (for “k”); 0.586 (for “l”); and 0.437 (for “m”).
In the comparison of (1) 6-31G* and (3) 6-311G* [in which 3: 6-311G* is a split-valence triple-zeta basis that added one Gaussian-type orbital (GTO) to 1: 6-31G], the results for “d”, “i”, “j”, “k”, “l”, and “m” become more distant from those of the benchmark method (DFT/B3LYP/6-311++G(2df,2p) method). These distances of the obtained ΔE (in kcal mol–1) from these two basis sets (1: 6-31G* and 3: 6-311G*) for “d”, “i”, “j”, “k”, “l”, and “m” are as follows (see Table 3): 0.289 (for “d”); 0.602 (for “i”); 0.144 (for “j”); 1.250 (for “k”); 0.496 (for “l”); and 2.193 (for “m”).
In the comparison of (1) 6-31G* and (4) 6-31+G* (in which 4: 6-31+G* added diffuse “s” and “p” functions for nonhydrogen atoms to 1: 6-31G*), the results show significant changes toward the benchmark method (DFT/B3LYP/6-311++G(2df,2p) method). The obtained ΔE (in kcal mol–1) from these two basis sets (1: 6-31G* and 4: 6-31+G*) for H-bonding arrays (d, c, and f) and methylpentynol–azide clusters (g–m) is as follows (see Table 3): 0.260 (for “d”); 1.179 (for “c”); 1.784 (for “f”); 2.286 (for “g”); 3.188 (for “h”); 2.372 (for “i”); 3.368 (for “j”); 2.937 (for “k”); 3.799 (for “l”); and 2.864 (for “m”). The significant differences between results of the (1) 6-31G* basis set and results of the (4) 6-31G* basis set could be ascribed to a rather negative electrostatic charge (δ–) of the involved electronegative atoms in the HBNs, which is also expected to play a decisive role.
As mentioned before, the methods which have diffuse “s” and “p” functions for heavy atoms presented more acceptable results. Therefore, the last four methods [4: 6-31+G*, 5: 6-311+G**, 6: 6-311++G**, and 7: 6-31++G(2df,2p)] are more acceptable. Because of the comparison of (1) 6-31G* and (4) 6-31+G*, which showed that the 6-31+G* basis set is more acceptable, the DFT/B3LYP/6-31+G* method is the basis for comparisons of the last four methods.
In the comparison of (4) 6-31+G* and (5) 6-311+G** (in which 5: 6-311+G** added “p” polarization functions for hydrogen and one GTO to 4: 6-31+G*), the results show significant changes toward the benchmark method [DFT/B3LYP/6-311++G(2df,2p) method]. The obtained ΔE (in kcal mol–1) from these two basis sets (4: 6-31+G* and 5: 6-311+G**) for H-bonding arrays (d, c, and f) and methylpentynol–azide clusters (g–m) is as follows (see Table 3): 0.588 (for “d”); 0.796 (for “c”); 1.997 (for “f”); 1.633 (for “g”); 2.613 (for “h”); 2.029 (for “i”); 3.233 (for “j”); 1.955 (for “k”); 3.760 (for “l”); and 2.056 (for “m”).
In the comparison of (4) 6-31+G* and (6) 6-311++G** (in which 6: 6-311++G** added diffuse functions for hydrogen, “p” polarization functions for hydrogen, and one GTO to 4: 6-31+G*), the results show significant changes toward the benchmark method [DFT/B3LYP/6-311++G(2df,2p) method]. The obtained ΔE (in kcal mol–1) from these two basis sets (4: 6-31+G* and 6: 6-311++G**) for H-bonding arrays (d, c, and f) and methylpentynol–azide clusters (g–m) is as follows (see Table 3): 0.595 (for “d”); 0.806 (for “c”); 2.000 (for “f”); 1.631 (for “g”); 2.547 (for “h”); 2.003 (for “i”); 3.193 (for “j”); 1.934 (for “k”); 3.691 (for “l”); and 1.971 (for “m”).
In the comparison of (4) 6-31+G* and (7) 6-311++G(2df,2p) (in which 7: 6-311++G(2df,2p) added one set of “d” polarization functions and one set of “f” polarization functions to nonhydrogen atoms and also two sets of “p” polarization functions to hydrogen atoms; furthermore, it added diffuse functions for hydrogen also, to 4: 6-31+G*), the results show considerable changes. The obtained ΔE (in kcal mol–1) from these two basis sets [4: 6-31+G* and 7: 6-311++G(2df,2p)] for H-bonding arrays (d, c, and f) and methylpentynol–azide clusters (g–m) is as follows (see Table 3): 1.251 (for “d”); 1.508 (for “c”); 3.083 (for “f”); 3.339 (for “g”); 4.817 (for “h”); 5.022 (for “i”); 6.663 (for “j”); 5.949 (for “k”); 8.187 (for “l”); and 6.969 (for “m”).
The comparison of (5) 6-311+G** and (6) 6-311++G** (in which 6: 6-311++G** added diffuse functions for hydrogen to 5: 6-311+G**) shows almost identical results with high correlation because the diffuse functions for hydrogen do not have an effect on the results of calculations for these clusters in the DFT/B3LYP/6-311++G** method. This was predictable because of the absence of negative charges on the hydrogen atoms in these clusters; however, the sixth method was also used in the calculations to report the results and compare the data. The obtained ΔE (in kcal mol–1) from these two basis sets (5: 6-311+G** and 6: 6-311++G**) for H-bonding arrays (d, c, & f) and methylpentynol–azide clusters (g–m) is as follows (see Table 3): 0.007 (for “d”); 0.010 (for “c”); 0.003 (for “f”); 0.002 (for “g”); 0.066 (for “h”); 0.026 (for “i”); 0.040 (for “j”); 0.021 (for “k”); 0.069 (for “l”); and 0.085 (for “m”).
In these comparisons [e.g., in the comparison of 1: 6-31G* and 2: 6-31G**, the comparison of 4: 6-31+G* and 5: 6-311+G**, and the comparison of 4: 6-31+G* and 7: 6-311++G(2df,2p)], the observations show that the polarization functions have significant effects on the results. The results of the comparison of (5) 6-311+G** and (6) 6-311++G** clearly show that calculations are not affected by diffuse functions for hydrogen. However, the DFT/B3LYP/6-31++G(2df,2p) method was used as the benchmark method because of its flexibility in all aspects including large polarization functions and diffuse functions for all atoms.
As could be seen, the three-dimensional diagram shown in Table 3 has demonstrated a harmony in its convergence and integration, which shows the reliable relationships between the applied methods and basis sets in the applied benchmark calculations of the interaction energies of the H-bonding cluster structures.
2.4. Dipole Moment
The dipole moment surfaces (DMSs) for methylpentynol–azide clusters are constructed as a sum of DMSs for each cluster components. The dipole moment vector of each methylpentynol–azide cluster is represented as a vector sum of effective charges on all involved atoms. The fit expression of the dipole moment vector must be covariant with respect to all permutations of like atoms; that is, it must transform such as a vector under permutations of like atoms. The dipole moments (Debye) of methylpentynol (a) calculated using six basis sets are (1) 1.24, 6-31G* basis set; (2) 1.16, 6-31G** basis set; (3) 1.32, 6-311G* basis set; (4) 1.24, 6-31+G* basis set; (5) 1.21, 6-311+G** basis set; and (6) 1.21, 6-311++G** basis set. Furthermore, these amounts are 1.96, 2.00, 2.03, 2.03, 1.88, and 1.87 for azide (b), respectively. The full DMSs of H-bonding arrays (c–f) and methylpentynol–azide clusters (g–m), which were calculated using six basis sets, are shown in Table 5. In this investigation, H bonds (N–H···:O) in the docking position play a clearly crucial role in the DMS (see Table 5). The results about “d”, “g”, “i”, “k”, and “m” structures that have no N–H···:O type of H bonds in the docking position have shown lower values. The dipole moment amounts of “c”, “h”, “j”, and “l” structures that have N–H···:O type of H bonds in the docking position have shown greater values. However, the dipole moment amount of the “f” structure showed the highest value. The dipole moment amount of the “f” structure in DFT/B3LYP/6-31+G* is 5.78 debye, which is the highest one.
Table 5. Dipole Moment of the Structures (debye) in Six Different Basis Sets; c (Docking N–H···:O), d (Docking O–H···:N), f (the Open-Chain Structure with 2-Docking N–H···:O), g (3-Fold), h (3-Fold and Docking), i (4-Fold), j (4-Fold and Docking), k (5-Fold), l (5-Fold and Docking), and m (6-Fold)a.
| basis
sets |
||||||
|---|---|---|---|---|---|---|
| cluster | DFT/B3LYP/6-311++G** | DFT/B3LYP/6-311+G** | DFT/B3LYP/6-31+G* | DFT/B3LYP/6-311G* | DFT/B3LYP/6-31G** | DFT/B3LYP/6-31G* |
| d | 2.40 | 2.41 | 2.43 | 3.02 | 2.65 | 2.62 |
| c | 4.28 | 4.29 | 4.37 | 4.15 | 4.08 | 4.11 |
| f | 4.90 | 4.91 | 5.78 | 5.08 | 5.49 | 5.63 |
| g | 2.24 | 2.20 | 2.42 | 2.17 | 2.37 | 2.36 |
| h | 4.07 | 4.03 | 4.48 | 4.21 | 4.33 | 4.42 |
| i | 2.21 | 2.20 | 2.43 | 2.02 | 2.27 | 2.24 |
| j | 3.90 | 3.94 | 4.53 | 4.09 | 4.44 | 4.54 |
| k | 2.21 | 2.30 | 2.67 | 2.18 | 2.52 | 2.49 |
| L | 3.74 | 3.70 | 4.40 | 4.05 | 4.56 | 4.64 |
| M | 2.27 | 2.25 | 2.61 | 2.07 | 1.92 | 1.80 |
 .
.
2.5. Thermodynamic and Kinetic Data
The investigation of the cluster structure energy per H bond (see Table 4) showed that the “c” H-bond array (N–H···:O) has the highest amount of stability. However, the “d” H-bond array (O–H···:N) is the most unstable mode in the components of the reaction (see Table 4). Therefore, the “d” H-bond array (O–H···:N) is more suitable than the “c” H-bond array (N–H···:O) to react.
Scheme 1 illustrates the overall pattern of the reaction energy diagram (shown right) and the structure of the reactants (a and b), H-bonding arrays (c–e), products (1 and 2), and TSs (shown left). The obtained data calculated by the DFT/B3LYP method and the used basis sets were as follows: (1) 6-31G*, (2) 6-31G**, (3) 6-311G*, (4) 6-31+G*, (5) 6-311+G**, (6) 6-311++G**, and (7) 6-31++G(2df,2p). In Figure 2, the schematic diagram of the 1,3-DC reaction between methylpentynol (a) and azide (b) to achieve the product (2) using the “d” H-bond array (O–H···:N) was shown. The used data were calculated using seven different basis sets.
Figure 2.

Schematic diagram of the 1,3-DC reaction between methylpentynol (a) and azide (b) to achieve the product (2) using the “d” H-bond array (O–H···:N).
There is almost similar behaviors in the diagrams in Figure 2, on the basis of the obtained results by the benchmark calculations of the interaction energies of the H-bonding cluster structures constituting methylpentynol–azide clusters to achieve the regiochemical outcome of 1,3-DC reactions. However, there are some discussable results. The energy level of the precursors was obtained as the lowest and more stable states using the 6-311G* basis set (light blue line) in comparison with the other applied basis sets. Despite the fact that the energy level of the TS form was more stable than that of DFT-B3LYP/6-311++G** (red line) and DFT-B3LYP/6-311+G** (green line) by the DFT-B3LYP/6-311G* method, the lowest energy level for the TS form was obtained by DFT-B3LYP/6-31G* (gray line), and the energy level of the precursors was also obtained with a bit difference with DFT-B3LYP/6-311G* (light blue line). The obtained results for DFT-B3LYP/6-311++G** (red line) and DFT-B3LYP/6-311+G** (green line) methods are almost the same and/or very near together. Therefore, on the basis of the obtained results, the DFT-B3LYP/6-31G* (gray line) has shown the lowest energy level for the TS state and almost admissible results for the energy level of the precursors in the interaction energies of the H-bonding cluster structures constituting methylpentynol–azide clusters to achieve the regiochemical outcome of 1,3-DC reactions.
In fact, it is evident that the 6-31++G(2df,2p) basis set is the most comprehensive. Eventually, the “d” H-bond array (O–H···:N) and DFT/B3LYP/6-31++G(2df,2p) method were selected as two main items to calculate the thermodynamic (ΔrG and ΔG# in kcal mol–1) and kinetic (rate constants = k in M–1 s–1) data. Eqs 2–4 were applied to calculate details, which are summarized in Table 6. The DFT-calculated results demonstrated that the form “c” is 5.111 and 1.824 kcal mol–1 more stable than “a + b” and “d”, respectively. Because of H bonding, the [TS]2 is 2.386 kcal mol–1 more stable than the [TS]1 from the reaction of “a + b” (see Scheme 1 and Table 6).
Table 6. ΔG and ΔG# Values Were Calculated by the DFT/B3LYP/6-31++G(2df,2p) Method and Rate Constants Were Calculated Using Eyring’s Equation (k).
| product | ΔG# (kcal mol–1) | ΔG (kcal mol–1) | k | log k |
|---|---|---|---|---|
| 1 | 25.054a | –60.309 | 2.682 × 10⁻⁶ | –5.571 |
| 2 (a + b) | 22.668a | –59.881 | 1.504 × 10⁻⁴ | –3.823 |
| 2 (c) | 27.778 | –54.771 | 2.700 × 10⁻⁸ | –7.569 |
| 2 (d) | 25.955 | –56.594 | 5.860 × 10⁻⁷ | –6.232 |
In these cases, there is no H bonding between the precursors. However, in the real states, H bonding takes place between the species.
2.6. HOMO and LUMO and Regioselectivity
Although there is a regioselective orientation for all studied cluster structures [the H-bonding arrays (c, d, and f) and the methylpentynol–azide clusters (g–m)], examination of the topologies shows that each azide in the studied structures has different positions. Also, depending on the stability of structures and structure energy of the highest occupied molecular orbital (HOMO) and lowest unoccupied molecular orbital (LUMO), there is a different reactivity for each studied structure. In earlier structural evidence, it was observed that the “d” H-bond array (O–H···:N) is preferable to other cluster structures in terms of energy and topology.
Herein, the energy (eV) of the HOMO and LUMO (Table 7) is studied to compare the reactivity of cluster structures. The HOMO and LUMO energy levels of the discussed clusters have demonstrated the softness and hardness (acid–base interactions). Also, the HOMO–LUMO energy gaps show the gap between the acid–base interactions in the discussed cluster H-bonding. The lowest energy gap of HOMO–LUMO among the data shown in Table 7 was identified for the “d” H-bond array (O–H···:N) with 5.63 eV, which means that the “d” H-bond array (O–H···:N) is a more suitable case for the discussed reaction.
Table 7. Energy (eV) of the HOMO and LUMO and the Gap between Them (eV)a.
| structure | HOMO (eV) | LUMO (eV) | the gap of HOMO–LUMO (eV) | Mulliken charge of C2 (a.u.) | Mulliken charge of C3 (a.u.) | Δε(a.u.) |
|---|---|---|---|---|---|---|
| ab | –7.52 | –0.33 | 7.19 | –0.168 | 0.130 | 0.298 |
| c | –7.08 | –0.67 | 6.41 | –0.151 | 0.098 | 0.249 |
| d | –7.20 | –1.57 | 5.63 | –0.210 | 0.133 | 0.343 |
| f | –7.38 | –0.95 | 6.43 | –0.152 | 0.080 | 0.232 |
| g | –7.66 | –1.31 | 6.35 | –0.148 | 0.196 | 0.344 |
| h | –7.30 | –1.58 | 5.72 | –0.152 | 0.111 | 0.263 |
| I | –7.77 | –1.46 | 6.31 | –0.138 | 0.137 | 0.275 |
| J | –7.36 | –1.61 | 5.75 | –0.167 | 0.115 | 0.282 |
| K | –7.81 | –1.58 | 6.23 | –0.158 | 0.109 | 0.267 |
| L | –7.43 | –1.64 | 5.79 | –0.172 | 0.069 | 0.241 |
| M | –7.81 | –1.62 | 6.19 | –0.157 | 0.100 | 0.257 |
Mulliken charge of carbon atoms of acetylene.  .
.
The data are just for methylpentynol (a).
2.7. Mulliken Charge and Regioselectivity
The results have shown that the interplay between cooperative hydrogen bonding and a Mulliken charge of carbon atoms of acetylene may be an efficient theme in regioselectivity in this reaction. During the formation of HBNs (depicted in Table 7 and Figure 3), significant shifts were observed in the Mulliken charge of carbon atoms of acetylene for “d” and “g”. Because of this function, it may lead to more regioselectivity in the 1,4-product (2) formation and the facility of the simultaneous reaction would increase.
Figure 3.

Orbital energy (eV) of the HOMO and LUMO and the Mulliken charge of some atoms, related to DFT/B3LYP/6-31++G(2df,2p) (pictured left); the property range for the electrostatic potential map is from −172.242 to 243.491 (kJ mol–1) and the dipole moment vector (μ: 2.40 debye), related to DFT/B3LYP/6-311++G** (pictured right).
The amount of the difference between the values of Mulliken charges of acetylene carbon atoms (Δε(a.u.)) was calculated in all structures including methylpentynol by the DFT/B3LYP/6-31++G(2df,2p) method. These amounts are impressive, ranging from 0.232 to 0.344. The biggest amounts of the Mulliken charge differences were obtained for “d” (0.343 a.u.) and “g” (0.344 a.u.).
3. Conclusions
In this study, components as free molecules (a) and (b), the arrays of HBNs (c–f), and methylpentynol–azide clusters (g–m) were investigated. The clusters and orientations of the molecules beside each other have not been investigated before as the certain affecting factor on the regioselectivity of the 1,3-DC reaction. Increasing the size of the intended system increases the computational requirements, which causes lots of restrictions in carrying out quantum chemical calculations for involved systems with very large numbers of molecules. Here, a thermodynamic predicted model has examined the orientation on the modeled structures. Also, the geometries and properties of some methylpentynol–HN3 clusters were presented. The obtained results clearly showed that there was a close correlation between the H-bonding effect and the formation of the methylpentynol–HN3 clusters. Regioselectivity was easily predicted using all examined structures, but this issue was more significant in the case of the “d” H-bond array (O–H···:N) consisting of one methylpentynol and one azide molecule. With regard to the results of this study, it seems that the use of a limited amount of the reactant (a) could be a regioselectivity pathway.
4. Computational Method
The simulation of gas-phase methylpentynol–azide clusters based on HBNs was the first step of the present study. This goal was complemented with determining the preferred structures [methylpentynol (M), azide (A), and nA + M (MAn); 1 ≤ n ≤ 5]. The calculations were conducted on a comprehensive set of methylpentynol–HN3 clusters.
The density functional theory (DFT) calculation was performed in this investigation. The DFT calculations reported were carried out using the Spartan ‘10 package.45 The B3LYP (the combination of the new Becke’s exchange potential46 and the nonlocal correlation functional of Lee, Yang, and Parr47) method was applied for calculations. All the accepted geometric arrangements were optimized based on seven different basis sets. The used basis sets are as follows: (1) 6-31G*, (2) 6-31G**, (3) 6-311G*, (4) 6-31+G*, (5) 6-311+G**, (6) 6-311++G**, and (7) 6-31++G(2df,2p). For more information about basis sets, view ref (48).
The compared structural data of calculations and all structures’ geometries are shown in the comprehensive tabulations. Data show that there is only a small difference between DFT/B3LYP/6-311+G** and DFT/B3LYP/6-311++G**. The absence of the negative charge on the hydrogen atoms is the nature and origin of this similarity in these methods for clusters in this study. DFT/B3LYP/6-311++G** has diffuse “s” and “p” functions for nonhydrogen atoms and diffuse functions for hydrogen as well, so it is not economical in terms of time. However, this method was used to make a comparison between the data. DFT/B3LYP/6-31++G(2df,2p) is a method with high accuracy because it covers all aspects. This method has a more flexible and larger basis set with two sets of “d” polarization functions and one set of “f” polarization functions to nonhydrogen atoms and also two sets of “p” polarization functions to hydrogen atoms; furthermore, it has diffuse “s” and “p” functions for heavy atoms (atoms other than H and He) and diffuse functions for hydrogen as well. Thus, using this method can be beneficial to evaluate the thermodynamic (ΔrG and ΔG# in kcal mol–1) and kinetic (rate constants = k in M–1 s–1 and log k) data of the 1,3-DC reactions of methylpentynol (a) with azide (b).
The TSs were optimized based on the discussed Huisgen reaction, which introduces a concerted mechanism. The principal demand was the rate constants of reactions that were obtained using the Eyring equation, in agreement with the TS theory49
| 2 |
where k is the reaction rate constant, kB is Boltzmann’s constant, T is the absolute temperature, h is Planck’s constant, ΔG# is the Gibbs energy of activation, and R is the gas constant. All inputs are constant and only free activation energies (ΔG#) are variable, which were achieved as follows
| 3 |
In addition, the free energy changes of the reactions (ΔrG) were achieved at 298.15 K using the following equation
| 4 |
The computations of the ground states, energies of the HOMO and LUMO, and the ΔEHOMO–LUMO of product structures of the suggested molecules in vacuum have been performed by the DFT/B3LYP/6-31++G(2df,2p) method. The structures of the precursor, TSs, and the 1,3-DC process to receive the product derivatives have been computed. The graphs and the related tables demonstrate the appropriate data.
Acknowledgments
The authors are thankful to the Theoretical and Computational Research Center of Chemistry Faculty of Razi University-Kermanshah-Iran for ample provisions of computational facilities.
Supporting Information Available
The Supporting Information is available free of charge at https://pubs.acs.org/doi/10.1021/acsomega.9b04333.
Structural data of methylpentynol–azide clusters (f–m) calculated using seven different basis sets (PDF)
The authors declare no competing financial interest.
Supplementary Material
References
- Gothelf K. V.; Jørgensen K. A. Asymmetric 1,3-dipolar cycloaddition reactions. Chem. Rev. 1998, 98, 863. 10.1021/cr970324e. [DOI] [PubMed] [Google Scholar]
- Padwa A.; Pearson W. H.. Synthetic Applications of 1,3-Dipolar Cycloaddition Chemistry toward Heterocycles and Natural Products; John Wiley & Sons, 2003; Vol. 59. [Google Scholar]
- Taherpour A.; Ghasemhezaveh F.; Yari A.; Khodaei M. M. N2 elimination thermolysis reactions of 9-(4-and 5-substituted-1, 2, 3-triazol-1-yl) acridines to produce 1H-pyrido-[4, 3, 2-kl] derivatives–A theoretical study. Chem. Phys. Lett. 2017, 676, 154. 10.1016/j.cplett.2017.03.057. [DOI] [Google Scholar]
- Dalvie D. K.; Kalgutkar A. S.; Khojasteh-Bakht S. C.; Obach R. S.; O’Donnell J. P. Biotransformation reactions of five-membered aromatic heterocyclic rings. Chem. Res. Toxicol. 2002, 15, 269. 10.1021/tx015574b. [DOI] [PubMed] [Google Scholar]
- Kumar K. A. Comprehensive review on Huisgen’s cycloaddition reactions. Int. J. ChemTech Res. 2013, 5, 3032. [Google Scholar]
- Houk K. N.; Sims J.; Watts C. R.; Luskus L. J. Origin of reactivity, regioselectivity, and periselectivity in 1, 3-dipolar cycloadditions. J. Am. Chem. Soc. 1973, 95, 7301. 10.1021/ja00803a018. [DOI] [Google Scholar]
- Sustmann R. A simple model for substituent effects in cycloaddition reactions. I. 1, 3-dipolar cycloadditions. Tetrahedron Lett. 1971, 12, 2717. 10.1016/s0040-4039(01)96961-8. [DOI] [Google Scholar]
- Sustmann R. Orbital energy control of cycloaddition reactivity. Pure Appl. Chem. 1974, 40, 569. 10.1351/pac197440040569. [DOI] [Google Scholar]
- Sauer J. r.; Sustmann R. Mechanistic aspects of Diels-Alder reactions: a critical survey. Angew. Chem., Int. Ed. Engl. 1980, 19, 779. 10.1002/anie.198007791. [DOI] [Google Scholar]
- Houk K.; Yamaguchi K.. 1,3-Dipolar Cycloaddition Chemistry; Padwa A., Ed.; Wiley, 1984; p 407. [Google Scholar]
- Tron G. C.; Pirali T.; Billington R. A.; Canonico P. L.; Sorba G.; Genazzani A. A. Click chemistry reactions in medicinal chemistry: Applications of the 1, 3-dipolar cycloaddition between azides and alkynes. Med. Res. Rev. 2008, 28, 278. 10.1002/med.20107. [DOI] [PubMed] [Google Scholar]
- Gothelf K. V.Asymmetric metal-catalyzed 1,3-dipolar cycloaddition reactions. Cycloaddition Reactions in Organic Synthesis; Wiley-VCH, 2001; p 211. [Google Scholar]
- Rostovtsev V. V.; Green L. G.; Fokin V. V.; Sharpless K. B. A stepwise huisgen cycloaddition process: copper (I)-catalyzed regioselective “ligation” of azides and terminal alkynes. Angew. Chem., Int. Ed. 2002, 41, 2596.. [DOI] [PubMed] [Google Scholar]
- Tornøe C. W.; Christensen C.; Meldal M. Peptidotriazoles on solid phase:[1, 2, 3]-triazoles by regiospecific copper (I)-catalyzed 1, 3-dipolar cycloadditions of terminal alkynes to azides. J. Org. Chem. 2002, 67, 3057. 10.1021/jo011148j. [DOI] [PubMed] [Google Scholar]
- Zhang L.; Chen X.; Xue P.; Sun H. H. Y.; Williams I. D.; Sharpless K. B.; Fokin V. V.; Jia G. Ruthenium-catalyzed cycloaddition of alkynes and organic azides. J. Am. Chem. Soc. 2005, 127, 15998. 10.1021/ja054114s. [DOI] [PubMed] [Google Scholar]
- Latimer W. M.; Rodebush W. H. Polarity and ionization from the standpoint of the Lewis theory of valence. J. Am. Chem. Soc. 1920, 42, 1419. 10.1021/ja01452a015. [DOI] [Google Scholar]
- Olovsson I. The role of the lone pairs in hydrogen bonding. Z. Phys. Chem. 2006, 220, 963. 10.1524/zpch.2006.220.7.963. [DOI] [Google Scholar]
- Hobza P.; Havlas Z. Blue-shifting hydrogen bonds. Chem. Rev. 2000, 100, 4253. 10.1021/cr990050q. [DOI] [PubMed] [Google Scholar]
- Belkova N. V.; Shubina E. S.; Epstein L. M. Diverse world of unconventional hydrogen bonds. Acc. Chem. Res. 2005, 38, 624. 10.1021/ar040006j. [DOI] [PubMed] [Google Scholar]
- Grabowski S. J.; Sokalski W. A.; Leszczynski J. Can H... σ, π... H+... σ and σ... H+... σ interactions be classified as H-bonded?. Chem. Phys. Lett. 2006, 432, 33. 10.1016/j.cplett.2006.10.069. [DOI] [Google Scholar]
- de Oliveira B. G.; Ramos M. N. Dihydrogen bonds and blue-shifting hydrogen bonds: A theoretical study of AH··· HCF3 and TH2··· HCF3 model systems with A= Li or Na and T= Be or Mg. Int. J. Quantum Chem. 2010, 110, 307. 10.1002/qua.21995. [DOI] [Google Scholar]
- Desiraju G. R.; Steiner T.. The Weak Hydrogen Bond: In Structural Chemistry and Biology; International Union of Crystal, 2001; Vol. 9. [Google Scholar]
- Suhm M. A.Hydrogen bond dynamics in alcohol clusters. Advances in Chemical Physics; Wiley, 2009; Vol. 142, p 1. [Google Scholar]
- Kazachenko S.; Bulusu S.; Thakkar A. J. Methanol clusters (CH3OH) n: Putative global minimum-energy structures from model potentials and dispersion-corrected density functional theory. J. Chem. Phys. 2013, 138, 224303. 10.1063/1.4809528. [DOI] [PubMed] [Google Scholar]
- Bolander R. W.; Kassner J. L. Jr.; Zung J. T. Semiempirical determination of the hydrogen bond energy for water clusters in the vapor phase. I. General theory and application to the dimer. J. Chem. Phys. 1969, 50, 4402. 10.1063/1.1670910. [DOI] [Google Scholar]
- Saenger W. Circular hydrogen bonds. Nature 1979, 279, 343. 10.1038/279343a0. [DOI] [Google Scholar]
- Jeon I.-S.; Ahn D.-S.; Park S.-W.; Lee S.; Kim B. Structures and isomerization of neutral and zwitterion serine–water clusters: Computational study. Int. J. Quantum Chem. 2005, 101, 55. 10.1002/qua.20269. [DOI] [Google Scholar]
- Henschel H.; Navarro J. C. A.; Yli-Juuti T.; Kupiainen-Määttä O.; Olenius T.; Ortega I. K.; Clegg S. L.; Kurtén T.; Riipinen I.; Vehkamäki H. Hydration of atmospherically relevant molecular clusters: Computational chemistry and classical thermodynamics. J. Phys. Chem. A 2014, 118, 2599. 10.1021/jp500712y. [DOI] [PubMed] [Google Scholar]
- Knochenmuss R.; Cheshnovsky O.; Leutwyler S. Proton transfer reactions in neutral gas-phase clusters: 1-naphthol with H2O, D2O, CH3OH, NH3 and piperidine. Chem. Phys. Lett. 1988, 144, 317. 10.1016/0009-2614(88)87121-5. [DOI] [Google Scholar]
- Swope W. C.; Andersen H. C.; Berens P. H.; Wilson K. R. A computer simulation method for the calculation of equilibrium constants for the formation of physical clusters of molecules: Application to small water clusters. J. Chem. Phys. 1982, 76, 637. 10.1063/1.442716. [DOI] [Google Scholar]
- Reimers J. R.; Watts R. O. The structure and vibrational spectra of small clusters of water molecules. Chem. Phys. 1984, 85, 83. 10.1016/s0301-0104(84)85175-7. [DOI] [Google Scholar]
- Kim K. S.; Dupuis M.; Lie G. C.; Clementi E. Revisiting small clusters of water molecules. Chem. Phys. Lett. 1986, 131, 451. 10.1016/0009-2614(86)80564-4. [DOI] [Google Scholar]
- George W. O.; Jones B. F.; Lewis R. Water and its homologues: a comparison of hydrogen–bonding phenomena. Philos. Trans. R. Soc., A 2001, 359, 1611. 10.1098/rsta.2001.0868. [DOI] [Google Scholar]
- David J.; Guerra D.; Restrepo A. Structural characterization of the (methanol) 4 potential energy surface. J. Phys. Chem. A 2009, 113, 10167. 10.1021/jp9041099. [DOI] [PubMed] [Google Scholar]
- Estrin D. A.; Paglieri L.; Corongiu G.; Clementi E. Small clusters of water molecules using density functional theory. J. Phys. Chem. 1996, 100, 8701. 10.1021/jp950696w. [DOI] [Google Scholar]
- Larsen R. W.; Suhm M. The benefits of alternation and alkylation: large amplitude hydrogen bond librational modes of alcohol trimers and tetramers. Phys. Chem. Chem. Phys. 2010, 12, 8152. 10.1039/b925578h. [DOI] [PubMed] [Google Scholar]
- Ohno K.; Okimura M.; Akai N.; Katsumoto Y. The effect of cooperative hydrogen bonding on the OH stretching-band shift for water clusters studied by matrix-isolation infrared spectroscopy and density functional theory. Phys. Chem. Chem. Phys. 2005, 7, 3005. 10.1039/b506641g. [DOI] [PubMed] [Google Scholar]
- Xantheas S. S.; Burnham C. J.; Harrison R. J. Development of transferable interaction models for water. II. Accurate energetics of the first few water clusters from first principles. J. Chem. Phys. 2002, 116, 1493. 10.1063/1.1423941. [DOI] [Google Scholar]
- Vaitheeswaran S.; Yin H.; Rasaiah J. C.; Hummer G. Water clusters in nonpolar cavities. Proc. Natl. Acad. Sci. 2004, 101, 17002. 10.1073/pnas.0407968101. [DOI] [PMC free article] [PubMed] [Google Scholar]
- Ramírez F.; Hadad C. Z.; Guerra D.; David J.; Restrepo A. Structural studies of the water pentamer. Chem. Phys. Lett. 2011, 507, 229. 10.1016/j.cplett.2011.03.084. [DOI] [Google Scholar]
- Pérez J. F.; Hadad C. Z.; Restrepo A. Structural studies of the water tetramer. Int. J. Quantum Chem. 2008, 108, 1653. 10.1002/qua.21615. [DOI] [Google Scholar]
- Karpfen A.; Ladik J.; Russegger P.; Schuster P.; Suhai S. n. Hydrogen bonding in long chains of hydrogen fluoride and long chains and large clusters of water molecules. Theor. Chim. Acta 1974, 34, 115. 10.1007/bf00551362. [DOI] [Google Scholar]
- Topić F.; Lisac K.; Arhangelskis M.; Rissanenb K.; Cinčićc D.; Friščića T. Cocrystal trimorphism as a consequence of orthogonality of halogen-and hydrogen-bonds. Chem.—Eur. J. 2008, 14, 10149. [DOI] [PubMed] [Google Scholar]
- Io A.; Kawatsu T.; Tachikawa M. Quantum Stabilization of the Frustrated Hydrogen Bonding Structure in the Hydrogen Fluoride Trimer. J. Phys. Chem. A 2019, 123, 7950. 10.1021/acs.jpca.9b04407. [DOI] [PubMed] [Google Scholar]
- Spatran’10-Quantum Mechanics Program: (PC/x86)-1.1.0v4.2011; Wavefunction Inc.: USA.
- Becke A. D. Density-functional thermochemistry. I. The effect of the exchange-only gradient correction. J. Chem. Phys. 1992, 96, 2155. 10.1063/1.462066. [DOI] [Google Scholar]; Becke A. D. Density-functional thermochemistry. III. The role of exact exchange. J. Chem. Phys. 1993, 98, 5648. 10.1063/1.464913. [DOI] [Google Scholar]
- Lee C.; Yang W.; Parr R. G. Development of the Colle-Salvetti correlation-energy formula into a functional of the electron density. Phys. Rev. B: Condens. Matter Mater. Phys. 1988, 37, 785. 10.1103/physrevb.37.785. [DOI] [PubMed] [Google Scholar]
- Horn A. H.Essentials of Computational Chemistry, Theories and Models By Christopher J. Cramer; Wiley: Chichester, England, 2002. [Google Scholar]
- Atkins P. W.Physical Chemistry, 6; Oxford University Press: Oxford, 1998. [Google Scholar]
Associated Data
This section collects any data citations, data availability statements, or supplementary materials included in this article.