Abstract
We hypothesized that dynamic perfluorinated gas MRI would sensitively detect mild cystic fibrosis (CF) lung disease. This cross-sectional study enrolled 20 healthy volunteers and 24 stable subjects with CF, including a subgroup of subjects with normal forced expiratory volume in the first second (FEV1; >80% predicted, n = 9). Dynamic fluorine-19–enhanced MRI (19F MRI) were acquired during sequential breath holds while breathing perfluoropropane (PFP) and during gas wash-out. Outcomes included the fraction of lung without significant ventilation (ventilation defect percent, VDP) and time constants that described PFP wash-in and wash-out kinetics. VDP values (mean ± SD) of healthy controls (3.87% ± 2.7%) were statistically different from moderate CF subjects (19.5% ± 15.5%, P = 0.001) but not from mild CF subjects (10.4% ± 9.9%, P = 0.24). In contrast, the fractional lung volume with slow gas wash-out was elevated both in subjects with mild (9.61% ± 4.87%; P = 0.0066) and moderate CF (16.01% ± 5.01%; P = 0.0002) when compared with healthy controls (3.84% ± 2.16%) and distinguished mild from moderate CF (P = 0.006). 19F MRI detected significant ventilation abnormalities in subjects with CF. The ability of gas wash-out kinetics to distinguish between healthy and mild CF lung disease subjects makes 19F MRI a potentially valuable method for the characterization of early lung disease in CF. This study has been registered at ClinicalTrials.gov (NCT03489590).
Keywords: Pulmonology
Keywords: Diagnostic imaging
Assessment of gas wash-out kinetics was more sensitive to mild CF lung disease than quantitation of steady state ventilation defects, making 19F MRI a potentially valuable method for characterizing early lung disease in CF.
Introduction
In the era of highly effective cystic fibrosis transmembrane conductance regulator (CFTR) modulator therapy, new outcome measures that accurately reflect treatment effects and sensitively detect mild CF lung disease are needed. Typical clinical trial endpoints (e.g., spirometry, exacerbation frequency) require large sample sizes and have limited utility in young and mildly affected patients. Lung clearance index (LCI) is increasingly used in pediatric studies, but it is time consuming and difficult to perform in subjects with more advanced lung disease. Furthermore, these global lung assessments can be insensitive to regional changes in airflow obstruction, inflammation, and bronchiectasis (1). In contrast, high-resolution CT is able to detect focal disease (2) but requires radiation exposure and provides little physiologically relevant functional information outside of gas trapping.
MRI is rapidly emerging as an imaging modality that can detect both structural and functional changes within the lung without radiation exposure (3–7). This capability is particularly useful in CF, where bronchiectasis may be quite focal, especially early in the disease process. Recent advances in MR technology, including the development of ultra-short echo time (UTE) sequences and standardized CF scoring systems, have greatly improved the ability of MRI to visualize lung structure and will be essential for the conduct of multicenter studies (8). The use of inhaled hyperpolarized gases (e.g., 3He, 129Xe) allows identification of regional ventilation defects (i.e., a functional assessment), but it requires sophisticated gas polarizers and is generally limited to single breath-hold image acquisitions due to consumption of the hyperpolarized gas. In contrast, fluorine-19–enhanced MRI (19F MRI), using commercially available perfluoropropane (PFP) as the inhaled contrast agent, does not require external gas polarization; this feature allows characterization of regional ventilation kinetics using multiple breath sequences. PFP has low blood solubility, no known anesthetic effects, and extremely short spin-lattice relaxation times (~18 ms), making rapid image acquisition possible. Finally, PFP inhalation has been shown to be safe in healthy volunteers and patients with lung disease (9–11).
In this study, we assessed the ability of dynamic 19F MRI to characterize regional ventilation in healthy volunteers and subjects with CF. We hypothesized that ventilation defects would be identified by 19F MRI in CF subjects after multiple cycles of PFP inhalation. We further hypothesized that characterization of ventilation kinetics, via calculation of regional gas wash-in and wash-out time constants, would further increase the sensitivity of this modality to detect early ventilation abnormalities.
Results
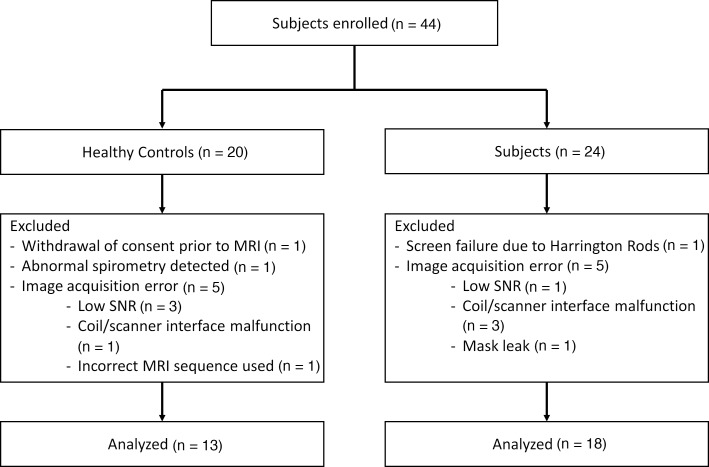
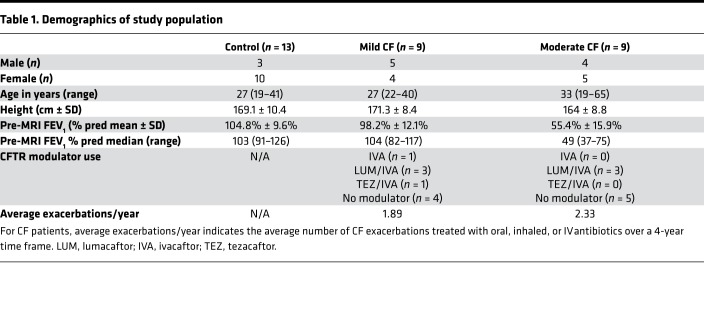
Forty-four subjects were recruited (20 healthy volunteers and 24 subjects with CF). Thirteen subjects (7 healthy and 6 CF) were excluded from analysis due to (a) withdrawal of consent prior to MRI (n = 1), (b) screen failure due to the presence of Harrington rods (n = 1), and (c) technical issues that interfered with image acquisition (n = 10). Furthermore, 1 healthy male subject was excluded from analysis upon data review, as spirometry demonstrated an abnormal restrictive pattern and the subject was suspected to have undiagnosed lung disease. Figure 1 details the reasons for subject exclusion from analysis. Technical problems were primarily encountered early in the study and waned as the study team gained experience with study procedures. Therefore, 13 healthy controls and 18 subjects with CF had full data sets available for analysis (Table 1).
Figure 1. Consort diagram detailing reasons for subject exclusion from analysis.
Table 1. Demographics of study population.
Mean forced expiratory volume in the first second (FEV1) percent predicted for healthy controls was 104.8% ± 9.6% (range 91–126), and mean FEV1 percent predicted for all CF subjects was 76.8% ± 25.9% (range 37–117). Nine CF subjects in a “mild CF” cohort (defined as FEV1 ≥ 80% predicted) had an average FEV1 of 98.2% ± 12.1%. In the remaining CF subjects, spirometry reflected moderate/severe disease severity (mean FEV1, 55.4% ± 15.9%; n = 9).
After gas exposure, no meaningful changes in mean FEV1 in either healthy control (mean change in FEV1, 0.5% ± 3.1%, P = 0.65) or CF subjects (mean change in FEV1, 0.89% ± 2.14%, P = 0.13) were observed. Oxygen saturation remained over 90% in all subjects during study procedures, and no serious adverse events were noted. Two subjects noted a transient decrease in voice pitch (1 control, 1 CF), which returned to normal within several minutes after cessation of gas inhalation; this response was a known effect related to the increased density of the gas mixture compared with room air.
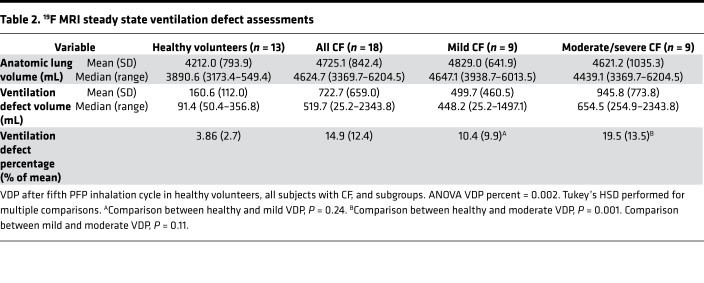
Table 2 provides the absolute and fractional ventilation defect volumes in each study group. Ventilation defect percentage (VDP) values were significantly higher in CF subjects than healthy volunteers (14.9% ± 12.4% vs. 3.86% ± 2.7%, P = 0.004). Although a trend of higher VDPs in the mild CF group compared with healthy controls was observed, this difference was not statistically significant (10.4% ± 9.9% vs. 3.86% ± 2.7%, P = 0.24). In sensitivity analyses, similar statistical results were obtained when using alternative definitions for a ventilation defect (Supplemental Tables 1 and 2; supplemental material available online with this article; https://doi.org/10.1172/jci.insight.133400DS1).
Table 2. 19F MRI steady state ventilation defect assessments.
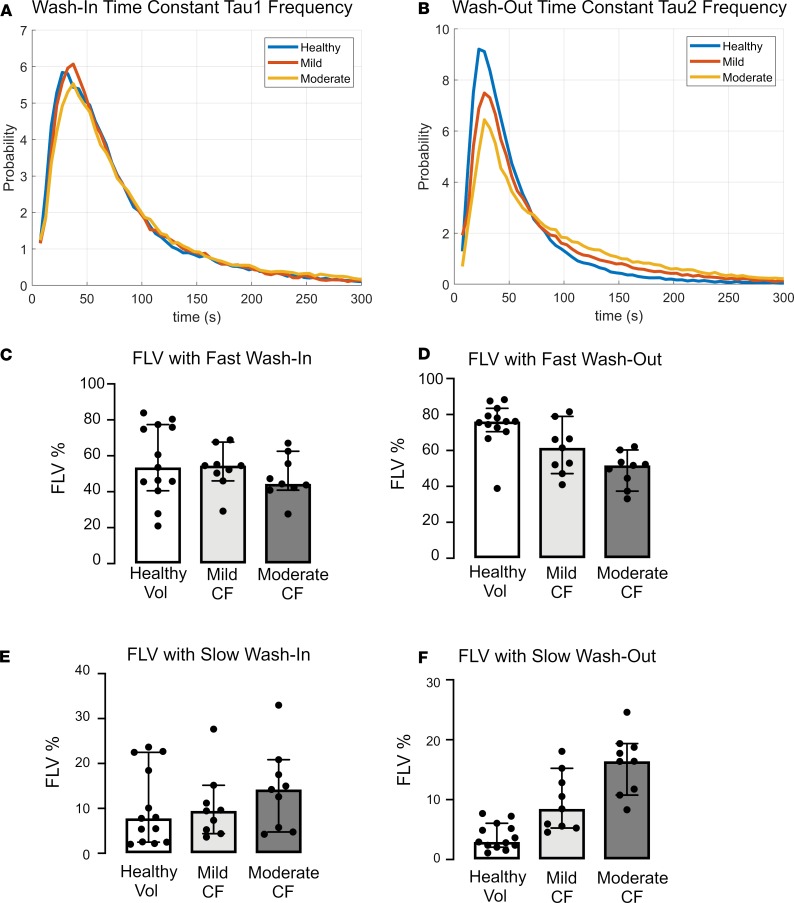
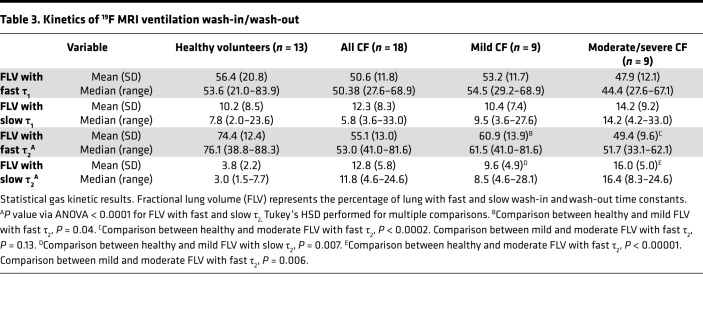
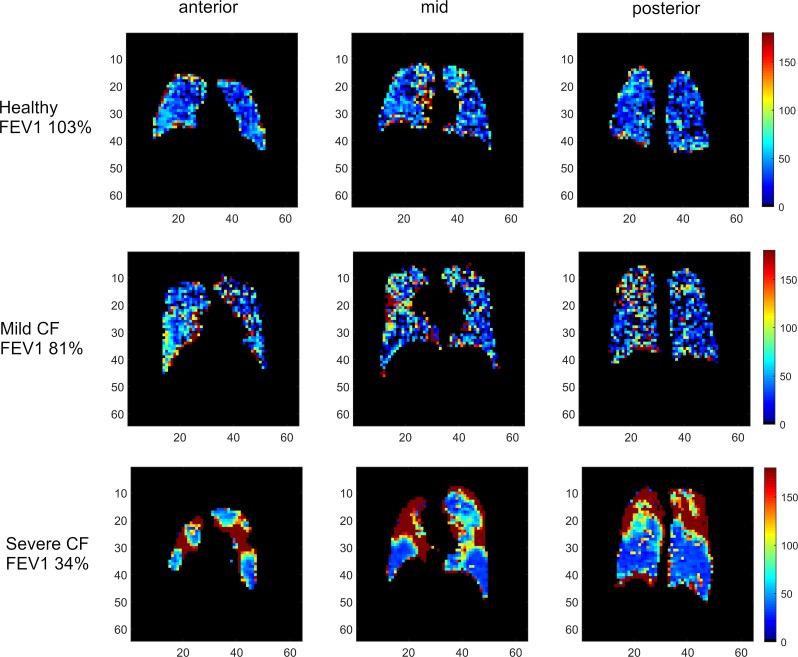
We next examined time constants that describe the rates of gas wash-in (τ1) and wash-out (τ2). The frequency of each time constant within the ventilated lung was plotted. Examination of these histograms (Figure 2, A and B) suggested that τ2 better discriminated between study groups than τ1. Using clustering analysis as described in the methods, the thresholds describing abnormal τ1 and τ2 were 64.44 seconds or 175.66 seconds for fast and slow kinetics, respectively. These were applied to quantitate the fraction of lung volume (FLV) occupied by voxels with fast or slow filling (τ1) or emptying (τ2) in each subject (Figure 2, C–F). As shown in Figure 2 and Table 3, the FLV with slow wash-out (τ2 > 175.66 seconds) and fast wash-out (τ2 < 64.44 seconds) discriminated between each of the study groups, including between healthy volunteers and mild CF subjects (3.8% ± 2.2% vs. 9.6% ± 4.9%, P = 0.007 for slow wash-out; 74.4% ± 12.4% vs. 60.9% ± 13.9%, P = 0.04 for fast wash-out). No differences were observed in either fast or slow wash-in. Figure 3 provides color-coded heatmaps of τ2 values in individual subjects from each group.
Figure 2. Ventilation Kinetics Analysis.
(A and B) Histograms of wash-in (A) and wash-out (B) time constants for healthy controls, mild CF subjects, and moderate CF subjects. (C–F) Scatter and box plots (median ± 95% CI) demonstrating FLV of fast wash-in (C), fast wash-out (D), slow wash-in (E), and slow washout (F). ANOVA. Tukey’s honest significance test (HSD) was performed for multiple between-group comparisons. Slow emptying fraction: healthy vs. mild CF, P = 0.007; mild CF vs. mod CF, P = 0.006. Fast emptying fraction: healthy vs. mild CF, P = 0.04; mild vs. moderate CF, P = 0.13).
Table 3. Kinetics of 19F MRI ventilation wash-in/wash-out.
Figure 3. Representative color-coded heatmaps of τ2, demonstrating distribution of voxels with prolonged gas wash-out.
The x and y axes are marked in centimeters. (A) Healthy control. (B) Mild CF. (C) Moderate CF.
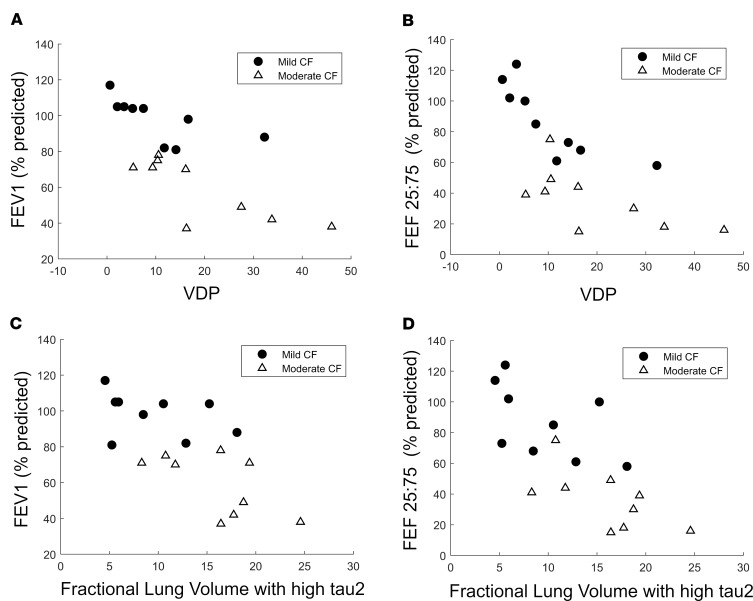
As spirometry is the most commonly used measurement to assess the presence of lung disease in CF, we examined the relationship between spirometric parameters (FEV1; FEF25–75) and MRI ventilation indices (VDP; FLV with slow τ2) (Figure 4). VDP showed significant negative correlations with FEV1 (rho = –0.703; P = 0.001) and FEF25–75 (rho = –0.686; P = 0.0015). Similarly, strong negative correlations between fractional lung volume with slow τ2 and spirometric parameters were also observed (Figure 4; FEV1, rho = –0.686, P = 0.0015; FEF25–75, rho = –0.763, P < 0.0001).
Figure 4. Correlations of VDP and FLV with FEV1.
Scatterplot demonstrating the correlation (via Spearman rank-order correlation) of VDP with FEV1 (A) and FEF25–75 (B) in CF subjects. (A) FEV1 correlation coefficient, –0.703; P = 0.001. (B) FEF25–75 correlation coefficient, –0.686; P = 0.0015. C and D demonstrate correlation of FLV with slow τ2 with FEV1 and FEF25–75, respectively. (C) FEV1 correlation coefficient, –0.686; P = 0.0015. (D) FEF25–75 correlation coefficient, –0.763; P < 0.0001.
Discussion
This was the first study to our knowledge using inhaled PFP and 19F MRI in CF subjects. As observed in other populations, we did not encounter any safety concerns, and the study procedures were quite feasible. Some imaging sessions did not produce adequate data, which is a limitation of this study. These failures primarily reflected patient claustrophobia or minor technical problems (e.g., PFP leak from face mask in subject with a beard) that occurred early in the study. Quality data were routinely obtained from the majority of subjects enrolled later in the study period, reflecting a learning curve with increased experience.
Other MR approaches can be used to characterize ventilation and gas exchange in the lung. Most commonly, hyperpolarized gases (129Xe or 3He) are used for this purpose, although availability of these gases and the need for on-site polarization limit broader adoption. Furthermore, the presence of oxygen reduces the available signal from hyperpolarized gases, and decaying magnetization from effects other than ventilation (12) complicate the ability to perform dynamic imaging. Adding to this challenge, VDP analysis thresholds vary among studies using hyperpolarized gas (13–15), making it difficult to compare VDP values across studies.
In this study, we explored the feasibility of performing dynamic 19F MRI in stable healthy volunteers and CF subjects of varying severity of lung disease. Similar to studies with hyperpolarized gas MRI with single breath VDP analysis (16–19), we observed ventilation defects in CF subjects after multiple cycles of PFP inhalation. These defects were most notable in the subgroup of CF subjects with moderate/severe disease. The numerical, but statistically nonsignificant, difference in VDP between healthy controls and mild CF subjects likely relates to variability in VDP values among the mild CF group. Indeed, 5 of 9 subjects in the mild CF group (FEV1 ≥ 80% predicted) had significantly abnormal VDPs (above the normal subject mean ± 1 SD value; 4 of the 9 were above the normal subject mean ± 2 SD values), suggesting greater sensitivity to disease than spirometry. Whether subjects with greater ventilation defects despite similar spirometry values are at greater risk for disease progression or would benefit from more aggressive interventions is unknown but of interest.
The identification of ventilation abnormalities in CF subjects is consistent with studies that used hyperpolarized helium, where single breath ventilation defects were detected in subjects with CF and preserved lung function (20). The volume of ventilation defects detected with hyperpolarized gas MRI and 19F MRI are not expected to correspond directly, due to differences in signal/noise ratio, gas density, and gas delivery. Furthermore, because ventilation defects were identified under near-equilibrium conditions in this study (5 breathing cycles of PFP wash-in), as compared with a single breath in hyperpolarized gas MRI studies, the obtained values cannot be directly compared. The ventilation defects seen in this study represent a multiple breath VDP (i.e., areas that failed to fill with gas even after multiple breaths of test gas and time allotted for collateral ventilation). VDP values with each method may be differentially impacted by factors such as partial airways obstruction, collateral ventilation, or differences in tracer gas density.
In contrast to comparisons of VDP between groups, the fractional lung ventilation with abnormal gas wash-out time constant values significantly discriminated between healthy volunteers and CF subjects with normal FEV1 values, while also discriminating between mild and moderate/severe disease severity. This index of dynamic regional ventilation, therefore, appears to be more sensitive than steady-state VDP for the detection of mild CF lung disease. The relative sensitivity of these dynamic indices of ventilation to detect mild disease in CF, in comparison with single breath VDP analyses by traditional hyperpolarized gas MRI, is unknown but a question of interest. Similarly, the relative repeatability and feasibility of these techniques should be assessed and considered in future studies.
Interestingly, in contrast to wash-out kinetics, gas wash-in kinetics were not different in CF and healthy subjects. The reasons for this difference are unclear. Because all subjects inhaled PFP during exactly 5 breathing cycles, a possibility is that we incompletely sampled the slow wash-in phase in CF subjects, which reduced our ability to discriminate between healthy and CF subjects. It is theoretically possible that, if subjects were to continue to breathe PFP beyond the 5 cycles (i.e., reach a true plateau), then a slower gas wash-in tail would have been identified in CF subjects.
In order to develop a robust analytical plan for both static (VDP) and dynamic ventilation indices, we were challenged analytically to choose a technique to set useful thresholds that allow discrimination between groups. The threshold that defines a ventilation defect has been empirically defined by several methods in the hyperpolarized gas literature (13–15). To address this issue, we repeated our analyses using literature-defined thresholds and empirically defined thresholds, as well as thresholds defined using unsupervised, normal-mixtures clustering. Importantly, our statistical conclusions did not change, regardless of the threshold definition that was used. Ultimately, we chose to report the values for VDP defined as voxels under 10% of the individual’s maximal signal intensity, recognizing that this may serve as a guideline to future investigators.
We took a similar approach to identifying the thresholds that defined τ1 and τ2 values that discriminated between groups. Whether thresholds were defined by visual inspection of data histograms or through use of normal mixtures clustering analyses, similar conclusions were reached. Although the FLV with slow and fast τ2 values differentiated between normal and mild CF subjects, it is possible that even greater discrimination between health and mild CF disease can be achieved by exploring other PFP inhalation patterns that were not tested in this study. One important limitation of this study is the absence of test-retest variability data. Although data in asthma suggest acceptable short-term repeatability (21), this is a critical step in the development of 19F MRI for CF. Reassuringly, repeatability studies with hyperpolarized gas MRI in CF do suggest that ventilation defects are quite stable (19), lowering the chance the intrinsic biological variability will be limiting. Future studies will address these concerns.
In conclusion, we demonstrated the capability of dynamic 19F MRI to detect ventilation defects and to visualize slow emptying compartments in subjects with mild CF lung disease. These findings suggest that dynamic assessment of PFP gas wash-out with 19F MRI is more sensitive to disease than spirometry. After adapting this technology for use in pediatric patients and incorporating emerging MR assessments of lung structure (e.g., UTE 1H-MRI), this MR technology may provide a safer and more comprehensive means of characterizing early lung disease. As new therapies are developed for CF patients with increasingly mild disease, these techniques could have a profound impact on our ability to assess treatment responses in this population. The combination of these capabilities is likely to make 19F MRI superior to other lung-imaging modalities. 19F MRI presents an ionizing radiation–free method of quantitatively measuring lung function in both healthy and diseased populations, offering an alternative outcome measure for CF clinical trials.
Methods
Subject demographics are shown in Table 1. Twenty healthy volunteers (mean age 27 years) and 24 subjects with stable CF (mean age 30 years) were recruited between November 2014 and April 2018. Healthy volunteers were nonsmokers with normal spirometry and no contraindications to MRI. CF subject exclusion criteria included FEV1 under 35%, active smoking, coexistent asthma, recent pulmonary exacerbation, a contraindication to MRI, or investigational drug use. A subcohort of CF subjects with preserved lung function (FEV1 > 80% predicted) was specifically targeted for inclusion.
Spirometry.
Spirometry was performed using a KoKo spirometer (NSpire Health) according to American Thoracic Society guidelines (22).
MRI procedures.
1H-MRI GRE VIBE images were acquired during a 15-second breath hold, followed by 19F MRI with inhaled PFP as the gaseous contrast agent (79% PFP; 21% O2, premixed medical grade gas; Air Liquide Healthcare). Scans were performed on a Siemens Prisma 3.0 Tesla MRI system (Siemens Medical Systems) with a commercially available 8-channel 19F-tuned chest coil (ScanMed Inc.). MR parameters for proton images were as follows, using Siemens GRE: TE, 3.34 ms; TR, 108 ms; flip angle, 25; resolution, 3.125 mm × 3.125 mm × 15 mm. MR parameters for the 19F images were as follows, using SIEMENS 3D VIBE: repetition time (TR), 13 ms; echo time (TE), 1.61 ms; averages, 2; flip angle (FA), 70; resolution, 6.25 mm × 6.25 mm; slice thickness, 15 mm; number of slices, 18.
A gas-delivery system using a mask/non-rebreathing circuit was manufactured based on prior work by Halaweish and colleagues (11, 23) and delivered PFP or room air during scans. Ventilation was monitored and coached using a pneumotachometer, and gas-empty bag sensors automatically triggered a switch to room air if the PFP source was depleted during the study.
During gas wash-in cycles, subjects took 1 tidal breath of PFP, exhaled via a 1-way valve, and then inhaled PFP for a deep inspiration and 12-second breath hold while images were obtained. Five imaging cycles were performed without breaks during PFP inhalation (wash-in, lasting approximately 2 minutes). After switching to room air, an identical breathing pattern and imaging was performed to characterize PFP wash-out. A minimum of 5 wash-out imaging cycles were performed, with additional room air cycles repeated if residual PFP signal was visible.
Safety assessments.
Pulse oximetry, exhaled CO2, and heart rate were monitored during the MRI procedure. These signals were digitized and recorded through a pair of digitizing acquisition modules (Windaq, Model DI-149, DataQ Instruments). Spirometry was performed before and after gas inhalation/MRI sequences.
Image processing.
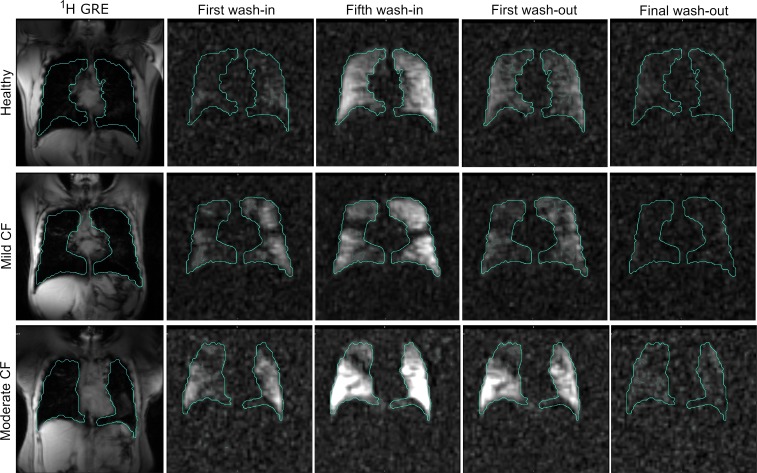
MRI processing was performed via semiautomated in-house scripts using MATLAB (Mathworks Inc.), 3D Slicer (http://www.slicer.org, v4.8.1), and custom Python software (Python Software Foundation; available upon request via Material Transfer Agreement). A near steady state image was defined as the fifth wash-in image from the 4D functional 19F data set (Figure 5 and Supplemental Videos 1–3). Lung boundaries and regions of interest were defined using the steady state image and the proton scan using 3D Slicer, using both semiautomated region growing and manual visual registration. Maximal signal intensity for each subject was defined as the 95th percentile of that individual subject’s intensity distribution to exclude outlying voxels. After noise correction by subtracting mean background signal, VDP was defined as voxels not meeting a threshold of over 10% of the maximal signal intensity.
Figure 5. Example 4D 19F image set for a healthy control, mild CF subject, and moderate CF subject with lung contours.
All image sets are 3D so acquisition over time results in a 4D data set. Steady state image for VDP calculation is defined as the fifth wash-in image. Images in sequence: 1H GRE, first wash-in, fifth wash-in, first wash-out, final wash-out. Signal/noise ratio (SNR) for first wash-in in mild CF subject was 8.342 ± 3.078, compared with SNR of 15.562 ± 4.073 for fifth wash-in image.
To evaluate regional dynamic ventilation, PFP signals were analyzed in the time domain for all ventilated voxels with custom Python software. The signal-time curve for each voxel was fitted with an exponential model to estimate the time constants that characterized the kinetics of gas wash-in (τ1) and wash-out (τ2), based on a previously described ventilation model (24).
This study has been registered at ClinicalTrials.gov(NCT03489590).
Statistics.
Statistical analyses were performed using JMP Pro 14 and SigmaPlot. Changes in FEV1 percentage predicted before and after gas exposure were analyzed with paired, 2-tailed t tests for healthy and CF subjects separately. The frequency of each time constant in the whole ventilated lung was calculated and displayed via histograms and τ maps. Normal mixture clustering was performed on all τ1 and τ2 values in all subjects, specifying a 3-cluster analysis (fast, regular, and slow). Two thresholds for each parameter were defined based on the resulting cluster edges, describing abnormal τ1 and τ2. These thresholds were confirmed by visual inspection of the histograms, and a sensitivity analysis showing that selection of other thresholds did not alter the conclusions is presented in Supplemental Tables 1 and 2. Percentage of lung volume occupied by voxels above and below clustering-defined thresholds were compared between healthy, mild CF, and moderate CF groups with 1-way ANOVA, followed by group comparisons corrected with Tukey’s method for multiple comparisons. Correlations between fractional lung volumes and spirometry measurements were performed using Spearman rank order correlation. All tests were 2 sided, and P values less than 0.05 were considered significant.
Study approval.
This study was conducted in accordance with the amended Declaration of Helsinki. The University of North Carolina IRB approved the study, and written informed consent was obtained from all participants.
Author contributions
JLG had full access to all of the data in the study and takes responsibility for the integrity of the data and the accuracy of the data analysis, including and especially any adverse effects. She assumes full responsibility for the integrity of the submission as a whole, from inception to published article. TMG, ASC, EOAZ, ATT, RCB, BJS, and HCC contributed substantially to data analysis and interpretation. JLG, SHC, SHD, and YZL contributed substantially to study design, data acquisition, data analysis, and interpretation. All authors contributed to manuscript writing and/or critical review of the manuscript.
Supplementary Material
Acknowledgments
This work was supported by NIH P30 DK065988, NIH 4 K12 HL 119998-4, CFF GORALS12L0, CFF PACE GORALS16AC0, and DONALD18Y7. We also acknowledge the regulatory assistance of the North Carolina Translational and Clinical Sciences (NC TraCS) Institute, which is supported by the National Center for Advancing Translational Sciences (NCATS), NIH, through grant award number UL1TR002489. Some of these results have been previously reported in the form of an abstract (25) (North American Cystic Fibrosis Conference, October 27–29, 2016, Orlando, Florida, USA).
Version 1. 12/19/2019
In-Press Preview
Version 2. 01/30/2020
Electronic publication
Footnotes
ATT’s present address is: Division of Pulmonary and Critical Care Medicine, School of Medicine, Oregon Health and Science University, Portland, Oregon, USA.
Conflict of interest: RCB is the Chairman of the Board of Parion Sciences. Parion Sciences is a privately held UNC spin-out company focused on developing therapies for CF. RCB reports having equity in Parion Sciences and receiving monetary compensation as board chair. BJS holds patents assigned to Duke related to the 19F imaging technology. HCC holds patents assigned to Duke related to the 19F imaging technology. (Patent nos. 13/577926, 2011218194, 2793101, 2011800194020, 11745148.4, and PCTUS11025011.)
Copyright: © 2020, American Society for Clinical Investigation.
Reference information: JCI Insight. 2020;5(2):e133400.https://doi.org/10.1172/jci.insight.133400.
Contributor Information
Jennifer L. Goralski, Email: jennifer_goralski@med.unc.edu.
Sang Hun Chung, Email: sanghunc@live.unc.edu.
Tyler M. Glass, Email: tyler_glass@med.unc.edu.
Agathe S. Ceppe, Email: ceppe@email.unc.edu.
Esther O. Akinnagbe-Zusterzeel, Email: akinnesther@gmail.com.
Aaron T. Trimble, Email: trimblea@ohsu.edu.
Richard C. Boucher, Email: rboucher@med.unc.edu.
Brian J. Soher, Email: brian.soher@duke.edu.
H. Cecil Charles, Email: cecil.charles@duke.edu.
Scott H. Donaldson, Email: scott_donaldson@med.unc.edu.
Yueh Z. Lee, Email: YZLee@unch.unc.edu.
References
- 1.Gustafsson PM, De Jong PA, Tiddens HA, Lindblad A. Multiple-breath inert gas washout and spirometry versus structural lung disease in cystic fibrosis. Thorax. 2008;63(2):129–134. doi: 10.1136/thx.2007.077784. [DOI] [PubMed] [Google Scholar]
- 2.Mott LS, et al. Progression of early structural lung disease in young children with cystic fibrosis assessed using CT. Thorax. 2012;67(6):509–516. doi: 10.1136/thoraxjnl-2011-200912. [DOI] [PubMed] [Google Scholar]
- 3.Puderbach M, et al. Assessment of morphological MRI for pulmonary changes in cystic fibrosis (CF) patients: comparison to thin-section CT and chest x-ray. Invest Radiol. 2007;42(10):715–725. doi: 10.1097/RLI.0b013e318074fd81. [DOI] [PubMed] [Google Scholar]
- 4.Eichinger M, et al. Magnetic resonance-compatible-spirometry: principle, technical evaluation and application. Eur Respir J. 2007;30(5):972–979. doi: 10.1183/09031936.00040607. [DOI] [PubMed] [Google Scholar]
- 5.Altes TA, Eichinger M, Puderbach M. Magnetic resonance imaging of the lung in cystic fibrosis. Proc Am Thorac Soc. 2007;4(4):321–327. doi: 10.1513/pats.200611-181HT. [DOI] [PubMed] [Google Scholar]
- 6.Kruger SJ, Nagle SK, Couch MJ, Ohno Y, Albert M, Fain SB. Functional imaging of the lungs with gas agents. J Magn Reson Imaging. 2016;43(2):295–315. doi: 10.1002/jmri.25002. [DOI] [PMC free article] [PubMed] [Google Scholar]
- 7.Wielpütz MO, et al. Magnetic resonance imaging detects changes in structure and perfusion, and response to therapy in early cystic fibrosis lung disease. Am J Respir Crit Care Med. 2014;189(8):956–965. doi: 10.1164/rccm.201309-1659OC. [DOI] [PubMed] [Google Scholar]
- 8.Eichinger M, et al. Morphologic and functional scoring of cystic fibrosis lung disease using MRI. Eur J Radiol. 2012;81(6):1321–1329. doi: 10.1016/j.ejrad.2011.02.045. [DOI] [PubMed] [Google Scholar]
- 9.Couch MJ, et al. Pulmonary ultrashort echo time 19F MR imaging with inhaled fluorinated gas mixtures in healthy volunteers: feasibility. Radiology. 2013;269(3):903–909. doi: 10.1148/radiol.13130609. [DOI] [PubMed] [Google Scholar]
- 10.Gutberlet M, et al. Free-breathing Dynamic 19F Gas MR Imaging for Mapping of Regional Lung Ventilation in Patients with COPD. Radiology. 2018;286(3):1040–1051. doi: 10.1148/radiol.2017170591. [DOI] [PubMed] [Google Scholar]
- 11.Halaweish AF, et al. Perfluoropropane gas as a magnetic resonance lung imaging contrast agent in humans. Chest. 2013;144(4):1300–1310. doi: 10.1378/chest.12-2597. [DOI] [PubMed] [Google Scholar]
- 12.Miller GW, Mugler JP, Sá RC, Altes TA, Prisk GK, Hopkins SR. Advances in functional and structural imaging of the human lung using proton MRI. NMR Biomed. 2014;27(12):1542–1556. doi: 10.1002/nbm.3156. [DOI] [PMC free article] [PubMed] [Google Scholar]
- 13.Coxson HO, Leipsic J, Parraga G, Sin DD. Using pulmonary imaging to move chronic obstructive pulmonary disease beyond FEV1. Am J Respir Crit Care Med. 2014;190(2):135–144. doi: 10.1164/rccm.201402-0256PP. [DOI] [PubMed] [Google Scholar]
- 14.He M, et al. Extending semiautomatic ventilation defect analysis for hyperpolarized (129)Xe ventilation MRI. Acad Radiol. 2014;21(12):1530–1541. doi: 10.1016/j.acra.2014.07.017. [DOI] [PMC free article] [PubMed] [Google Scholar]
- 15.Svenningsen S, et al. Hyperpolarized (3) He and (129) Xe MRI: differences in asthma before bronchodilation. J Magn Reson Imaging. 2013;38(6):1521–1530. doi: 10.1002/jmri.24111. [DOI] [PubMed] [Google Scholar]
- 16.Rayment JH, et al. Hyperpolarised 129Xe magnetic resonance imaging to monitor treatment response in children with cystic fibrosis. Eur Respir J. 2019;53(5):1802188. doi: 10.1183/13993003.02188-2018. [DOI] [PubMed] [Google Scholar]
- 17.Couch MJ, et al. A two-center analysis of hyperpolarized 129Xe lung MRI in stable pediatric cystic fibrosis: Potential as a biomarker for multi-site trials. J Cyst Fibros. 2019;18(5):728–733. doi: 10.1016/j.jcf.2019.03.005. [DOI] [PMC free article] [PubMed] [Google Scholar]
- 18.Smith LJ, et al. Patterns of regional lung physiology in cystic fibrosis using ventilation magnetic resonance imaging and multiple-breath washout. Eur Respir J. 2018;52(5):1800821. doi: 10.1183/13993003.00821-2018. [DOI] [PubMed] [Google Scholar]
- 19.Kirby M, et al. Quantitative evaluation of hyperpolarized helium-3 magnetic resonance imaging of lung function variability in cystic fibrosis. Acad Radiol. 2011;18(8):1006–1013. doi: 10.1016/j.acra.2011.03.005. [DOI] [PubMed] [Google Scholar]
- 20.Thomen RP, Walkup LL, Roach DJ, Cleveland ZI, Clancy JP, Woods JC. Hyperpolarized 129Xe for investigation of mild cystic fibrosis lung disease in pediatric patients. J Cyst Fibros. 2017;16(2):275–282. doi: 10.1016/j.jcf.2016.07.008. [DOI] [PMC free article] [PubMed] [Google Scholar]
- 21. Cecil C, et al. Short Term Repeatability of Perfluorinated Gas Imaging in a Series of Subjects with Asthma (Mild and Moderate/Severe). Paper presented at: American Thoracic Society 2015 International Conference; May 15–20, 2015; Denver, Colorado, USA. http://www.atsjournals.org/doi/book/10.1164/ajrccm-conference.2015 Accessed January 6, 2020.
- 22.Miller MR, et al. Standardisation of spirometry. Eur Respir J. 2005;26(2):319–338. doi: 10.1183/09031936.05.00034805. [DOI] [PubMed] [Google Scholar]
- 23.Halaweish AF, Charles HC. Physiorack: an integrated MRI safe/conditional, gas delivery, respiratory gating, and subject monitoring solution for structural and functional assessments of pulmonary function. J Magn Reson Imaging. 2014;39(3):735–741. doi: 10.1002/jmri.24219. [DOI] [PubMed] [Google Scholar]
- 24.Simon BA, Marcucci C, Fung M, Lele SR. Parameter estimation and confidence intervals for Xe-CT ventilation studies: a Monte Carlo approach. J Appl Physiol. 1998;84(2):709–716. doi: 10.1152/jappl.1998.84.2.709. [DOI] [PubMed] [Google Scholar]
- 25. Goralski J, Akinnagbe E, Charles HC, Donaldson S, Lee Y. 220. Perfluorinated Gas MRI Detects Regional Ventilation Heterogenity in CF. Paper presented at: The 30th Annual North American Cystic Fibrosis Conference; October 27–29, 2016; Orlando, Florida, USA. [Google Scholar]
Associated Data
This section collects any data citations, data availability statements, or supplementary materials included in this article.


