

Abstract
Association cortex is organized into large-scale distributed networks. One such network, the default network (DN), is linked to diverse forms of internal mentation, opening debate about whether shared or distinct anatomy supports multiple forms of cognition. Using within-individual analysis procedures that preserve idiosyncratic anatomical details, we probed whether multiple tasks from two domains, episodic projection and theory of mind (ToM), rely on the same or distinct networks. In an initial experiment (6 subjects, each scanned 4 times), we found evidence that episodic projection and ToM tasks activate separate regions distributed throughout the cortex, with adjacent regions in parietal, temporal, prefrontal, and midline zones. These distinctions were predicted by the hypothesis that the DN comprises two parallel, interdigitated networks. One network, linked to parahippocampal cortex (PHC), is preferentially recruited during episodic projection, including both remembering and imagining the future. A second juxtaposed network, which includes the temporoparietal junction (TPJ), is differentially engaged during multiple forms of ToM. In two prospectively acquired independent experiments, we replicated and triplicated the dissociation (each with 6 subjects scanned 4 times). Furthermore, the dissociation was found in all zones when analyzed independently, including robustly in midline regions previously described as hubs. The TPJ-linked network is interwoven with the PHC-linked network across the cortex, making clear why it is difficult to fully resolve the two networks in group-averaged or lower-resolution data. These results refine our understanding of the functional-anatomical organization of association cortex and raise fundamental questions about how specialization might arise in parallel, juxtaposed association networks.
NEW & NOTEWORTHY Two distributed, interdigitated networks exist within the bounds of the canonical default network. Here we used repeated scanning of individuals, across three independent samples, to provide evidence that tasks requiring episodic projection or theory of mind differentially recruit the two networks across multiple cortical zones. The two distributed networks thus appear to preferentially subserve distinct functions.
Keywords: association cortex, default network, prospection, remembering, theory of mind
INTRODUCTION
Primate association cortex comprises multiple large-scale networks that each involve widely distributed regions. Evidence for these networks comes from anatomical studies in nonhuman primates (e.g., Goldman-Rakic 1988; Mesulam 1990) and human functional neuroimaging studies that have broadly surveyed cortical network architecture (e.g., Doucet et al. 2011; Power et al. 2011; Yeo et al. 2011). The degree to which the networks are specialized and how they support distinct functions remain topics of active investigation. One debate surrounds the role that the distributed network at the transmodal apex of association cortex1, often referred to as the default network (DN), plays in diverse forms of internally generated mentation and cognitive processes more broadly. The DN is situated within zones of association cortex that are disproportionately expanded in hominin evolution and late to mature during development, making them particularly intriguing targets for understanding how distributed cortical networks come to possess specialization important to advanced aspects of human cognition (Buckner and Krienen 2013; Hill et al. 2010).
The canonical DN includes regions in the medial and lateral prefrontal cortex (PFC), lateral temporal cortex (LTC), posterior cingulate/retrosplenial cortex (PCC/RSC), medial temporal lobe (MTL) and inferior parietal lobule (IPL; e.g., Buckner et al. 2008; Gusnard and Raichle 2001). Tasks exhibiting activation that overlaps with the DN include autobiographical memory (Svoboda et al. 2006), future prospection (Schacter et al. 2012), social inference (Iacoboni et al. 2004; Mars et al. 2012; Schurz et al. 2014), and self-referential processing (e.g., D’Argembeau et al. 2005; Gusnard and Raichle 2001). Several early examinations of DN function highlighted convergence and shared patterns of activation across these multiple task domains. Commonalities were noted, for example, in the regions recruited for tasks targeting episodic memory, future prospection, and representation of others’ mental states, also termed theory of mind (ToM) (Buckner and Carroll 2007; Buckner et al. 2008; Spreng et al. 2009; see also Schacter et al. 2007).
Subsequent group studies incorporating within-subject task manipulations found differential recruitment of certain DN regions by distinct tasks (Andrews-Hanna et al. 2010, 2014a; DuPre et al. 2016; Rabin et al. 2010; Spreng and Grady 2010; Wen et al. 2019; see also Kurczek et al. 2015; Rosenbaum et al. 2007). In particular, retrieving episodic memories recruits regions near RSC and parahippocampal cortex (PHC); in contrast, inferring others’ mental states recruits a region of the IPL, extending into the temporoparietal junction (TPJ), that is rostral to the caudal IPL zone most typically associated with episodic remembering (Andrews-Hanna et al. 2014a; DuPre et al. 2016; Rabin et al. 2010). In a resultant organizational hypothesis of the DN, two subsystems were proposed featuring distinct regions, including dorsomedial PFC and MTL, as well as shared, or core, regions along the anterior and posterior midline (Andrews-Hanna et al. 2010, 2014b; see also Hassabis and Maguire 2007).
Recent technological advances and procedures for sampling individuals have allowed for better appreciation of the detailed spatial components of distributed association networks (Braga and Buckner 2017; Braga et al. 2019b; Fedorenko et al. 2012; Gordon et al. 2017; Huth et al. 2016; Kong et al. 2019; Laumann et al. 2015; Michalka et al. 2015). Relevant to the study of the DN, Braga and Buckner (2017) revealed that two closely interdigitated networks are distributed within the bounds of the canonical DN (see also Braga et al. 2019b; Buckner and DiNicola 2019). These dissociable networks, termed network A and network B for convenience, are interwoven but distinct across multiple zones of cortex. Certain spatial distinctions are consistent with those previously highlighted at the group level, such as the separation of rostral and caudal regions of the IPL, previously linked differentially to mentalizing and mnemonic functions (e.g., Andrews-Hanna et al. 2014a). However, individualized analyses also suggest new features that may be critical to functional understanding. First, the network distinctions are not restricted to local zones, but rather have dissociable components throughout the distributed extent of the networks. Second, the anatomical dissociations within individuals include regions along the anterior and posterior midline that were previously proposed as part of the DN “core” due to their participation in multiple task domains. The network organization as revealed within the individual (see also Toro-Serey et al. 2020), as well as within-subject findings from task-based activation patterns along the posterior midline (Peer et al. 2015; Silson et al. 2019), suggest that these zones may possess spatially separate functional regions. Altogether, these results raise the possibility that there may be broad functional specialization of the widely distributed networks, rather than local subzones of specialization that converge on core hubs.
Motivated by these possibilities and by the general goal of increasing our understanding of functional organization, we explored specialization of networks located within the bounds of the canonical DN using repeated scanning and approaches focused on characterizing idiosyncratic details within individuals. We first conducted intrinsic functional connectivity analysis to identify networks A and B within each individual. We then examined task response patterns during multiple task contrasts targeting either episodic projection (i.e., remembering the past and imagining the future) or ToM (also called mentalizing) to explore functional-anatomical specialization of networks A and B within the individual. Three independent data sets were collected, each including six intensively sampled participants (each scanned on 4 occasions). Initial analysis techniques were established for the first sample (experiment 1) and applied to the second, prospectively acquired replication sample (experiment 2). Additional analyses were then developed using the second sample to statistically test dissociations across local regions, inspired by suggestions from Dr. Danilo Bzdok, who read a preprint of this work. Given the novelty of these analyses, the full set of acquisition and hypothesis-testing procedures for regional dissociation were then applied to a prospectively acquired third sample, to independently replicate these additional results (experiment 3).
To foreshadow the results, networks A and B exhibit replicable functional dissociation across distributed cortical zones. PHC-linked network A is preferentially recruited for tasks requiring episodic projection, whereas TPJ-linked network B exhibits preferential recruitment for tasks requiring ToM.
The dissociation extends to topographically separate regions within the anterior and posterior midline and throughout the distributed zones of association cortex, pointing toward a revised understanding of how distributed networks may be organized to support distinct task processing demands.
METHODS
Experiment 1: Initial Functional Dissociation
Participants.
Six healthy adults, aged 18–32 [mean = 22.2 yr (SD = 2.4), 2 men, 5 right-handed] were recruited from the Boston area. All participants were native English speakers and screened to exclude neurological or psychiatric illness. Each participant was scanned across four separate MRI sessions, designed to chart 1) individualized network organization through analysis of intrinsic functional connectivity; and 2) task-based activation through tests of episodic projection and ToM. Participants provided written, informed consent through the protocol approved by the Institutional Review Board of Harvard University and were paid for participation.
MRI data acquisition.
Scanning was conducted at the Harvard Center for Brain Science using a 3T Siemens Magnetom Prisma-fit MRI scanner and a 64-channel phased-array head-neck coil (Siemens Healthcare, Erlangen, Germany). Foam padding provided head comfort and immobilization. Each scanning session was conducted on a separate (nonconsecutive) day and lasted up to 2 h. Scanning sessions were conducted at participants’ convenience between 7 AM and 9 PM. Participants viewed rear-projected stimuli through a mirror attached to the head coil. Before each session, the viewing location was adjusted so that the central point of the participant’s field of view was at a comfortable angle.
During each session, a rapid T1-weighted structural image with 1.2-mm isotropic voxels was acquired first, using a multi-echo magnetization prepared rapid acquisition gradient echo (ME-MPRAGE; van der Kouwe et al. 2008) sequence [repetition time (TR) = 2,200 ms, echo time (TE) = 1.57, 3.39, 5.21, 7.03 ms, inversion time (TI) = 1,100 ms, 176 slices, flip angle = 7°, matrix = 192 × 192 × 176, in-plane GRAPPA acceleration = 4]. T2*-weighted blood oxygenation level-dependent (BOLD) runs were then acquired using a multiband, gradient-echo, echo-planar pulse sequence (see Feinberg et al. 2010; Moeller et al. 2010; Setsompop et al. 2012; Xu et al. 2013), generously provided by the Center for Magnetic Resonance Research at the University of Minnesota (TR = 1,000 ms, TE = 32.6 ms, flip-angle = 64°, 2.4-mm isotropic voxels, multislice 5 × acceleration, matrix = 88 × 88, 65 slices covering cerebral cortex and cerebellum, angled 25° toward coronal from a line between the anterior and posterior commissures). A dual-gradient-echo B0 field map (2.4-mm isotropic resolution, matrix = 88 × 88, 65 slices, TR = 295 ms, flip angle = 55°, TE1 = 4.45 ms, TE2 = 6.91 ms) was also acquired during each session to allow for correction of susceptibility-related inhomogeneities. Participants’ eyes were monitored and video-recorded using the Eyelink 1000 Core Plus with Long-Range Mount (SR Research, Ottawa, Ontario, Canada), and alertness was scored during each BOLD run.
Fixation runs for intrinsic functional connectivity analysis.
Eight 7-min, 2-s BOLD fixation runs were acquired per individual (~56 min of data; 2 runs per session). During the fixation task, participants were instructed to stay alert and still while maintaining fixation on a centrally presented black plus sign on a light gray background. Fixation runs occurred intermixed with other task paradigms. Fixation data were used for functional connectivity analysis to estimate network organization independent from the data used in subsequent task analysis.
Task paradigms.
Task contrasts were selected that preferentially isolated either episodic projection or ToM demands. These task domains, albeit complex within themselves, were hypothesized to differentially recruit parallel networks that fall within the bounds of the DN (e.g., Andrews-Hanna et al. 2010, 2014a; DuPre et al. 2016). Two variants of each task type were constructed based on prior literature, maintaining the task structure and contrast strategy of the original work. Two variants were used, rather than more trials of the same type, to aim for generality and also to increase the number of unique rich stimuli. Participants were given detailed instructions and practice trials for each task during an initial training session. Instructions were repeated before each scanning session.
The episodic projection tasks involved episodic remembering of the past (Past Self) and episodic prospection of the future (Future Self; Andrews-Hanna et al. 2010). These tasks were contrasted with a common control condition (Present Self). The ToM tasks involved representing others’ mental states, either through making inferences about another person’s beliefs (False Belief) or considering another person’s emotional pain or suffering (Emo Pain; Dodell-Feder et al. 2011; Jacoby et al. 2016; Saxe and Kanwisher 2003); each was contrasted to its own matched control condition [False Photo or Physical (Phys) Pain]. Example stimuli are provided in Table 1.
Table 1.
Sample stimuli from conditions of interest across primary tasks
| Task Domain | Condition | Example Stimulus |
|---|---|---|
| Episodic Projection | Past Self | Consider the last time you interacted with your closest friend. Did you communicate: via text message, over the phone, in another way? |
| Present Self | Consider how sad you feel at the present moment. Would you describe yourself as: very sad, somewhat sad, not at all sad? | |
| Future Self | Consider the events associated with the next time you eat out at a restaurant. Will you be eating: by yourself, with a friend, with a group? | |
| Theory of Mind | False Belief | When Christine labeled the pie at the school’s bake sale, she thought it was cherry and labeled the pie “cherry.” Actually, the pie was strawberry. A customer purchasing the pie expects it to taste like cherries: True/False |
| False Photo | The traffic camera snapped an image of the black car as it sped through the stoplight. Soon after, the car was painted red, and the license plates were changed. According to the traffic camera, the car is black: True/False |
|
| Emo Pain | Rose was planning her upcoming wedding. She received a call from her fiancé. He told her that he was leaving town and could not go through with the wedding. Rose hung up the phone and dropped the wedding catalog she was reading. Protagonist pain or suffering: None/A Little/Moderate/A Lot |
|
| Phys Pain | Suzie was riding in a cab to meet some friends for dinner. When she arrived at the restaurant, Suzie opened the door and began to step out. Just then a child walking by accidentally bumped the door and it closed on Suzie, smashing her leg. Protagonist pain or suffering: None/A Little/Moderate/A Lot |
Emo, emotional; Phys, physical.
episodic projection tasks.
Episodic projection tasks and their control extended from a paradigm developed by Andrews-Hanna et al. (2010). The tasks involved visually presenting questions about hypothetical past or future scenarios (context-setting statements) and then providing three possible answer choices. Questions and answers targeted real-world experiences rather than unlikely or fantasy scenarios to maximize the likelihood that individuals would experience episodic projection.
The anchor for designing the episodic projection task contrasts was a prior observation that contrasting episodic future projection against a control of present self-reflection preferentially activated components of network A (see Fig. 4 in Andrews-Hanna et al. 2010). Critically, both the target and control tasks involve self-referential processing, removing this dimension (to a degree) from the contrast. For the present study, we replicated the future-oriented condition used by Andrews-Hanna and colleagues (Future Self), and also created a new, parallel task condition focused on remembering the past (Past Self).
Fig. 4.

Parahippocampal (PHC) and ventral posterior cingulate (vPCC)/retrosplenial cortex (RSC) regions of network A exhibit robust functional dissociation in experiment 1. Left: PHC and RSC/vPCC regions, as defined in each subject [subjects 1–6 (S1–S6)], outlined in white. The distributions plot the functional responses within each region of network A for the two task domains [theory of mind (ToM), red; episodic projection (EP), yellow; overlap, orange]. In all subjects for both regions, a clear functional response increase is evident for EP over ToM (Cohen’s d ranges: RSC/vPCC, 0.54–4.43; PHC, 1.67–3.24).
The control task extended from the Present Self condition used by Andrews-Hanna et al. (2010), which primarily featured items directed at conceptual beliefs about oneself, issues in one’s life, feelings, and beliefs, while other items concerned immediate perceptual experiences, such as physical feelings within the scanner. In the present experiment, statements about one’s conceptual beliefs, feelings, and ideas were probed (Present Self). A separate condition then queried present physical and perceptual experiences (Present Perception), and a final condition included parallel statements and questions about nonpersonal semantic knowledge (Non-Self). The task contrasts relevant to isolating regions suggestive of network A were Past Self versus Present Self and Future Self versus Present Self.
The full sets of task conditions were intermixed to create randomized trial orders that alternated across runs. Each 612-s run included 30 trials (6 per condition). A run began with 12 s of fixation for T1 stabilization. Thirty trials were then presented sequentially. Each trial lasted 20 s, with 5 s of fixation, 10 s during which the context-setting statements and answers were presented, and then 5 s of additional fixation. Sentence structure, words, and character length were matched across conditions. One run of 30 trials was collected during each MRI session, yielding 4 total runs (120 individual trials, 24 of each type; ~40 min of total episodic projection data).
theory of mind tasks.
ToM tasks and their control conditions extended from the False Belief and Emo/Phys Pain stories paradigms (Dodell-Feder et al. 2011; Jacoby et al. 2016; Saxe and Kanwisher 2003), each of which targets representation of others’ mental states (e.g., Saxe 2006). These task contrasts were chosen because they show convergent patterns of activation that preferentially align with regions suggestive of network B, in particular robust activation of the TPJ (Jacoby et al. 2016).
Each of the False Belief ToM runs included 10 trials, 5 featuring stories about characters with potentially false beliefs (False Belief) and 5 control stories about objects (e.g., photographs or maps) with potentially false information (False Photo; Dodell-Feder et al. 2011). The task contrast relevant to isolating network B was False Belief versus False Photo. A run began with 12 s of fixation for T1 stabilization. Each story was presented for 10 s, followed by a true or false statement, presented for 5 s. A 15-s fixation period then occurred before the next trial began. Participants were asked to pay close attention to the details of each presented story and then respond to the statement. Stimuli included those from Dodell-Feder et al. (2011), as well as additional stimuli generously provided by the Saxe Laboratory.
Each of the Emo/Phys Pain stories runs (subsequently abbreviated “Other Pain”) included 10 trials, with 5 featuring stories containing an emotionally painful event (Emo Pain) and 5 control stories containing a physically painful event (Phys Pain; Bruneau et al. 2012; Jacoby et al. 2016). The task contrast relevant to isolating network B was Emo Pain versus Phys Pain. The timing of the runs and trials were identical to those described for the False Belief ToM runs. However, the structure of the questions and responses differed. During the question period, participants selected, on a scale from 1 to 4, the amount of pain the protagonist of the story had experienced (numbers corresponded to “None,” “A Little,” “Moderate,” or “A Lot”). Stimuli were selected from the full set provided by Bruneau et al. (2012). For each ToM task, a fixed randomized trial order alternated across sessions. One run of each ToM task paradigm was collected during each MRI session, yielding 8 total runs (4 per task, ~42 min of total ToM data). No stimuli were repeated across runs.
Exclusion criteria and quality control.
Each BOLD functional run was examined individually for quality. Scan and behavioral performance were assessed, and, for runs featuring skipped trials, eye videos were reviewed. Since the episodic projection and the Other Pain tasks involved subjective decisions, for which accuracy could not be calculated, behavioral performance metrics quantified 1) frequency of skipped trials and 2) mean response time (RT) [compared across conditions, for each task contrast, through within-subject (paired) t tests, using the stats package in R version 3.5.1].
Exclusion criteria included the following: 1) maximum absolute motion > 2 mm, 2) signal-to-noise ratio ≤ 135; and 3) eyes closed during skipped task trials (see Table 2). Overall, 2 of 120 runs were excluded in experiment 1 for motion (1 run for each of 2 subjects). No runs were excluded based on behavioral performance metrics (see results, Experiment 1, and Table 4 for details). Data quality was excellent, with mean maximum motion displacement < 1.05 mm for each subject.
Table 2.
Scanning quality control metrics
| Experiment | Subject No. | Maximum Motion, mm | Signal-to-Noise Ratio | Excluded Runs | Included Fix Runs |
|---|---|---|---|---|---|
| 1 | S1 | 0.73 (0.34) | 256.62 (48.40) | 0 | 8 |
| S2 | 0.34 (0.12) | 317.02 (26.73) | 0 | 8 | |
| S3 | 0.36 (0.20) | 305.36 (48.95) | 0 | 8 | |
| S4 | 0.67 (0.23) | 203.11 (32.23) | 0 | 8 | |
| S5 | 1.03 (0.49) | 225.99 (45.03) | 1 (ToM: motion) | 8 | |
| S6 | 0.55 (0.34) | 248.69 (35.76) | 1 (EP: motion) | 8 | |
| 2 | S7 | 0.41 (0.31) | 264.23 (50.40) | 0 | 11 |
| S8 | 0.36 (0.14) | 252.64 (28.99) | 0 | 11 | |
| S9 | 0.71 (0.34) | 285.97 (44.09) | 0 | 6 | |
| S10 | 0.56 (0.25) | 248.97 (30.34) | 3 (Fix: motion) | 8 | |
| S11 | 0.74 (0.28) | 254.91 (34.84) | 2 (1 Fix: motion; 1 ToM: pres. error) | 10 | |
| S12 | 0.30 (0.07) | 301.70 (42.14) | 1 (ToM: pres. error) | 11 | |
| 3 | S13 | 0.57 (0.22) | 213.49 (34.76) | 0 | 6 |
| S14 | 1.05 (0.49) | 227.38 (45.18) | 6 (Fix: motion) | 5 | |
| S15 | 0.79 (0.33) | 244.79 (44.81) | 0 | 11 | |
| S16 | 0.80 (0.43) | 226.13 (47.92) | 6 (Fix: motion) | 5 | |
| S17 | 0.54 (0.27) | 320.40 (43.16) | 0 | 11 | |
| S18 | 0.62 (0.26) | 243.47 (40.99) | 0 | 11 |
Each motion and signal-to-noise value shows the mean across runs (with standard deviation in parentheses), post-exclusions. S9 and S13 had fewer fixation (Fix) runs, despite no exclusions due to discontinued participation after 2 sessions. S14 had a higher mean maximum motion value because 1 Fix run was included, in error, that surpassed the motion threshold. EP, episodic projection; pres. error, experimenter error in trial presentation; ToM, theory of mind.
Table 4.
Behavioral performance across tasks
| Episodic Projection |
Theory of Mind |
|||||||
|---|---|---|---|---|---|---|---|---|
| Experiment | Subject No. | Past Self | Future Self | Present Self | False Belief | False Photo | Emo Pain | Phys Pain |
| 1 | S1 | 5,618 (0) | 5,666 (0) | 5,253 (0) | 2,551 (1) | 2,614 (0) | 1,144 (0) | 1,164 (0) |
| S2 | 5,783 (0) | 5,466 (0) | 5,291 (0) | 2,503 (0) | 2,704 (0) | 864 (0) | 848 (0) | |
| S3 | 4,606 (0) | 4,466 (0) | 4,211 (0) | 2,543 (0) | 2,584 (1) | 1,970* (0) | 1,259 (0) | |
| S4 | 7,027 (0) | 6,986 (0) | 6,984 (0) | 2,902 (0) | 3,072 (1) | 1,199 (0) | 1,123 (0) | |
| S5 | 6,162* (0) | 5,751* (1) | 5,055 (0) | 2,137 (0) | 2,425 (0) | 1,286 (0) | 1,350 (0) | |
| S6 | 6,012 (0) | 6,831 (0) | 6,112 (0) | 2,474 (1) | 2,945* (0) | 1,767 (0) | 1,625 (0) | |
| 2 | S7 | 3,956 (0) | 4,558* (0) | 3,800 (0) | 2,245 (0) | 2,524 (1) | 729 (0) | 899 (1) |
| S8 | 4,334 (0) | 4,723* (0) | 4,211 (0) | 2,282 (0) | 2,327 (0) | 1,099 (0) | 1,140 (0) | |
| S9 | 5,651 (0) | 5,767 (0) | 5,549 (0) | 2,958 (1) | 3,205 (0) | 1,051 (0) | 1,200 (0) | |
| S10 | 4,759 (0) | 4,966 (0) | 4,946 (0) | 2,650 (0) | 2,665 (2) | 1,089 (0) | 924 (0) | |
| S11 | 6,855 (0) | 6,926 (0) | 6,736 (0) | 3,756 (4) | 3,719 (3) | 1,347 (0) | 1,319 (0) | |
| S12 | 6,437 (0) | 6,766 (0) | 6,609 (0) | 2,923 (0) | 3,051 (0) | 2,402 (0) | 2,777 (0) | |
| 3 | S13 | 6,172 (0) | 5,721 (0) | 5,598 (0) | 2,623 (0) | 2,344 (0) | 1,448 (0) | 1,387 (0) |
| S14 | 3,775 (0) | 3,678 (0) | 3,885 (0) | 1,877 (0) | 2,177* (0) | 1,702 (0) | 1,110 (0) | |
| S15 | 5,526 (0) | 5,699 (0) | 5,622 (0) | 2,879 (0) | 3,219 (0) | 1,024 (0) | 969 (0) | |
| S16 | 7,101 (0) | 7,311 (0) | 6,690 (0) | 3,450 (1) | 3,380 (4) | 1,540 (0) | 1,577 (0) | |
| S17 | 6,264 (0) | 6,490* (0) | 5,892 (0) | 2,672 (0) | 2,544 (0) | 1,835 (0) | 1,668 (0) | |
| S18 | 6,672 (0) | 6,550 (0) | 6,241 (0) | 3,112 (2) | 3,186 (0) | 2,662 (0) | 2,273 (0) | |
Values show the average response time (RT) across included task runs in milliseconds (with the no. of trials skipped in parentheses). Participants exhibited high compliance; few skipped more than one trial across all runs of all tasks. Subject 11 (S11) and subject 16 (S16) exhibited responses outside of the allotted time during some runs of the False Belief paradigm. Emo, emotional; Phys, physical.
Condition featuring a slower RT within contrast of interest (Episodic Projection: Past Self vs. Present Self or Future Self vs. Present Self; Theory of Mind: False Belief vs. False Photo or Emo Pain vs. Phys Pain; paired t test, P < 0.05).
Within-subject data processing and template alignment.
A custom analysis pipeline for individualized data processing (“iProc”) expanded on previous methods (e.g., Braga and Buckner 2017; Poldrack et al. 2015; Yeo et al. 2011; described in detail in Braga et al. 2019b). To minimize spatial blurring, data were registered to an isotropic 1-mm native space anatomical template through a single interpolation that combined four registration matrices. Before the calculation of these matrices, for each BOLD run, the first 12 volumes were discarded for T1 equilibration. 1) Within each run, each volume was motion corrected to the middle volume using linear registration and 12 degrees of freedom (DOF; using MCFLIRT, FSL version 5.0.4; Jenkinson et al. 2002; Smith et al. 2004). 2) Each run’s middle volume was then field-map unwarped using a field map acquired during the same scanning session (using FUGUE, FSL version 4.0.3; Jenkinson 2004). 3) Field-map unwarped middle volumes from each run were then registered to a subject-specific, mean-BOLD template image. The mean-BOLD template was constructed iteratively. First, a single volume was selected as a temporary target: the field-map unwarped middle volume from the run acquired closest to a field map during a single scanning session. This target image was upsampled to 1.2-mm isotropic resolution to optimize alignment precision, and all runs’ field-map unwarped middle volumes were registered to this upsampled target. A mean was then taken to reduce bias toward a single run. The mean image acted as a subject-specific, field-map unwarped, and upsampled mean-BOLD template image, to which the field-map unwarped middle volumes from each run were linearly registered (12 DOF; using FLIRT, FSL version 5.0.4; Jenkinson and Smith 2001). 4) The mean-BOLD template was then registered to a native space template (6 DOF; using boundary-based registration; Greve and Fischl 2009). The native space template was one of the subject’s T1 structural images, upsampled to 1-mm isotropic resolution, and deemed as having a robust estimate of the pial and white-matter boundaries (as constructed by FreeSurfer recon-all; Fischl et al. 1999).
In this fashion, matrix calculations progressed from run- and session-specific corrections, to cross-session registration, to alignment to a template space. During matrix calculations, data were checked for registration errors. Matrices 1–4 were combined to allow for a single interpolation from each raw volume of BOLD data to the individual’s native space template. The iProc pipeline thus allowed for high-resolution and robustly aligned BOLD data, with minimal interpolation and signal loss, output to both the 1-mm native space (through a single interpolation) and to the fsaverage6 cortical surface (to which native space data were resampled).
Within-subject functional connectivity network analysis.
Functional connectivity analysis targeted identification of networks A and B within each individual (as in Braga and Buckner 2017; Braga et al. 2019b). Nuisance variables, representing a combination of six motion parameters, as well as whole brain, ventricular, and deep cerebral white matter mean signals and their temporal derivatives, were regressed. The residual BOLD data were then band-pass filtered at 0.01–0.1 Hz. Preprocessed data were sampled to the fsaverage6 surface mesh (featuring 40,962 vertices per hemisphere; Fischl et al. 1999) using trilinear interpolation, then smoothed along the surface using a 2-mm full-width-at-half-maximum (FWHM) Gaussian kernel. A bespoke cortical surface template (Braga and Buckner 2017) was employed to optimize interactive visualization of the surface data at this vertex density, using Connectome Workbench software (wb_view; Glasser et al. 2013; Marcus et al. 2011). After projection to the surface, networks were identified within each subject using both seed-based and k-means parcellation techniques.
For seed-based network identification, mirroring the procedures outlined by Braga and Buckner (2017), a cross-correlation matrix was created for each fixation run by computing the Pearson’s r correlation values between time series at each vertex. The matrices across runs were averaged together (after normalization) for a single subject. A correlation threshold of 0.2 was used, and primary seed vertices were manually selected from the lateral PFC. Functional connectivity maps, featuring distributed sets of cortical regions with correlated patterns of signal fluctuations, were viewed for each selected seed, and optimal seeds were chosen for isolating networks A and B (see also Braga et al. 2019b).
For k-means parcellation, 17 clusters were specified (e.g., Yeo et al. 2011) to estimate whole brain, within-subject network organization. For k-means clustering, time series data were input to the k-means algorithm following z-normalization and concatenation across runs, within a subject. Clustering was done using the MATLAB v2015b kmeans function, with default parameters (1 random initialization, 100 iterations, squared Euclidean distance metric). Vertices along the medial wall were removed before calculating the parcellation (e.g., Fig. 1A). Networks A and B were identified in the whole brain k-means output based on referential features of each network’s anatomical distribution (described in detail in Braga and Buckner 2017; Braga et al. 2019b).
Fig. 1.

Procedure for testing functional dissociation within individuals. A: within each subject, networks A and B were identified using k-means clustering. Each network’s border was defined (B) and overlaid on the unthresholded contrast maps for each task domain (C). D: the distribution of z-weighted values within each network’s boundaries was extracted and plotted. E: for each network, plots from both task domains were then visualized on a single graph [theory of mind (ToM), red; episodic projection (EP), yellow], and potential differences between the domain distribution means were quantified using effect sizes. While this figure illustrates distributions for network A only, the procedure was performed identically for both networks A and B.
As will be shown, seed-based and k-means parcellation yielded similar (but not identical) network estimates. To keep procedures consistent and unbiased for our primary goal of functional dissociation, we utilized the automated k-means definition of networks. However, it is important to present and contrast network definitions across both strategies as a reminder that detailed features of topography are sensitive to the exact methods employed.
Within-subject task analysis.
For each run of the episodic projection and ToM tasks, the whole brain signal was regressed from native-space data. We applied whole brain signal regression, which is typical of functional connectivity analysis but atypical of task-based analyses, because pilot analysis of null data using the task general linear models (GLMs) revealed that regression stabilized the null distribution, presumably by removing a nuisance component of signal instability. Unlike functional connectivity, where whole brain signal regression has led to debate about interpreting the meaning of absolute correlation levels (e.g., anticorrelations), here our task-based analyses always consider relative changes between conditions, without interpretation of absolute signal levels. Moreover, as will be further shown below, we empirically estimated false-positive rates for critical statistical tests using null (fixation) data to confirm that our procedures maintained appropriate characteristics for the tests applied.
Data were then resampled to the fsaverage6 cortical surface mesh (Braga and Buckner 2017; Fischl et al. 1999), smoothed using a 2-mm FWHM kernel, and input to run-specific GLMs (created using FEAT; FSL version 5.0.4). All conditions were included in each model design, even those not relevant to the contrasts of interest. A canonical double-gamma hemodynamic response function (HRF) convolution was applied. Time derivatives were also included to account for HRF variability across brain regions, and data were high-pass filtered with a 100-s (0.01-Hz) cut-off to remove low-frequency drifts within each run. The z-weighted outputs for each run of each task were averaged to create a single cross-session map for each contrast of interest. The mean z-maps provided a best estimate of the targeted episodic projection and ToM contrasts within each individual.
Within-subject functional double-dissociation.
The critical test of functional dissociation was to determine whether the task domains exhibited differential BOLD response within the spatially separate networks A and B. This test was achieved by quantifying to what degree the voxel response distributions within each network differed as a function of task domain (Fig. 1). A shift in the response distribution within a network would provide positive evidence for dissociation within an individual. A double dissociation would arise if the response distributions shifted in opposite directions between the two networks. Generalization of the double dissociation would be supported by replicating the opposing effects across multiple individuals. Thus, while within-individual analyses differ in many ways from more common random-effects strategies of group analyses, specific hypothesis-directed analyses were adopted to formalize the predicted double-dissociation as well as to establish whether any patterns were limited to specific individuals or were more general, shared features (see Shallice 1988 for theoretical motivation).
Specifically, after identifying networks A and B within an individual using k-means parcellation (Fig. 1A), borders of each network were defined (Fig. 1B) and overlaid on each domain-specific mean contrast map (Fig. 1C). Using Connectome Workbench tools (wb_command; Marcus et al. 2011), z-values from all vertices within the bounds of either network A or B were extracted from each task domain’s unthresholded contrast map. For each network, distributions of z-values associated with each task domain were then plotted and compared (Fig. 1, D and E). Cohen’s d effect sizes were calculated as a descriptive statistic to quantify differences between distributions.
This method was first employed to analyze network recruitment by task domain across networks A and B in their entirety and was then extended to examine recruitment more selectively for network A regions in ventral PCC/RSC and PHC. For this more focused analysis, regions of interest approximating the whole of the ventral PCC/RSC and posterior PHC were defined on the fsaverage6 surface template. For each individual and each domain-specific mean contrast map, z-values were then extracted from vertices that fell within the bounds of both the region of interest and the individual’s network A. In this way, the restriction to subzones was applied uniformly across subjects, but analyses were constrained to individual-specific network regions (see Figs. 4, 11, and 19; e.g., Fedorenko et al. 2010). Cohen’s d effect sizes were then calculated to quantify distribution differences (using the effsize package in R).
Fig. 11.

Parahippocampal (PHC) and ventral posterior cingulate (vPCC)/retrosplenial cortex (RSC) regions of network A replicate functional dissociation in experiment 2. Left: PHC and RSC/vPCC regions as defined in each subject [subjects 7–12 (S7–S12)]. These regions are outlined in white and are contained within network A, as in Fig. 4. The distributions plot the functional responses within each region for the two task domains [theory of mind (ToM), red; episodic projection (EP), yellow; overlap, orange]. For each region, in all subjects, a significant functional response increase for EP over ToM is evident (Cohen’s d ranges: RSC/vPCC, 1.60–3.42; PHC, 2.35–3.39).
Fig. 19.

Parahippocampal (PHC) and ventral posterior cingulate (vPCC)/retrosplenial cortex (RSC) regions of network A triplicate functional dissociation in experiment 3. Left: PHC and RSC/vPCC regions (outlined in white, within network A) as defined in each subject [subjects 13–18 (S13–S18)] in experiment 3. The distributions plot the functional responses within each region for theory of mind (ToM; red) and episodic projection (EP; yellow). All subjects exhibit higher values for EP over ToM in both regions (Cohen’s d ranges: RSC/vPCC, 1.65–3.37; PHC, 1.42–3.45).
We chose a quantitative descriptive approach because each network features a complex correlation structure spanning spatially discontinuous regions. Methods for identifying false positives that assume spatial dependencies only between neighboring voxels fail to account for the complex nature of correlations in the present data. Here, across experiment 1 analyses, we provide descriptive statistics and base interpretations on evidence of predicted double-dissociation patterns consistently generalizing across individuals. To alleviate any ambiguity about the robustness of the results, the entire approach and findings were replicated in both experiment 2 and experiment 3. As will be described, an alternative statistical approach, through which false positive rates could be estimated using null data, was also developed and tested in experiment 2 (see trial-level analyses below), and then prospectively applied in experiment 3. The key patterns, including the double dissociation, were evident in the vast majority of subjects, across methods, and compelling in many individual subjects.
Within-subject visualization of task response maps.
For each participant, contrast maps for each domain were visualized in relation to the independently derived functional connectivity network boundaries. Borders of networks A and B were overlaid on an image that displayed both task domain contrast maps on the same cortical surface. The contrast maps were thresholded for visualization (with minimum z-values chosen between 1.5 and 2.5 for each subject). Patterns of overlap between each network and the domain-specific task responses were visualized across multiple cortical zones to clarify whether observed dissociations were carried by specific regions or reflected functional specialization across the broad distributed networks.
Contrast-specific analyses.
For the primary hypothesis-testing analyses described above, we collapsed across tasks within episodic projection and ToM domains to optimize our power for detecting domain-related differences between networks. Tasks were chosen a priori based on their likelihood to isolate component processes within each domain. A natural question to ask is: Do tasks within each domain exhibit similar patterns of network recruitment? To address this question and provide a full description of the data, we conducted a post hoc analysis to quantify potential distinctions between specific task exemplars, by plotting and comparing contrast-specific means. The z-values from vertices within the bounds of each network were extracted from each separate task’s mean, unthresholded contrast map and plotted. Effect sizes were calculated to describe potential differences.
Experiment 2: Prospective Replication
Participants.
Experiment 2 was conducted as a prospective replication of experiment 1. An independent sample of six adults was recruited [mean = 22.3 yr (SD = 4.0), 2 men, 5 right-handed] to complete four scanning sessions each. All paid participants were native English speakers, were screened to exclude neurological or psychiatric illness, and provided written, informed consent through the protocol approved by the Institutional Review Board of Harvard University.
MRI data acquisition and processing methods, as well as most task and analysis procedures in experiment 2, were the same as for experiment 1; differences are detailed below.
Fixation runs for intrinsic functional connectivity analysis.
Eleven 7-min, 2-s BOLD fixation runs were acquired per individual (~77 min of data; 3 runs during each of the first three sessions, and 2 runs during the fourth).
Task paradigms.
Experiment 2 included the same critical episodic projection and ToM tasks as in experiment 1. Additional reference tasks were added to expand the possible contrasts involving episodic projection.
expanded episodic projection paradigm.
The episodic projection task contrasts involved Past Self and Future Self conditions, each subtracting a self-referential control (Present Self), thereby removing self-reference from the contrasts of interest. Although this was critical to the primary goal of targeting episodic projection as distinct from ToM, particularly given that shared processes may allow for reflecting on one’s own and others’ mental states (e.g., Lieberman 2007), contrasts featuring self-reflection and episodic projection might be expected to call on both networks A and B. To begin to address this possibility, in experiment 2, the episodic projection paradigm was expanded. In addition to the three primary conditions from experiment 1 (Past Self, Future Self, and Present Self), the episodic projection task contrasts in experiment 2 included three nonpersonal conditions featuring semantic questions about the past (Past Non-Self), present (Present Non-Self), or future (Future Non-Self). Structured to resemble the setup of Andrews-Hanna et al. (2010), this paradigm featured a 2 × 3 design, with questions varying along dimensions of self-relevance (Self versus Non-Self) and temporal orientation (Past, Present, or Future). Each self-relevant condition, therefore, was time-matched to a nonpersonal semantic control, producing three contrasts that were not possible in experiment 1: Past Self versus Past Non-Self, Present Self versus Present Non-Self, and Future Self versus Future Non-Self. Example stimuli are provided in Table 3.
Table 3.
Sample stimuli from the expanded Episodic Projection paradigm acquired in experiment 2 and experiment 3
| Task Domain | Condition | Example Stimulus |
|---|---|---|
| Episodic Projection | Past Self | Recall the most recent time that you watched a movie all the way through. Were you watching: at home, at a movie theater, somewhere else? |
| Past Non-Self | Recall popular TV shows ten years ago. The most popular new series at that time was: Mad Men, Gossip Girl, Private Practice? | |
| Present Self | Contemplate your social status at the present moment. How happy are you with your status within social groups: happy, neutral, unhappy? | |
| Present Non-Self | Contemplate the pop music at the top of the charts at the present time. Which of these musicians is leading the other two: Bruno Mars, Ed Sheeran, Drake? | |
| Future Self | Consider that you take a trip out of Boston one year from now. Will you travel: by yourself, with friends or family, with coworkers? | |
| Future Non-Self | Consider that rent prices will increase across the US next year. Which city will likely have the greatest increase: Cincinnati, St. Louis, Las Vegas? |
Given prior findings that episodic future projection preferentially activates components of network A (Andrews-Hanna et al. 2010), and that self-reflection recruits regions also associated with ToM (Andrews-Hanna et al. 2010; see also Lieberman 2007), we hypothesized that the episodic Future and Past contrasts might preferentially recruit network A, while all three self-referential contrasts might recruit network B.
All task conditions were intermixed in each run, to create randomized trial orders. Each 612-s run included 30 trials (5 per condition), with timing matched to experiment 1. Sentence structure, words, and character length were again matched across conditions. Two runs of 30 trials were collected during each of three MRI sessions, yielding 6 total runs (180 individual trials, 30 of each type; ~61 min of total episodic projection data).
theory of mind tasks.
Conditions and stimuli were the same as those in experiment 1 for both ToM tasks. Four 318-s runs of each task were acquired per individual across three MRI sessions (~42 min of total ToM data).
Exclusion criteria and quality control.
Exclusion criteria were carried forward from experiment 1 (see Table 2), but with a slightly more stringent maximum motion cutoff of 1.8 mm. Across subjects, 4 of 150 runs were excluded in experiment 2 for motion. Two additional runs (1 each for 2 subjects) were excluded due to an error in trial presentation. For each subject, the mean maximum motion displacement in included data was <1 mm. Behavioral performance across tasks was also examined for each participant, with no runs excluded based on performance metrics (see results, Experiment 2, and Table 4 for details). One individual in experiment 2 [subject 9 (S9)] discontinued participation after two sessions, resulting in a total of six fixation runs (~42 min), six ToM task runs (~32 min), and four episodic projection task runs (~40 min) for this subject.
Within-subject data processing and template alignment.
iProc was used for data processing and template alignment for each individual in experiment 2, with procedures that matched those from experiment 1. Of note, data from two participants (S7 and S8) were processed following an upgrade to both the Freesurfer version (e.g., from version 4.5.0 to verson 6.0.0 for recon_all) and system software (from centOS6 to centOS7). The iProc procedures, commands, and software versions were otherwise identical across experiments and subjects. Extensive testing revealed minimal differences between data pre-processed using iProc on the original versus upgraded systems, and, since all analyses were conducted within subjects, any small residual differences would not influence results.
Prospective replication of the functional double dissociation.
Functional connectivity procedures were preserved from experiment 1. The k-means estimates were calculated for solutions between k = 10 and k = 17; the solution with the fewest clusters that also featured differentiation between networks A and B was chosen for each individual before examination of any task data.
In two individuals (S8 and S11; see Fig. 9), although the clustering analysis revealed PHC-linked network A and TPJ-linked network B, the regions of these networks were not always side by side, as was found in other subjects. Instead, a third cluster was observed, occupying regions at the spatial intersection of networks A and B. It is possible that this third cluster was a result of sufficient blurring between networks A and B at multiple cortical sites, or that other factors, such as spatial smoothing, might have impacted the specificity of results. For S8, for example, repeating the k-means parcellation using unsmoothed data revealed a larger network A that encompassed the ambiguous cluster. To maintain uniform methods across participants, however, and given that our hypothesis regarded PHC- and TPJ-linked distributed networks, we proceeded with results from smoothed data, and the third cluster was not utilized for further analysis for either subject. Critically, networks were defined before task-based analyses.
Fig. 9.

Networks A and B identified within individuals [subjects 7–12 (S7–S12)] in experiment 2 using both seed-based and k-means parcellation strategies. Estimates of networks A (navy) and B (light blue) identified using seed-based (left) and k-means (right) methods exhibit comparable maps within individuals in experiment 2. In experiment 2, k was set to the lowest number of clusters featuring differentiation of networks A and B, labeled for each individual. Similar to experiment 1 results, estimated network boundaries differ by method, but the two networks could be identified in all individuals with both methods. Seed-based maps are thresholded at r = 0.40.
All procedures used to obtain the results for experiment 1, to obtain and quantify task contrast response distributions, were then applied, without any iterative adjustments, to the data from experiment 2, even including how the data distributions and maps were plotted.
Exploratory analysis of network recruitment for self-referential processing.
Beyond replication of experiment 1, the episodic projection paradigm in experiment 2 also allowed for exploratory analysis of network recruitment across three new self-referential contrasts, each targeting a separate time frame (Past, Present, or Future). Within-subject task analysis procedures (e.g., whole brain signal regression, surface resampling, and run-specific GLMs) mirrored those described for the primary episodic projection and ToM task contrasts. Similarly to the whole brain and region-specific distributional analyses described, z-values from vertices within the bounds of each network were extracted from each of the three unthresholded mean contrast maps. The z-values were then plotted and compared, and effect sizes were calculated to quantify differences between contrast distributions. A positive shift in response distributions across contrasts requiring episodic judgments (those featuring Past and Future conditions) was predicted for network A; a positive shift across all three self-referential contrasts was predicted for network B.
Within-individual statistical inference based on trial-level analyses.
In developing this work, and before initial submission for publication, a preprint was openly distributed to the community that included the above analysis approaches as well as results for experiment 1 and experiment 2 (https://doi.org/10.1101/733048). Dr. Danilo Bzdok read the preprint and generously suggested a statistical strategy for within-individual analyses that could provide valid statistical inference (extending from Hassabis et al. 2014). The approach involved coding, within each GLM, separate regressors for every trial, and then obtaining a sample of contrast estimates within the individual. These estimates could then be used to test dissociations between networks in their entirety and across specific network regions. Moreover, application of this statistical approach to null data could be employed to empirically estimate the false positive rate (Aguirre et al. 1998; Buckner et al. 1998; Eklund et al. 2016). We adopted this strategy as a post hoc analysis in experiment 2 and then prospectively replicated all of the obtained results in experiment 3.
Specifically, trial-specific beta maps were first estimated by including independent trial regressors for each trial within run-specific GLMs, yielding a vertex-level beta map for every trial of every task. Beta values from within the bounds of networks A and B were then extracted, as in our previous analyses, and averaged across vertices to produce trial-specific means. Contrast estimates were created by subtracting control condition mean beta values from target condition mean beta values (e.g., with the first target trial paired with the first control trial). Subtraction produced Gaussian or near-Gaussian distributions of values and removed any residual colinearity. This yielded 40 total ToM contrast estimates and 60 total episodic projection estimates per network. The episodic projection contrasts specific to experiment 2 (Past Self versus Past Non-Self and Future Self versus Future Non-Self) were used, as they had independent controls.
Within each individual, factorial ANOVA (with type II SS) was used to calculate, for the contrast estimates, potential interaction effects between the networks and the task domains (using the R stats and car v3.0–2 packages). For individuals showing significant interaction effects, planned comparisons were also performed (using one-tailed t tests; stats R package), with episodic projection predicted to have a higher mean contrast beta than ToM in network A and ToM higher than episodic projection in network B.
Given the novelty and assumptions of this approach, to estimate the susceptibility to false positives, we repeated the trial-specific analysis, inputting fixation data to each task GLM. Fixation data feature similarly complex correlations to the task data but should not modulate to the task timing and can, therefore, serve as null data. Since the duration of fixation and task runs differed, a fixation run was truncated for input to a ToM GLM, and two concatenated fixation runs were truncated for input to an episodic projection GLM. No two task GLMs received the same fixation input.
This trial-level method, including task and null analyses, was tested for the full networks and then applied within five specific cortical zones: LTC (rostral lateral temporal cortex), PFC (a dorsal region of prefrontal cortex), PPC (posterior parietal cortex), PMC (posteromedial cortex encompassing the PCC through to RSC), and MPFC (medial prefrontal cortex; see Fig. 16A). Selected zones thus included both those previously showing task differentiation (e.g., PPC) and those previously considered core hubs (e.g., PMC and MPFC; Andrews-Hanna et al. 2010). For each region, trial-specific beta values within the bounds of the region mask and each network were extracted and averaged (see Fig. 16B). Thus, as in the prior region-specific analyses, region masks were applied across subjects, but analyses were conducted within individual-specific network boundaries. For each network region, contrasts were calculated as in the full-network analysis, and interaction effects were estimated within each region (see Fig. 16C).
Fig. 16.

Trial-level analyses support functional dissociation across multiple cortical zones. A–C: region-specific, trial-level analysis procedures are shown. A: five cortical zones of interest were selected approximating LTC (lateral temporal cortex), PFC (prefrontal cortex), PPC (posterior parietal cortex), PMC (posteromedial cortex), and MPFC (medial prefrontal cortex). B: region masks were overlaid on each individual’s network map to identify region-specific network boundaries. Beta values were extracted, for every trial of each task, from within these boundaries and averaged. Contrast estimates were then calculated by subtracting control trial values from target trial values. Within each region, factorial ANOVA tested for network × domain interaction effects on the contrast values. C: betas were then standardized to z-weighted values and plotted for ease of visualization. Significant or trend interaction effect: ++P < 0.05, +P < 0.1). This procedure was performed for each network in its entirety (D) and for each region (E), using both task and null data. D: full-network results reveal significant interactions for 5 out of 6 individuals’ [subjects 7–12 (S7–S12)] task data in experiment 2 (all but S10; S7 not shown), with network A exhibiting preferential recruitment for episodic projection (EP; yellow) and network B for theory of mind (ToM; red). No significant interaction effects were seen in null data; one null dataset showed a trend (S8). E: region-specific results are shown for a single subject (S7). Across regions, the task data show significant interaction effects. No significant interaction effects appear for the null data in S7 (Tables 6 and 7 show results from all individuals in experiments 2 and 3).
For both the full-network and region-specific analyses, significant interactions between network and domain, supporting a functional dissociation, were predicted for the task data and not for the null data. For the region-specific analyses, such interaction effects were predicted to appear across multiple, distributed cortical zones.
Experiment 3: Prospective Triplication
Experiment 3 was conducted as a prospective replication of all experiment 2 procedures, including those from experiment 1 (as a prospective triplication), as well as a full independent replication of the trial-level analyses that were applied for the first time in experiment 2.
An independent sample of six adults was recruited [mean = 20.0 yr (SD = 1.4), 1 man, all right-handed] to complete four scanning sessions each. As in experiment 1 and experiment 2, all paid participants were native English speakers, were screened to exclude neurological or psychiatric illness, and provided written, informed consent through the protocol approved by the Institutional Review Board of Harvard University.
Data acquisition, quality control and processing.
MRI data acquisition and processing methods, as well as task and analysis procedures in experiment 3, were the same as in experiment 2. Eleven 7-min, 2-s BOLD fixation runs were acquired per individual (~77 min of data) for functional connectivity analysis. Six total runs of the expanded episodic projection paradigm were acquired per subject (61 min of data), along with eight total runs of the ToM tasks (four runs per task; 42 min of total data). Across the episodic projection and ToM tasks, conditions and stimuli were the same as those in experiment 2.
Exclusion criteria were carried forward from experiment 2, as well (see Table 2), including a maximum motion cutoff of 1.8 mm. Across subjects, 12 of 150 runs were excluded for motion (6 runs for each of 2 subjects). For S14, one fixation run with maximum motion above 1.8 mm was included. Nonetheless, for included data, the mean maximum motion displacement was again ≤1.05 mm for all subjects. Behavioral performance across tasks was also examined for each participant, with no runs excluded based on performance metrics (see results, Experiment 3, and Table 4 for details). One experiment 3 subject (S13) discontinued participation after two sessions, resulting in six total fixation runs (∼42 min), six ToM task runs (∼32 min), and four episodic projection task runs (∼40 min) for this subject.
iProc was used for data processing and template alignment for each individual in experiment 3, with procedures that matched those from experiments 1 and 2. Data from all individuals in experiment 3 were processed following the upgrades described in experiment 2.
Prospective replication of the functional double dissociation.
Functional connectivity procedures were carried forward from experiments 1 and 2. k-means estimates were calculated for solutions between k = 10 and k = 20. The clustering solution featuring differentiation between networks A and B, as well as between these and other large-scale networks (e.g., Braga and Buckner 2017), was chosen for each individual. For individuals requiring higher k to identify additional networks (e.g., S16), referential features of networks A and B were still consistently observed, and minor changes to these networks’ boundaries were noted at higher versus lower k. Critically, networks were defined before task-based analyses.
All procedures used to obtain the results for experiment 2, including those for calculating and quantifying task contrast response distributions, conducting the analysis of network recruitment for self-referential processing, and testing whole brain and region-specific network recruitment through trial-level techniques, were then applied, without any adjustments, to the data from experiment 3. Of note, since two individuals (S14 and S16) exhibited motion above the inclusion threshold for the majority of fixation runs, during trial-level analysis of null data, multiple GLMs received the same fixation inputs, but never within a single task paradigm.
RESULTS
Experiment 1
Behavioral performance.
Participants missed a maximum of a single trial each, across all runs of all task contrasts (see Table 4). Within each contrast, paired t tests for differences between mean RTs by condition revealed largely similar RTs across the ToM contrasts of interest (False Belief versus False Photo, P > 0.05 for all within-subject t tests except S6; Emo Pain versus Phys Pain, all P > 0.05 except S3), as well as across the episodic projection contrasts (Future Self versus Present Self, P > 0.05 except S5; Past Self versus Present Self, P > 0.05 except S5). For each individual, no acquired task data were excluded based on behavioral metrics. For all statistical analyses summarized in tables, detailed results are available (see the endnote).
Parallel interdigitated networks are identified within individuals.
Networks A and B were identified within individual subjects using seed-based and k-means parcellation strategies (Fig. 2). Replicating Braga and Buckner (2017; see also Braga et al. 2019b), distinct networks were found for all subjects, using manually placed seed regions in left PFC. Given that seed-based methods introduce bias near the seed regions and are sensitive to manual placement, a data-driven approach to network identification was also employed: k-means parcellation. Within-subject estimates of networks A and B could be identified that were similar to the seed-based networks, thus establishing that the broad distinction between the networks is not reliant on a specific analysis strategy (Fig. 2; see also Braga et al. 2019b).
Fig. 2.

Networks A and B identified within individuals [subjects 1–6 (S1–S6)], using both seed-based and k-means parcellation strategies. Estimates of networks A and B from experiment 1 identified using seed-based (left) and k-means (right) methods exhibit comparable maps. Although exact network boundaries differ by method, both techniques reveal interdigitated network patterns along the medial and lateral frontal cortex, as well as similarly juxtaposed network boundaries along the posteromedial cortex and inferior parietal lobule. k = 17 for all k-means parcellations shown here; network A appears in navy, and network B in light blue. Seed-based maps are thresholded at r = 0.40.
In all individuals, the two parallel, interwoven networks spanned frontal, temporal, and parietal cortices and exhibited “diagnostic” features (Braga et al. 2019b): network A showed connectivity to posterior PHC, largely absent in B, while network B included a more rostral portion of the IPL extending into the TPJ. In addition, network A included representation at or near RSC, ventral to a region of network B along the posterior midline. Network B featured a small region of the MPFC ventral to that of network A, occupied a greater portion of LTC than network A, and, in most cases, included a region along the lateral inferior frontal cortex, which was absent or smaller and more dorsally positioned in network A.
While the majority of network details generalized across individuals with both network estimation methods, there were also details that differed among the subjects and between the methods. In several participants, for example, whether defined through seed-based or k-means parcellation, network A showed minimal representation in left LTC, a region included within the original description of network A (Braga and Buckner 2017). The network A representation in LTC was robust in several of the individuals, suggesting that this is either a region of particularly complex geometry, or additional data may be necessary for full specification of lateral temporal features in all individuals. Idiosyncratic patterns of signal dropout may also obscure this region in some individuals.
In relation to network selection method, while the general patterns were similar using either approach, the exact boundaries differed between the methods. This is expected to some degree, because k-means parcellation forces a winner-takes-all separation. That the outer boundary and specific details of a region’s extent and location differed between methods is a reminder that each method has different sensitivities and should be considered an approximation of the true underlying organization. S5 showed the greatest disagreement between methods. These details should not detract from the broader observation that the two networks could be identified in all individuals, with both methods (Fig. 2).
Given our goal of formally testing for functional dissociation between the networks, we carried forward the unbiased network estimates from the k-means parcellation. This is a practical decision and should not be taken to mean we have more confidence in one method’s ability to identify the true biological boundary of the functional-anatomical zone.
Networks A and B show functional dissociation within individuals.
Our primary hypothesis was that episodic projection would preferentially recruit PHC-associated network A, and ToM would preferentially recruit TPJ-associated network B. To quantify each network’s functional recruitment, within a subject, the distributions of BOLD responses across vertices for each task domain were directly contrasted for each network (Fig. 3).
Fig. 3.

Networks A and B show functional dissociation within individuals [subjects 1–6 (S1–S6)] in experiment 1. Left: network A (navy) and network B (light blue) for each subject, as defined by k-means clustering. Right: the distributions plot the functional responses within each network for the two task domains [theory of mind (ToM), red; episodic projection (EP), yellow; overlap, orange]. See Fig. 1 for method. For network A, all 6 individuals reveal a functional response increase for EP over ToM, and most strongly in 4 subjects (with Cohen’s d range = 0.88–2.03 for 4 subjects; d = 0.19 for S1 and d = 0.20 for S4). For network B, all 6 individuals reveal the opposite pattern: the ToM response is increased over EP (Cohen’s d range = 0.51–1.76). The consistent opposing patterns between networks are evidence for functional double dissociation.
The dissociation was robust; all six subjects exhibited the predicted pattern of differential network recruitment across 12 out of 12 distribution comparisons. Differences between distributions were strong across individuals for network B (6 out of 6 subjects; Cohen’s d range: 0.51–1.76) and present also for network A, although weaker in two subjects (Cohen’s d range: 0.88–2.03 for 4 subjects; d = 0.19 for S1 and d = 0.20 for S4). Initial quantitative analysis of functional recruitment by task domains thus revealed evidence for a double dissociation in all six subjects. Since two subjects exhibited weaker differentiation for network A, these results motivated further analysis of network A, focusing on two component regions that differentiate this network most strongly (Braga and Buckner 2017).
Parahippocampal and retrosplenial/ventral posterior cingulate regions of network A show strong functional dissociation.
Initial findings revealed variation across subjects in network A recruitment by task domain. Post hoc analyses were conducted for the two regions in network A most closely linked to the MTL memory system, allowing a robust test for dissociation, albeit in a subset of network A regions. Procedures identical to those used in the primary distribution analysis (Fig. 1) were limited to vertices within a ventral PCC/RSC region and separately within a PHC region (Fig. 4). All six subjects exhibited robust preferential recruitment of ventral PCC/RSC and PHC regions of network A by episodic projection tasks over ToM tasks (Cohen’s d ranges: ventral PCC/RSC, 0.54–4.43; PHC, 1.67–3.24). These results further support dissociable functional responses of networks A and B but leave open the possibility that the double dissociation does not pertain to all of the distributed zones of cortex.
Preferential recruitment is evident across multiple cortical zones.
The analyses above provided evidence for differential network recruitment by tasks from episodic projection and ToM domains. However, the described quantitative results could align either with fully distinct networks or with previously proposed network configurations featuring dissociable network features and shared “core” regions (Andrews-Hanna et al. 2010). That is, the described dissociation results could be carried out by subsets of network regions. To explore whether recruitment differences were limited to specific cortical zones or were distributed, the differential task domain responses were visualized for each individual (Fig. 5) in relation to the independently defined estimates of networks A and B.
Fig. 5.

Procedure for visualizing task response patterns within individuals. Within each individual, the separate task contrasts were first estimated. Past: Past Self versus Present Self; Future: Future Self versus Present Self, within the episodic projection domain. False Belief: False Belief versus False Photo; Other Pain: emotional (Emo) Pain versus physical (Phys) Pain within the theory of mind (ToM) domain. Color bars indicate z-values. Within each domain, the contrasts were averaged to yield a single best estimate. The two domain maps were then thresholded and plotted on the same brain (center image) to reveal overlap (ToM, red; episodic projection, yellow; overlap, orange).
Figure 6 displays the full task contrast maps for each individual in experiment 1, in relation to network A and B boundaries. The first broad observation is that the episodic projection and ToM contrast maps have non-overlapping components in most zones of cortex. It is not simply that certain zones show spatial functional separation, such as TPJ versus more caudal IPL, but rather that spatial separation could be observed in MPFC, LTC, and dorsolateral PFC, as well as in PMC. Thus, at a map level within individuals, the two task domains display broad functional separation across the cortex.
Fig. 6.

Networks A and B exhibit differential recruitment by episodic projection (EP) and theory of mind (ToM) tasks across multiple cortical zones within individuals [subjects 1–6 (S1–S6)]. Within each column, the lateral (left) and medial (right) surfaces of the left hemisphere are shown. The colors represent the task responses (ToM, red; EP, yellow; overlap, orange; see Fig. 5). For each subject, the left column displays the functional response patterns in relation to the network A boundaries. The right column shows the same response patterns in relation to the network B boundaries. The network boundaries are illustrated by black outlines. EP and ToM are either partially or fully dissociable across multiple cortical regions in all subjects. The most striking double dissociations are evident in S2 and S6, where small idiosyncratic features of the differential task response patterns are predicted by the network boundaries.
The second critical observation is that the functional connectivity estimates of networks A and B within each individual predict many idiosyncratic features of the differential patterns of task response. This was not always the case in all subjects in all zones (e.g., LTC and MPFC displayed the most complexity), but it was the case often and clearly in some individuals (e.g., S2 and S6).
Of particular note, task responses in networks A and B showed clear spatial separation in the zones previously considered “core” regions along the cortical midline (Andrews-Hanna et al. 2010). For example, in several subjects, the posteromedial representation of network A included a triad of distinct regions: a region near ventral PCC/RSC, as well as distinct dorsocaudal and dorsorostral regions. The network B region of response was most typically in between these three network A regions. In multiple cases, the differential task response followed this idiosyncratic anatomy, which is a reproducible hallmark feature of network interdigitation along the posterior midline, when visualized in surface representation or in the volume (Braga et al. 2019b).
Overall, evidence from both quantitative analysis and topographic visualization suggests a functional dissociation of networks A and B, with network A preferentially recruited for the task contrasts isolating processes related to episodic projection and network B for task contrasts isolating processes related to ToM. The dissociation does not appear to be limited to one zone of cortex, but rather, as is evident in the clearest cases, reflects functional specialization across the full extent of the distributed networks, across both hemispheres (Fig. 7).
Fig. 7.

Networks A and B exhibit differential recruitment by episodic projection (EP) and theory of mind (ToM) tasks in the right hemisphere. Using the same procedures as in Fig. 6, the right hemisphere is displayed for each of the 6 subjects (S1–S6) from experiment 1. Each row shows the lateral (right) and medial (left) views of the right hemisphere for all subjects, with network A boundaries (left) or network B boundaries (right).
Functional dissociation of networks A and B observed across task contrasts.
For all analyses above, we collapsed across tasks within the episodic projection and ToM domains, toward the primary goal of detecting domain-related distinctions in network recruitment. This was the a priori design of the study. As an additional analysis, we examined differences across each specific task contrast.
Contrast-specific recruitment of networks A and B (Fig. 8) bolstered the findings from the pooled results (see Fig. 3). Within network A, for example, all subjects showed similar mean recruitment across ToM tasks (Cohen’s d range = 0.05–0.33), and four subjects showed similar mean recruitment across episodic projection tasks (d = 0.09–0.33). For S2 and S6, the episodic projection tasks exhibited greater differences (d = 0.52 for S2; d = 0.83 for S6, Future > Past), but for these individuals and three others (S3, S4, and S5), both episodic projection contrasts still exhibited higher mean z-values than both ToM contrasts within network A (d range = 0.08–2.25 for pairwise comparisons; most d > 0.80). Individuals featuring more ambiguous network A distributions (see S1 and S4 in Fig. 3) exhibited similar recruitment for both ToM tasks, suggesting a subject difference rather than a task difference. Across participants, no single task contrast appeared to drive the network A results.
Fig. 8.
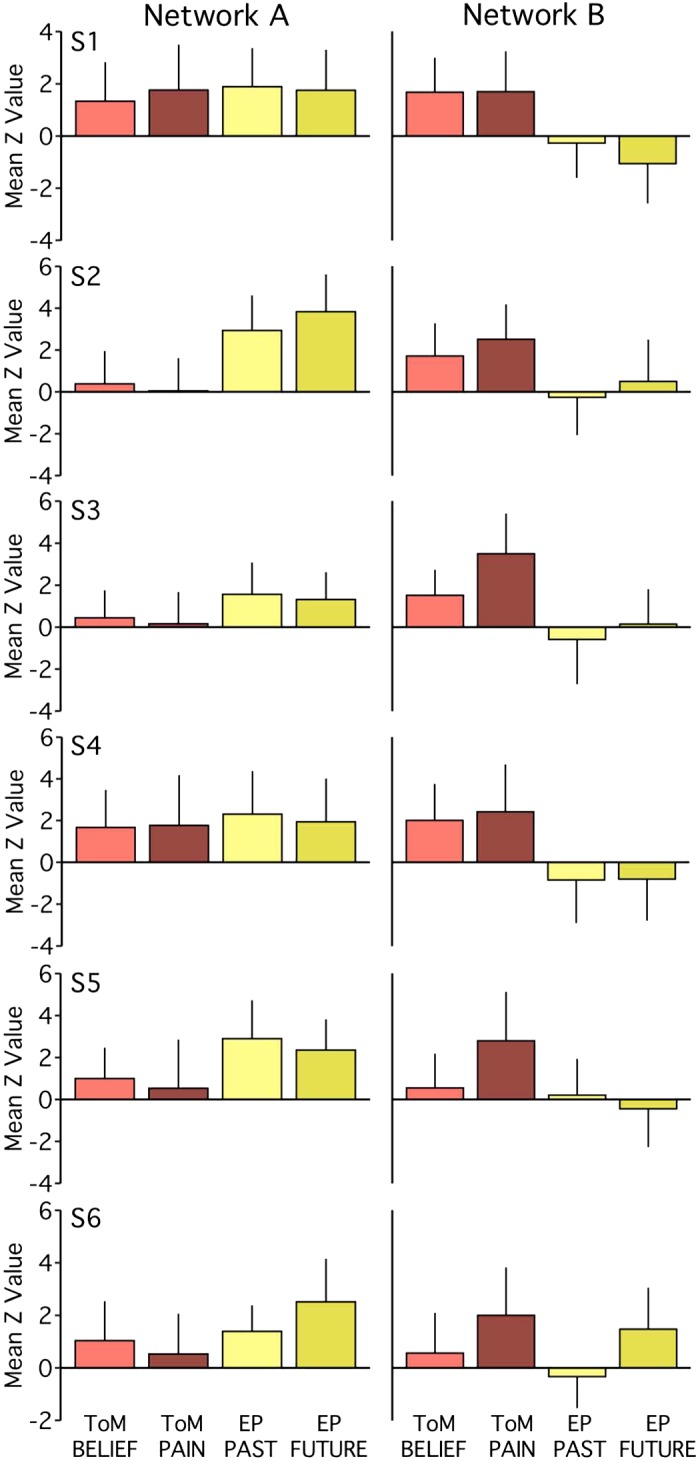
Functional dissociation of networks A and B observed across task contrasts in experiment 1. The bar graphs plot the functional responses (mean z-values and standard deviations across runs) within each network for each task-specific contrast. Tasks within a domain exhibit comparable patterns of network recruitment. Within network B, for most individuals [subjects 1–6 (S1–S6)], the Other Pain contrast (ToM PAIN) exhibits stronger recruitment than the False Belief contrast (ToM BELIEF). For network A, functional response increases for both episodic projection (EP) contrasts (EP Past and EP Future) over both theory of mind (ToM) contrasts are evident in 5 out of 6 subjects (Cohen’s d range = 0.08–2.25 for pairwise comparisons, with most d > 0.80). For network B, increases for both ToM contrasts over both EP contrasts are also evident in 5 out of 6 subjects (d range = 0.20–2.01, with most d > 1.20).
Within network B, there was evidence for a systematic task difference in the ToM domain. All six subjects showed a greater response for the Other Pain contrast relative to the False Belief contrast. Still, even with this difference, both ToM contrasts, barring one exception, showed higher responses within network B than either of the episodic projection task contrasts (Cohen’s d range = 0.20–2.01 for all but S6; most d > 1.20). Only S6 had a ToM mean z-value (for False Belief) less than the mean of a single episodic projection task contrast (Future). Thus either of the two ToM task contrasts would still allow the critical double-dissociation between networks A and B to be detected.
Experiment 2
Data collection and analyses of experiment 2 were conducted prospectively after the results of experiment 1 were known, and analysis procedures used in experiment 1, down to the details of exactly how results would be plotted, were settled. Thus the findings should be considered a prospective replication.
Behavioral performance.
Tables 4 and 5 present data on behavioral performance for included task runs. Most participants responded to all trials, but S11 exhibited multiple skipped trials during the False Belief task. Behavioral monitoring revealed that S11 responded to all trials of this task, but not always within the time frame necessary for recording; these data were included in subsequent analysis. One ToM run (from the Other Pain task) was excluded from each of two participants (S11 and S12) due to an error in trial presentation that resulted in repeated trials.
Table 5.
Behavioral performance relevant to exploratory analyses of the expanded episodic projection paradigm acquired in experiment 2 and experiment 3
| Experiment | Subject No. | Past Self | Past Non-Self | Present Self | Present Non-Self | Future Self | Future Non-Self |
|---|---|---|---|---|---|---|---|
| 2 | S7 | 3,956 (0) | 4,896* (0) | 3,800 (0) | 5,156* (0) | 4,558 (0) | 4,763 (0) |
| S8 | 4,334 (0) | 4,992* (0) | 4,211 (0) | 5,499* (0) | 4,723 (0) | 4,986 (0) | |
| S9 | 5,651 (0) | 5,303 (0) | 5,549 (0) | 5,921 (0) | 5,767 (0) | 5,547 (0) | |
| S10 | 4,759 (0) | 5,968* (1) | 4,946 (0) | 5,609* (0) | 4,966 (0) | 5,030 (0) | |
| S11 | 6,855 (0) | 7,011 (0) | 6,736 (0) | 7434* (0) | 6926 (0) | 7975* (0) | |
| S12 | 6,437 (0) | 7,292* (0) | 6,609 (0) | 6,881 (0) | 6,766 (0) | 7,542* (0) | |
| 3 | S13 | 6,172* (0) | 4,870 (0) | 5,598 (0) | 6,032 (0) | 5,721 (0) | 5,630 (0) |
| S14 | 3,775 (0) | 4,363* (0) | 3,885 (0) | 4,206 (0) | 3,678 (0) | 4,357* (0) | |
| S15 | 5,526 (0) | 6,979* (0) | 5,622 (0) | 7,040* (0) | 5,699 (0) | 6,746* (0) | |
| S16 | 7,101 (0) | 7,130 (0) | 6,690 (0) | 8,202* (0) | 7,311 (0) | 8,003 (0) | |
| S17 | 6,264 (0) | 7,644* (0) | 5,892 (0) | 7,845* (0) | 6,490 (0) | 7,131* (0) | |
| S18 | 6,672 (0) | 6,569 (0) | 6,241 (0) | 6,980 (0) | 6,550 (0) | 6,888 (0) |
Values show the average response time (RT) across included task runs in milliseconds (with the no. of trials skipped in parentheses). Participants exhibited high compliance; none skipped more than one trial across all runs of all tasks. S7–S18, subjects 7–18.
Condition featuring a slower RT within contrast of interest (Past Self vs. Past Non-Self, Present Self vs. Present Non-Self or Future Self vs. Future Non-Self; paired t-test, P < 0.05).
RTs were largely similar across the ToM contrasts of interest in each task (False Belief versus False Photo, P > 0.05 for all within-subject paired t tests; Emo Pain versus Phys Pain, all P > 0.05), as well as across the primary episodic projection contrasts (Future Self versus Present Self, P > 0.05 except S7 and S8; Past Self versus Present Self, all P > 0.05).
For the added episodic projection contrasts in experiment 2, five out of six participants (all but S9) showed a slower RT for at least one of the Non-Self conditions compared with the time-matched Self condition (see Table 5). No single Non-Self condition exhibited consistently slower RTs across subjects. Within each individual, one-way ANOVA also revealed no significant differences in RTs by time orientation (e.g., Past, Present, or Future, calculated using the R stats package). Behavioral performance metrics thus supported compliance across tasks by all individuals.
Parallel interdigitated networks replicate across additional individuals.
Networks A and B were again identified using both seed-based and k-means parcellation strategies (Fig. 9). The parallel networks were found to be interdigitated and distributed across frontal, temporal, and parietal regions with the diagnostic spatial features for the networks again largely observed across individuals (Braga et al. 2019b): network A exhibited connectivity to posterior PHC (absent in most individuals’ estimates of network B), and network B included a portion of the IPL near to the TPJ, rostral to a region of network A. Network A also showed a more ventral representation along the posterior midline, extending to or near RSC; network B included a region ventral to network A regions in MPFC.
For some individuals, as in experiment 1, network A as estimated by k-means showed minimal representation in left LTC. For a few individuals (e.g., S8 and S11), the MPFC showed smaller network A representations, and PMC showed smaller network B representations in the k-means than in the seed-based estimates. Medial regions have been difficult to parse in group-averaged data (Andrews-Hanna et al. 2010) and complexity in these regions appears difficult to resolve here within some individuals, as well. For some individuals (S7, S9), the k-means estimates also lacked the typically strong representation of network B within ventrolateral PFC. These details again highlight that both k-means and seed-based methods produce only approximations of network organization. Despite this, overall, the two networks could be identified in all individuals, with both methods (Fig. 9).
For planned analyses in experiment 2, we carried forward the unbiased k-means network estimates for each individual.
Networks A and B replicate functional dissociation across additional individuals.
Functional recruitment was quantified for each task domain within each network (Fig. 10). Results again strongly supported functional dissociation for both network A (5 out of 6 subjects; Cohen’s d range: 0.75–1.52) and network B (all subjects; Cohen’s d range: 0.09–3.01; d > 1.20 for all except S11). The predicted double dissociation pattern was seen clearly in most subjects. Distinctions between the networks were most notable in a subset of individuals (e.g., S7, S8, and S12).
Fig. 10.

Networks A and B replicate functional dissociation within individuals [subjects 7–12 (S7–S12)] in experiment 2. Left: the spatial distributions of network A (navy) and network B (light blue) for each subject as defined by k-means clustering. Right: the distributions plot the functional responses within each network for the two task domains [theory of mind (ToM), red; episodic projection (EP), yellow; overlap, orange]. For network A, 5 out of 6 subjects demonstrate a functional response increase for EP over ToM contrasts (Cohen’s d range = 0.75–1.52). For network B, all subjects demonstrate the opposite pattern: an increase for ToM over EP (d range = 0.09–3.01; d > 1.20 for all except S11). These findings replicate and support a functional double dissociation.
Robust functional dissociation replicates for parahippocampal and retrosplenial/ventral posterior cingulate regions of network A.
Region-specific explorations for the ventral PCC/RSC and PHC regions of network A again demonstrated robust dissociation (Fig. 11). For all six individuals, the region-specific analysis revealed preferential recruitment of both ventral PCC/RSC and PHC by episodic projection tasks over those requiring ToM (Cohen’s d ranges: ventral PCC/RSC, 1.60–3.42; PHC, 2.35–3.39).
Preferential task recruitment across multiple cortical zones replicates.
Contrast maps revealed widespread non-overlapping response patterns between task domains (Fig. 12). Estimates of networks A and B overlapped with task patterns in most subjects and clearly in a subset of this independent sample (e.g., S7 and S12), with network A better predicting the episodic projection map and network B the map for ToM.
Fig. 12.

Networks A and B replicate differential recruitment by episodic projection (EP) and theory of mind (ToM) tasks across multiple cortical zones within individuals [subjects 7–12 (S7–S12)] in experiment 2. Within each column, the lateral (left) and medial (right) surfaces of the left hemisphere are shown. The colors represent the task responses (ToM, red; EP, yellow; overlap, orange; see Fig. 5). For each subject, the left column displays the functional response patterns in relation to network A boundaries, and the right column in relation to network B boundaries, with boundaries shown as black outlines. EP and ToM are either partially or fully dissociable across multiple cortical regions in all subjects in experiment 2, replicating results from experiment 1. The most striking double dissociations are evident in S7 and S12, where unique features of the differential task response patterns are predicted by the network boundaries in all cortical zones.
Of particular note, although nearly all individuals’ network estimates exhibited expected, diagnostic features (Braga et al. 2019b), as an exception, the network B estimate of S7 included a portion of posterior PHC, typically present only in network A. As revealed in Fig. 12, the task maps from each domain exhibited high similarity to network boundaries in this region. The portion of PHC attributed to network B surrounded a region of ToM activation, whereas an adjacent portion of PHC, attributed to network A, showed preferential response during the episodic projection contrast. These features would likely be lost in group-averaged data.
Task patterns along the posterior midline exhibited spatial separations that, in the clearest individuals, were well-aligned to the boundaries of networks A and B (previously considered a “core” region of the DN; Andrews-Hanna et al. 2010). In multiple individuals, the posteromedial representation of network A again included a triad of regions, each exhibiting preferential overlap with the episodic projection contrast map, while an interwoven region of network B exhibited preferential overlap with the contrast map for ToM. Spatial alignment between networks and contrast map predictions was not limited to a specific cortical zone (e.g., see the MPFC and lateral PFC in S12, Fig. 12) or hemisphere (Fig. 13).
Fig. 13.

Networks A and B replicate differential recruitment by episodic projection (EP) and theory of mind (ToM) tasks in the right hemisphere in experiment 2. Using the same procedures as displayed in Fig. 12, the right hemisphere is displayed for each of the 6 subjects [subjects 7–12 (S7–S12)] from experiment 2. Each row shows the lateral (right) and medial (left) views of the right hemisphere for all subjects, with network A boundaries (left) or network B boundaries (right).
These results replicate a functional dissociation of networks A and B across distributed cortical zones, with network A preferentially recruited for contrasts requiring episodic projection and network B for contrasts requiring ToM.
Functional dissociation of networks A and B replicates across task contrasts.
Task-specific analyses again provided evidence for a functional double dissociation (Fig. 14). Within network A, five of six subjects showed greater responses in each of the episodic projection task contrasts than in either contrast of the ToM tasks (Cohen’s d range = 0.37–1.68 for pairwise comparisons; most d > 0.90). The anomalous individual’s response pattern (S10; see Fig. 10) was the same for both task contrasts within each domain, consistent with a subject, rather than a task, effect.
Fig. 14.
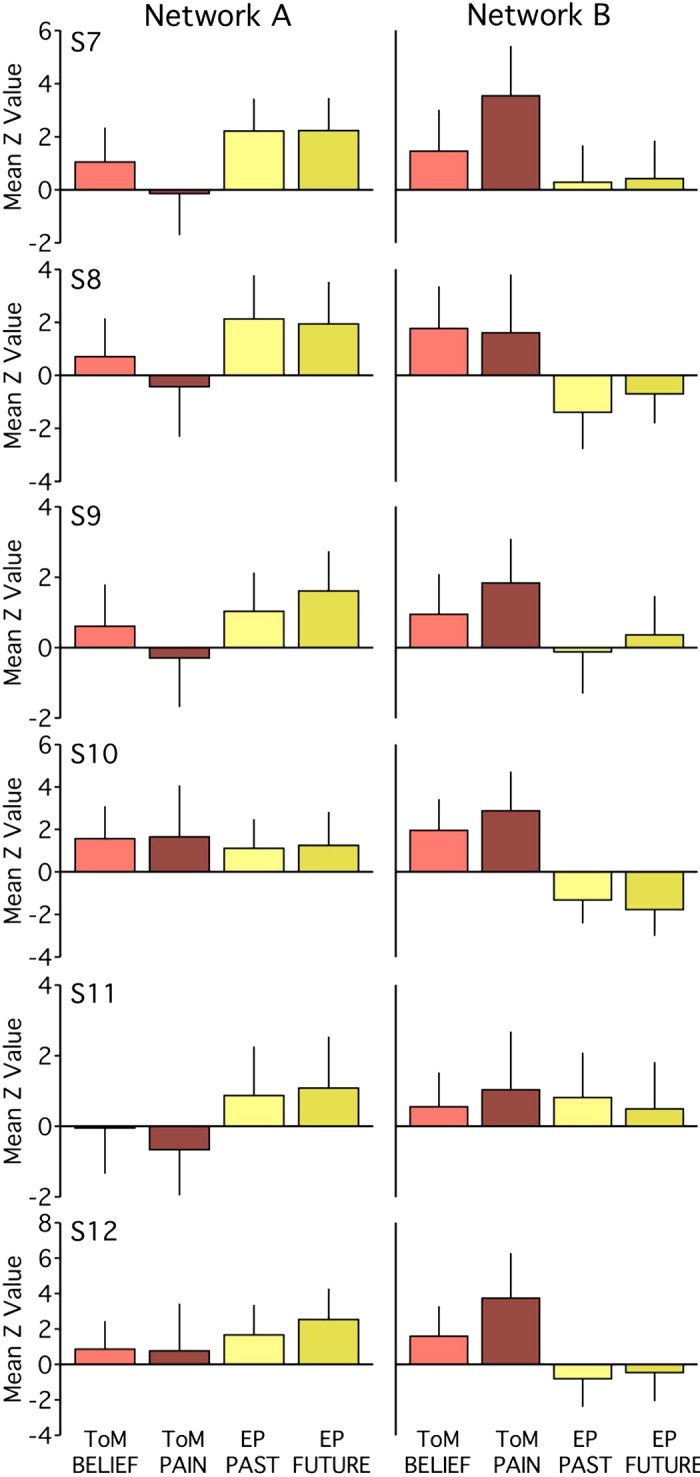
Functional dissociation of networks A and B replicates across task contrasts in experiment 2. Functional responses (mean z-values and standard deviations across runs) within each network for each specific task contrast are shown. Replicating findings from experiment 1, tasks within a domain exhibit comparable differences in network recruitment, and the Other Pain contrast (ToM PAIN) shows the strongest recruitment of network B in multiple individuals [subjects 7–12 (S7–S12)], rather than the False Belief contrast (ToM BELIEF). For network A, functional response increases for both episodic projection (EP) contrasts (EP Past and EP Future) over both theory of mind (ToM) contrasts are evident in 5 out of 6 subjects (Cohen’s d range = 0.37–1.68 for pairwise comparisons, most d > 0.90). For network B, increases for both ToM contrasts over both EP contrasts are evident in 5 out of 6 subjects (d range = 0.52–2.94, most d > 1.50).
Within network B, as in experiment 1, there was a systematic difference in the ToM domain, with a greater response for the other pain contrast relative to the False Belief contrast in every subject except S8 (Cohen’s d range = 0.36–1.20). Yet the ToM mean responses for both task contrasts were greater than the responses in either of the episodic projection contrasts for all subjects but S11 (d range = 0.52–2.94 for those 5 subjects’ pairwise comparisons; most d > 1.50).
Thus, in all relevant ways, experiment 2 replicated experiment 1. In the few instances where individual subjects deviated, the patterns were consistent across specific task contrasts: the individual as a whole appeared atypical.
Motivated to examine additional facets of network recruitment, we next conducted an exploratory analysis of self-referential contrasts that were not possible in experiment 1.
Exploratory analysis of episodic projection contrasts varying time orientation.
We conducted an exploratory analysis of the three new contrasts from experiment 2’s episodic projection paradigm that differed in temporal orientation: Past Self versus Past Non-Self, Present Self versus Present Non-Self, and Future Self versus Future Non-Self. Since all three contrasts include Self versus Non-Self components, each contrast isolates a distinct temporal context. Admittedly, any such complex contrast will inadvertently change other task features and is certainly imperfect. Nonetheless, analyzing the three separate contrasts allows for tests of generality and, where differences are found, seeds observations for future investigation. The Past and Future contrasts, which required episodic construction of previously experienced or imagined scenes, were predicted to preferentially recruit network A (e.g., Andrews-Hanna et al. 2010), while all three contrasts, featuring self-referential component processes, were predicted to recruit network B. The results are illustrated in Fig. 15.
Fig. 15.
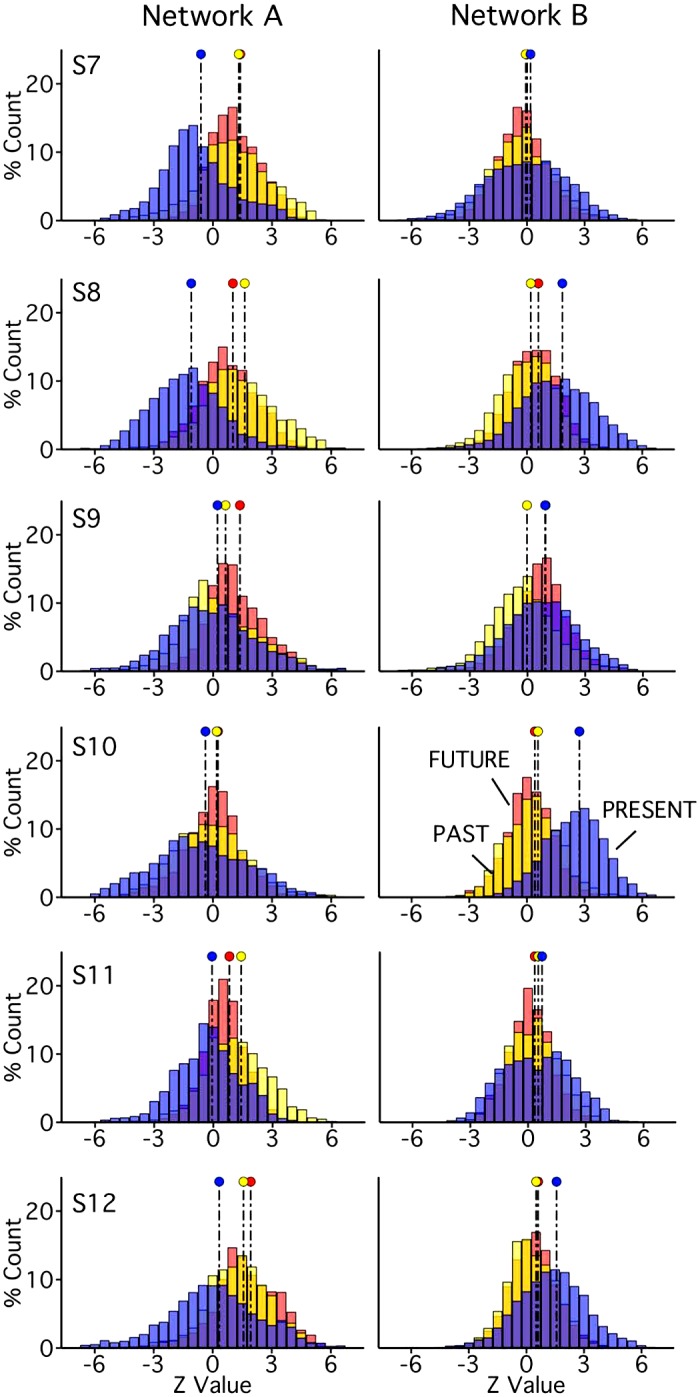
Exploratory analysis of network recruitment across temporal orientations. Results from the time-matched contrasts in the episodic projection task are displayed. The distributions plot the functional responses within each network for these contrasts (Past Self versus Past Non-Self in yellow, Present Self versus Present Non-Self in blue, and Future Self versus Future Non-Self in red). For network A, all subjects [subjects 7–12 (S7–S12)] show greater responses in both the Past and Future conditions relative to the Present (Cohen’s d range = 0.20–1.47; most d > 0.60). For network B, the Present condition shows a shifted response relative to the Past and Future conditions in almost all instances (with the one exception of the Future condition in S9; d range = 0.10–1.67 for all but S9, most d > 0.60).
As predicted, for network A, all six subjects exhibited greater recruitment by both the Past and Future contrasts over the Present contrast, with four individuals (S7, S8, S11, and S12) showing differences of medium to large effect (Past + Future > Present: Cohen’s d range = 0.60–1.47 for pairwise comparisons). Three of these subjects (S7, S8, and S12) were notable not only for how large the difference was between the temporally directed conditions (Past and Future) in comparison to the Present contrast, but also for how similar the two temporal conditions were to each other (Cohen’s d = 0.05 for S7, 0.36 for S8, and 0.23 for S12). Thus the Past and Future contrasts elicit responses in network A that are strong and largely similar.
For network B, we did not observe the predicted, positive shift across the three self-referential contrasts. Rather, in almost all individuals (all but S9), the Present contrast was greater than both the Past and Future contrasts, with three of the individuals (S8, S10, S12) showing sizable effects (d = 0.62–1.67). This result is consistent enough to warrant attention in future studies, but is not consistent with the prediction that self-referential decisions would involve strong responses in both networks A and B. A notable and unexpected finding is that the double-dissociation observed for the episodic projection contrasts appears to extend to Past and Future contrasts, even when self-referential processing is not controlled.
An additional observation for future consideration is quite subtle. In instances when an individual did not show contrast-related differences between conditions, little recruitment by any contrast was apparent (e.g., see S10 for network A and S7 and S11 for network B). That is, there were no instances in which all three contrasts produced a clear positive response in either network A or network B.
Trial-level analyses support functional dissociation across distributed network zones.
To explicitly test whether observed network dissociations exist across distributed cortical regions, we conducted post hoc trial-level analyses in experiment 2. Rather than examining overall domain estimates that modeled all trials of a type together, trial-specific beta values were estimated and used to create up to 40 (ToM) or 60 (episodic projection) separate contrast values per domain, within each network. Both ToM tasks were included in the trial-level analyses, as well as the episodic projection contrasts from the expanded experiment 2 paradigm (Future Self versus Future Non-Self and Past Self versus Past Non-Self). For each individual, factorial ANOVA (using type II SS) then tested for interaction effects, between the networks and domains, on these contrast values. Both for the full networks and for five specific network regions, identical procedures were applied to task and null data (see Fig. 16).
Full-network analyses revealed statistically significant interactions between networks and domains for five of six individuals (P < 0.05 for all but S10; Table 6; Fig. 16D), as expected from the distribution patterns. For those five individuals, planned comparisons revealed significantly higher episodic projection contrast values for all subjects in network A (P < 0.05) and significantly higher ToM contrast values for four of the subjects in network B (P < 0.05 for all but S11). Critically, the same analysis, when applied to null data, revealed no interaction effects, implying that false positives are unlikely to account for the task results (see Table 6).
Table 6.
Results from the experiment 2 within-individual trial-level analyses of task and null data
| Subject No. | Composite | PFC | PPC | LTC | PMC | MPFC |
|---|---|---|---|---|---|---|
| Task data | ||||||
| S7 | ++ | ++ | ++ | ++ | ++ | ++ |
| S8 | ++ | ++ | − | − | ++ | ++ |
| S9 | ++ | ++ | − | ++ | − | ++ |
| S10 | − | − | − | + | − | + |
| S11 | ++ | ++ | − | + | ++ | ++ |
| S12 | ++ | ++ | ++ | − | ++ | ++ |
| Null data | ||||||
| S7 | − | − | − | − | − | − |
| S8 | + | − | ++ | − | − | − |
| S9 | − | − | − | − | − | − |
| S10 | − | − | − | − | − | − |
| S11 | − | − | − | − | − | − |
| S12 | − | − | − | − | − | − |
Each cell indicates, for a single individual’s trial-specific contrast values, whether or not a network by domain interaction effect was significant. For the task data, data from the relevant task runs were input to trial-specific general linear models (GLMs). For the null data, fixation data were input to the same task GLMs. S7–S12, subjects 7–12. Composite, full networks; LTC, lateral temporal cortex; MPFC, medial prefrontal cortex; PFC, prefrontal cortex; PMC, posteromedial cortex; PPC, posterior parietal cortex. ++, P < 0.05; +, P < 0.1; −, P > 0.1.
To explicitly test whether specific regions explained these effects, we conducted the same trial-level analysis within five network regions: PFC, PPC, LTC, PMC, and MPFC (Fig. 16A). Across individuals, these analyses revealed a total of 18 out of 30 (60.0%) significant within-region interactions effects (P < 0.05). Equivalent analyses of null data yielded only one positive result (3.3%), suggesting that false positives were also unlikely to account for the region-specific task findings. Results are summarized in Table 6.
For S7, interaction effects were found in all tested regions (Fig. 16E), and for S12, in every region except LTC (which often features lower signal). Underscoring that no single region drove the network double dissociation results, all regions showed some evidence of significant interaction effects. The PFC, PMC, and MPFC showed evidence of dissociation in at least 4 of 6 subjects, whereas the PPC and LTC both showed evidence in two subjects.
For the single participant showing no significant region interactions (S10), there was also no interaction effect at the full-network level. Of the five individuals who did show within-region interaction effects, four (all but S9) showed significant interactions in both PMC and MPFC, regions previously considered network hubs (Andrews-Hanna et al. 2010). Within PPC, a region shown previously to exhibit task differences (e.g., Andrews-Hanna et al. 2014a), the two individuals showing the expected interaction effect (S7 and S12) also featured adjacent network estimates in that region, aligning with the expected network pattern (e.g., Braga et al. 2019b).
Overall, the trial-level results converge with our descriptive findings from both experiment 1 and experiment 2, indicating preferential recruitment of network A by episodic projection tasks and network B by tasks requiring ToM, across distributed cortical zones. These findings also support the robustness of the trial-level approach for detecting effects within complex individual data, especially when using both task and null data sets for estimating false positive rates.
Experiment 3
Experiment 3 provided a full prospective replication of the novel approaches of experiment 2, as well as a triplication of the core network dissociation. Analyses for experiment 3 were conducted after all analysis procedures, including exploratory and trial-level methods, were established (and initial analyses were openly reported online in a preprint; see https://doi.org/10.1101/733048).
Behavioral performance.
Behavioral performance is summarized in Tables 4 and 5. Across tasks, four out of six individuals responded to all presented trials for included runs. For S16, behavioral monitoring revealed that responses to missed trials during the False Belief task were simply outside of the recorded timeframe; these data were included in subsequent analysis. In addition, during one of S16’s scanning sessions, no behavioral data were recorded. Trial responses and overall alertness were monitored during this session, and no task runs were excluded, but mean RTs include data from 6 ToM task runs and 4 episodic projection task runs for this subject.
RTs were again largely similar across the ToM contrasts of interest (False Belief versus False Photo, P > 0.05 for all except S14; Emo Pain versus Phys Pain, P > 0.05 for all within-subject paired t tests), as well as across the primary episodic projection contrasts (Future Self versus Present Self, P > 0.05 for all except S17; Past Self versus Present Self, all P > 0.05).
For the additional episodic projection contrasts, four participants (all but S13 and S18) showed a slower mean RT for one or more Non-Self conditions (see Table 5), but no Non-Self condition exhibited consistently slower RTs across subjects. As in experiment 2, within each individual, no significant differences in RTs were apparent by time orientation (e.g., Past, Present, or Future). All experiment 3 individuals exhibited compliance across tasks, and no data were excluded based on behavioral metrics.
Parallel interdigitated networks replicate across a third set of individuals.
Networks A and B were again identified using seed-based and k-means parcellation strategies (Fig. 17). Parallel, interdigitated, and distributed networks were observed across individuals who largely exhibited the spatial features considered to be diagnostic of networks A and B (Braga et al. 2019b). For example, connectivity to posterior PHC was present in network A only, and connectivity to a region in IPL along the TPJ was observed in network B, rostral to the IPL region of network A. Again, network A included a more ventral representation along the posterior midline, at or near RSC, whereas network B featured a region ventral to that of network A in MPFC.
Fig. 17.

Networks A and B identified within individuals [subjects 13–18 (S13–S18)] in experiment 3 using seed-based and k-means parcellation strategies. Estimates of networks A (navy) and B (light blue) were comparable across seed-based (left) and k-means (right) methods for individuals in experiment 3. As in experiment 2, k varied by individual. A clustering solution was selected, for each individual, that featured differentiation between networks A and B, as well as between these and other large-scale networks. Seed-based maps are thresholded at r = 0.40.
For some individuals (e.g., S13 and S18), the k-means estimate of network A showed minimal representation in left LTC. In addition, a few individuals’ seed-based estimates included larger network B representations along the lateral inferior frontal cortex than the k-means parcellations (e.g., S15 and S18). Nonetheless, network representations even in these lower signal regions were present in most individuals’ k-means estimates, aligning with expected referential features of networks A and B (e.g., Braga et al. 2019b). Of note, for S15, an unusual pattern in PMC, in which network A was interwoven with small regions of network B, was present in both the seed-based and k-means solutions, indicating that this region may have been difficult to parse or atypical within this individual.
Despite minor differences between the k-means and seed-based estimates, which further highlight that both methods yield only network approximations, the two networks could be identified in all individuals, using both methods (Fig. 17). For planned analyses in experiment 3, we carried forward each individual’s unbiased k-means network estimates.
Networks A and B replicate functional dissociation across additional individuals.
Functional recruitment of each network was again quantified by contrasting the distributions of BOLD responses for each task domain (Fig. 18). Differential network recruitment was observed for all 12 distribution comparisons. All subjects exhibited greater recruitment of network A for episodic projection over ToM (Cohen’s d range: 0.99–1.94 for 5 individuals; d = 0.07 for S15), and of network B for ToM over episodic projection (Cohen’s d range: 1.10–2.67).
Fig. 18.

Networks A and B triplicate functional dissociation within individuals [subjects 13–18 (S13–S18)] in experiment 3. Left: spatial distributions of networks A (navy) and B (light blue). Right: distributions plot the functional responses within each network for theory of mind (ToM; red) and episodic projection (EP; yellow), with overlap in orange. For network A, all 6 subjects demonstrate higher EP than ToM values (Cohen’s d range = 0.99–1.94 for 5 subjects, d = 0.07 for S15). For network B, all subjects demonstrate higher values for ToM (d range = 1.10–2.67). These findings further replicate and support a functional double dissociation.
Functional dissociation again replicates for parahippocampal and retrosplenial/ventral posterior cingulate regions of network A.
Across individuals in experiment 3, region-specific analysis replicated preferential recruitment of the ventral PCC/RSC and PHC by episodic projection over ToM tasks (Fig. 19; Cohen’s d ranges: ventral PCC/RSC, 1.65–3.37; PHC, 1.42–3.45).
Additional evidence for preferential task recruitment across multiple cortical zones.
ToM and episodic projection contrast maps exhibited largely separable patterns (Fig. 20). Estimates of network A showed robust overlap with the episodic projection maps and network B with the maps for ToM. As in experiments 1 and 2, network boundaries followed even idiosyncratic task patterns in most individuals. As one example, in the left MPFC region of S18, a broad network B estimate encircled one region of network A and was adjacent to another. Both of these network A regions exhibited preferential responses for episodic projection, while a small interwoven strip of cortex, attributed to network B, showed greater activity for ToM.
Fig. 20.

Networks A and B triplicate differential recruitment by episodic projection (EP) and theory of mind (ToM) tasks across multiple cortical zones within individuals in experiment 3. Within each column, the lateral (left) and medial (right) surfaces of the left hemisphere are shown. Functional response patterns are shown in relation to the network A (left) and network B (right) boundaries. For all subjects [subjects 13–18 (S13–S18)], EP (yellow) and ToM (red) maps are largely dissociable across distributed cortical regions. Preferential overlap between network A and the EP contrasts and between network B and the ToM contrasts are strongly apparent in most subjects, in multiple cortical zones.
This motif was apparent across individuals: adjacent portions of cortex, estimated as belonging to distinct networks, exhibited differential patterns of task recruitment. Also, replicating results from the first two experiments, individuals in experiment 3 revealed spatially separate task patterns along the midline, well-aligned to the boundaries of networks A and B. For example, five individuals (all but S15) exhibited a triad of network A regions in PMC, each preferentially overlapping with an episodic projection contrast map. Across these subjects, the region of network B found within each triad preferentially overlapped the ToM map. What is more, spatial alignment between networks and contrast maps was apparent across cortical zones and in both hemispheres (Fig. 21).
Fig. 21.

Networks A and B triplicate differential recruitment by episodic projection (EP) and theory of mind (ToM) tasks in the right hemisphere in experiment 3. The right hemisphere is displayed for each of the 6 subjects [subjects 13–18 (S13–S18)] from experiment 3, using the same procedures as those described for Fig. 21. Lateral (right) and medial (left) views of the right hemisphere are shown in each row, with network A (left) or network B (right) boundaries outlined.
These results act as a triplication of experiment 1 findings, showing the functional dissociation of networks A and B across distributed regions, with network A preferentially recruited for episodic projection contrasts and network B for ToM contrasts.
Networks A and B exhibit functional dissociation across task contrasts within additional individuals.
Task-specific analyses provided yet further evidence for a functional double dissociation (Fig. 22). For network A, five out of six subjects (all but S15) showed greater responses in each episodic projection task contrast over either ToM contrast (Cohen’s d range = 0.55–1.97 for pairwise comparisons). Despite S15’s incongruous network A pattern (e.g., Fig. 18), task contrasts within each domain showed comparable activity, so no single task appeared to account for this subject’s results.
Fig. 22.
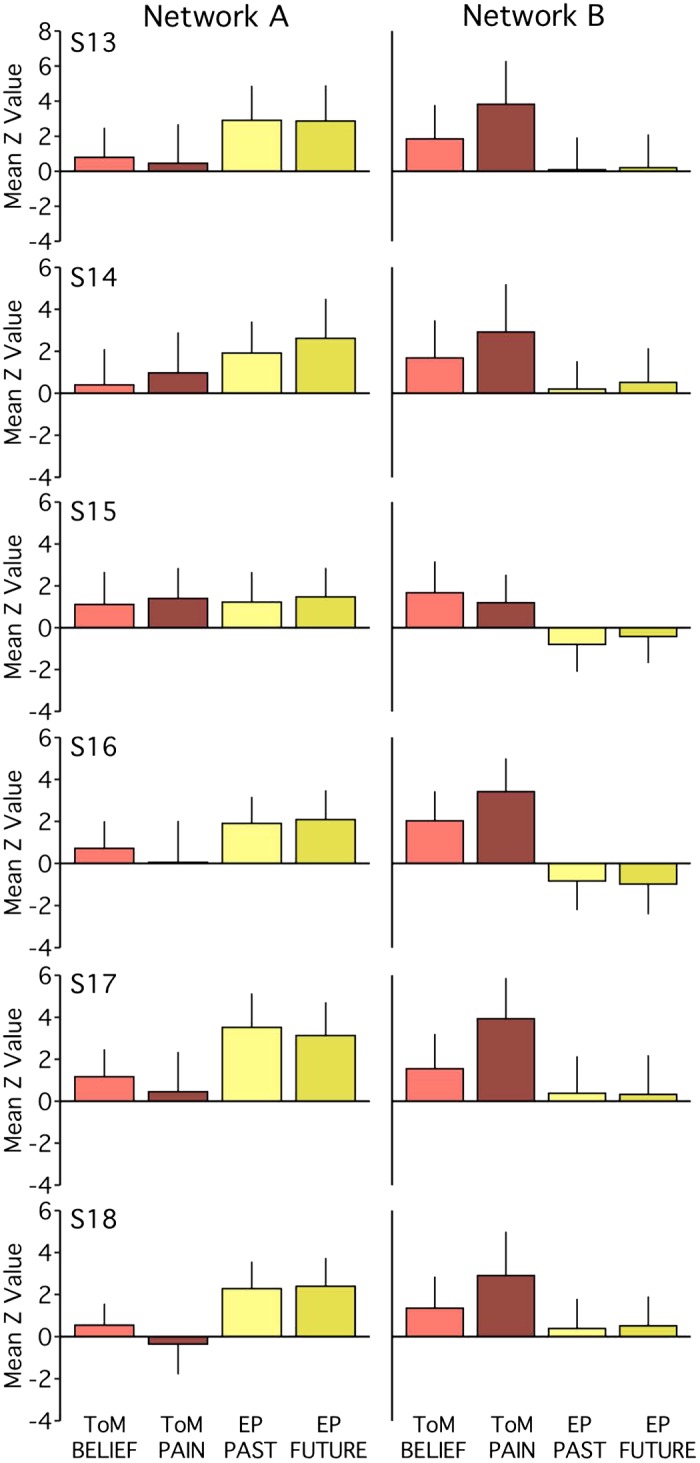
Functional dissociation of networks A and B triplicate across task contrasts in experiment 3. For each individual [subjects 13–18 (S13–S18)] in experiment 3, bar graphs show the functional within-network responses (mean z-values and standard deviations across runs) for each task contrast. Replicating findings from experiments 1 and 2, for network A, higher responses for both episodic projection (EP) contrasts over both theory of mind (ToM) contrasts are evident in 5 out of 6 subjects (all but S15; Cohen’s d range = 0.55–1.97 for pairwise comparisons). For network B, the Other Pain contrast (ToM PAIN) shows the strongest recruitment in most subjects, over the False Belief contrast (ToM BELIEF). Increases for both ToM contrasts over both EP contrasts (EP Past and EP Future) are evident in all 6 individuals (d range = 0.58–2.91).
Within network B, similar to the previous experiments, the ToM Other Pain contrast showed a greater response than the False Belief contrast in most subjects (all but S15; Cohen’s d range = 0.60–1.32). Nonetheless, both ToM contrasts exhibited greater responses than either episodic projection contrast across all subjects (d range = 0.58–2.91 for pairwise comparisons; most d > 1.30).
Thus experiment 3 findings again replicate experiment 1 results, within an additional, independent set of individuals. Toward the goal of prospectively replicating all experiment 2 procedures, we next continued with the exploratory and trial-level analyses.
Network dissociation replicates for episodic projection contrasts varying in time orientation.
Using the same procedures as in experiment 2, analyses were conducted for the expanded episodic projection paradigm (comparing Past Self versus Past Non-Self, Present Self versus Present Non-Self, and Future Self versus Future Non-Self contrasts in each network; Fig. 23). Within network A, all subjects showed greater recruitment by the Past and Future contrasts over the Present contrast (Cohen’s d range = 0.18–2.03 for pairwise comparisons). Across subjects, differences between the Past and Future contrast means were also smaller than between either of those contrasts relative to the Present (Cohen’s d range = 0.03–0.59 for Past versus Future, most d < 0.24).
Fig. 23.
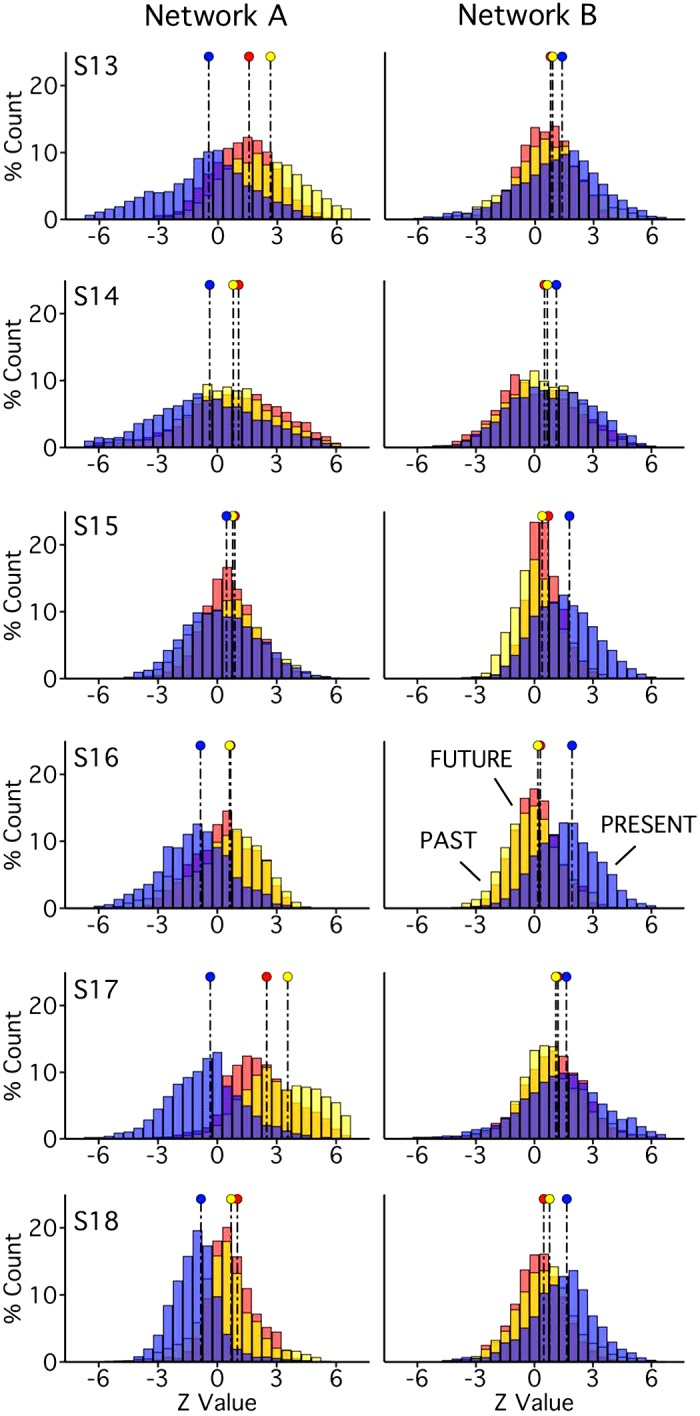
Differential recruitment of networks A and B across temporal orientations replicates in additional individuals [subjects 13–18 (S13–S18)]. Within each network, distributions plot the responses for the time-matched contrasts in the expanded episodic projection task (Past Self versus Past Non-Self in yellow, Present Self versus Present Non-Self in blue, and Future Self versus Future Non-Self in red). Replicating experiment 2 results, all subjects show greater recruitment of network A by both the Past and Future conditions relative to the Present (Cohen’s d range = 0.18–2.03; most d > 0.80), and greater recruitment of network B by the Present condition relative to the Past and Future (d range = 0.22–1.19).
Conversely, within network B, all individuals exhibited greater recruitment by the Present contrast than by either the Past or Future contrasts (Cohen’s d range = 0.22–1.19 for pairwise comparisons). As in experiment 2, three individuals showed sizable effects (S15, S16, S18; Cohen’s d > 0.50 for comparisons of Present > Past and Future). These results support that self-reference alone cannot account for the differential recruitment of networks A and B: a double dissociation is observed for episodic projection (Past and Future versus Present), even when self-referential processing is preserved across contrasts.
Also replicating experiment 2 results, for individuals showing minimal contrast-related differences, distributions centered near zero (e.g., see S15 network A). Again, no individuals showed clear recruitment of either network by all three contrasts.
Trial-level analyses replicate functional dissociation across distributed network zones.
In the final analyses, trial-specific beta values were estimated to create up to 40 (ToM) or 60 (episodic projection) contrast values per domain, within each network. Factorial ANOVA tested for interaction effects, between network and domain, on these contrast values, both for the full networks and for each of 5 network regions. Analyses were repeated using null data.
For the full networks, statistically significant interaction effects were observed for five of six individuals (P < 0.05 for all but S15). Planned comparisons revealed significantly higher ToM values in network B for all five of those individuals (P < 0.05) and significantly higher episodic projection values in network A for three out of five. Applying the same analysis to null data revealed no interaction effects (see Table 7).
Table 7.
Results from the experiment 3 within-individual trial-level analyses of task and null data
| Subject No. | Composite | PFC | PPC | LTC | PMC | MPFC |
|---|---|---|---|---|---|---|
| Task data | ||||||
| S13 | ++ | ++ | ++ | + | ++ | ++ |
| S14 | ++ | + | ++ | − | ++ | ++ |
| S15 | − | − | − | − | − | ++ |
| S16 | ++ | ++ | ++ | − | ++ | ++ |
| S17 | ++ | ++ | ++ | ++ | ++ | ++ |
| S18 | ++ | ++ | ++ | − | ++ | ++ |
| Null data | ||||||
| S13 | − | − | − | − | − | − |
| S14 | − | − | − | − | − | − |
| S15 | − | − | − | − | − | − |
| S16 | − | − | − | − | − | − |
| S17 | − | − | − | + | − | − |
| S18 | − | − | − | − | − | − |
In the same fashion as Table 6, each cell indicates, for a single individual’s trial-specific contrast values, whether or not a network by domain interaction effect was significant. For the task data, data from the relevant task runs were input to trial-specific general linear models (GLMs). For the null data, fixation data were input to the same task GLMs. S13–S18, subjects 13–18. Composite, full networks; LTC, lateral temporal cortex; MPFC, medial prefrontal cortex; PFC, prefrontal cortex; PMC, posteromedial cortex; PPC, posterior parietal cortex. ++, P < 0.05; +, P < 0.1; −, P > 0.1.
Within the five tested network regions (PFC, PPC, LTC, PMC, and MPFC; see Fig. 16A), trial-level analysis revealed a total of 21 out of 30 (70.0%) significant within-region interactions effects (P < 0.05; see Table 7). Analyses of null data yielded no significant results at an alpha level of 0.05; false positives were thus unlikely to explain observed effects.
One individual (S17) showed interaction effects in every region and three others (S13, S16, and S18) in every region except LTC (typically containing few vertices in network A). All participants except S15 showed significant interaction effects in at least three regions, with higher episodic projection mean values in network A and higher ToM mean values in network B, replicating evidence that no single region accounts for the network double dissociation results. As in experiment 2, the single individual showing no significant interactions across regions (S15) also exhibited no interaction effect at the full-network level, consistent with a subject-, rather than a region-specific, difference.
DISCUSSION
Two separate networks within the bounds of the canonical DN are functionally specialized for distinct processing domains. The PHC-linked network A is preferentially recruited for task contrasts isolating episodic projection, including remembering the past and imagining the future, and the TPJ-linked network B is preferentially recruited for task contrasts isolating ToM. Critically, the functional dissociation involves the full, distributed networks, including anterior and posterior midline regions that have been previously implicated as hubs of convergence. The double dissociation between these two adjacent networks has practical implications for efforts to map and understand higher-order aspects of cognition. The spatial interdigitation of functionally specialized networks throughout distributed zones of cortex also raises intriguing questions about their origins, including how such specialization arose through evolution and emerges during development.
Parallel Distributed Networks with Adjacent Regions Across the Cortex Are Functionally Specialized
Overlap in group-analyzed task responses across a broad range of domains has driven ideas about the function and organization of the DN. Convergence has been highlighted for tasks targeting mnemonic through social functions (Buckner and Carroll 2007; Spreng et al. 2009; see also Mars et al. 2012). However, there have also been challenges to the idea of convergence. In an early critical study, Rosenbaum et al. (2007) demonstrated that performance on ToM tasks, as typically administered in neuroimaging studies, can be preserved in patients with injury-acquired impairment of autobiographical memory, suggesting dissociation between episodic memory and ToM. Group studies that manipulate task domains within subjects note regional differences in task response patterns as well, with a recurring distinction between activation in TPJ during ToM/mentalizing tasks in a zone rostral to the IPL region activated during episodic remembering (Andrews-Hanna et al. 2014a; DuPre et al. 2016; Spreng and Grady 2010). A particularly revealing analysis of this distinction is reported by Andrews-Hanna et al. (2014a). Using spatial meta-analysis that aggregated data from 79 task contrasts targeting mentalizing and 62 targeting autobiographical thought (including memory and prospection), they observed robust activation of the IPL for both tasks, but with the mentalizing response extending rostral to the response for autobiographical thought (Andrews-Hanna et al. 2014a).
In the present work, three independent experiments replicated preferential responses in distinct distributed networks across the brains for both of the task domains tested (ToM and episodic projection). Our findings thus reinforce the notion that there exists functional specialization of, rather than convergence on, processing nodes or networks recruited for these task domains. While the dissociation in the TPJ and PHC could be hypothesized from prior group analyses of similar tasks, it is striking that networks A and B showed dissociations widely across the brain when analyzed within individuals, including anterior and posterior midline zones previously described as components of a DN core (Andrews-Hanna et al. 2010; Andrews-Hanna et al. 2014a; Andrews-Hanna et al. 2014b; Christoff et al. 2016; Tamir et al. 2016).
In general, there was considerably more separation than overlap between the two task domains within most individuals. Particularly compelling evidence for a fine level of separation comes from visualization of the preferential task responses against the network A and B boundary estimates in the clearest data sets (e.g., S2 in Fig. 6; S12 in Fig. 12; S18 in Fig. 20). In these instances, the spatial separation of the task-preferential responses is distinct in both the anterior and posterior midline, consistent with separation of the two networks observed previously (Braga and Buckner 2017; Braga et al. 2019b). Region-specific statistical analyses in experiments 2 and 3 formally tested these observations and supported that differential network recruitment by each task domain exists within distributed cortical zones, including both PMC and MPFC.
The distinct task activation patterns along the posterior midline are consistent with results from two recent studies that found similar differential activity within subjects (tasked with making judgments about either people or scenes; e.g., see Fig. 1 in Peer et al. 2015; see also Silson et al. 2019). The present results support that such task activation differences within canonical DN regions are well-predicted by the hypothesis of separation between two distributed networks, labeled networks A and B, and are not limited to specific cortical zones. These findings encourage reconsideration of regions previously considered part of a “core” (or “hub”) interacting with multiple subnetworks. Rather, the present findings suggest that distributed, functionally specialized networks may remain spatially separated across much, or even the entirety, of the cerebral mantle.
Relationship Between Specialized Networks and Developmental Origins
Dissociation between juxtaposed networks that share a similar organizational motif raises questions, both about whether there are functional similarities or dependencies between the separate networks, and about how such an organization might arise. While the present data are insufficient to offer strong conclusions, several possibilities and constraints can be discussed.
An interesting feature of the network organization revealed here is that it supports a parallel division of the canonical DN, rather than suggesting an orthogonal organization. This is a nontrivial point. Prior group analyses, due to spatial blurring, suggested an organization that blurred across the networks; higher spatial resolution now reveals a division of the canonical, group-averaged DN into two distinct networks. One possibility is that the two networks are domain specialized but form a broader class of networks (Buckner and DiNicola 2019). Much like the visual system possesses specializations across multiple extrastriate areas and patches that process stimuli with distinct visual properties and experiential histories, higher-order association cortex might specialize similarly. Within this possibility, the two networks may possess broadly similar processing modes, perhaps aligned with internal mentation as opposed to external forms of perception, but also specialization for separate domains, here captured by our contrasts targeting ToM as distinct from episodic projection. This raises one of the most intriguing questions: how do the separate networks form?
Developmental specialization of higher-order visual regions provides potential insight. Early during development, just after birth, extrastriate visual regions in the monkey do not possess fine specialization for stimulus domains (e.g., faces versus places), but do possess a broad retinotopic organization, by which central-to-peripheral portions of the retina are mapped to adjacent zones of cortex (Arcaro and Livingstone 2017a). As development progresses, face response patches form preferentially in extrastriate zones that are aligned to the central, as opposed to the peripheral, retinotopic maps. The early retinotopic protoorganization may thus serve as a scaffold onto which experience-based sculpting of the visual system is refined (Arcaro and Livingstone 2017a; see also Arcaro and Livingstone 2017b).
Refinement of association networks may similarly derive hierarchically from an early protoorganization that progresses from a broadly distributed DN-like network, in the earliest developmental stages, to multiple parallel networks at later stages, perhaps through a competitive developmental process of fractionation and specialization (Buckner and DiNicola 2019). Such a possibility would explain both the similarity of the two networks’ organization, as well as their juxtaposition across the cortex. A key difference between the two networks, in most individuals, is that network A is strongly coupled to posterior PHC, whereas network B is not. This difference, perhaps reflecting some form of early limbic projection gradient onto cortex, may contribute to the initiation of specialization, much as central-to-peripheral inputs from the retina scaffold specialization of extrastriate visual cortex (see also Silson et al. 2019 for a proposal that the development of category preferences in ventral temporal cortex may impact functional differentiation in PMC regions).
Limitations
A key limitation of the present study is that we have only studied a small set of task contrasts. Specifically, our results should not be interpreted to mean ToM tasks exclusively utilize network B, or that tasks involving remembering and prospection exclusively utilize network A. Here, task contrasts were selected based on prior literature because they preferentially activated components of one or the other of the two networks and did so through subtraction. In our primary analyses, we also did not situate the dissociation within task contrasts that utilized shared control tasks or multiple levels of control tasks (for example, that manipulated task difficulty). This highlights the need for caution against over-interpreting the results as suggesting that the networks are recruited selectively in an absolute sense. What we illustrated in our primary analyses, by selecting task contrasts that isolated component processes of ToM as distinct from processes of episodic projection, is a functional dissociation between the two networks that is present across the distributed network regions. Less constrained task contrasts are likely to produce less differentiated results and may be expected to call on both networks A and B; although preliminary analyses of additional task contrasts in experiment 2 and experiment 3 provided more evidence for functional specialization, not less (Figs. 15 and 23).
Furthermore, our selected tasks do not test alternative frameworks proposed to explain the processing contributions of the networks, including ideas arising from the work of Binder and colleagues (2009) that illustrate task contrasts isolating semantic processing overlap the canonical DN. Additional research will be required to explore the relation between these task domains and our now anatomically refined description of the networks, including the possibility that distinct networks supporting linguistic processes are near to, but distinct from, networks A and B (Mineroff et al. 2018; Braga et al. 2019a).
Further limitations of the work surround anatomical interpretation. Within our primary analysis of network recruitment by task domain, some subjects revealed clearer dissociations than others. It is unclear in the present results whether there are biologically meaningful differences in the patterns across subjects, or we are simply exploring patterns at the resolution edge of our methods. In Braga and Buckner (2017), the distinction between fine scale networks was more robust in two of four individuals, and in Braga et al. (2019b), as well, a subset of individuals provided the most robust data, thus showing similar variability to the present findings. Future work and larger numbers of subjects will be required to understand sources of individual differences.
Another open issue concerns residual spatial overlap. Our results show dissociation across functional domains. Dissociations spanned the multiple zones of cortex, including the anterior and posterior midline regions typically implicated as hubs of convergence. Thus the present results offer positive evidence for dissociation and suggest specialization is a property of distributed networks that include the midline. However, the presence of variability and local overlap of regions within task contrast maps (e.g., S2, S12, and S14) makes it difficult to rule out the possibility that small subregions participate in both functional domains. The inherent limitations of human neuroimaging also leave open the possibility that analyses of spatially large regions broadly miss key features of integration that may be present at the level of circuits and neuronal populations, far below the resolution of the presently applied techniques. A result suggesting a boundary condition comes from the high-resolution 7T analysis of the two hypothesized networks in Braga et al. (2019b; see also Peer et al. 2015). In that analysis, the findings revealed a greater degree of spatial separation between the two networks at 7T in contrast to 3T. Clear zones of convergence did not emerge.
Further work at higher resolution using multiple functional task contrasts will be needed to extend the present findings.
Conclusions
The present work shows that recently identified networks A and B, within the bounds of the canonical DN, can be functionally dissociated by task contrasts from distinct domains of internal mentation. Network A is preferentially recruited by task contrasts involving episodic projection, including remembering the past and imagining the future. Network B is preferentially recruited by task contrasts isolating ToM. Dissociation was present across the many widely distributed zones of the networks, suggesting specializations were emergent properties of the large-scale networks, not simply features of local regions. Questions remain as to the full extent of the functional specialization of these networks, but the present results encourage a reevaluation of how networks A and B are organized to support task processing demands.
GRANTS
This work was also supported by Kent and Liz Dauten, National Institutes of Health Grant P50-MH-106435, and Shared Instrumentation Grant S10OD020039. For L.M.D., this material is based on work supported by the National Science Foundation Graduate Research Fellowship Program under Grant DGE1745303. R.M.B. was supported by a NIH Pathway to Independence Award grant K99MH117226.
DISCLAIMERS
Any opinions, findings, and conclusions or recommendations expressed in this material are those of the authors and do not necessarily reflect the views of the National Science Foundation.
DISCLOSURES
No conflicts of interest, financial or otherwise, are declared by the authors.
AUTHOR CONTRIBUTIONS
L.M.D., R.M.B., and R.L.B. conceived and designed research; L.M.D. and R.M.B. performed experiments; L.M.D., R.M.B., and R.L.B. analyzed data; L.M.D., R.M.B., and R.L.B. interpreted results of experiments; L.M.D., R.M.B., and R.L.B. prepared figures; L.M.D., R.M.B., and R.L.B. drafted manuscript; L.M.D., R.M.B., and R.L.B. edited and revised manuscript; L.M.D., R.M.B., and R.L.B. approved final version of manuscript.
ENDNOTE
At the request of the authors, readers are alerted to the fact that additional materials related to this manuscript (detailed statistical results for Tables 4–7) may be found at https://doi.org/10.7910/DVN/T1W8WH. These materials are not a part of this manuscript and have not undergone peer review by the American Physiological Society (APS). APS and the journal editors take no responsibility for these materials, for the website address, or for any links to or from it.
ACKNOWLEDGMENTS
We thank T. O’Keefe, H. Hoke, R. Mair, and S. McMains for assisting in data acquisition and preprocessing optimization. E. Phlegar, M. Shermohammed, B. Braams, C. Vidal Bustamante, and T. Moran also assisted in data acquisition. A. Youssoufian, H. Becker, K. Miclau, and A. Song assisted in data acquisition and stimuli generation. We thank the Harvard Center for Brain Science neuroimaging core and FAS Division of Research Computing. The multiband EPI sequence was generously provided by the Center for Magnetic Resonance Research (CMRR) at the University of Minnesota. Supplemental task stimuli were provided by R. Saxe and J. Andrews-Hanna, and R. Saxe provided valuable discussion and insights throughout the project. D. Bzdok generously proposed the trial-level analyses; P. Mair provided crucial statistical insights.
Footnotes
Analyses of the hierarchical organization of networks in both humans and monkeys have converged on a macroscale gradient that progresses outwards from primary sensory-motor cortex through to higher-order association regions (Buckner and DiNicola 2019; Buckner and Margulies 2019; Huntenburg et al. 2018; Margulies et al. 2016; see also Mesulam 1998). The historically defined default network is spatially positioned at the apex of the gradient, encompassing distributed transmodal association regions, including frontopolar and rostral regions of temporal association cortex.
REFERENCES
- Aguirre GK, Zarahn E, D’Esposito M. A critique of the use of the Kolmogorov-Smirnov (KS) statistic for the analysis of BOLD fMRI data. Magn Reson Med 39: 500–505, 1998. doi: 10.1002/mrm.1910390322. [DOI] [PubMed] [Google Scholar]
- Andrews-Hanna JR, Reidler JS, Sepulcre J, Poulin R, Buckner RL. Functional-anatomic fractionation of the brain’s default network. Neuron 65: 550–562, 2010. doi: 10.1016/j.neuron.2010.02.005. [DOI] [PMC free article] [PubMed] [Google Scholar]
- Andrews-Hanna JR, Saxe R, Yarkoni T. Contributions of episodic retrieval and mentalizing to autobiographical thought: evidence from functional neuroimaging, resting-state connectivity, and fMRI meta-analyses. Neuroimage 91: 324–335, 2014a. doi: 10.1016/j.neuroimage.2014.01.032. [DOI] [PMC free article] [PubMed] [Google Scholar]
- Andrews-Hanna JR, Smallwood J, Spreng RN. The default network and self-generated thought: component processes, dynamic control, and clinical relevance. Ann N Y Acad Sci 1316: 29–52, 2014b. doi: 10.1111/nyas.12360. [DOI] [PMC free article] [PubMed] [Google Scholar]
- Arcaro MJ, Livingstone MS. A hierarchical, retinotopic proto-organization of the primate visual system at birth. eLife 6: e26196, 2017a. doi: 10.7554/eLife.26196. [DOI] [PMC free article] [PubMed] [Google Scholar]
- Arcaro MJ, Livingstone MS. Retinotopic organization of scene areas in macaque inferior temporal cortex. J Neurosci 37: 7373–7389, 2017b. doi: 10.1523/JNEUROSCI.0569-17.2017. [DOI] [PMC free article] [PubMed] [Google Scholar]
- Binder JR, Desai RH, Graves WW, Conant LL. Where is the semantic system? A critical review and meta-analysis of 120 functional neuroimaging studies. Cereb Cortex 19: 2767–2796, 2009. doi: 10.1093/cercor/bhp055. [DOI] [PMC free article] [PubMed] [Google Scholar]
- Braga RM, Buckner RL. Parallel interdigitated distributed networks within the individual estimated by intrinsic functional connectivity. Neuron 95: 457–471.e5, 2017. doi: 10.1016/j.neuron.2017.06.038. [DOI] [PMC free article] [PubMed] [Google Scholar]
- Braga RM, DiNicola LM, Buckner RL. Situating the left-lateralized language network in the broader organization of multiple specialized large-scale distributed networks (Preprint). bioRxiv 873174, 2019a. doi: 10.1101/2019.12.11.873174. [DOI] [PMC free article] [PubMed]
- Braga RM, Van Dijk KRA, Polimeni JR, Eldaief MC, Buckner RL. Parallel distributed networks resolved at high resolution reveal close juxtaposition of distinct regions. J Neurophysiol 121: 1513–1534, 2019b. doi: 10.1152/jn.00808.2018. [DOI] [PMC free article] [PubMed] [Google Scholar]
- Bruneau EG, Pluta A, Saxe R. Distinct roles of the ‘shared pain’ and ‘theory of mind’ networks in processing others’ emotional suffering. Neuropsychologia 50: 219–231, 2012. doi: 10.1016/j.neuropsychologia.2011.11.008. [DOI] [PubMed] [Google Scholar]
- Buckner RL, Andrews-Hanna JR, Schacter DL. The brain’s default network: anatomy, function, and relevance to disease. Ann N Y Acad Sci 1124: 1–38, 2008. doi: 10.1196/annals.1440.011. [DOI] [PubMed] [Google Scholar]
- Buckner RL, Carroll DC. Self-projection and the brain. Trends Cogn Sci 11: 49–57, 2007. doi: 10.1016/j.tics.2006.11.004. [DOI] [PubMed] [Google Scholar]
- Buckner RL, DiNicola LM. The brain’s default network: updated anatomy, physiology and evolving insights. Nat Rev Neurosci 20: 593–608, 2019. doi: 10.1038/s41583-019-0212-7. [DOI] [PubMed] [Google Scholar]
- Buckner RL, Goodman J, Burock M, Rotte M, Koutstaal W, Schacter D, Rosen B, Dale AM. Functional-anatomic correlates of object priming in humans revealed by rapid presentation event-related fMRI. Neuron 20: 285–296, 1998. doi: 10.1016/S0896-6273(00)80456-0. [DOI] [PubMed] [Google Scholar]
- Buckner RL, Krienen FM. The evolution of distributed association networks in the human brain. Trends Cogn Sci 17: 648–665, 2013. [Erratum in Trends Cogn Sci 18: 328–329, 2014.] doi: 10.1016/j.tics.2013.09.017. [DOI] [PubMed] [Google Scholar]
- Buckner RL, Margulies DS. Macroscale cortical organization and a default-like apex transmodal network in the marmoset monkey. Nat Commun 10: 1976, 2019. doi: 10.1038/s41467-019-09812-8. [DOI] [PMC free article] [PubMed] [Google Scholar]
- Christoff K, Irving ZC, Fox KCR, Spreng RN, Andrews-Hanna JR. Mind-wandering as spontaneous thought: a dynamic framework. Nat Rev Neurosci 17: 718–731, 2016. doi: 10.1038/nrn.2016.113. [DOI] [PubMed] [Google Scholar]
- D’Argembeau A, Collette F, Van der Linden M, Laureys S, Del Fiore G, Degueldre C, Luxen A, Salmon E. Self-referential reflective activity and its relationship with rest: a PET study. Neuroimage 25: 616–624, 2005. doi: 10.1016/j.neuroimage.2004.11.048. [DOI] [PubMed] [Google Scholar]
- Dodell-Feder D, Koster-Hale J, Bedny M, Saxe R. fMRI item analysis in a theory of mind task. Neuroimage 55: 705–712, 2011. doi: 10.1016/j.neuroimage.2010.12.040. [DOI] [PubMed] [Google Scholar]
- Doucet G, Naveau M, Petit L, Delcroix N, Zago L, Crivello F, Jobard G, Tzourio-Mazoyer N, Mazoyer B, Mellet E, Joliot M. Brain activity at rest: a multiscale hierarchical functional organization. J Neurophysiol 105: 2753–2763, 2011. doi: 10.1152/jn.00895.2010. [DOI] [PubMed] [Google Scholar]
- DuPre E, Luh WM, Spreng RN. Multi-echo fMRI replication sample of autobiographical memory, prospection and theory of mind reasoning tasks. Sci Data 3: 160116, 2016. doi: 10.1038/sdata.2016.116. [DOI] [PMC free article] [PubMed] [Google Scholar]
- Eklund A, Nichols TE, Knutsson H. Cluster failure: why fMRI inferences for spatial extent have inflated false-positive rates. Proc Natl Acad Sci USA 113: 7900–7905, 2016. [Erratum in Proc Natl Acad Sci USA 113: E4929, 2016.] doi: 10.1073/pnas.1602413113. [DOI] [PMC free article] [PubMed] [Google Scholar]
- Fedorenko E, Duncan J, Kanwisher N. Language-selective and domain-general regions lie side by side within Broca’s area. Curr Biol 22: 2059–2062, 2012. doi: 10.1016/j.cub.2012.09.011. [DOI] [PMC free article] [PubMed] [Google Scholar]
- Fedorenko E, Hsieh P-J, Nieto-Castañón A, Whitfield-Gabrieli S, Kanwisher N. New method for fMRI investigations of language: defining ROIs functionally in individual subjects. J Neurophysiol 104: 1177–1194, 2010. doi: 10.1152/jn.00032.2010. [DOI] [PMC free article] [PubMed] [Google Scholar]
- Feinberg DA, Moeller S, Smith SM, Auerbach E, Ramanna S, Gunther M, Glasser MF, Miller KL, Uğurbil K, Yacoub E. Multiplexed echo planar imaging for sub-second whole brain FMRI and fast diffusion imaging. PLoS One 5: e15710, 2010. [Erratum in PLoS One 6: 2011.] doi: 10.1371/journal.pone.0015710. [DOI] [PMC free article] [PubMed] [Google Scholar]
- Fischl B, Sereno MI, Dale AM. Cortical surface-based analysis. II: Inflation, flattening, and a surface-based coordinate system. Neuroimage 9: 195–207, 1999. doi: 10.1006/nimg.1998.0396. [DOI] [PubMed] [Google Scholar]
- Glasser MF, Sotiropoulos SN, Wilson JA, Coalson TS, Fischl B, Andersson JL, Xu J, Jbabdi S, Webster M, Polimeni JR, Van Essen DC, Jenkinson M; WU-Minn HCP Consortium . The minimal preprocessing pipelines for the Human Connectome Project. Neuroimage 80: 105–124, 2013. doi: 10.1016/j.neuroimage.2013.04.127. [DOI] [PMC free article] [PubMed] [Google Scholar]
- Goldman-Rakic PS. Topography of cognition: parallel distributed networks in primate association cortex. Annu Rev Neurosci 11: 137–156, 1988. doi: 10.1146/annurev.ne.11.030188.001033. [DOI] [PubMed] [Google Scholar]
- Gordon EM, Laumann TO, Gilmore AW, Newbold DJ, Greene DJ, Berg JJ, Ortega M, Hoyt-Drazen C, Gratton C, Sun H, Hampton JM, Coalson RS, Nguyen AL, McDermott KB, Shimony JS, Snyder AZ, Schlaggar BL, Petersen SE, Nelson SM, Dosenbach NUF. Precision functional mapping of individual human brains. Neuron 95: 791–807.e7, 2017. doi: 10.1016/j.neuron.2017.07.011. [DOI] [PMC free article] [PubMed] [Google Scholar]
- Greve DN, Fischl B. Accurate and robust brain image alignment using boundary-based registration. Neuroimage 48: 63–72, 2009. doi: 10.1016/j.neuroimage.2009.06.060. [DOI] [PMC free article] [PubMed] [Google Scholar]
- Gusnard DA, Raichle ME. Searching for a baseline: functional imaging and the resting human brain. Nat Rev Neurosci 2: 685–694, 2001. doi: 10.1038/35094500. [DOI] [PubMed] [Google Scholar]
- Hassabis D, Maguire EA. Deconstructing episodic memory with construction. Trends Cogn Sci 11: 299–306, 2007. doi: 10.1016/j.tics.2007.05.001. [DOI] [PubMed] [Google Scholar]
- Hassabis D, Spreng RN, Rusu AA, Robbins CA, Mar RA, Schacter DL. Imagine all the people: how the brain creates and uses personality models to predict behavior. Cereb Cortex 24: 1979–1987, 2014. doi: 10.1093/cercor/bht042. [DOI] [PMC free article] [PubMed] [Google Scholar]
- Hill J, Inder T, Neil J, Dierker D, Harwell J, Van Essen D. Similar patterns of cortical expansion during human development and evolution. Proc Natl Acad Sci USA 107: 13135–13140, 2010. doi: 10.1073/pnas.1001229107. [DOI] [PMC free article] [PubMed] [Google Scholar]
- Huntenburg JM, Bazin P-L, Margulies DS. Large-scale gradients in human cortical organization. Trends Cogn Sci 22: 21–31, 2018. doi: 10.1016/j.tics.2017.11.002. [DOI] [PubMed] [Google Scholar]
- Huth AG, de Heer WA, Griffiths TL, Theunissen FE, Gallant JL. Natural speech reveals the semantic maps that tile human cerebral cortex. Nature 532: 453–458, 2016. doi: 10.1038/nature17637. [DOI] [PMC free article] [PubMed] [Google Scholar]
- Iacoboni M, Lieberman MD, Knowlton BJ, Molnar-Szakacs I, Moritz M, Throop CJ, Fiske AP. Watching social interactions produces dorsomedial prefrontal and medial parietal BOLD fMRI signal increases compared to a resting baseline. Neuroimage 21: 1167–1173, 2004. doi: 10.1016/j.neuroimage.2003.11.013. [DOI] [PubMed] [Google Scholar]
- Jacoby N, Bruneau E, Koster-Hale J, Saxe R. Localizing pain matrix and theory of mind networks with both verbal and non-verbal stimuli. Neuroimage 126: 39–48, 2016. doi: 10.1016/j.neuroimage.2015.11.025. [DOI] [PMC free article] [PubMed] [Google Scholar]
- Jenkinson M. Improving the registration of B0-disorted EPI images using calculated cost function weights. Modeling and analysis. Neuroimage 22, Suppl 1: e1544–e1545, 2004. doi: 10.1016/S1053-8119(05)70018-5. [DOI] [Google Scholar]
- Jenkinson M, Bannister P, Brady M, Smith S. Improved optimization for the robust and accurate linear registration and motion correction of brain images. Neuroimage 17: 825–841, 2002. doi: 10.1006/nimg.2002.1132. [DOI] [PubMed] [Google Scholar]
- Jenkinson M, Smith S. A global optimisation method for robust affine registration of brain images. Med Image Anal 5: 143–156, 2001. doi: 10.1016/S1361-8415(01)00036-6. [DOI] [PubMed] [Google Scholar]
- Kong R, Li J, Orban C, Sabuncu MR, Liu H, Schaefer A, Sun N, Zuo X-N, Holmes AJ, Eickhoff SB, Yeo BTT. Spatial topography of individual-specific cortical networks predicts human cognition, personality, and emotion. Cereb Cortex 29: 2533–2551, 2019. doi: 10.1093/cercor/bhy123. [DOI] [PMC free article] [PubMed] [Google Scholar]
- Kurczek J, Wechsler E, Ahuja S, Jensen U, Cohen NJ, Tranel D, Duff M. Differential contributions of hippocampus and medial prefrontal cortex to self-projection and self-referential processing. Neuropsychologia 73: 116–126, 2015. doi: 10.1016/j.neuropsychologia.2015.05.002. [DOI] [PMC free article] [PubMed] [Google Scholar]
- Laumann TO, Gordon EM, Adeyemo B, Snyder AZ, Joo SJ, Chen M-Y, Gilmore AW, McDermott KB, Nelson SM, Dosenbach NU, Schlaggar BL, Mumford JA, Poldrack RA, Petersen SE. Functional system and areal organization of a highly sampled individual human brain. Neuron 87: 657–670, 2015. doi: 10.1016/j.neuron.2015.06.037. [DOI] [PMC free article] [PubMed] [Google Scholar]
- Lieberman MD. Social cognitive neuroscience: a review of core processes. Annu Rev Psychol 58: 259–289, 2007. doi: 10.1146/annurev.psych.58.110405.085654. [DOI] [PubMed] [Google Scholar]
- Marcus DS, Harwell J, Olsen T, Hodge M, Glasser MF, Prior F, Jenkinson M, Laumann T, Curtiss SW, Van Essen DC. Informatics and data mining tools and strategies for the human connectome project. Front Neuroinform 5: 4, 2011. doi: 10.3389/fninf.2011.00004. [DOI] [PMC free article] [PubMed] [Google Scholar]
- Margulies DS, Ghosh SS, Goulas A, Falkiewicz M, Huntenburg JM, Langs G, Bezgin G, Eickhoff SB, Castellanos FX, Petrides M, Jefferies E, Smallwood J. Situating the default-mode network along a principal gradient of macroscale cortical organization. Proc Natl Acad Sci USA 113: 12574–12579, 2016. doi: 10.1073/pnas.1608282113. [DOI] [PMC free article] [PubMed] [Google Scholar]
- Mars RB, Neubert F-X, Noonan MP, Sallet J, Toni I, Rushworth MFS. On the relationship between the “default mode network” and the “social brain”. Front Hum Neurosci 6: 189, 2012. doi: 10.3389/fnhum.2012.00189. [DOI] [PMC free article] [PubMed] [Google Scholar]
- Mesulam MM. Large-scale neurocognitive networks and distributed processing for attention, language, and memory. Ann Neurol 28: 597–613, 1990. doi: 10.1002/ana.410280502. [DOI] [PubMed] [Google Scholar]
- Mesulam MM. From sensation to cognition. Brain 121: 1013–1052, 1998. doi: 10.1093/brain/121.6.1013. [DOI] [PubMed] [Google Scholar]
- Michalka SW, Kong L, Rosen ML, Shinn-Cunningham BG, Somers DC. Short-term memory for space and time flexibly recruit complementary sensory-biased frontal lobe attention networks. Neuron 87: 882–892, 2015. doi: 10.1016/j.neuron.2015.07.028. [DOI] [PMC free article] [PubMed] [Google Scholar]
- Mineroff Z, Blank IA, Mahowald K, Fedorenko E. A robust dissociation among the language, multiple demand, and default mode networks: evidence from inter-region correlations in effect size. Neuropsychologia 119: 501–511, 2018. doi: 10.1016/j.neuropsychologia.2018.09.011. [DOI] [PMC free article] [PubMed] [Google Scholar]
- Moeller S, Yacoub E, Olman CA, Auerbach E, Strupp J, Harel N, Uğurbil K. Multiband multislice GE-EPI at 7 tesla, with 16-fold acceleration using partial parallel imaging with application to high spatial and temporal whole-brain fMRI. Magn Reson Med 63: 1144–1153, 2010. doi: 10.1002/mrm.22361. [DOI] [PMC free article] [PubMed] [Google Scholar]
- Peer M, Salomon R, Goldberg I, Blanke O, Arzy S. Brain system for mental orientation in space, time, and person. Proc Natl Acad Sci USA 112: 11072–11077, 2015. doi: 10.1073/pnas.1504242112. [DOI] [PMC free article] [PubMed] [Google Scholar]
- Poldrack RA, Laumann TO, Koyejo O, Gregory B, Hover A, Chen M-Y, Gorgolewski KJ, Luci J, Joo SJ, Boyd RL, Hunicke-Smith S, Simpson ZB, Caven T, Sochat V, Shine JM, Gordon E, Snyder AZ, Adeyemo B, Petersen SE, Glahn DC, Reese Mckay D, Curran JE, Göring HHH, Carless MA, Blangero J, Dougherty R, Leemans A, Handwerker DA, Frick L, Marcotte EM, Mumford JA. Long-term neural and physiological phenotyping of a single human. Nat Commun 6: 8885, 2015. doi: 10.1038/ncomms9885. [DOI] [PMC free article] [PubMed] [Google Scholar]
- Power JD, Cohen AL, Nelson SM, Wig GS, Barnes KA, Church JA, Vogel AC, Laumann TO, Miezin FM, Schlaggar BL, Petersen SE. Functional network organization of the human brain. Neuron 72: 665–678, 2011. doi: 10.1016/j.neuron.2011.09.006. [DOI] [PMC free article] [PubMed] [Google Scholar]
- Rabin JS, Gilboa A, Stuss DT, Mar RA, Rosenbaum RS. Common and unique neural correlates of autobiographical memory and theory of mind. J Cogn Neurosci 22: 1095–1111, 2010. doi: 10.1162/jocn.2009.21344. [DOI] [PubMed] [Google Scholar]
- Rosenbaum RS, Stuss DT, Levine B, Tulving E. Theory of mind is independent of episodic memory. Science 318: 1257, 2007. doi: 10.1126/science.1148763. [DOI] [PubMed] [Google Scholar]
- Saxe R. Uniquely human social cognition. Curr Opin Neurobiol 16: 235–239, 2006. doi: 10.1016/j.conb.2006.03.001. [DOI] [PubMed] [Google Scholar]
- Saxe R, Kanwisher N. People thinking about thinking people. The role of the temporo-parietal junction in “theory of mind”. Neuroimage 19: 1835–1842, 2003. doi: 10.1016/S1053-8119(03)00230-1. [DOI] [PubMed] [Google Scholar]
- Schacter DL, Addis DR, Buckner RL. Remembering the past to imagine the future: the prospective brain. Nat Rev Neurosci 8: 657–661, 2007. doi: 10.1038/nrn2213. [DOI] [PubMed] [Google Scholar]
- Schacter DL, Addis DR, Hassabis D, Martin VC, Spreng RN, Szpunar KK. The future of memory: remembering, imagining, and the brain. Neuron 76: 677–694, 2012. doi: 10.1016/j.neuron.2012.11.001. [DOI] [PMC free article] [PubMed] [Google Scholar]
- Schurz M, Radua J, Aichhorn M, Richlan F, Perner J. Fractionating theory of mind: a meta-analysis of functional brain imaging studies. Neurosci Biobehav Rev 42: 9–34, 2014. doi: 10.1016/j.neubiorev.2014.01.009. [DOI] [PubMed] [Google Scholar]
- Setsompop K, Gagoski BA, Polimeni JR, Witzel T, Wedeen VJ, Wald LL. Blipped-controlled aliasing in parallel imaging for simultaneous multislice echo planar imaging with reduced g-factor penalty. Magn Reson Med 67: 1210–1224, 2012. doi: 10.1002/mrm.23097. [DOI] [PMC free article] [PubMed] [Google Scholar]
- Shallice T. The cognitive neuropsychology approach. : From Neuropsychology to Mental Structure. New York: Cambridge University Press, 1988, p. 18–38. [Google Scholar]
- Silson EH, Steel A, Kidder A, Gilmore AW, Baker CI. Distinct subdivisions of human medial parietal cortex support recollection of people and places. eLife 8: e47391, 2019. doi: 10.7554/eLife.47391. [DOI] [PMC free article] [PubMed] [Google Scholar]
- Smith SM, Jenkinson M, Woolrich MW, Beckmann CF, Behrens TE, Johansen-Berg H, Bannister PR, De Luca M, Drobnjak I, Flitney DE, Niazy RK, Saunders J, Vickers J, Zhang Y, De Stefano N, Brady JM, Matthews PM. Advances in functional and structural MR image analysis and implementation as FSL. Neuroimage 23, Suppl 1: S208–S219, 2004. doi: 10.1016/j.neuroimage.2004.07.051. [DOI] [PubMed] [Google Scholar]
- Spreng RN, Grady CL. Patterns of brain activity supporting autobiographical memory, prospection, and theory of mind, and their relationship to the default mode network. J Cogn Neurosci 22: 1112–1123, 2010. doi: 10.1162/jocn.2009.21282. [DOI] [PubMed] [Google Scholar]
- Spreng RN, Mar RA, Kim ASN. The common neural basis of autobiographical memory, prospection, navigation, theory of mind and the default mode: a quantitative meta-analysis. J Cogn Neurosci 21: 489–510, 2009. doi: 10.1162/jocn.2008.21029. [DOI] [PubMed] [Google Scholar]
- Svoboda E, McKinnon MC, Levine B. The functional neuroanatomy of autobiographical memory: a meta-analysis. Neuropsychologia 44: 2189–2208, 2006. doi: 10.1016/j.neuropsychologia.2006.05.023. [DOI] [PMC free article] [PubMed] [Google Scholar]
- Tamir DI, Bricker AB, Dodell-Feder D, Mitchell JP. Reading fiction and reading minds: the role of simulation in the default network. Soc Cogn Affect Neurosci 11: 215–224, 2016. doi: 10.1093/scan/nsv114. [DOI] [PMC free article] [PubMed] [Google Scholar]
- Toro-Serey C, Tobyne SM, McGuire JT. Spectral partitioning identifies individual heterogeneity in the functional network topography of ventral and anterior medial prefrontal cortex. Neuroimage 205: 116305, 2020. doi: 10.1016/j.neuroimage.2019.116305. [DOI] [PubMed] [Google Scholar]
- van der Kouwe AJW, Benner T, Salat DH, Fischl B. Brain morphometry with multiecho MPRAGE. Neuroimage 40: 559–569, 2008. doi: 10.1016/j.neuroimage.2007.12.025. [DOI] [PMC free article] [PubMed] [Google Scholar]
- Wen T, Mitchell DJ, Duncan J. The functional convergence and heterogeneity of social, episodic, and self-referential thought in the default mode network (Preprint). bioRxiv 753509, 2019. doi: 10.1101/753509. [DOI] [PMC free article] [PubMed]
- Xu J, Moeller S, Auerbach EJ, Strupp J, Smith SM, Feinberg DA, Yacoub E, Uğurbil K. Evaluation of slice accelerations using multiband echo planar imaging at 3 T. Neuroimage 83: 991–1001, 2013. doi: 10.1016/j.neuroimage.2013.07.055. [DOI] [PMC free article] [PubMed] [Google Scholar]
- Yeo BT, Krienen FM, Sepulcre J, Sabuncu MR, Lashkari D, Hollinshead M, Roffman JL, Smoller JW, Zöllei L, Polimeni JR, Fischl B, Liu H, Buckner RL. The organization of the human cerebral cortex estimated by intrinsic functional connectivity. J Neurophysiol 106: 1125–1165, 2011. doi: 10.1152/jn.00338.2011. [DOI] [PMC free article] [PubMed] [Google Scholar]