Abstract
This study was aimed at assessing the effects of silica nanopowder incorporation into chitosan-tripolyphosphate microparticles with the ultimate goal of improving their osteogenic properties. The microparticles were prepared by simple coacervation technique and silica nanopowder was added at 0% (C), 2.5% (S1), 5% (S2) and 10% (S3) (w/w) to chitosan. We observed that this simple incorporation of silica nanopowder improved the growth and proliferation of osteoblasts along the surface of the microparticles. In addition, the composite microparticles also showed the increased expression of alkaline phosphatase and osteoblast specific genes. We observed a significant increase (p < 0.05) in the expression of alkaline phosphatase by the cells growing on all sample groups compared to the control (C) groups at day 14. The morphological characterization of these microparticles through scanning electron microscopy showed that these microparticles were well suited to be used as the injectable scaffolds with perfectly spherical shape and size. The incorporation of silica nanopowder altered the nano-roughness of the microparticles as observed through atomic force microscopy scans with roughness values going down from C to S3. The results in this study, taken together, show the potential of chitosan-tripolyphosphate-silica nanopowder microparticles for improved bone regeneration applications.
Keywords: Chitosan, nanosilica, nano-roughness, osteoblasts, proliferation, differentiation
Introduction
Current efforts on bone regeneration are focused more toward the development of injectable scaffolds attributed to their characteristic property of requiring minimal surgical procedures. The ability to be injected into complex and irregular bone structures makes them more interesting in craniofacial regeneration applications.1–4 Injectable scaffolds in the form of micro- and nano-particles, gels, films have been developed5,6 using various biomaterials including natural and synthetic polymers as well as various composite materials.7–10 Biopolymers which are biocompatible and biodegradable have been studied extensively for these applications and chitosan (CS) is one of the highly used among them.11–14 It has been extensively explored in the development of drug and gene delivery vehicles, wound repair and anti-cancer therapy.15–17 The presence of cationic amine group in CS provides it with the ability to have specific interaction with extracellular matrix components such as glycosaminoglycan and other proteoglycans which make it more promising to be used in bone regeneration.18 Furthermore, the enzyme-degraded products of CS are non-toxic and are easily absorbed within the human body. The presence of cationic amine group in CS also provides it with the ability to form the complex with various anionic species thereby forming a stable scaffold structure.19 Genipin and tripolyphosphate (TPP) are considered attractive options to crosslink CS and develop the 3D scaffold mainly because of their non-toxicity.20,21
Microparticles with the size ranging from few microns to several hundred microns can be developed using CS with TPP as a cross-linker using different fabrication methods such as emulsification and coacervation techniques.22 The response of mesenchymal stem cells (MSCs) and osteo-progenitor cells to these microparticles has been shown to improve by the addition of calcium phosphate-based inorganic materials.23,24 Hence, the strategy of hybridizing the CS microparticle with suitable inorganic materials has been more effective for bone regeneration applications. Bioactive glasses based on SiO2-CaO-P2O5 system are one of the clinically successful biomaterials. The presence of SiO2 on these materials and hence the formation of silanol (Si-OH) groups in wet condition, induce the formation of Ca-P layer on the surface, thereby enhancing the bone bonding ability of these materials.25,26
Studies have shown that CS-bioglass hybrid scaffolds improve the bioactivity and promote the viability of the cells growing on the scaffold. The bioactivity of bioglass incorporated into CS played a significant role in the bone formation at the surgical site in animal models.27,28 The bioglass used in these studies was either purchased commercially or synthesized based on SiO2-CaO-P2O5 system. In this study, we incorporated only silica component of bioglass in nano-powder form into CS-TPP microparticles and assessed the effects of this hybridization. The extensive in vitro studies were performed than that reported on somewhat similar combination of materials.29 Furthermore, the CS-TPP-nSiO2 microparticles in this study were prepared in completely benign conditions. CS-TPP microparticles-based scaffolds have been studied in bone regeneration applications with limited osteogenic potential without growth factor encapsulation or hybridization with inorganic phases. Using a simple and yet novel combination CS-TPP-nSiO2 developed into injectable microparticles, we have shown that this combination improves the osteogenic potential of injectable CS microparticles.
Materials and methods
Materials
CS (190–310 kDa, 85% deacetylated), sodium TPP, silica nanopowder (99.8%, Φ12 nm), acetic acid (99.7%), β-Glycerol phosphate (≥98.0%), L-Ascorbic acid (cell culture tested) were purchased from Sigma-Aldrich (USA). Calcein AM (Invitrogen), alpha minimum essential media (α-MEM, Gibco), fetal bovine serum (FBS, Gibco), penicillin-streptomycin (Gibco), phosphate-buffered saline (PBS, Gibco), Dulbecco’s phosphate buffered saline (DPBS, Gibco) were supplied by ThermoFisher scientific. Cell proliferation reagent WST-1 (Roche) was purchased from Sigma-Aldrich (USA), alkaline phosphatase (ALP) assay kit was purchased from BioVision Incorporated. Murine pre-osteoblasts (OB-6) were used to study in vitro activities.
Fabrication of nSiO2-CS microparticles
Microparticles were fabricated by ionically crosslinking CS with TPP. CS powder was dissolved in 1% acetic acid at the concentration of 0.025 g/ml and was filtered using nylon mesh with the pore size of 50 μm in order to remove the undissolved particles. Nano-silica was added into filtered CS solution at 0% (control- C),2.5% (sample-S1), 5% (sample-S2) and 10% (sample-S3) (w/w) of CS and stirred using a magnetic stirrer until a uniformly dispersed solution was obtained; 10 ml of CS-nSiO2 solution was then added dropwise into 100 ml of 2% TPP solution using 30 gauge needles and stirred at 300 r/min for 1.5 h at room temperature to obtain the microparticles. The microparticles were then washed with DI water and dried at room conditions for 24 h.
Characterization of microparticles
Morphology study.
The morphology of the microparticles was studied using FEI Quanta 3D FEG scanning electron microscope (SEM). The microparticles were loaded into aluminum stubs using double-sided carbon conductive tapes and sputter coated with gold for 25 s before analysis. Low magnification (100×) and high magnification (around 2000×) images were collected to observe the surface morphology of the microparticles. Energy dispersive spectroscopy (EDS) was used to quantify the elemental silicon (Si) along the surface of the microparticles after the calibration of EDS detector with pure Si. Since the size of the microparticles was different for different groups, instead of taking whole microparticle surface, three different regions along the surface of microparticles were selected to quantify the amount of elemental Si. The selection was done with rectangular window and the size of this selection window was kept same to make the quantification surface area constant.
Fourier transform infrared spectroscopy study.
The physico-chemical interaction among the components in microparticle was analyzed using Fourier transform infrared (FTIR) spectrometer (Varian UMA 600 with Ge crystal). The microparticles were grinded into fine powder and the spectrum (700–4000 cm−1) was collected in micro-ATR mode.
Nano-roughness study.
The nano-topography of the microparticles was studied using Bruker Multimode 8 atomic force microscope (AFM) with J-scanner. The Nanoscope software was used to set the parameters for scanning and Nanoscope Analysis software was used to analyze the scanned images. The microparticles were fixed into aluminum sample holder using fixative glue and the surface was scanned using silicon nitride probes (SNL-10) in tapping mode. Due to spherical morphology of the microparticles, only the top surface was scanned and imaged to avoid the curvature. Fifteen microparticles from each group were scanned with the scan size of 5 μm and the images collected were analyzed to determine the average roughness (Rq) value.
Osteoblast culture and seeding
Mouse pre-osteoblasts (OB-6) cell vial was obtained from Dr. Lecka Czernik, Department of Orthopedic Surgery at the University of Toledo and was passaged few times for our studies. The culture medium was prepared using α-MEM supplemented with 15% FBS and 1% penicillin/streptomycin. For osteogenic differentiation studies, the prepared culture medium was further supplemented with 10 mM β-Glycerol phosphate and 50 μg/ml L-Ascorbic acid (osteogenic medium). For all experiments, 10 mg microparticles were transferred into 24-well plate and were incubated at 37°C with 1 ml culture medium for 4 h before seeding them with the cells. This was done to settle down the microparticles at the bottom of the wells. The cell seeding density used varied from 20,000 cells/well to 5 × 10⁵ cells/well depending on the study type and has been mentioned on the corresponding studies. To seed the cells, cell suspension medium with the required number of cells was added to well containing settled microparticles and incubated. The cell culture medium was replaced with fresh medium every third day of study period. The cell related experiments were run three times with each sample run in triplicates, unless otherwise mentioned.
Cell viability studies
Water soluble tetrazolium assay.
Water soluble tetrazolium (WST-1) assay was used to study the cytotoxic effects related to the addition of nSiO2 into the microparticles. This is a colorimetric assay based on the conversion of stable tetrazolium salt into soluble formazan by the cellular mechanism that occurs at the cell surface. Hence, the amount of formazan detected directly relates to the number of metabolically active cells. For this study, the microparticles were incubated with complete culture medium for 24 h at 37°C and 5% CO2 in a 24 well plate. In a 96-well plate, 20,000 cells/well were plated and incubated at same conditions for 24 h. After 24 h, the culture medium on cell plated 96-well plate was replaced with 100 μl of medium extract from the 24-well plate incubated with microparticles. After incubating the cells in extracted medium for another 24 h at 37°C and 5% CO2, 10 μl of WST-1 reagent was added to the wells and incubated further for 4 h under same conditions. After 4 h, the formation of water soluble formazan was detected at 450 nm using SpectraMax 190 microplate reader (Molecular Devices, USA).
Fluorescence imaging.
The viability and proliferation of cells attached to the microparticles were imaged using Cytation 5 cell imaging multi-mode reader (BioTek, USA) after staining the cells with calcein AM. The microparticles were seeded with 50,000 cells/well in a 24-well plate for 10 days. In order to specifically observe the proliferation of cells on the microparticles, the cell-attached microparticles on day 10 were transferred into empty wells and washed with 1×-PBS twice. The calcein AM was then added along with 1×-DPBS and imaged using Cytation 5. The viable cells attached to the microparticles were indicated by the green fluorescence of calcein which has been enzymatically converted from calcein AM by live cells.
Cell morphology study
SEM can be considered as a suitable technique to observe the spreading pattern and morphology of cells on the scaffold. The microparticles were seeded with 105 cells, at day 5, were transferred into new wells and washed with 1 × PBS twice. The fixation of cells into the scaffold was done by immersing cell-microparticle constructs into 2.5% glutaraldehyde in a cacodylate buffer (pH 7.4) and incubating at 4°C for 1 h. After washing with 1 × PBS, they were dehy-drated by immersing in a series of ethanol dilution (30%, 50%, 70%, and 90%), three times each for 3 min, and finally in 100% ethanol, two times each for 5 min. Lastly, they were immersed in 100% HDMS and kept inside a hood overnight for complete drying. The dried cell-microparticle constructs were then sputter coated with copper for 90 s and imaged using SEM at 5 kV.
DNA quantification
The proliferation of cells on the surface of microparticles was determined by the quantification of DNA at day 7 and 14 using DNeasy Kit (Qiagen Group, USA); 10 mg of the microparticles were seeded with cells in a 24-well plate at the density of 105 cells/well. In order to specifically quantify the amount of DNA from the cells proliferating only along the surface of microparticles, the microparticles on day 7 and 14 were carefully transferred into empty wells and washed thoroughly with 1 × PBS to eliminate the residual culture medium that can hinder the DNA extraction process. The microparticles were then resuspended in 20 μl of proteinase K and 200 ml of PBS and lysis buffer and incubated at 55°C for 10 min to maximize the efficiency of DNA extraction; 200 μl of 100% ethanol was added to the above solution and was mixed thoroughly. Finally, the mixture was transferred into spin column placed in 2 ml collection tube supplied with the kit and the protocol given with the kit was followed. The quantity and the purity of DNA were then quantified using Nanodrop-2000.
Cell differentiation
ALP quantification.
The cellular ALP activity was determined by quantifying the amount of p-nitrophenol (pNP), dephosphorylated from p-nitrophenyl phosphate (pNPP) in the presence of ALP using ALP assay kit (BioVision, USA). The cells were seeded at 50,000 cells/well and the assay was performed on day 1, 7 and 14 after growing the cells on the osteogenic medium. For the assay, the cell-attached microparticles were carefully transferred into new 24-well plate and were washed with 1×-PBS thoroughly; 250 μl of lysis buffer was then added to the microparticles and vortexed to lyse the cells attached to microparticle. It was then centrifuged and the supernatant collected was mixed with pNPP substrate and the kit procedure was followed. The color developed was quantified using SpectraMax 190 microplate reader (Molecular Devices, USA) and the ALP was estimated using a standard curve obtained using ALP enzyme supplied with the kit. The amount of ALP activity was normalized with the total protein content in each sample. The total protein was quantified using Coomassie Plus protein assay kit (Thermo Scientific, USA) following the kit procedure.
Gene expression.
The osteoblast specific gene expression profile for the cells seeded into the microparticles was determined using real-time reverse transcription polymerase chain reaction (RT-PCR); 20 mg of microparticles were seeded with 5 × 10⁵ cells in a 24-well plate and the gene expression profile was studied on day 7 and 14. The total RNA was isolated using RNeasy Kit (Qiagen Group, USA) following the kit protocol. The purity and concentration of isolated RNA were determined using Nanodrop-2000. The calculation for the reverse transcription into complementary DNA (cDNA) was done based on the lowest amount of RNA and the process was carried out using cDNA kit from Verso (Thermo Scientific, USA) following manufacturer’s protocol. After synthesizing the cDNA and diluting it properly, real time RT-PCR was run to quantify the expression of gene of interest. The forward and reverse primers for these genes (Table 1) were generated using Integrated DNA Technologies website. SYBR green master mix kit (Smart Biosciences) was used for this study and the amplification data was obtained using Applied Biosystems StepOne Plus thermal cycler and detection system. Each groups of the microparticles had three samples and each sample was run in duplicates. The results were normalized with GAPDH gene expression and are presented as a fold change determined using Δ ΔCt method.
Table 1.
Forward and reverse primers used for real time RT-PCR.
| Genes | Forward primers (5′3′) | Reverse primers (5′–3′) |
|---|---|---|
| GAPDH | ACGACAGTCCATGCCATCAC | TCCACCCTGTTGCTGTA |
| Collagen 1 (COL1) | ACTGTCCCAACCCCCAAAG- | CGTATTCTTCCGGGCAGAAA |
| Osteocalcin (OCN) | CGGCCCTGAGTCTGACAAA | GCCGGAGTCTGTTCACTACCTT |
| Bone sialoprotein (BSP) | AACAATCCGTGCCACTCA | GGAGGGGGCTTCACTGAT |
Statistical analysis
The statistical significance of the results obtained between the sample groups was tested with one-way analysis of variance (ANOVA) followed by Tukey’s post hoc analysis. The gene expression data were analyzed using Student’s t-test. The p-value of less than 0.05 was considered as statistically significant. Each experiment comprised three samples for individual groups (n = 3).
Results
Characterization of microparticles
SEM-EDS.
The SEM images taken at the low magnification (100×) showed that the microparticles were spherical in shape with the size ranging from 500 to 600 μm and an average size of 562.22 ± 26.02 μm for control groups and 600–700 μm and an average size of 677.05 ± 22.5 μm for sample groups (S1, S2 and S3). The high magnification (2000×) images were taken to observe the surface of the microparticles. We observed that there was no visible difference in the surface topography of the microparticles suggesting that addition of nSiO2 had no effects on surface micro features. For illustration, the representative SEM images of the microparticle at both the magnification are shown in Figure 1. The distribution of elemental Si along the surface of microparticles was quantified using EDS after the calibration of detector with pure Si. As expected, Si was not observed on the surface of C group. The quantity of Si on the sample groups increased from S1 to S3 with the highest weight percentage (wt. %) of Si on S3 (Figure 1(c)). The wt. % of Si on S2 and S3 was approximately two and three times higher than in S1, respectively. The EDS spectrum of the microparticles (Figure 1(d)) shows the element present at the surface. The peak intensity of elemental Si goes on increasing from S1 to S3. This shows that the nSiO2 was distributed well along the surface of the microparticles.
Figure 1.
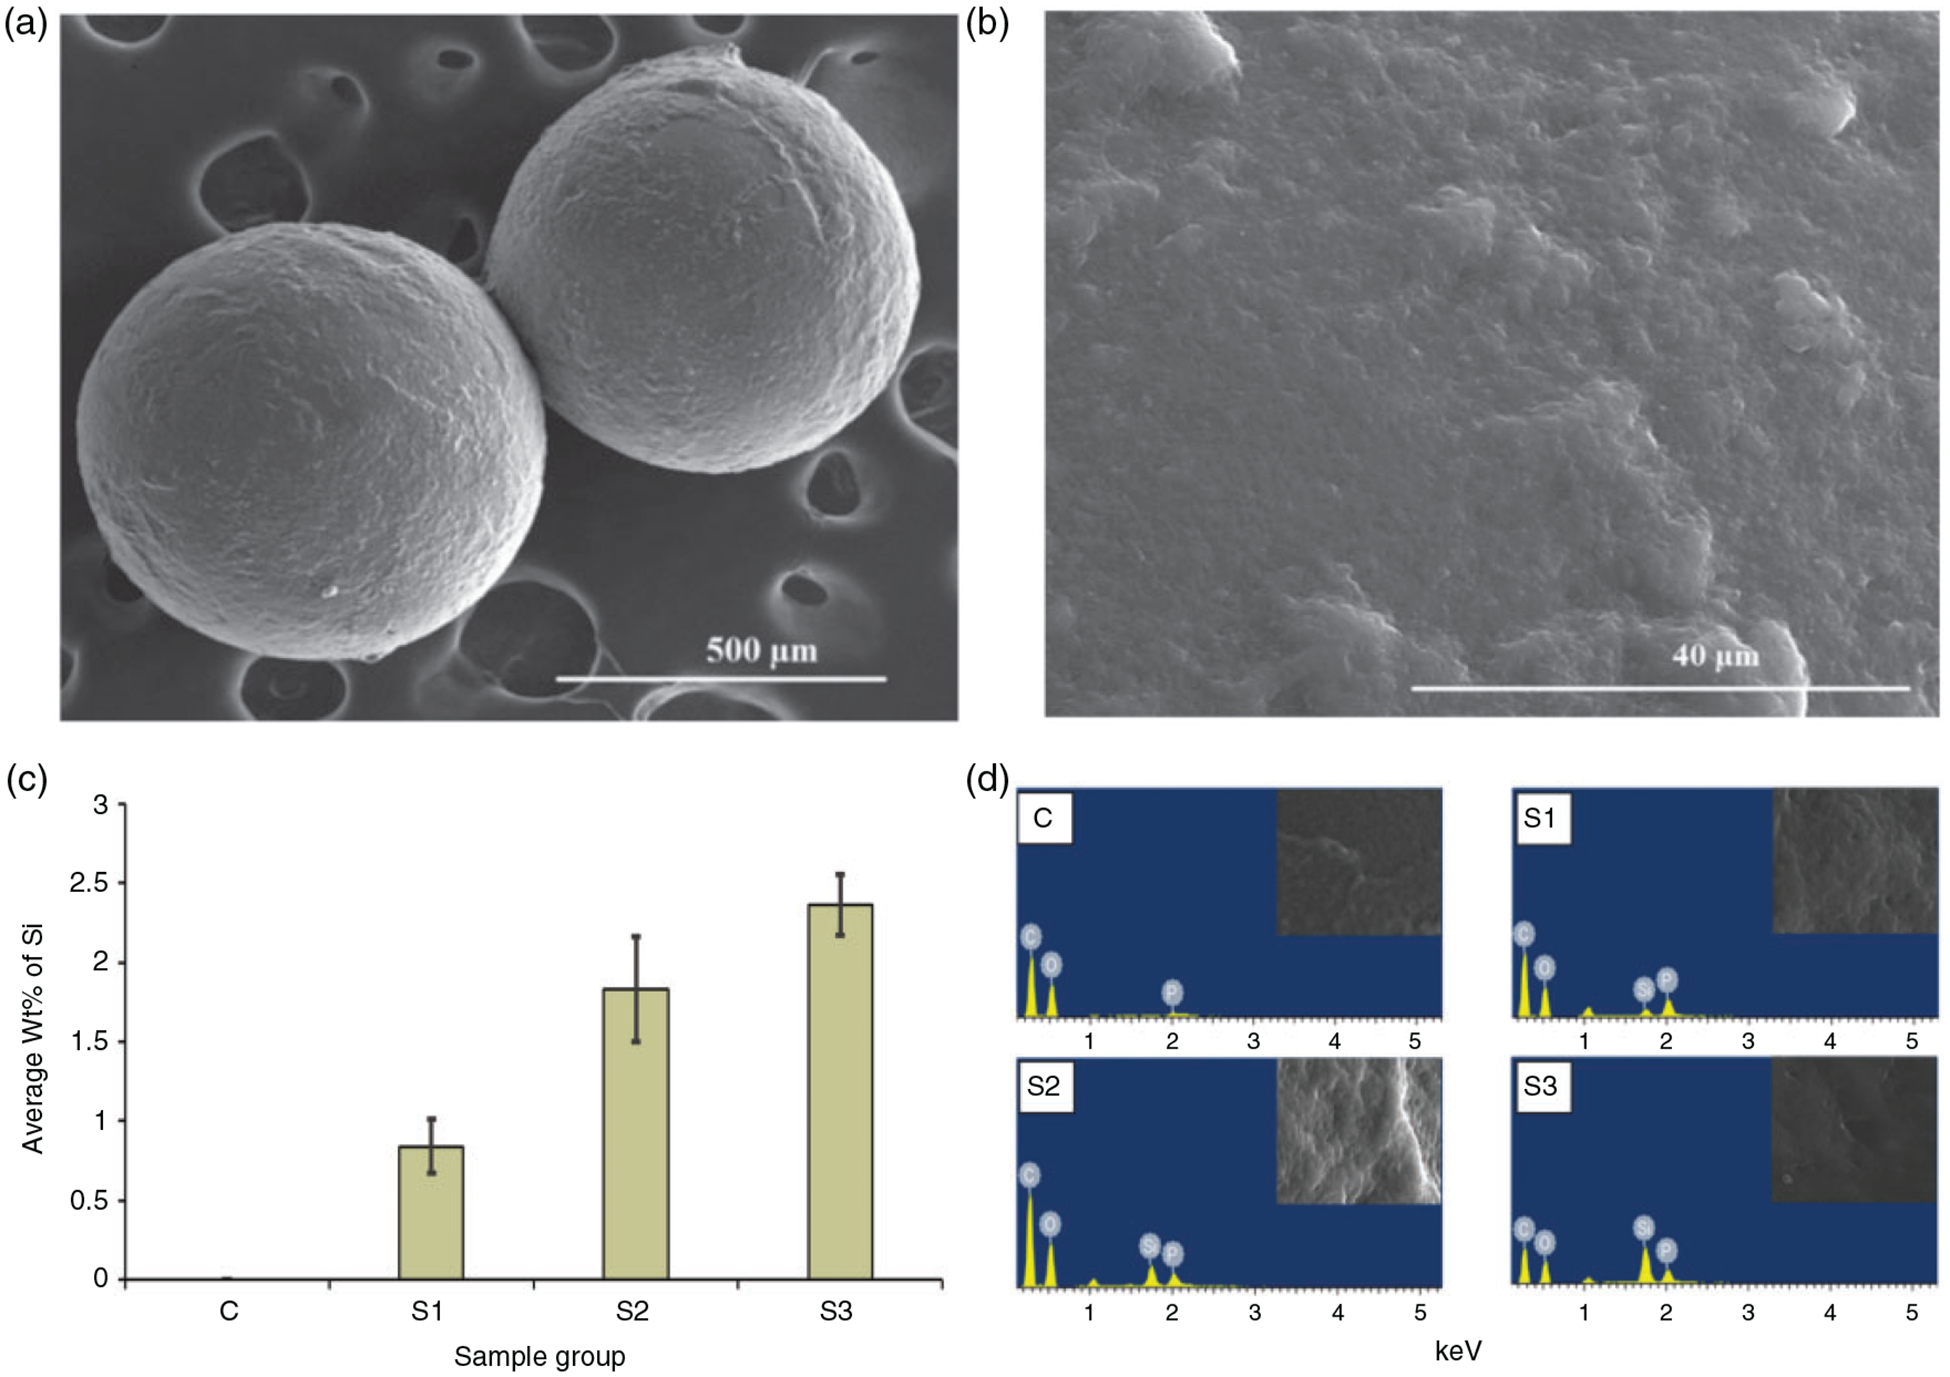
Representative SEM images for microparticle showing the spherical morphology at low magnification (a) (100×) and the surface at high magnification (b) (2000×). The bar graph on c shows the quantitative analysis of elemental Si along the surface of microparticles. Highest wt. % Si was observed in the S3 groups containing 10% (w/w) nSiO2. EDS spectrum (d) shows the elements present at the surface of the microparticles.
FTIR analysis.
The FTIR spectrum of pure CS and sample group S1 is shown Figure 2. As the spectra were same for other sample groups S2 and S3, we just compared the spectrum of pure CS and S1 groups. As seen in the figure, the broad peaks in the range of 3200–3300 cm−1 appearing on all of the spectrums correspond to the −NH2 and O–H stretching vibration and the peak around 2800 cm−1 corresponds to asymmetrical stretching of −CH2. The characteristic peaks for CS only appearing at 1647 cm−1 and 1590 cm−1 correspond to the amide I stretching vibration and NH2 bending vibration, respectively, on CS. The spectrum of both the microparticles (with and without nSiO2) shows all the peaks that were characteristic to bulk CS. In addition, the amide I peak at 1647 cm−1 and NH2 peak at 1590 cm−1 on CS are shifted to the lower bands in the microparticles. This could be due to the interaction occurring between amine groups in CS and the phosphate groups in TPP. Additionally, a peak appears at 800 cm−1 on the nSiO2 added microparticles spectrum corresponding to symmetric stretching vibration of Si-O-Si group.
Figure 2.
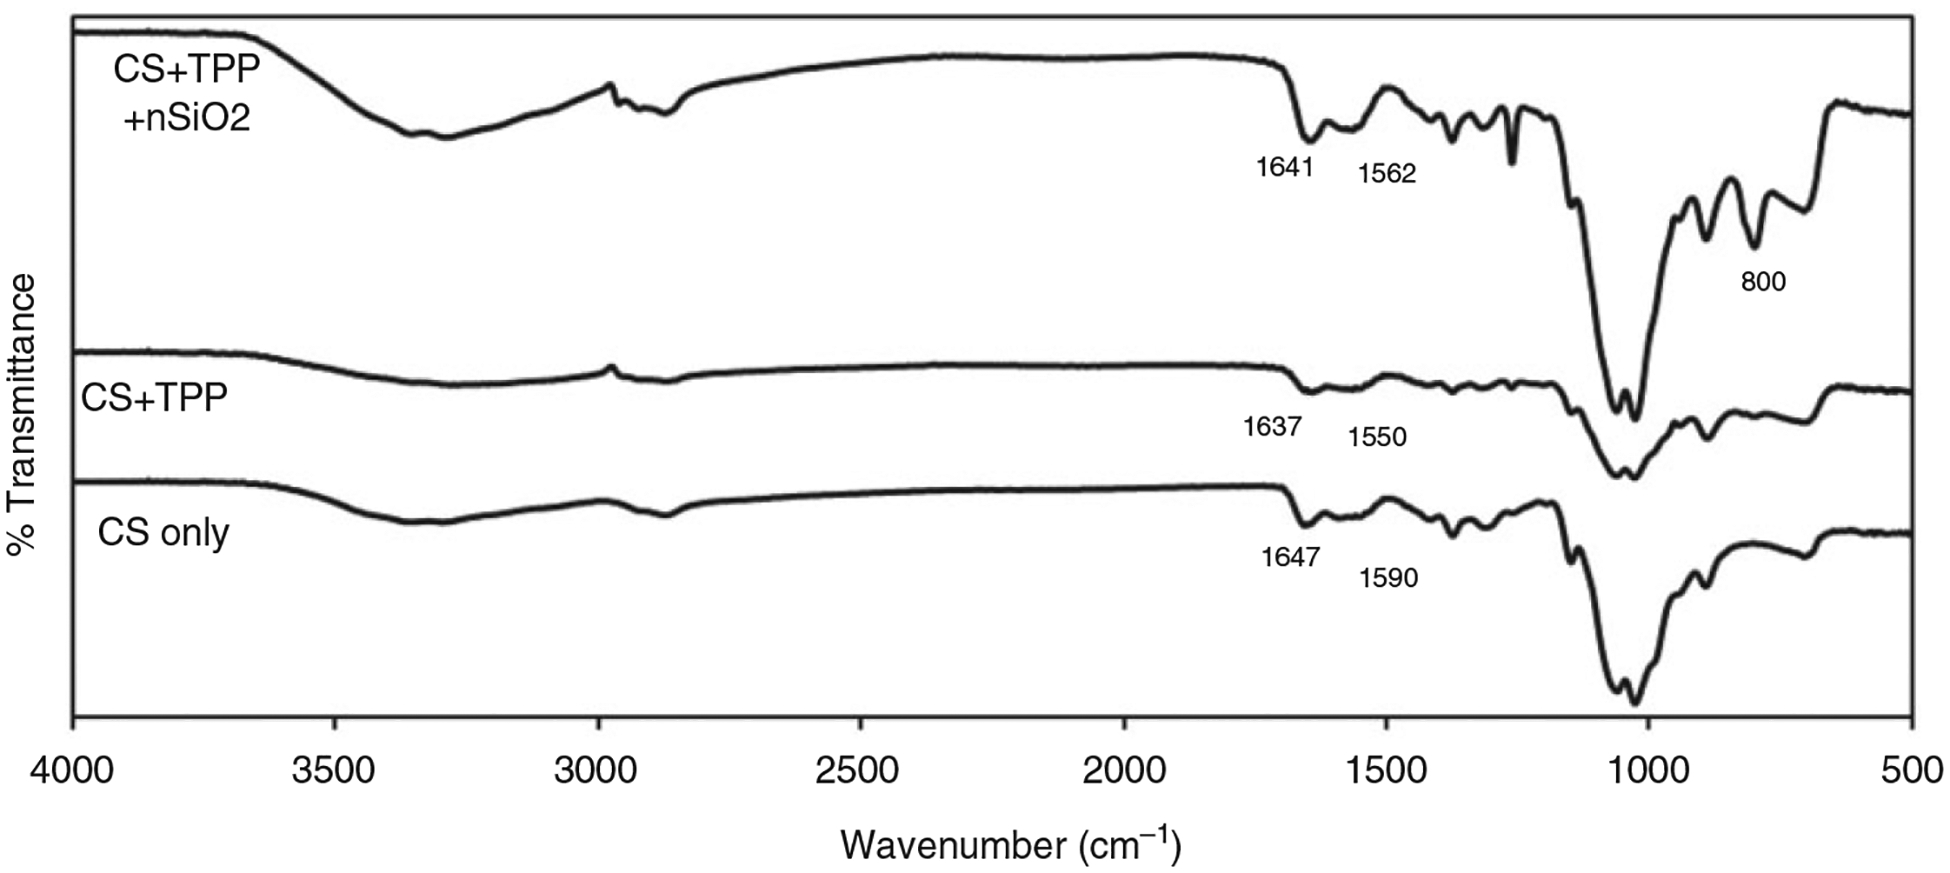
Comparison of Fourier transform infrared (FTIR) spectrum of pure CS and sample microparticle group. S1 spectrum is shown in the figure as a representative spectrum for sample group as the spectrum looked similar irrespective of nSiO2 content.
AFM.
AFM imaging was performed to observe the effects of nSiO2 on the nano surface topography of the microparticles. The imaging was performed on tapping mode where there is a minimal contact between tip and sample, and thus minimizes the chances of tip and sample wear. This scanning mode also offers better resolution AFM images compared to contact mode. The 3D representation of height scan performed over 1 μm region of microparticle at the height scale of 125 nm is shown in Figure 3. As seen on the Figure 3(a), the surface of C group looked rougher and irregular with many nano-peaks compared to other groups of the microparticles. The surface of S3 shown in Figure 3(d) looked smoother without any nano features on the surface. The average roughness (Rq) was determined with the scan performed over 5 μm region of the microparticle and the results are shown in bar graph in Figure 3(e). Ten different microparticles from each group were scanned and the average Rq was determined. It can be seen that the average Rq decreases with the increase in nSiO2 quantity on the microparticles. The average Rq for control group was about 65.4 nm and it went decreasing from S1 to S3 with the lowest measured as 37.13 nm in S3 sample groups. A significant difference in Rq value was observed between C and S3. This result shows that the addition of nSiO2 into CS-TPP microparticles lowers the irregularities on the surface at nano scale and thus decreases the nano-roughness of the microparticles.
Figure 3.
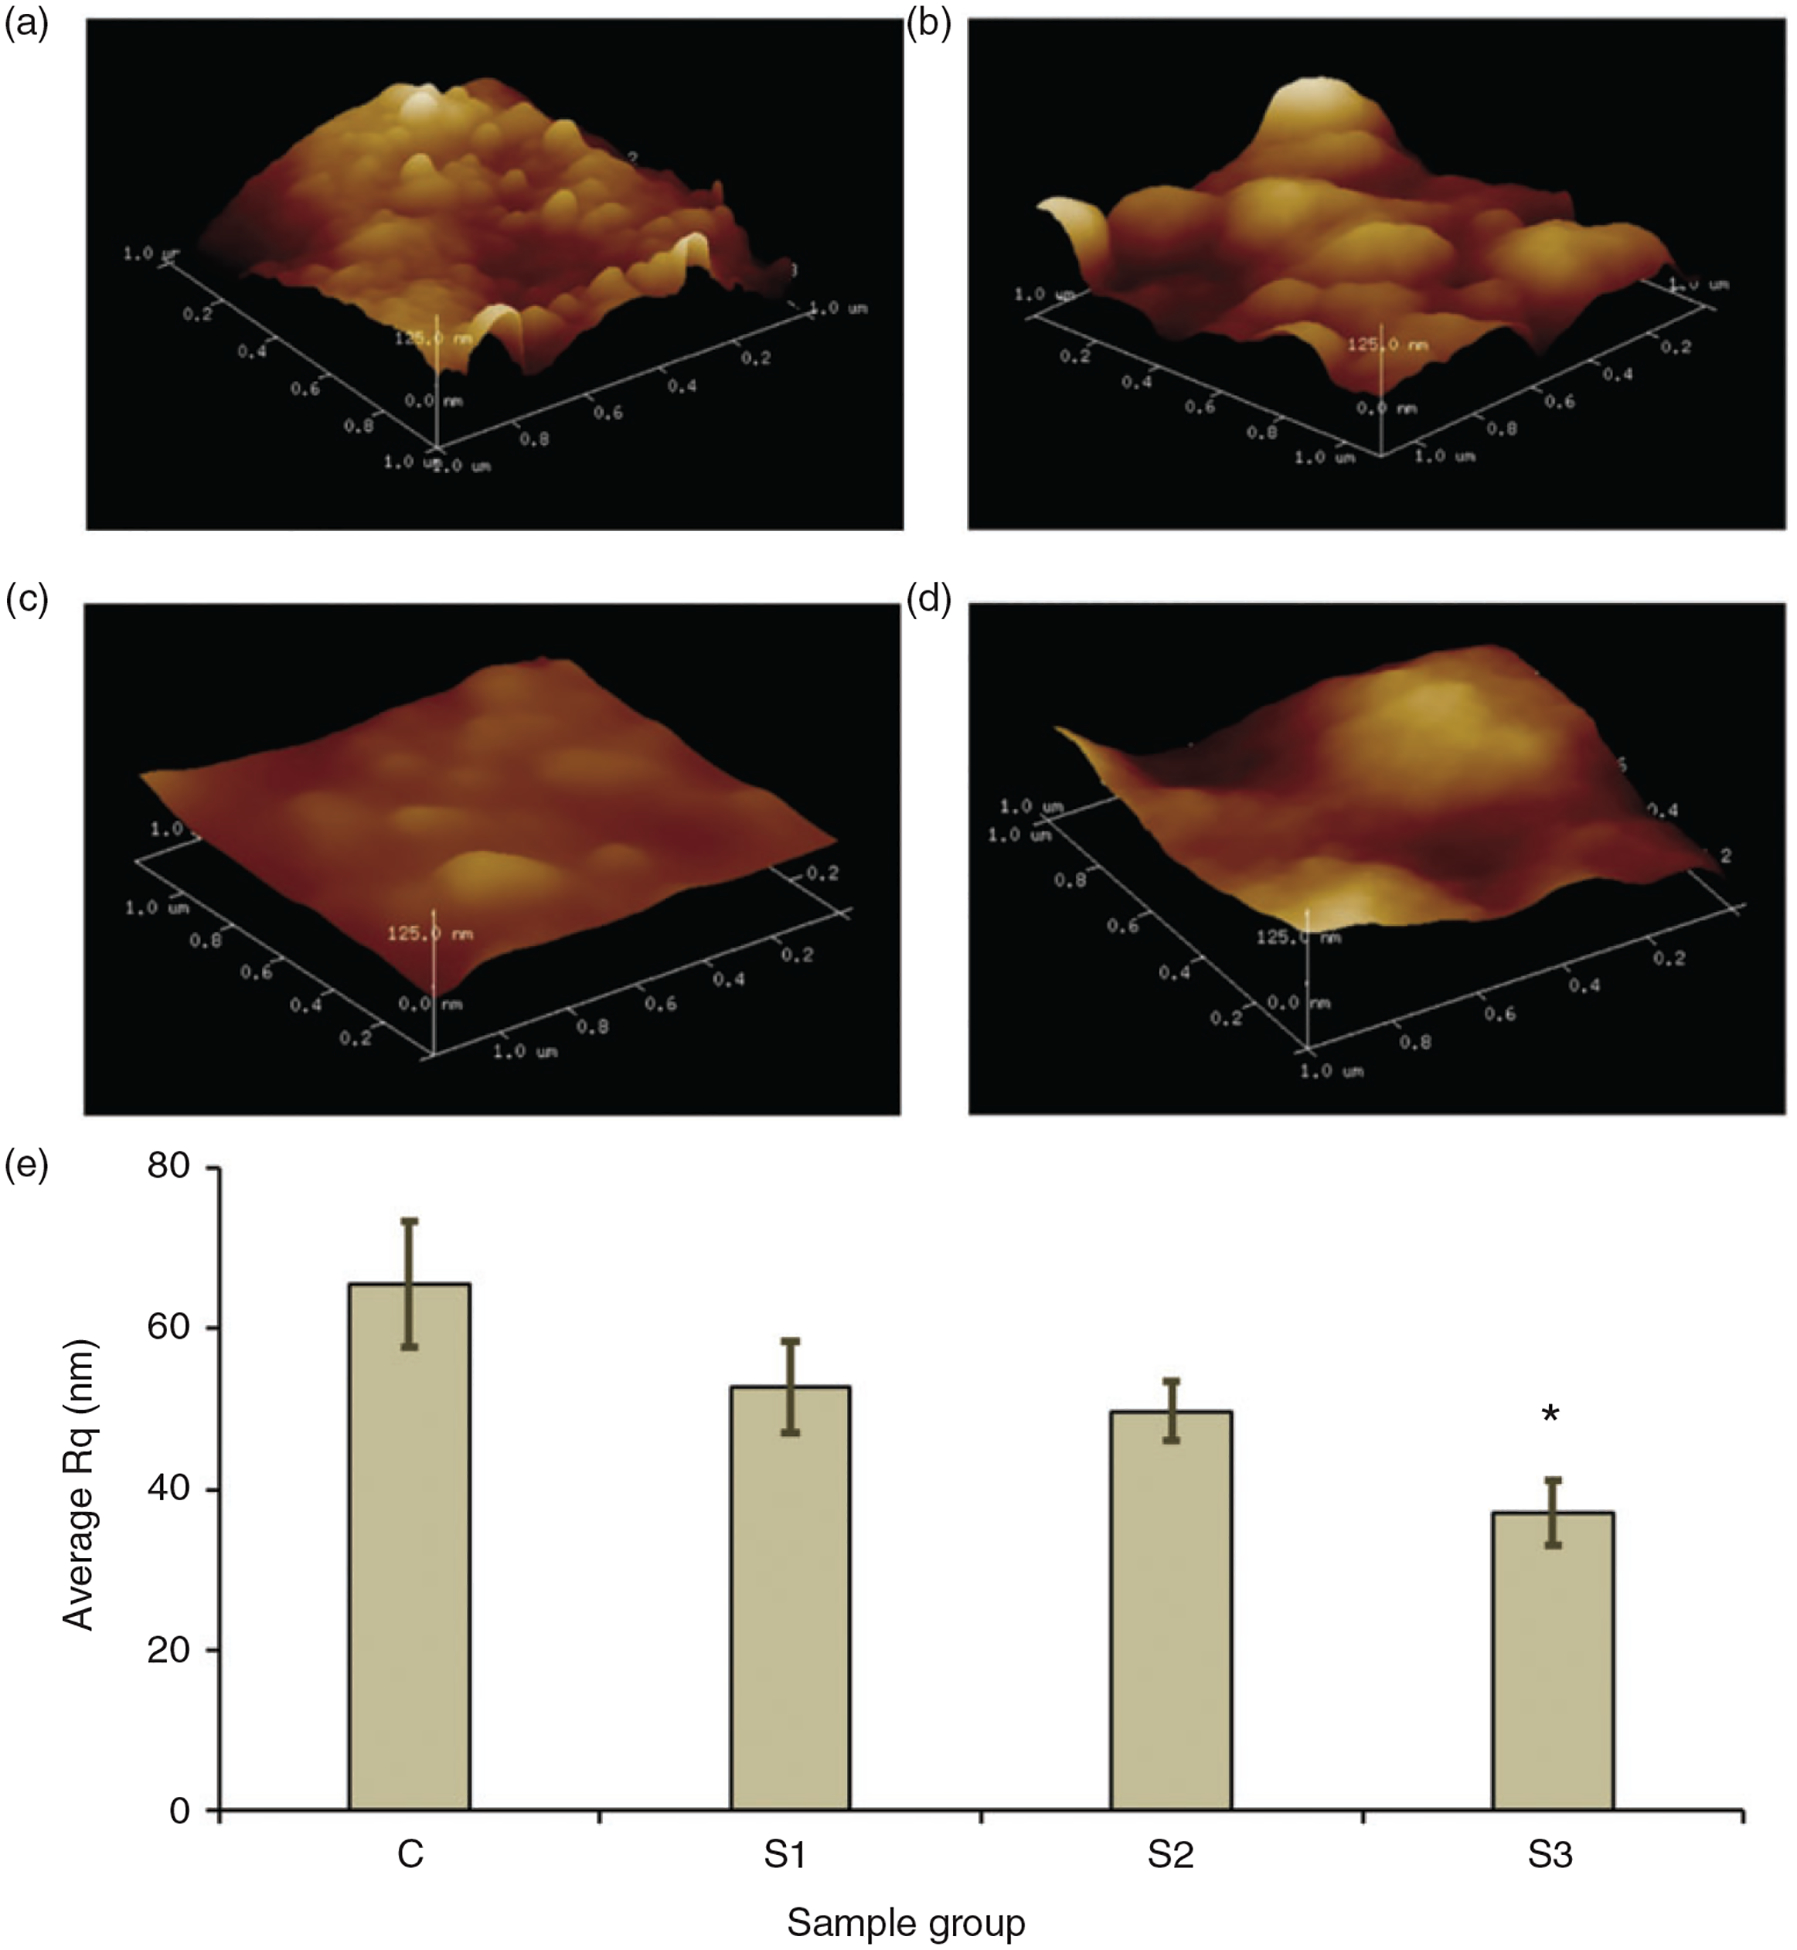
AFM height images showing 3D representation of the surface scanned over 1 μm region along the surface of C (a), S1(b), S2 (c) and S3 (d). The image is in the scale of 125 nm. The bar graph e shows the average roughness (Rq) for different group of microparticles. The avergae Rq decreases with increase in nSiO2 content in the mocroparticles. * represents siginificant difference in Rq between and C and S3 group.
Cell viability
WST-1 assay was performed to assess the quantitative measurement of cell viability cultured with the media extracted after immersing the microparticles for 24 h. After culturing the cells with the extracted media for 24 h, we found that it was not causing any detrimental effect to the cells indicated by the O.D. values of detected formazan. As observed on Figure 4, the O.D. value for the cells cultured with media extract from the sample groups was higher than that from the control group. Even though no significant difference in the O.D. values was observed between the groups, it suggested that the addition of nSiO2 was not affecting the cell viability but was improving the cell growth.
Figure 4.
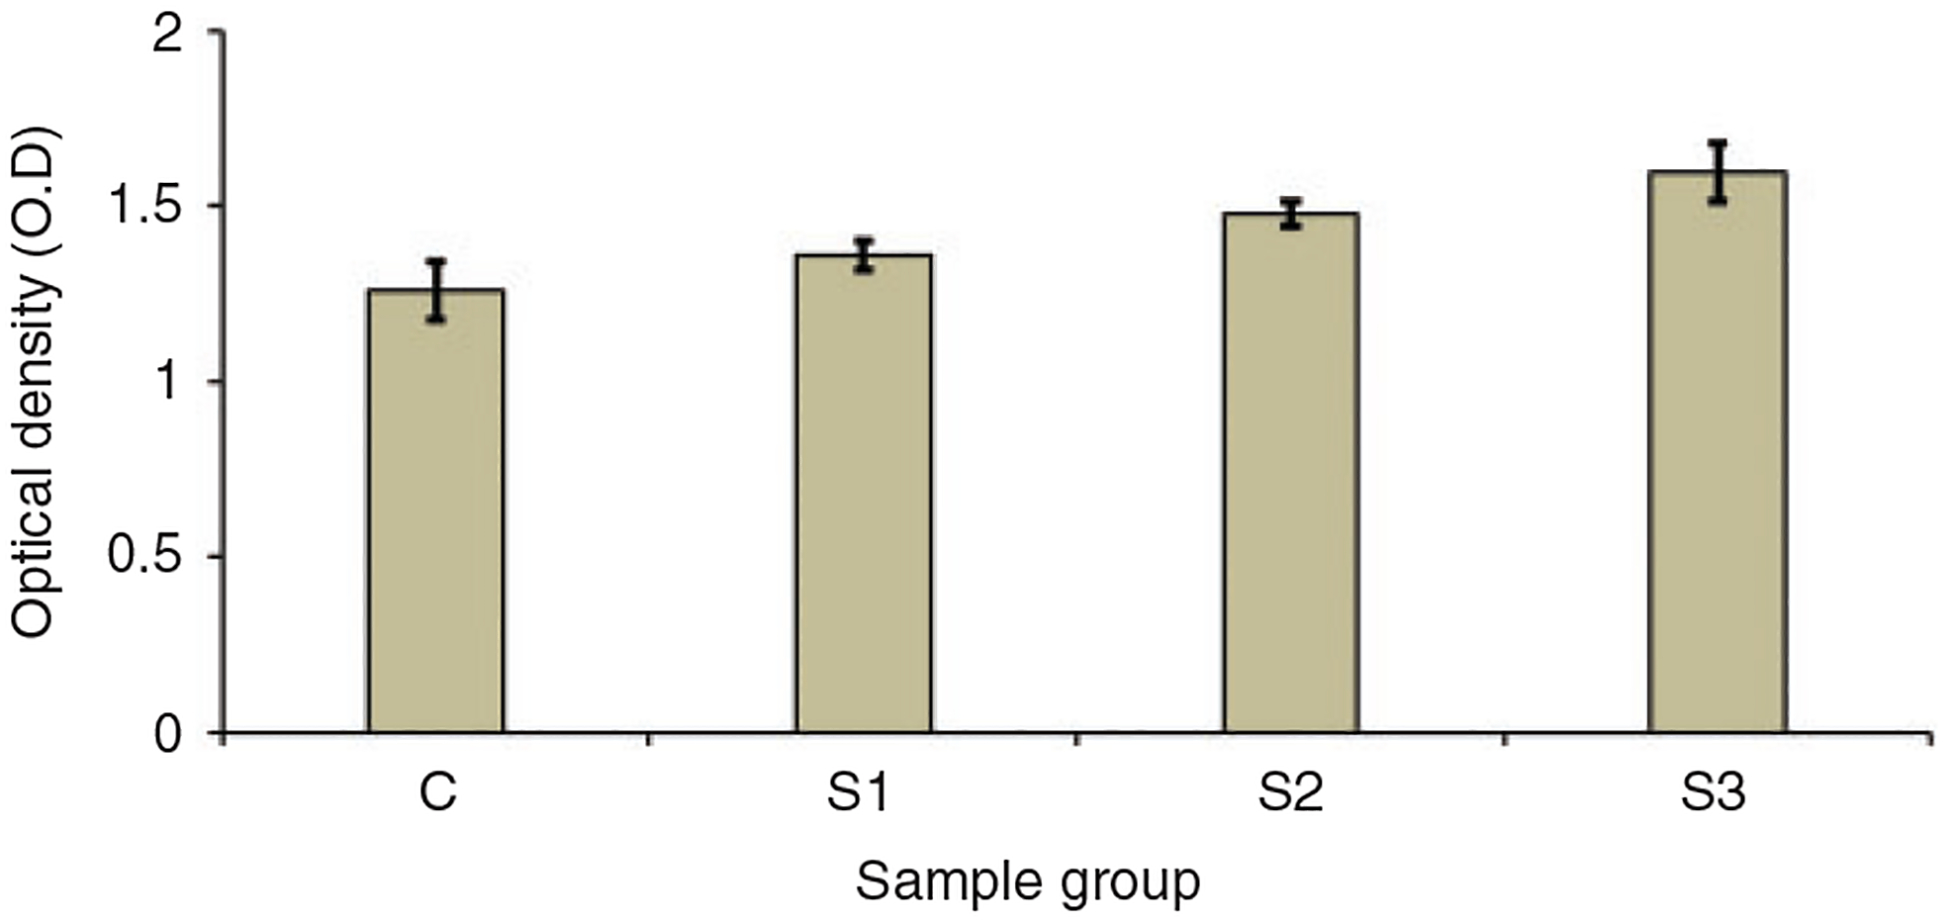
WST-1 assay results showing the O.D. values for cells cultured with media extracted from different groups.
Cell attachment
The attachment and proliferation of viable cells along the surface of the microparticle was imaged after staining the cells with calcein AM which is converted into calcein by the viable cells giving a green fluorescence. Due to the auto fluorescence from the microparticles, the contrast of the image was adjusted to eliminate it and the images shown in Figure 5 show the cells growing on the surface of the microparticles. As seen in the figure, the cells attached and proliferated well along the surface of all the microparticles on day 10. Bright green fluorescence on the surface of the microparticles shows the viable cells proliferating along the surface. The viable cells proliferation along the surface of S2 and S3 (Figure 5(c) and (d)) looked better and higher compared to the other groups with almost whole microparticle surface covered with cells. While individual dots representing cells could be visualized on the surface of C, cells formed the larger colonies along the surface of S2 and S3 represented by larger green fluorescence spots.
Figure 5.
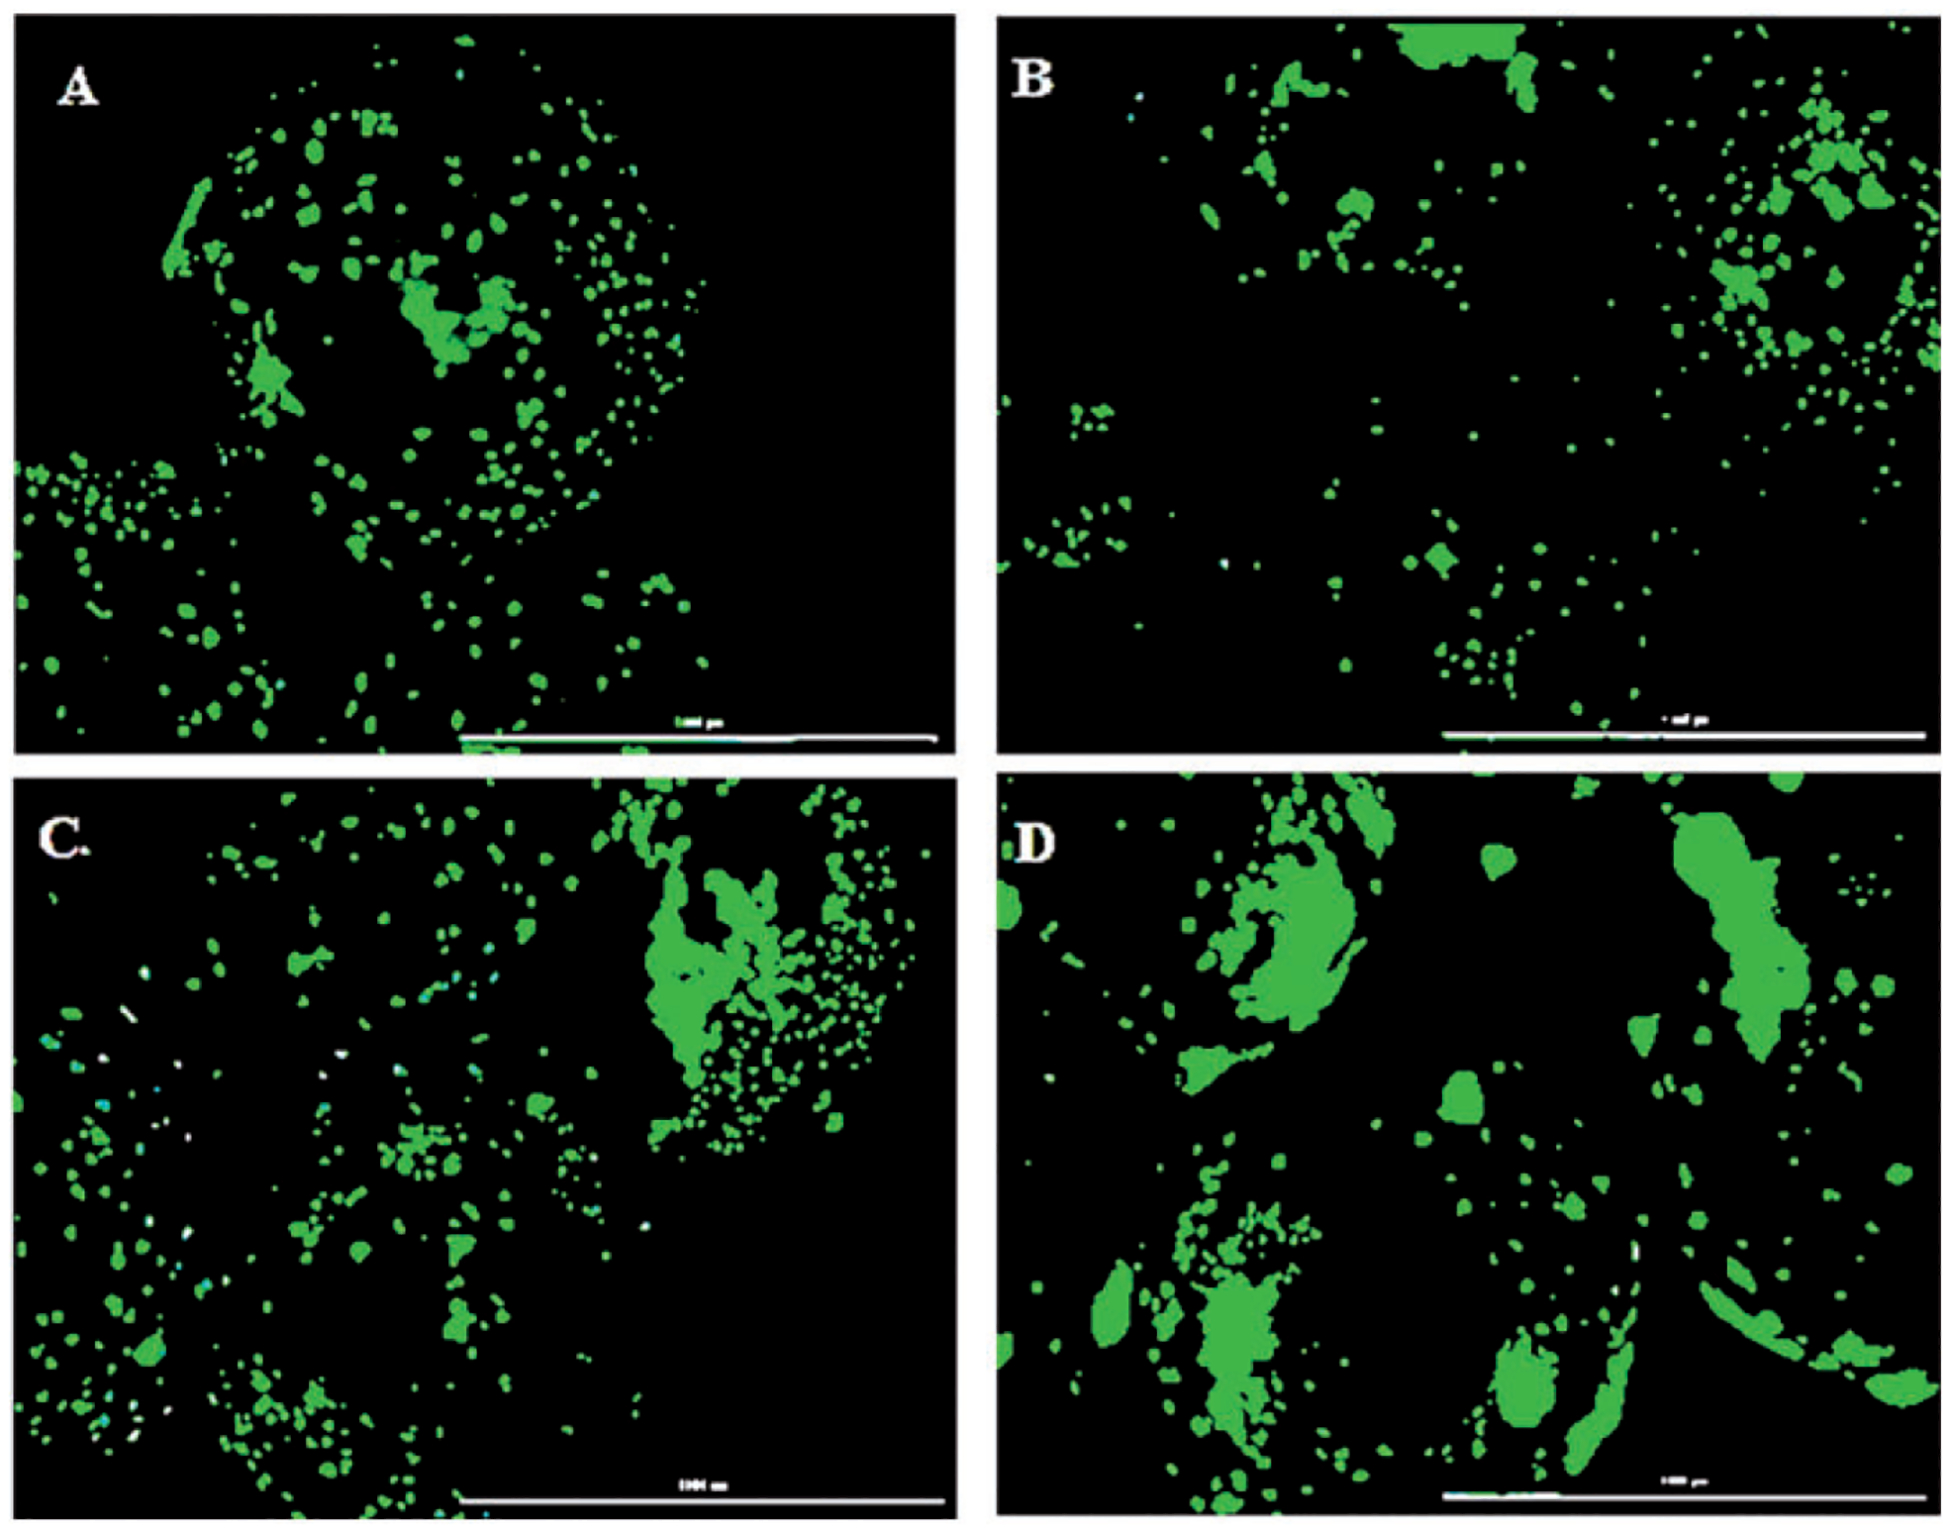
Cytation 5 images of microparticles with cells proliferating along their surface on day 10 imaged after staining with calcein AM. The cell proliferation was higher on S2 (c) and S3 (d) compared to C (a) and S1 (b) (scale: 1000 μm).
Cell morphology
The morphology of cells attached to the microparticles, at day 5, is shown in Figure 6. The cells were attaching and spreading well, along the surface of all the microparticles, with more flattened structure. The cells on the surface of nSiO2 containing microparticles (Figure 6(b) to (d)) were spreading with more visible filopodia extension towards the surface of the microparticles. Multiple attachment sites with the surface of the microparticles were observed and the cells looked more elongated, whereas the cells growing along the surface of C-group (Figure 6(a)) were less elongated and had few filopodia extension along the surface.
Figure 6.
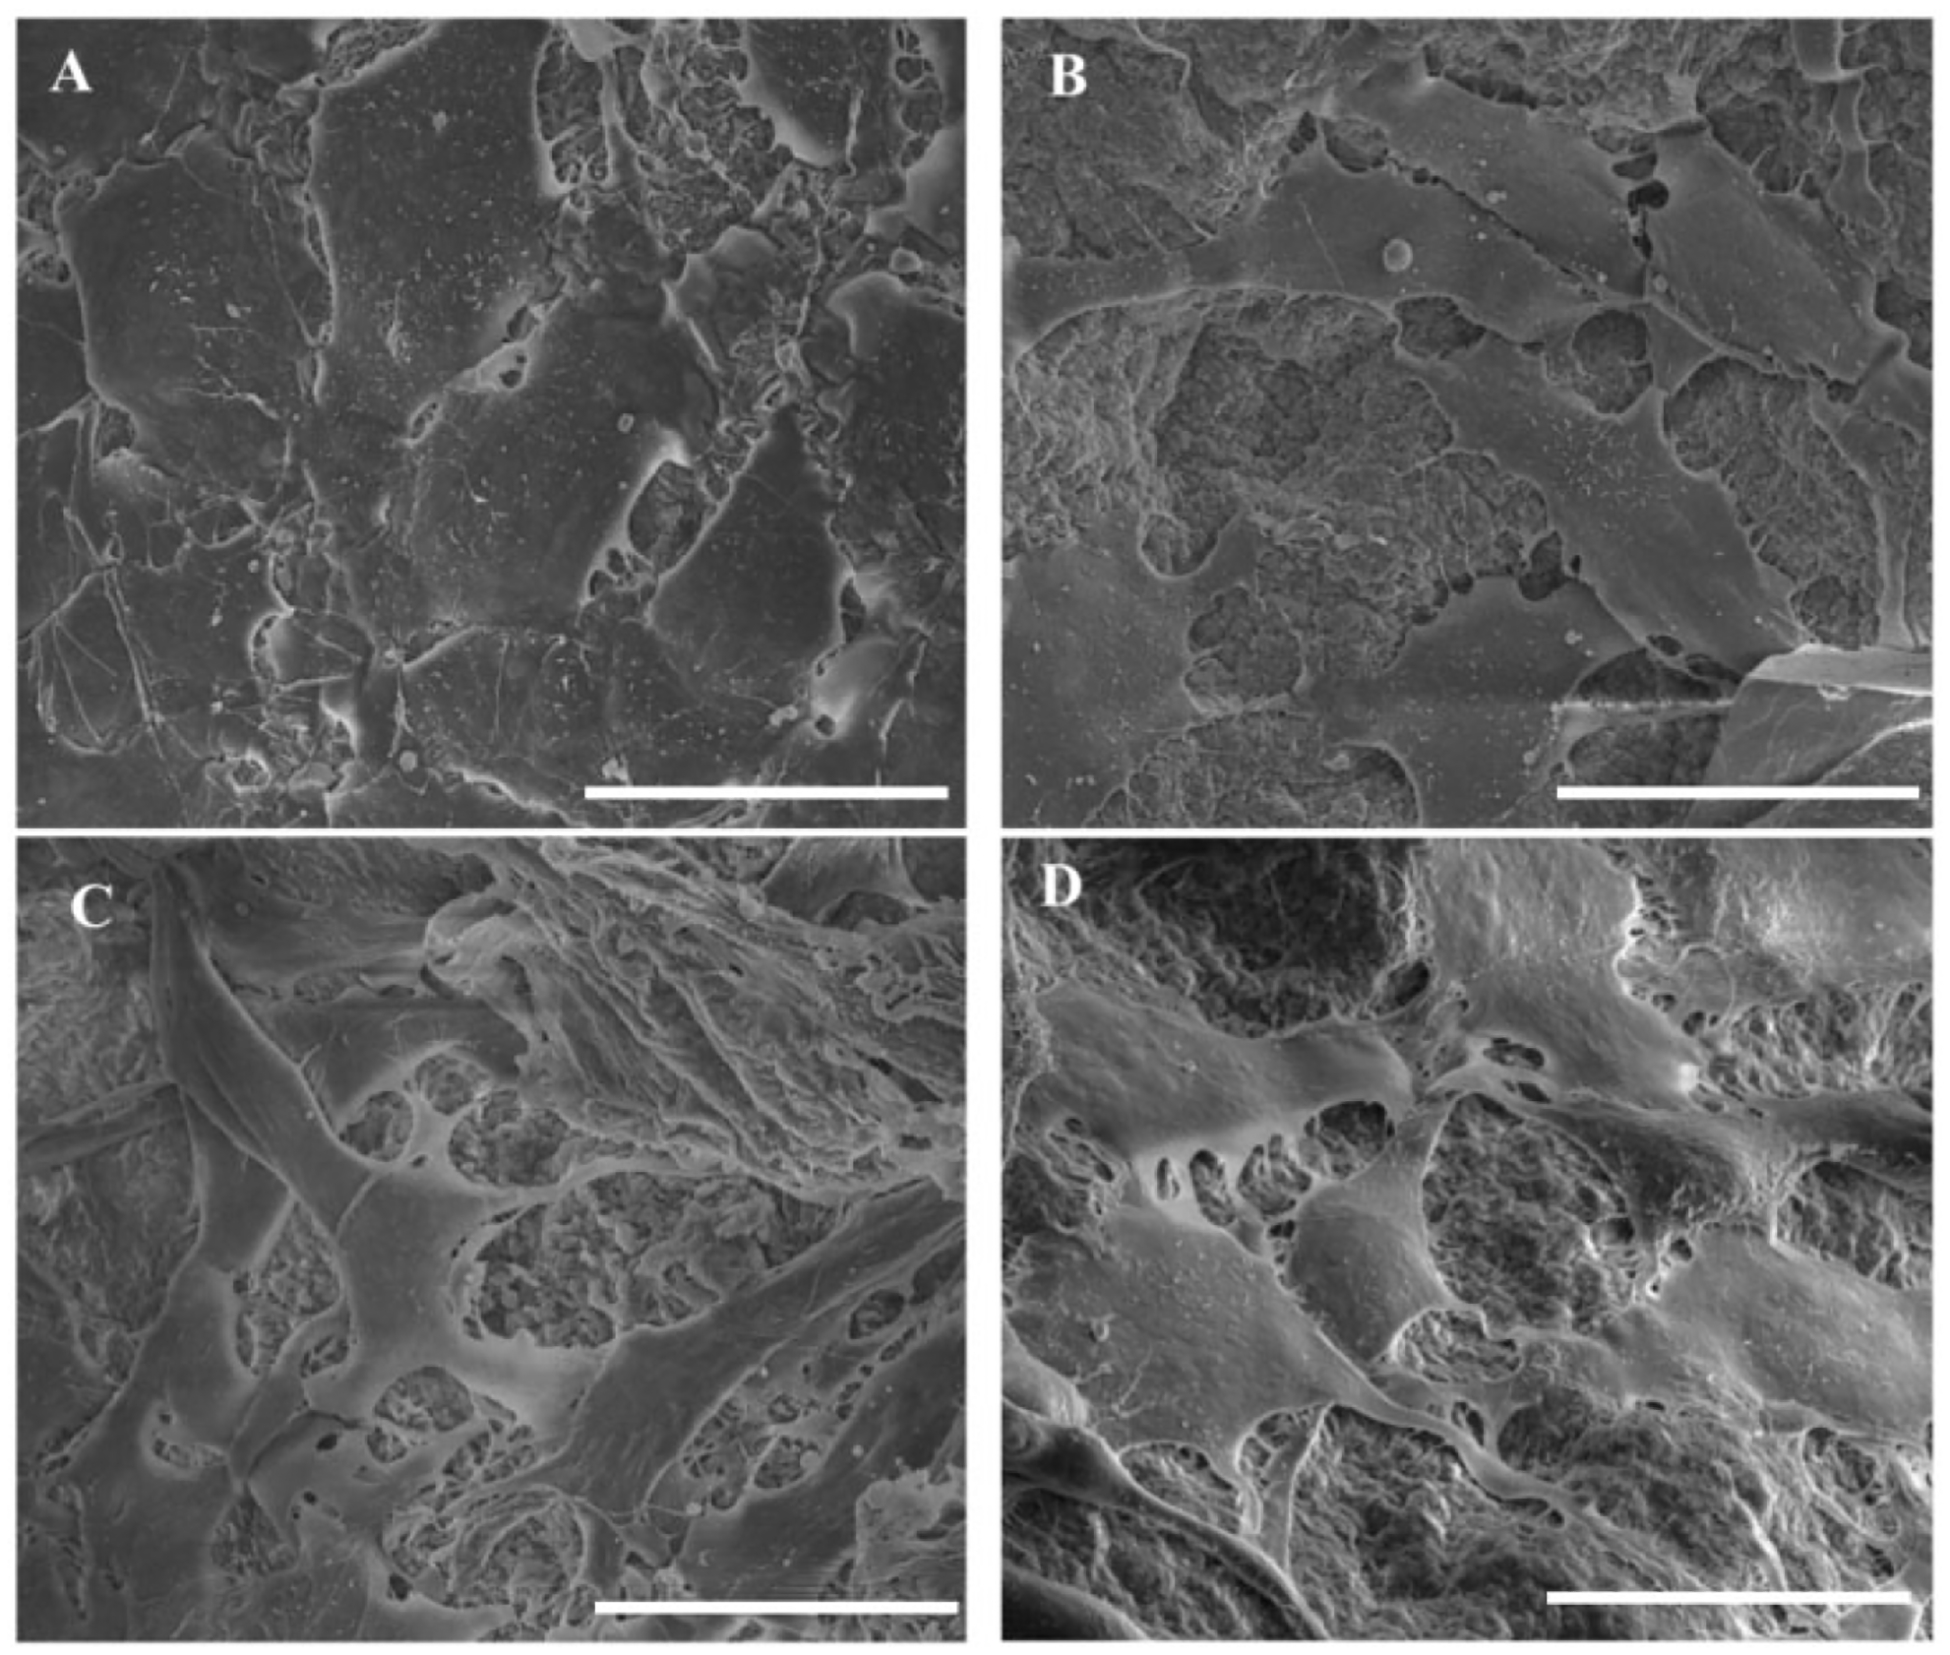
SEM images showing the morphology of cells attached to the surface of microparticles at day 5. Cells had a flattened morphology on all groups with more elongated structure on sample groups (scale: 30 μm).
Cell proliferation
The proliferation of cells along the surface of the microparticles was quantitatively determined by quantifying the DNA amount for the cells growing on the surface of microparticle. In order to make sure that the DNA quantification was done for the cells attached to the microparticles only, the microparticles seeded with cells on day 7 and 14 were transferred into different wells and washed thoroughly with 1 × PBS. The lysis buffer was then added to these wells in order to quantify the DNA. Figure 7 shows the amount of DNA quantified from the cells that attached and proliferated along the surface of microparticles. The amount of DNA on all the samples on day 14 was significantly higher (p < 0.05) than that on day 7 indicating that the cells were proliferating well along the surface of microparticle. The figure also shows the significant increase in the amount of DNA on the sample groups S2 and S3 on day 7 and S3 on day 14 compared to C group. This result is consistent with cell proliferation on the microparticles observed on Figure 5 where more cells were found to be proliferating along the surface of S2 and S3. This shows that the incorporation of nSiO2 improves the osteoblast response of CS microparticles allowing cells to better grow and proliferate along their surface.
Figure 7.
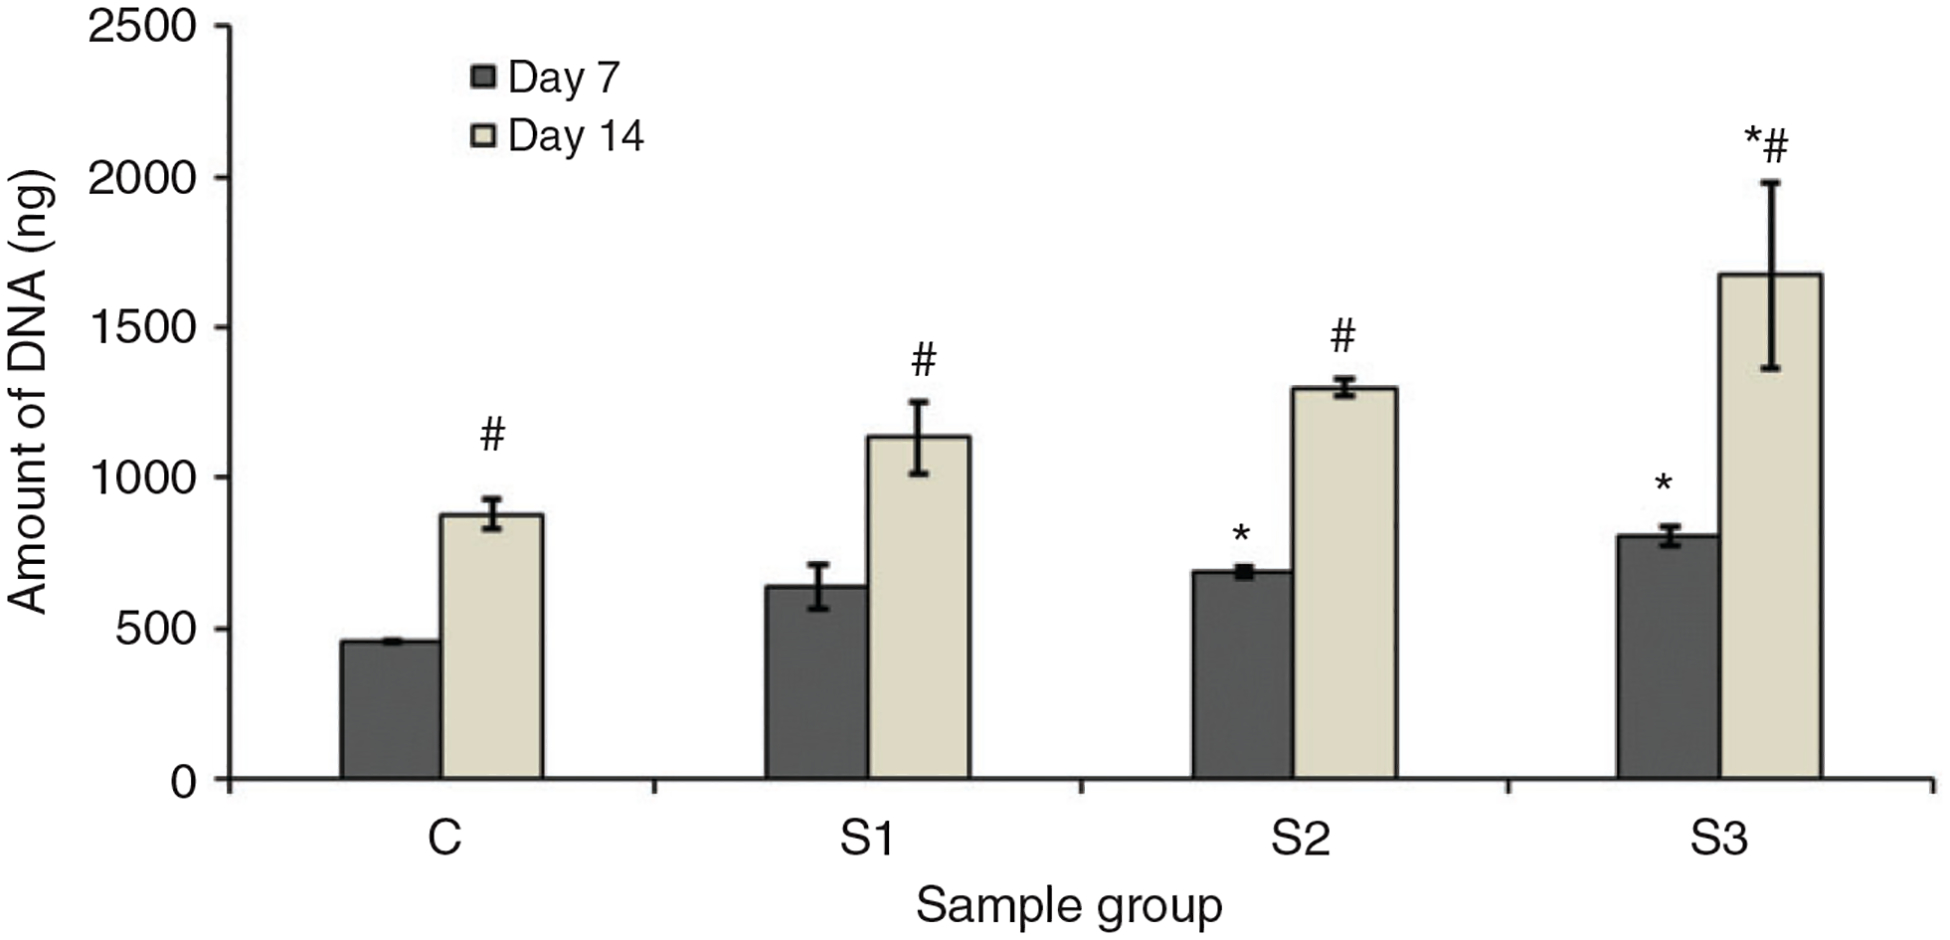
Amount of DNA obtained from the cells attached and proliferated along the surface of the microparticles on day 7 and 14. * represents the significant difference from the control group on same day and # represents significant difference for same group on different days (p < 0.05).
ALP activity
ALP expression study was performed to assess the effects of nSiO2 addition in the osteogenic differentiation of pre-osteoblasts growing on the surface of microparticles. The upregulation of ALP activity is a key event that takes place during the early stages of osteogenesis. The quantification of ALP activity within the cells attached to the microparticles on day 1, 7 and 14 is shown in Figure 8. The ALP activity was increased for all groups of microparticles throughout the 14 days of study. There was a minimum ALP activity detected on day 1 on all groups, whereas it was significantly higher on S2 and S3 compared to control groups on day 7. Furthermore, significantly higher ALP activity was detected on day 14 on all sample groups (S1, S2 and S3) compared to C groups. These results show the osteogenic potential of CS microparticles brought about by the addition of nSiO2 into them.
Figure 8.
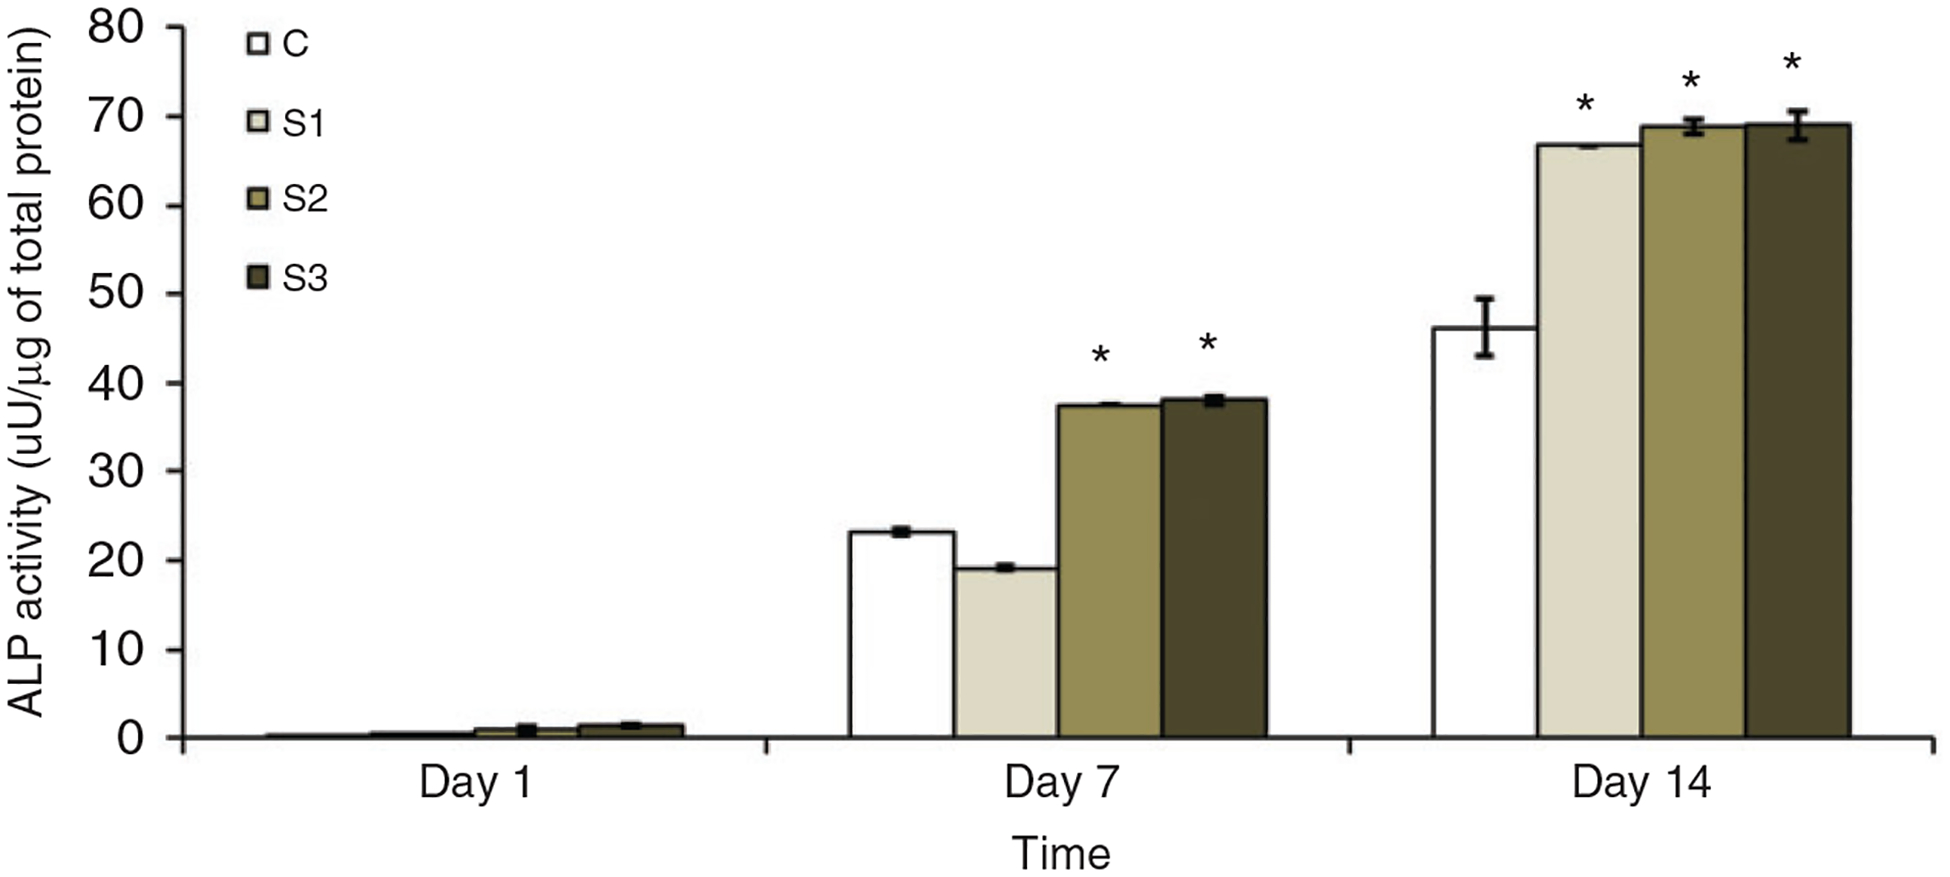
ALP activity of the microparticles normalized with the total protein amount at different days of culture. Apparently, the sample groups containing nSiO2 had significantly higher ALP activity during the whole study period.
Gene expression
The gene expression profile data are presented as a fold change in the expression of genes after normalization with the expression of GAPDH. The study was done for the expression of collagen 1 (Col 1), osteocalcin (OCN) and bone sialoprotein (BSP). Col 1 is an early marker of osteoblast differentiation and osteocalcin OCN is relatively expressed during the later stages of osteoblasts differentiation. Figure 8 shows the expression profile of different genes studied. It can be seen that the expression profile of different genes was better on day 14 compared to day 7 and higher on sample groups (S1, S2 and S3).
Figure 9(a) shows the expression profile of Col1 by the cells attached to different groups of microparticles on day 7 and 14. It can be seen that this gene was less expressed on sample groups on day 7 compared to C group. On day 14, however, its expression significantly increased on S2 with fold change increasing to 2.5 compared to around 1 in C groups. Also, compared to day 7, the fold change in S2 and S3 was significantly higher than that on day 14, whereas on C and S1 groups not much difference was observed at different days. In case of expression profile for OCN, it can be seen (Figure 9(b)) that the expression was significantly higher on sample groups S1 and S2 on day 14 in comparison to that in C group, whereas it decreased on S3. The fold change significantly increased on day 14 compared to day 7 on the sample groups S2 and S3, whereas on C group, it remained almost similar on both days. The expression profile in case of BSP on different sample groups at different days was not different statistically compared to C group (Figure 9(c)). A significant difference, however, was observed on day 14 on S1 and S2 compared to the expression on them on day 7. To sum up, the gene expression results show that the osteogenic differentiation of cells growing on the microparticles is affected by the addition of nSiO2 into them. The expression profile, however, seems to be depending on the concentration of nSiO2 as sample groups S1 and S2 were better than C groups, whereas S3 showed decreased expression for OCN and BSP.
Figure 9.
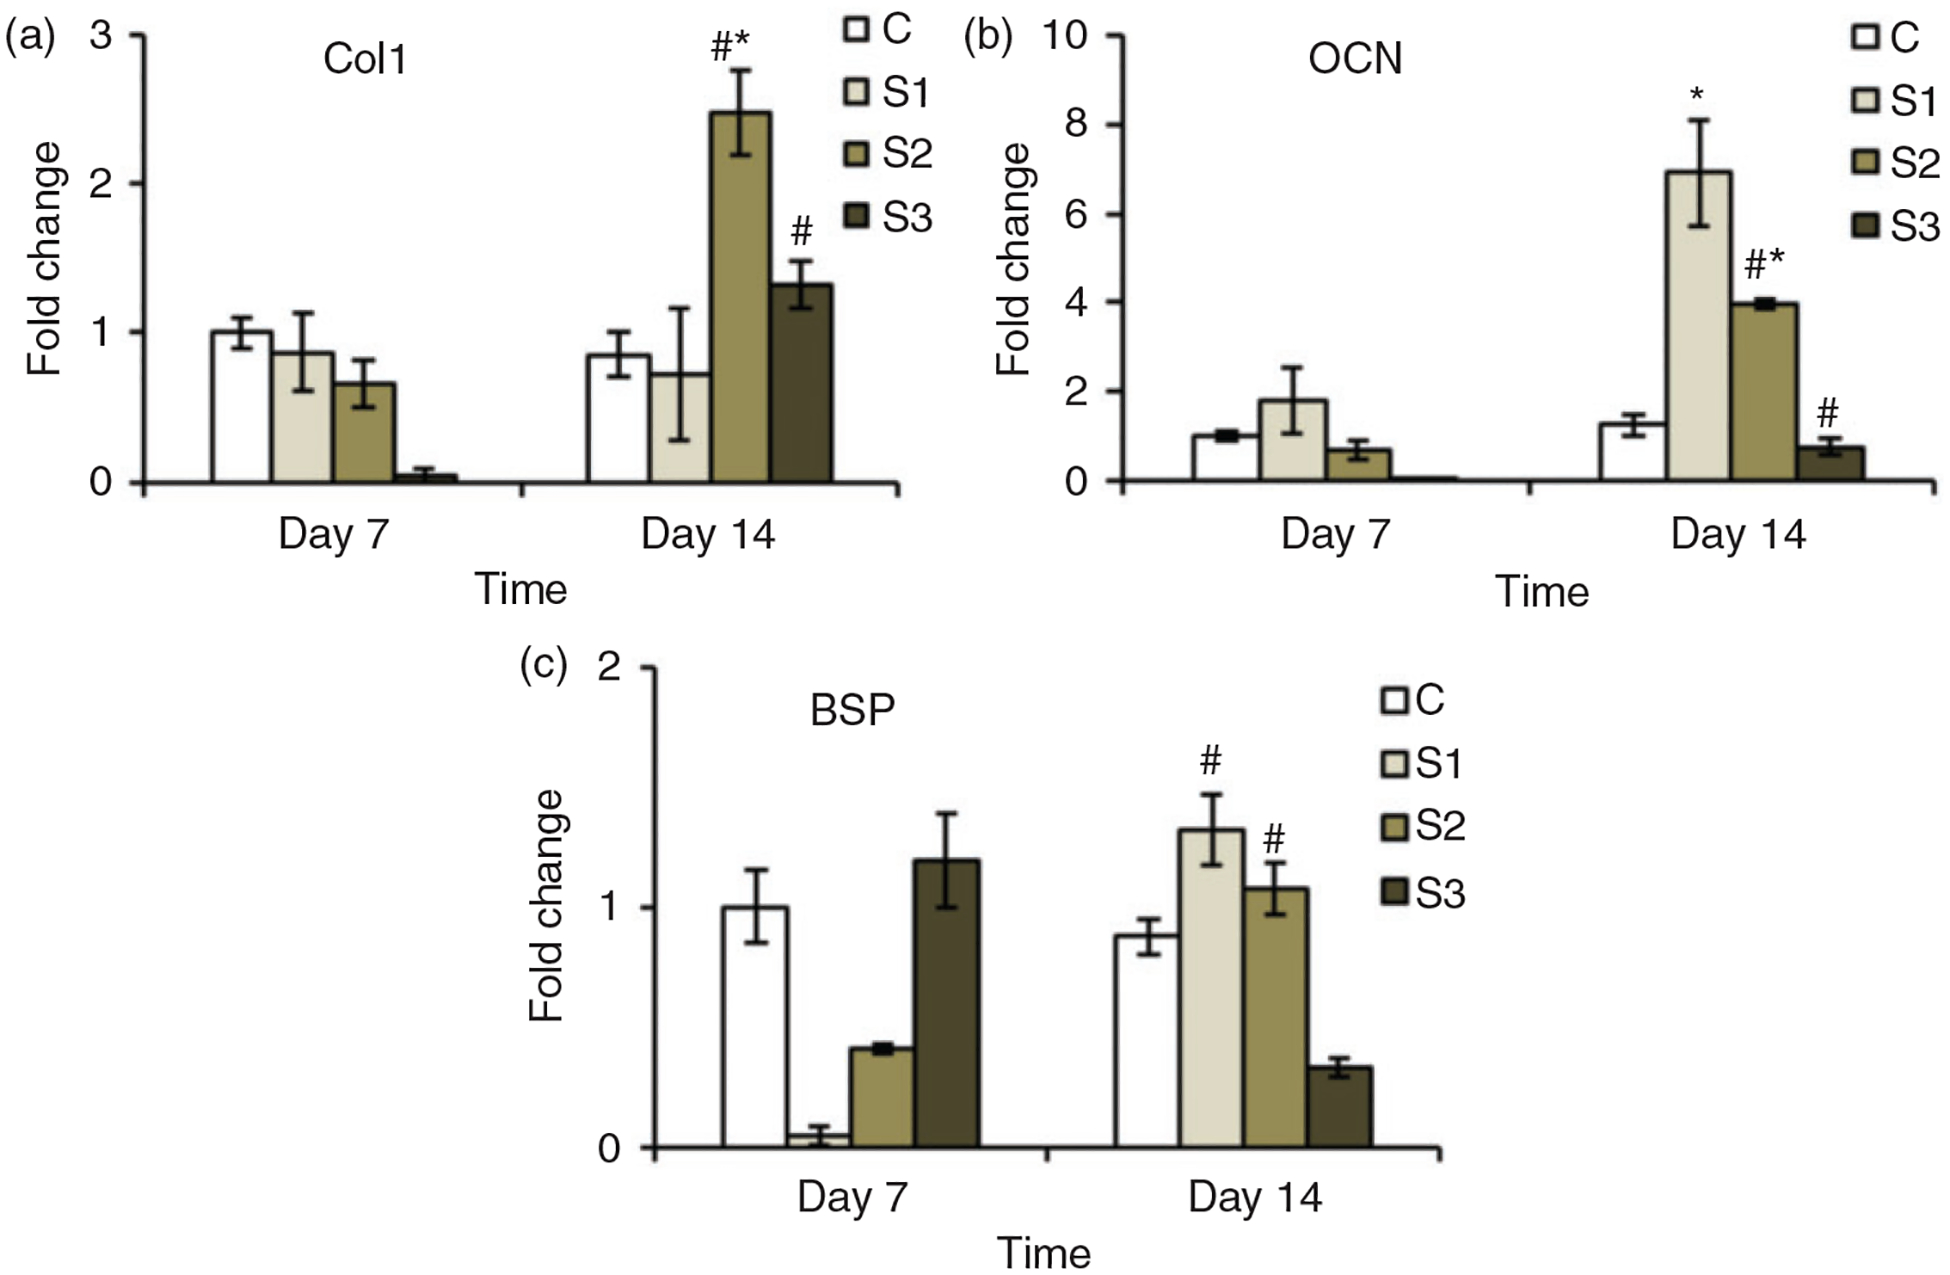
Expression profile for osteoblast specific genes over 14 days. The expression of different genes by the cells growing on the sample groups (S1, S2 and S3) was higher than that expressed by the cells growing on the control group (C). * represents the significant difference from the control group on same day and # represents significant difference for same group on different days.
Discussion
CS is one of the most used biopolymers in tissue regeneration application because of its wide availability, biodegradability and non-toxicity. The structural similarity of CS backbone to extracellular matrix components of skeletal tissues has drawn its interest more in bone and cartilage tissue regeneration. Furthermore, the amine groups in CS can be chemically modified to develop a rigid scaffold structures. Gluteraldehyde, genipin and TPP have been mostly used to develop a crosslinked CS scaffolds with genipin and TPP being more popular because of their non-toxic properties.19–21,30 Our laboratory has been long working on the development of microparticles-based scaffolds including TPP crosslinked CS and studying how these microparticles can be used for effective bone regeneration and growth factor delivery applications. The degradation of these microparticles is faster at slightly acidic pH condition and in the presence of lysozyme and mainly takes place through the hydrolysis of CS-TPP bond. At physiological pH, these microparticles are found to be more stable with slower degradation.22 We have been working to improve the osteogenic properties of these microparticles through the hybridization with inorganic materials or through the encapsulation of growth factors.22,24,31–33 In this study, we hybridized CS microparticles with nSiO2 to improve their response to preosteoblasts in terms of attachment, proliferation and differentiation into osteoblasts. nSiO2 was added to the microparticles at different concentrations to better understand the result. We also characterized these microparticles for nano-roughness to study how nSiO2 addition impacts the surface topography of microparticle.
The dispersion of nSiO2 into the CS solution was homogenous within 2 h of stirring for all concentrations of nSiO2. As the solution is dripped into TPP solution using syringe and needle to prepare the microparticles by coacervation technique, the homogenous dispersion of added inorganic materials in the polymer solution is important to prevent the clogging of needles. Besides, the homogenous dispersion of nanoparticles in polymer ensures the uniformity in the physical property of composite materials and hence achieves a favorable biological response. This is where silica-based nanoparticles having higher surface area become advantageous compared to calcium phosphate-based nanoparticles having comparatively lower surface area.34 The control group (C) without nSiO2 were light yellowish in color and sample groups (S1, S2 and S3) were white colored. SEM images of microparticle showed that they were spherical in shape with the size of sample groups slightly higher than control group. This could be due the presence of nSiO2 on the surface of the sample group microparticles. The shape of the microparticles is important especially if they are to be used as the injectable scaffolds in clinical settings. The spherical morphology is more advantageous as it allows for the easy injection using needles.35 The magnified SEM images showed that the surface of microparticle was non-porous but had rough appearance. The addition of nSiO2 had almost no effects on the surface micro-topography as high magnification images looked similar for all the groups. The proper incorporation of nSiO2 into CS microparticles was confirmed by the detection and quantification of elemental silicon (Si) along the surface using EDS as well as the presence Si-O-Si vibration peak on the FTIR spectrum.
The nano scale surface topography of the scaffolds has been studied to play a vital role on the cells function. It can be related with the natural extra-cellular matrix (ECM) environment where cells reside. Structurally, various components of ECM environment where cells reside and interact are all distributed in a nano scale. The cells on the surface with lower nano-roughness tend to produce the stress fibers faster than those growing on the surface with higher nano-roughness values, hence, showing higher proliferation on surface with lower nano-roughness values.36 It has been shown that the osteoblasts tend to grow and proliferate more on the surface with moderate to lower nano-topographical features.37,38 Taking these into consideration and given the nano sized silica powders being used, we assessed the impacts of nSiO2 addition on the surface nano-roughness of CS microparticles. AFM results showed that the nano-roughness of CS microparticles decreased due to the addition of nSiO2. The Rq values were lowered from C group to sample groups with Rq of S3 significantly lower than C group. This can be attributed to the higher surface area and hence better dispersion of nSiO2 on CS solution. The uniformly distributed nSiO2 along the surface of the microparticles might have reduced the base to peak height of the nano peaks thereby reducing the nano-roughness value.
CS scaffolds crosslinked with TPP are not toxic to the cells though it highly depends on the concentration of TPP being used. The higher concentration of TPP could be toxic to the cells.39 In this study, however, the concentration of TPP (0.2 g/ml) used was found to be non-toxic to the cells. The studies assessing the biocompatibility of nSiO2 have different views mostly based on the size, shape, concentration, fabrication techniques and the target cell types. The smaller sized silica nanoparticles are considered to show cytotoxicity potentially due to the ingestion of these particles by the cells.40 Recent studies, however, are able to establish the biocompatible and more importantly osteogenic potential of silica nanoparticles brought about by the ingestion of these particles by the osteoblasts.41,42 Most of the studies discussed here are based on the use of only silica nanoparticles. In this study, however, we incorporated nSiO2 into CS microparticles and hypothesized this hybridization will improve the osteogenic potential of the CS microparticles. Our results showed that all groups of microparticle (C, S1, S2 and S3) were not causing any cytotoxicity as indicated by the WST-1 assay and fluorescence images. DNA quantification showed the higher proliferation of cells on sample groups S2 and S3 compared to C group at different days. The in vitro study was further done to assess the ability of these microparticles to induce the osteoblasts differentiation. The extracellular matrix maturation and mineralization are two terminal stages of osteoblasts differentiation characterized by the higher expression of ALP during maturation followed by the increased expression of OCN and BSP during mineralization.43 We evaluated the intracellular ALP activity of the cells attaching and proliferating on the surface of the microparticles. The expression was significantly higher for cells growing on all sample groups (S1, S2 and S3) compared to C groups without nSiO2 on day 14. Gene expression studies showed that the expression of OCN and COL1 was significantly higher on S1 and S2 at day 14 compared to C group. BSP expression had no statistical difference on different groups though it was higher on S1 and S2 at day 14. The improved response of the pre-osteoblasts growing on the surface of the microparticle containing nSiO2 can be ascribed to the variation in the surface topography as well as the presence of Si on them. The Si incorporated scaffolds are reported to stimulate the secretion of osteoinductive growth factors which subsequently promote the proliferation and differentiation of osteoblasts.44 The lower expression of OCN and BSP on S3, however, shows that the ability of nSiO2-CS composite microparticles to induce osteogenic differentiation depends on the concentration of nSiO2 used. The lower expression of these genes was observed with higher silica concentration,45,46 including several other osteogenic markers.47 Given the similarity in Rq values between S1, S2, and S3 and taking, the higher expression of OCN and BSP on S1 and S2 compared to C and S3 groups, into consideration, we believe the concentration of nSiO2 as a major factor controlling the osteogenic property of the microparticles. Furthermore, studies have shown that the dependency of osteogenic properties on surface topography is not completely related to the roughness parameter such as Rq, as it does not account for the lateral distribution of topographic features which is considered to be equally important.48 Taken together, nSiO2 incorporated CS-TPP microparticles can be considered as a suitable scaffold material for effective bone regeneration. More study may be required to effectively inject these microparticles and observe their ability to induce bone formation in animal models.
Conclusions
In this study, CS-TPP microparticles with improved osteogenic properties were developed by the hybridization with nSiO2. The microparticles were prepared by simple coacervation technique and the size of these spherical microparticles ranged from 500 to 700 μm which can be considered suitable for injection. We found that the addition of nano-silica lowers the nano-roughness of the microparticles while improving the growth and proliferation of osteoblasts along the surface. Furthermore, the hybridization with nano-silica provided the microparticles with the ability to initiate osteoblasts differentiation evident through the ALP expression and osteoblasts specific gene expression profile. These nano-silica hybridized CS microparticles can thus be considered as a suitable injectable scaffold for improved bone regeneration applications.
Funding
The author(s) disclosed receipt of the following financial support for the research, authorship, and/or publication of this article: We are grateful to National Institute of Health (NIH) grant number R01DE023356 for support. This work would not have been possible without their financial support.
Footnotes
Declaration of Conflicting Interests
The author(s) declared no potential conflicts of interest with respect to the research, authorship, and/or publication of this article.
References
- 1.Chang B, Ahuja N, Ma C, et al. Injectable scaffolds: preparation and application in dental and craniofacial regeneration. Mater Sci Eng 2017; 111: 1–26. [DOI] [PMC free article] [PubMed] [Google Scholar]
- 2.Moreau JL and Xu HHK. Mesenchymal stem cell proliferation and differentiation on an injectable calcium phosphate – chitosan composite scaffold. Biomaterials 2009; 30: 2675–2682. [DOI] [PMC free article] [PubMed] [Google Scholar]
- 3.Babo PS, Santo VE, Gomes ME, et al. Development of an injectable calcium phosphate/hyaluronic acid microparticles system for platelet lysate sustained delivery aiming bone regeneration. Macromol Biosci 2016; 16: 1662–1677. [DOI] [PubMed] [Google Scholar]
- 4.Kretlow JD, Young S, Klouda L, et al. Injectable biomaterials for regenerating complex craniofacial tissues. Adva Mater 2009; 21: 3368–3393. [DOI] [PMC free article] [PubMed] [Google Scholar]
- 5.Jiang T, Deng M, James R, et al. Micro- and nanofabrication of chitosan structures for regenerative engineering. Acta Biomater 2014; 10: 1632–1645. [DOI] [PubMed] [Google Scholar]
- 6.Dreifke MB, Ebraheim NA and Jayasuriya AC. Investigation of potential injectable polymeric biomaterials for bone regeneration. J Biomed Mater Res Part A 2013; 101A: 2436–2447. [DOI] [PMC free article] [PubMed] [Google Scholar]
- 7.Tan H and Marra KG. Injectable, biodegradable hydrogels for tissue engineering applications. Materials 2010; 3: 1746. [Google Scholar]
- 8.Zhang Z Injectable biomaterials for stem cell delivery and tissue regeneration. Exp Opin Biol Ther 2017; 17: 49–62. [DOI] [PubMed] [Google Scholar]
- 9.Gaharwar AK, Peppas NA and Khademhosseini A. Nanocomposite hydrogels for biomedical applications. Biotechnol Bioeng 2014; 111: 441–453. [DOI] [PMC free article] [PubMed] [Google Scholar]
- 10.Chen Z, Zhang X, Kang L, et al. Recent progress in injectable bone repair materials research. Front Mater Sci 2015; 9: 332–345. [Google Scholar]
- 11.Cruz DM, Ivirico JL, Gomes MM, et al. Chitosan microparticles as injectable scaffolds for tissue engineering. J Tissue Eng Regenerat Med 2008; 2: 378–380. [DOI] [PubMed] [Google Scholar]
- 12.Shen S, Fu D, Xu F, et al. The design and features of apatite-coated chitosan microspheres as injectable scaffold for bone tissue engineering. Biomed Mater 2013; 8: 025007. [DOI] [PubMed] [Google Scholar]
- 13.Custódio CA, Cerqueira MT, Marques AP, et al. Cell selective chitosan microparticles as injectable cell carriers for tissue regeneration. Biomaterials 2015; 43: 23–31. [DOI] [PubMed] [Google Scholar]
- 14.Hu X, Zhou J, Zhang N, et al. Preparation and properties of an injectable scaffold of poly(lactic-co-glycolic acid) microparticles/chitosan hydrogel. J Mech Behav Biomed Mater 2008; 1: 352–359. [DOI] [PubMed] [Google Scholar]
- 15.Azuma K, Izumi R, Osaki T, et al. Chitin, chitosan, and its derivatives for wound healing: old and new materials. J Funct Biomater 2015; 6: 104–142. [DOI] [PMC free article] [PubMed] [Google Scholar] [Retracted]
- 16.Dai T, Tanaka M, Huang Y-Y, et al. Chitosan preparations for wounds and burns: antimicrobial and wound-healing effects. Exp Rev Anti Infect Ther 2011; 9: 857–879. [DOI] [PMC free article] [PubMed] [Google Scholar]
- 17.Karagozlu MZ and Kim SK. Anticancer effects of chitin and chitosan derivatives. Adv Food Nutr Res 2014; 72: 215–225. [DOI] [PubMed] [Google Scholar]
- 18.Raftery R, O’Brien FJ and Cryan SA. Chitosan for gene delivery and orthopedic tissue engineering applications. Molecules 2013; 18: 5611–5647. [DOI] [PMC free article] [PubMed] [Google Scholar]
- 19.Croisier F and Jérôme C. Chitosan-based biomaterials for tissue engineering. Eur Polym J 2013; 49: 780–792. [Google Scholar]
- 20.Muzzarelli RAA. Genipin-crosslinked chitosan hydrogels as biomedical and pharmaceutical aids. Carbohyd Polym 2009; 77: 1–9. [Google Scholar]
- 21.Bhumkar DR and Pokharkar VB. Studies on effect of pH on cross-linking of chitosan with sodium tripolyphosphate: a technical note. AAPS Pharm Sci Tech 2006; 7: E138–E143. [DOI] [PMC free article] [PubMed] [Google Scholar]
- 22.Mantripragada VP and Jayasuriya AC. IGF-1 release kinetics from chitosan microparticles fabricated using environmentally benign conditions. Mater Sci Eng C 2014; 42: 506–516. [DOI] [PMC free article] [PubMed] [Google Scholar]
- 23.Jayasuriya AC and Bhat A. Mesenchymal stem cell function on hybrid organic/inorganic microparticles in vitro. J Tissue Eng Regenerat Med 2010; 4: 340–348. [DOI] [PMC free article] [PubMed] [Google Scholar]
- 24.Jayasuriya AC and Bhat A. Fabrication and characterization of novel hybrid organic/inorganic microparticles to apply in bone regeneration. J Biomed Mater Res Part A 2010; 93A: 1280–1288. [DOI] [PubMed] [Google Scholar]
- 25.Wu C and Chang J. Mesoporous bioactive glasses: structure characteristics, drug/growth factor delivery and bone regeneration application. Interf Focus 2012; 2: 292–306. [DOI] [PMC free article] [PubMed] [Google Scholar]
- 26.Rahaman MN, Day DE, Bal BS, et al. Bioactive glass in tissue engineering. Acta Biomater 2011; 7: 2355–2373. [DOI] [PMC free article] [PubMed] [Google Scholar]
- 27.Khoshakhlagh P, Rabiee SM, Kiaee G, et al. Development and characterization of a bioglass/chitosan composite as an injectable bone substitute. Carbohyd Polym 2017; 157: 1261–1271. [DOI] [PubMed] [Google Scholar]
- 28.Ravarian R, Craft M and Dehghani F. Enhancing the biological activity of chitosan and controlling the degradation by nanoscale interaction with bioglass. J Biomed Mater Res Part A 2015; 103: 2898–2908. [DOI] [PubMed] [Google Scholar]
- 29.Sowjanya JA, Singh J, Mohita T, et al. Biocomposite scaffolds containing chitosan/alginate/nano-silica for bone tissue engineering. Colloids Surf B 2013; 109: 294–300. [DOI] [PubMed] [Google Scholar]
- 30.Shimojo AAM, Galdames SEM, Perez AGM, et al. In vitro performance of injectable chitosan-tripolyphosphate scaffolds combined with platelet-rich plasma. Tissue Eng Regenerat Med 2016; 13: 21–30. [DOI] [PMC free article] [PubMed] [Google Scholar]
- 31.Mantripragada VP and Jayasuriya AC. Bone regeneration using injectable BMP-7 loaded chitosan microparticles in rat femoral defect. Mater Sci Eng C 2016; 63: 596–608. [DOI] [PMC free article] [PubMed] [Google Scholar]
- 32.Uswatta SP, Okeke IU and Jayasuriya AC. Injectable porous nano-hydroxyapatite/chitosan/tripolyphosphate scaffolds with improved compressive strength for bone regeneration. Mater Sci Eng C 2016; 69: 505–512. [DOI] [PMC free article] [PubMed] [Google Scholar]
- 33.Gaihre B and Jayasuriya AC. Fabrication and characterization of carboxymethyl cellulose novel microparticles for bone tissue engineering. Mater Sci Eng C 2016; 69: 733–743. [DOI] [PMC free article] [PubMed] [Google Scholar]
- 34.Ba M, Zhang Z and Qi Y. The Dispersion tolerance of micro/nano particle in polydimethylsiloxane and its influence on the properties of fouling release coatings based on polydimethylsiloxane. Coatings 2017; 7: 107. [Google Scholar]
- 35.Saralidze K, Koole LH and Knetsch MLW. Polymeric microspheres for medical applications. Materials 2010; 3: 3537. [Google Scholar]
- 36.Dalby MJ, Riehle MO, Johnstone H, et al. In vitro reaction of endothelial cells to polymer demixed nanotopography. Biomaterials 2002; 23: 2945–2954. [DOI] [PubMed] [Google Scholar]
- 37.Luo C, Li L, Li J, et al. Modulating cellular behaviors through surface nanoroughness. J Mater Chem 2012; 22: 15654–15664. [Google Scholar]
- 38.Lipski AM, Pino CJ, Haselton FR, et al. The effect of silica nanoparticle-modified surfaces on cell morphology, cytoskeletal organization and function. Biomaterials 2008; 29: 3836–3846. [DOI] [PMC free article] [PubMed] [Google Scholar]
- 39.Pati F, Adhikari B and Dhara S. Development of chitosan-tripolyphosphate non-woven fibrous scaffolds for tissue engineering application. J Mater Sci Mater Med 2012; 23: 1085–1096. [DOI] [PubMed] [Google Scholar]
- 40.Napierska D, Thomassen LC, Lison D, et al. The nano-silica hazard: another variable entity. Particle Fibre Toxicol 2010; 7: 39. [DOI] [PMC free article] [PubMed] [Google Scholar]
- 41.Ha S-W, Weitzmann MN and Beck GR. Bioactive silica nanoparticles promote osteoblast differentiation through stimulation of autophagy and direct association with LC3 and p62. ACS Nano 2014; 8: 5898–910. [DOI] [PMC free article] [PubMed] [Google Scholar]
- 42.Beck GR Jr, Ha S-W, Camalier CE, et al. Bioactive silica-based nanoparticles stimulate bone-forming osteoblasts, suppress bone-resorbing osteoclasts, and enhance bone mineral density in vivo. Nanomedicine 2012; 8: 793–803. [DOI] [PMC free article] [PubMed] [Google Scholar]
- 43.Barradas AM, Yuan H, van Blitterswijk CA, et al. Osteoinductive biomaterials: current knowledge of properties, experimental models and biological mechanisms. Eur Cells Mater 2011; 21: 407–429; discussion 29. [DOI] [PubMed] [Google Scholar]
- 44.Bai L, Wu R, Wang Y, et al. Osteogenic and angiogenic activities of silicon-incorporated TiO2 nanotube arrays. J Mater Chem B 2016; 4: 5548–5559. [DOI] [PubMed] [Google Scholar]
- 45.Amorim S, Martins A, Neves NM, et al. Hyaluronic acid/poly-l-lysine bilayered silica nanoparticles enhance the osteogenic differentiation of human mesenchymal stem cells. J Mater Chem B 2014; 2: 6939–6946. [DOI] [PubMed] [Google Scholar]
- 46.Kaliaraj R, Gandhi S, Sundaramurthi D, et al. A biomimetic mesoporous silica–polymer composite scaffold for bone tissue engineering. J Porous Mater 2017. DOI: 10.1007/s10934-017-0450-x. [DOI] [Google Scholar]
- 47.Xing Y, Yuanyuan L, Xujie L, et al. The stimulatory effect of silica nanoparticles on osteogenic differentiation of human mesenchymal stem cells. Biomed Mater 2017; 12: 015001. [DOI] [PubMed] [Google Scholar]
- 48.Washburn NR, Yamada KM, Simon CG Jr, et al. High-throughput investigation of osteoblast response to polymer crystallinity: influence of nanometer-scale roughness on proliferation. Biomaterials 2004; 25: 1215–1224. [DOI] [PubMed] [Google Scholar]


