Short abstract
In common practice, hearing aids are fitted by a clinician who measures an audiogram and uses it to generate prescriptive gain and output targets. This report describes an alternative method where users select their own signal processing parameters using an interface consisting of two wheels that optimally map to simultaneous control of gain and compression in each frequency band. The real-world performance of this approach was evaluated via a take-home field trial. Participants with hearing loss were fitted using clinical best practices (audiogram, fit to target, real-ear verification, and subsequent fine tuning). Then, in their everyday lives over the course of a month, participants either selected their own parameters using this new interface (Self group; n = 38) or used the parameters selected by the clinician with limited control (Audiologist Best Practices Group; n = 37). On average, the gain selected by the Self group was within 1.8 dB overall and 5.6 dB per band of that selected by the audiologist. Participants in the Self group reported better sound quality than did those in the Audiologist Best Practices group. In blind sound quality comparisons conducted in the field, participants in the Self group slightly preferred the parameters they selected over those selected by the clinician. Finally, there were no differences between groups in terms of standard clinical measures of hearing aid benefit or speech perception in noise. Overall, the results indicate that it is possible for users to select effective amplification parameters by themselves using a simple interface that maps to key hearing aid signal processing parameters.
Keywords: hearing aids, self-fitting hearing aids, over-the-counter hearing aids, hearing aid benefit
Introduction
One of the most critical aspects of hearing aid fitting is selection of the signal processing parameters that are appropriate for the user. In current practice, the initial fitting is done by a hearing care professional using an algorithmic method for selecting parameters based primarily on the user’s audiogram. Several decades’ worth of research has culminated in two major research-based audiogram fitting methods (Desired Sensation Level: Scollie et al., 2005 and National Acoustics Laboratory [NAL]: Keidser, Dillon, Flax, Ching, & Brewer, 2011) as well as proprietary methods implemented in the fitting software of major hearing aid manufacturers. In contrast, the new category of over-the-counter (OTC) hearing aids will, by definition, be fitted by the user without required participation of a hearing care professional. OTC hearing aids must therefore include something new: A validated self-fitting method that involves self- or automatic-selection of signal processing parameters with or without an automated evaluation of hearing status. Importantly, the Federal OTC Hearing Aid Act of 2017 does not require a professional evaluation of the user’s hearing status. Although it is possible that self-fitting could require the user to self-administer an audiogram, this report will focus on self-fitting methods that do not include an audiogram. In this context, the term “self-fit” will refer to the process of user selection of signal processing parameters without obtaining or estimating an audiogram.
The simplest class of self-fit methods has the user select one of a small number of preprogrammed “presets.” In these cases, a preset is a full set of wide dynamic range compression (WDRC) parameters. The user can select a preset and perhaps adjust an overall volume (broadband gain) control. This method can be more or less successful depending on how well-matched the presets are to the user population. Perhaps the most comprehensive examination of this approach comes from the recent clinical trial reported by Humes et al. (2017). In that report, the self-fitting method consisted of 55 users selecting from among three identical hearing aids, each with a different preset. After participants wore the hearing aids for a 1-month trial period, the selected preset hearing aids were shown to be equivalent to professional audiogram-based custom fitting of the same hearing aids in terms of several objective and subjective measures of benefit. In contrast, Leavitt, Bentler, and Flexer (2018) reported case studies of six participants for whom speech testing was done with the same hearing aid both professionally fitted and with a single preset identical to the highest gain preset used in the Humes et al.’s study. Leavitt et al. reported superior results with the professional fit. This result likely occurred because the preset response would have provided substantially lower-than-optimal gain for their participants, who on average had hearing losses 24 dB more severe than the participants in the Humes et al.’s study. Collectively, these investigations indicate that the success of preset-based self-fitting depends on how well the presets match the gain requirements of the user population. Self-fitting approaches that explore a wider set of WDRC parameters could accommodate a wider range of hearing losses.
A few, more complex, self-fit approaches show promise. Although there have been many proposed methods of user-driven fine tuning (e.g., Abrams, Edwards, Valentine, & Fitz, 2011; Dreschler, Keidser, Convery, & Dillon, 2008; Kuk & Pape, 1992; Moore, Marriage, Alcántara, & Glasberg, 2005, Boymans & Dreschler, 2012), far fewer have let the user control the entire fit. One recent such approach, the “Goldilocks” method (Boothroyd & Mackersie, 2017; Mackersie, Boothroyd, & Lithgow, 2019) gives users direct control of broadband, low-, and high-frequency gain. This approach appears to be reasonably fast (65 seconds) and reliable but thus far has only focused on linear (noncompressive) gain. This approach has also not been evaluated in real-world trials. In contrast, an earlier method (EarTuner by Microsound, Moore et al., 2005) did involve a real-world trial. This self-fit method included several stages beginning with loudness comfort estimates, followed by speech perception tests, then fine tuning of gains, and finally vent size selection. Users in the field trial were also fit with an alternative method (Camadapt: Moore et al., 2005) that used the audiogram-derived prescription as a starting point. After several weeks’ experience switching between both parameter sets in their daily lives, 16 first-time hearing aid users with mild/moderate hearing loss were satisfied with both fittings and achieved roughly equal benefit with both. Several other methods have been commercialized, but evaluations have not been published. Taken together, the limited evidence suggests that these more complex self-fit methods can yield successful outcomes and that they might be able to accommodate a wider range of losses than presets. This idea is further supported by the recent laboratory report (Brody, Wu, & Stangl, 2018), where performance using personal sound amplification products (PSAPs) with presets was substantially inferior to performance with a professionally fitted hearing aid, but that performance difference largely disappeared when the listener used a PSAP that allowed user adjustment of low-, mid-, and high-frequency gain.
The weight of evidence so far suggests that although preset hearing aids can be effective as a self-fit method if their settings are matched well with the intended user population, methods that allow the user to explore a wider range of parameters are likely to yield better results and can result in outcomes comparable to those from professional fittings. All the studies completed so far have either relied on laboratory measures of hearing aid outcome with no field use or laboratory and objective measures of hearing aid outcome at the end of a period of field use. None have allowed users to make multiple adjustments or sound quality judgments while in the field. The study reported here builds on previous work in three important ways: (a) participants used a self-fitting method in which a simple user interface (UI) allowed them to move quickly through a large number of data-driven candidate parameter sets, (b) they were able to adjust parameters frequently during a month-long period of use in the field, and (c) they completed real-time blinded comparisons in the field between their self-selected parameters and those that had been selected for them during a professional fitting session using audiogram-based audiologist-provided best practices. To isolate the effects of the fitting method, all users used the same prototype hearing aid but differed in the fitting method.
Method
The study was designed with two main objectives in mind: (a) obtain within-subjects preference data in the field from participants making in-the-moment, blinded comparisons of their self-selected settings with those that had been selected for them previously by an audiologist and (b) obtain between-subjects data on perceived benefit after a month of trial use in a group using a hearing aid self-fitted by the user versus a group using the same hearing aid when professionally fitted. All individuals participated in three audiology clinic visits (1—First Fit, 2—Fine-Tuning, and 3—Assessment) as well as several weeks of prototype hearing use in the field (see Figure 1 for an illustration of the experiment timeline). All participants were given the same treatment during the First-Fit and Fine-Tuning sessions. These first two sessions were designed to replicate the current audiological best practices for fitting hearing aid signal processing parameters for gain and WDRC: initial audiological evaluation and fitting using speech-like signals as well as fine tuning after real-world experience with the hearing aids (Valente, 2006). All sessions were conducted by one of seven certified and licensed audiologists, each of whom had extensive experience fitting hearing aids, at the Northwestern University Center for Audiology, Speech, Language and Learning (NUCASLL) in Evanston, IL.
Figure 1.
Experiment timeline. The between-group design enabled comparison between Audiology Best Practices (ABP) and Self-Fitting (Self) Groups.
At the end of the Fine-Tuning session, participants were assigned on an alternating basis to either the Audiologist Best Practices (ABP) group or the Self-Fitted (Self) group. The ABP group continued into the multiweek field use of the prototype hearing aid with the settings determined by the audiologist, along with a mobile app interface that provided adjustment capability typical of a conventional hearing aid: a limited range (±8 dB) volume control and a “mode” switch (described later). In contrast, in the Self group, the audiologist-determined settings were disregarded after the Fine-Tuning session. Instead, these participants were given a new interface (described later) that allowed the participant to adjust across a broad range of WDRC parameters in each of 12 compression bands. The initial position of the interface corresponded to 0 dB real-ear insertion gain (REIG) for all participants in the Self group. After a participant’s initial adjustment, each subsequent starting position corresponded to the participant’s previous adjustment. For both groups, several measures were collected during the multiweek field use including selected gain values, sound quality assessments, and paired comparisons between self- and audiologist-selected settings.
Finally, both groups returned to the clinic at the end of the field use period to complete a speech-in-noise test as well as a series of questionnaires assessing benefit associated with the hearing aid.
Prototype Hearing Aid
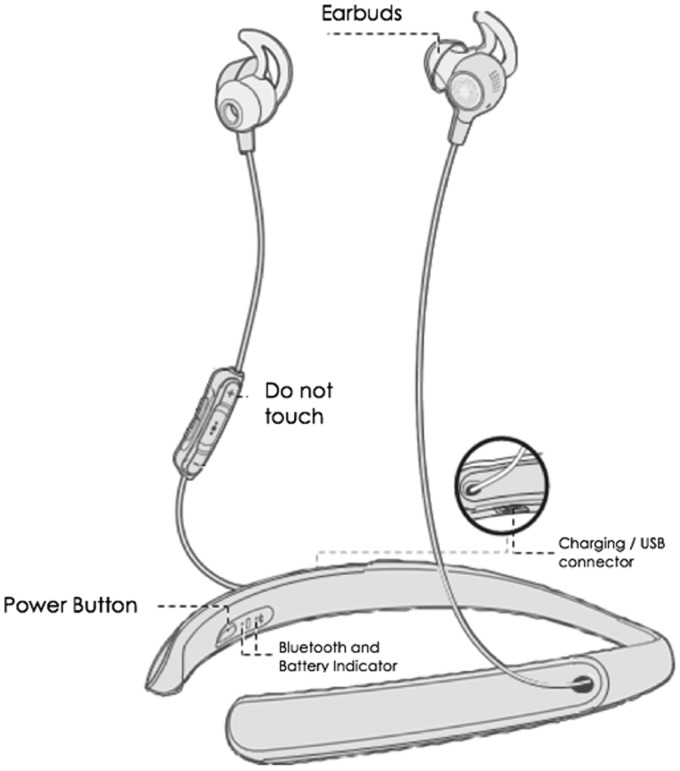
The Bose prototype hearing aid (Figure 2) used in this experiment functioned like a wireless binaural air-conduction hearing aid. It incorporated microphones on each of the earbuds and a flexible neckband housing rechargeable batteries and electronic components. The earbuds are designed to seal comfortably against the entrance to the ear canal. Signal processing parameters were selected wirelessly via Bluetooth using an Apple iPod Touch. All on-device buttons were disabled except the power button, so the participant could only make adjustments via a mobile app. The app also supported in-the-field data collection.
Figure 2.
Bose prototype hearing aid. All participants wore this device throughout the experiment.
Hearing aid signal processing included 12-channel WDRC with compression threshold fixed at speech-equivalent 52 dB SPL. Additional features included feedback cancellation, steady-state noise reduction, impulse noise control, wind noise reduction, active noise cancellation, and user-controllable directivity.
Electroacoustic characteristics were similar to those of a high-quality conventional hearing aid. As measured according to ANSI/CTA 2051-2017, frequency response bandwidth was <200 to >8000 Hz, maximum acoustic output was 115 dB SPL, and equivalent input noise level was 26 dB SPL.
Mobile App: Self-Fitting Group
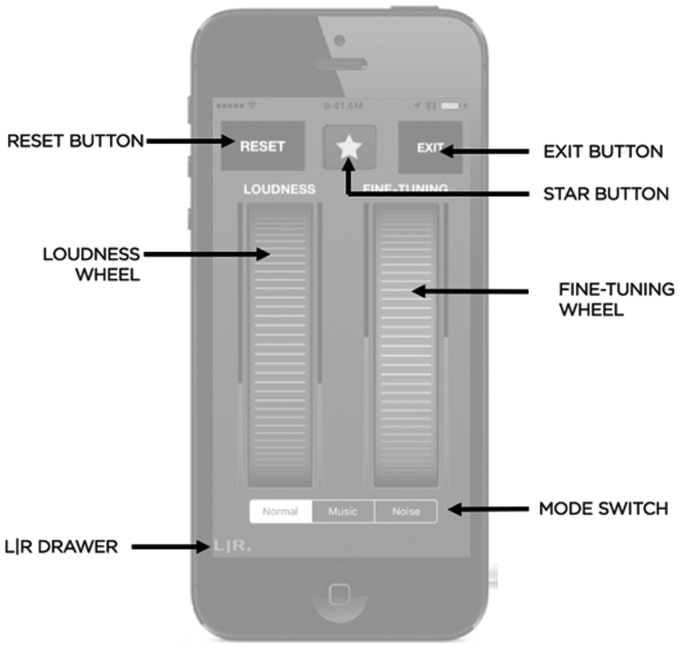
The prototype hearing aid was controlled by a custom mobile app that allowed users to select their WDRC parameters using two on-screen wheels that represented dimension-reduced controllers (DRCs). These controllers reduced several dimensions of simultaneous parameter adjustments in all frequency bands to two adjustable wheels on the UI. The two DRCs were designed to approximate the two major stages of clinical hearing aid fitting: fitting to target (Loudness Wheel) and clinican-driven fine tuning (Fine-Tuning Wheel) (see Figure 3).
Figure 3.
The mobile app home screen for the Self group.
Loudness Wheel
The Loudness DRC simultaneously adjusted the gain values, compression ratios, and output limiter thresholds in each of the 12 frequency bands. The mapping from controller to parameter was designed to approximate the fit-to-prescriptive-target gains for typical hearing losses. For each of 36 representative audiograms (Centers for Disease Control and Prevention, 2004; Ciletti & Flamme, 2008), a full set of prescriptive WDRC target gains (for quiet, medium, and loud inputs) was computed. A principal components analysis was performed on those gains. The resulting gains were mapped to the Loudness DRC by fitting a polynomial to the representative audiograms in the space of the first two components. Example gains for three points on the Loudness DRC are plotted in Figure 4.
Figure 4.
Example insertion gain targets for three loudness wheel positions. The REIG is plotted as a function of frequency for quiet (50 dB SPL), medium (65 dB SPL), and loud (80 dB SPL) overall speech input levels. The REIG values are plotted separately for illustrative low (left panel), mid (middle panel), and high (right panel) “Loudness” wheel positions. For each of these plots, the “Fine-Tuning” wheel is set to zero. REIG is expressed as the quantity that would be observed for a user with average head, torso, and ear acoustics. REIG = real-ear insertion gain.
Fine-Tuning Wheel
The Fine-Tuning DRC controlled the degree of spectral tilt by applying an additional adjustment to the gain values in each of the 12 bands. The mapping from controller to parameter was designed to approximate some of the typical adjustments that occur during clinician-driven fine tuning. Indeed, some of the most common user complaints can be mitigated by adjusting the spectral tilt (Jenstad, Van Tasell, & Ewert, 2003). The specific form of that tilt was derived by applying a principal components analysis to a set of weighting functions that corresponded to common complaint terms (Sabin, Hardies, Marrone, & Dhar, 2011). The “Fine-Tuning” control simply applied a scalar ranging ±20 to the first component (see Figure 5). Note that increases to high-frequency gains also resulted in decreases to low-frequency gains (and vice versa). Overall, across the entire range of Loudness and Fine-Tuning settings, the gain in each band was limited to 36 dB REIG.
Figure 5.
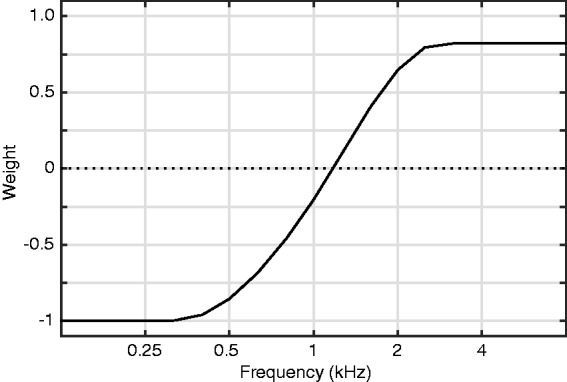
The seed function used to compute the Fine-Tuning gains. The user adjusted a “Fine Tuning” wheel that applied a multiplier in range of ±20 to this function. The resulting gains were added to those selected by the “Loudness” wheel.
Other features of the interface allowed the user to change the loudness balance between left and right ears and to switch among three modes. The balance between left and right ear was controlled with a slider that popped up when the listener pressed the L|R button (Figure 3, bottom left). The slider created an equal and opposite offset between the two ears in the dimension-reduced space. For instance, a L/R balance value of 5 would add five points on the right ear’s loudness wheel and would subtract five points from the left ear’s loudness wheel. The modes control let the user enable or disable directional microphones only: In the “Normal” and “Music” modes, the microphones were programmed to be omnidirectional. In the “Noise” setting, the microphones were programmed to be directional. The hearing assistance in both ears of the device was always active during any adjustment. Pressing the Reset button returned the participant to the wheel positions that had been in use during the previous controller adjustment. The Star Button was used to record participant data; its function is described in the following section.
Mobile App: ABP Group
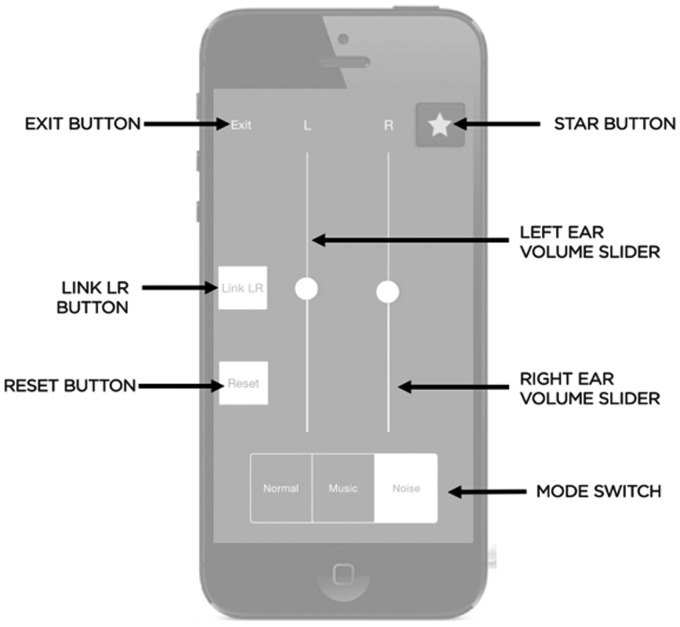
The app home screen for participants in the ABP group (Figure 6) was designed to provide a degree of adjustment that is similar to that provided by a typical Bluetooth-enabled professionally fit hearing aid. The major feature of this screen is the volume sliders, which provided an additional overall gain range of ±8 dB beyond the gain set by the audiologist during the Fine-Tuning session. The volume could be adjusted separately for each ear, or the L and R controls could be linked. The Modes switch allowed users to select among three programs that were designed to approximate how hearing aid manufacturers set noise and music programs. In “Normal” mode, the WDRC parameters were those selected by the audiologist and the microphones were programmed to be omnidirectional. In “Music” mode, the gain in bands below 750 Hz was increased by 5 dB in both ears relative to Normal mode. In “Noise” mode, the compression ratios in bands >1 kHz increased by 0.5 in both ears relative to Normal mode, and the microphones were programmed to be directional. The Reset button returned the volume sliders to 0 dB and the Mode switch to “normal,” effectively returning the hearing aid to the audiologist-selected settings. The Star Button was used to record participant data; its function is described in detail in the following section.
Figure 6.
The mobile app home screen for the ABP group.
Participants
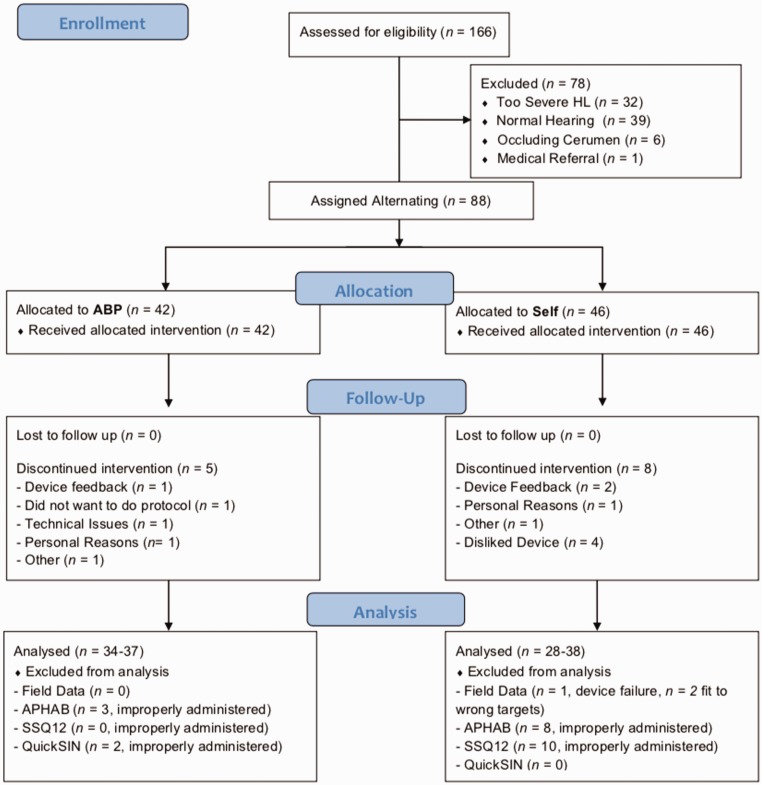
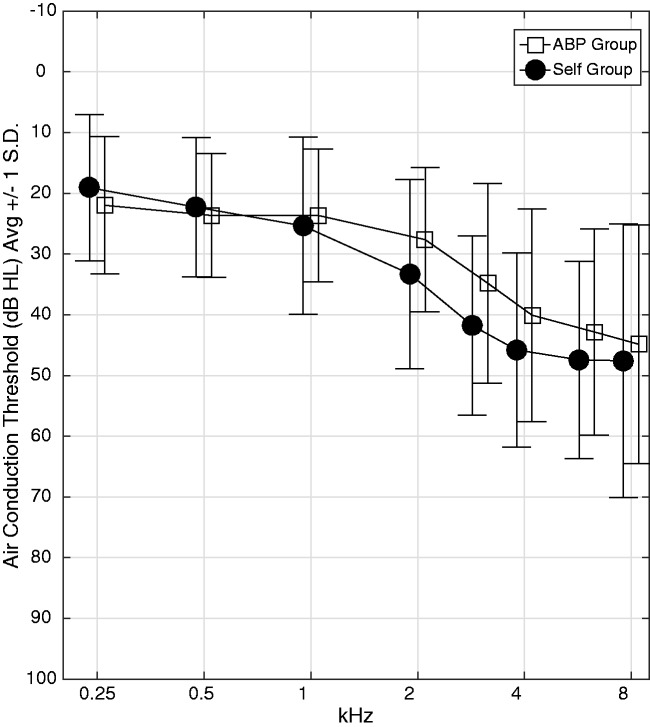
To be eligible for this study, the participants had to be adults (≥18 years old) with self-perceived difficulty hearing. Listeners were recruited via a variety of local advertisements as well as a professional recruiting service. During recruitment, listeners were asked if they had trouble hearing in noise (if “no” they were excluded). They also had to describe their perceived hearing loss on a 4-point scale (no trouble, a little trouble, a lot of trouble, and cannot hear). Listeners at the two extremes were excluded. Listeners with appropriate responses were invited into the clinic to be assessed for eligibility. The flow of potential listeners through the experimental protocol is displayed as a CONSORT diagram (Figure 7). Potential participants were excluded from the study if they did not have at least one air conduction audiometric threshold ≥ 15 dB HL. This was done to exclude people who had unarguably normal hearing at all frequencies. The upper audiometric threshold limit for inclusion in the study was determined by the maximum stable gain of the hearing aid. Participants were included if their prescribed NAL-NL2 insertion gain targets could be achieved without any feedback. This limit varied somewhat among subjects but, typically, participants with air conduction thresholds > 60 dB HL in either ear were typically not eligible. Of the 166 listeners assessed for eligibility, 78 were excluded because they did not meet the audiometric criteria. A total of 75 individuals completed the study. The average audiograms are plotted, separated by group, in Figure 8. There is no between-group difference in four-frequency average (0.5, 1, 2, and 4 kHz) threshold (T142 = −1.6; d = 0.26; p = .11). Table 1 shows participant characteristics by group; participants were mostly new hearing aid users with mild-to-moderate hearing loss. Our sample size was based on the results from a prior laboratory study (Van Tasell & Sabin, 2014) where users performed only the AB comparison (see Field Use subsection, later). In this study, a sample of 27 listeners was needed to detect a within-group A versus B preference (when 1 − β = 0.8 and α = .05).
Figure 7.
CONSORT flow diagram. ABP = Audiologist Best Practices; APHAB = Abbreviated Profile of Hearing Aid Benefit; SSQ = Speech, Spatial, and Qualities of Hearing questionnaire.
Figure 8.
Average air conduction audiograms for participants in the ABP (squares) and Self (circles) groups. Error bars reflect standard deviation across all ears in the group. ABP = Audiologist Best Practices.
Table 1.
Participant Characteristics Reported by Group.
| ABP | Self | |
|---|---|---|
| Sample size—total (female) | 37 (19) | 38 (20) |
| 4FA AC threshold (dB HL; mean, SD) | 28.8, 9.2 | 32.5, 12.2 |
| Sensorineural (number of participants) | 30 | 34 |
| Conductive (number of participants) | 1 | 0 |
| Mixed (number of participants) | 1 | 1 |
| Normal (number of participants) | 5 | 3 |
| Asymmetric (number of participants) | 1 | 1 |
| New hearing aid users (number of participants) | 33 | 28 |
| Experienced hearing aid users (number of participants) | 4 | 10 |
| Age (years) mean, SD | 62, 13.4 | 66.1, 12.0 |
A loss was considered to have a conductive component if the air–bone gap was ≥15 dB at 0.5, 1, and 2 kHz in at least one ear. A loss had a sensorineural component if at least 1 BC threshold ≥15 dB HL. It was considered mixed if both criteria and normal hearing and if neither criteria were satisfied. A loss was asymmetric only if the difference between ears 3FPTA (0.5, 1, 3 kHz) was >15 dB. Users with <6 weeks of hearing aid use were considered new users. ABP = Audiologist Best Practices; SD = standard deviation.
First-Fit Session
The session began with a standard audiometric evaluation consisting of a case history, binaural audiogram (air and bone conduction), otoscopy, and tympanometry.
Hearing aid fitting was done by an audiologist in a quiet dedicated hearing aid fitting and counselling room at NUCASLL. Fitting began by placing probe microphones in the participant’s ear canals. The real-ear unaided response (REUR) was measured for each ear. Then, the prototype hearing aid with medium-sized eartips was placed in the participant’s ears, powered off. The real-ear occluded response (REOR) was then measured. If measurable passive attenuation at frequencies above 500 Hz was not seen, the audiologist selected a smaller or larger eartip and remeasured REOR until a good seal was obtained. The selected tip size was used by the participant during the remainder of the study.
The audiologist then fit the hearing aid to NAL-NL2 prescriptive targets for a quiet input. The hearing aid was powered on and connected, via Bluetooth, to an Apple iPod running a custom application that allowed the audiologist to adjust the gain in each of the 12 frequency bands, with compression ratio in each band set to 1:1. During fitting, microphones were set to omnidirectional and all adaptive signal processing features were disabled. Participants were either fit using an Otometrics Otosuite (n = 51) or Audioscan Axiom (n = 24) real-ear fitting system depending on availability of equipment and audiologist preference. The quiet input was 50 dB SPL speech-shaped noise (Otometrics) or a 50 dB SPL single talker (Audioscan). In either case, the audiometric thresholds (air conduction and bone conduction) were made available to the fitting system, in which NAL-NL2 was selected as the prescription fitting method. This procedure was completed separately for each ear.
The audiologist then fit the hearing aid for loud inputs. A loud sound (Otometrics: 80 dB speech-shaped noise, Audioscan: 70 dB single talker) was played over the loudspeaker. With band gains set at the values identified with 50-dB input, the audiologist adjusted the compression ratios in each band until the real-ear measurement matched the NAL-NL2 prescriptive targets as closely as possible. The resulting gain and compression settings were stored as “First Fit” settings in a remote database. If the participant had immediate sound quality complaints, a fine tuning was conducted. This procedure was only necessary in 10 out of 75 participants. The audiologist adjusted the WDRC parameters, based on clinical judgment, in response to participant complaints.
The target-to-real-ear fits for a quiet input shows that, on average, there was a close match between the NAL-NL2 targets and the measured REIG (see Figure 9). At the selected frequencies (0.5, 1, 2, and 4 kHz), measured REIG was within 5 dB of target for 92% of measurements made with quiet inputs. Although not shown, the same match occurred for 93% of measurements with loud inputs. Fits to target were slightly poorer at 8 kHz (−3.2 dB) due to limited stable gain. Collectively, the data indicate that the audiologists were almost always able to achieve high-quality fits to target through 4 kHz.
Figure 9.
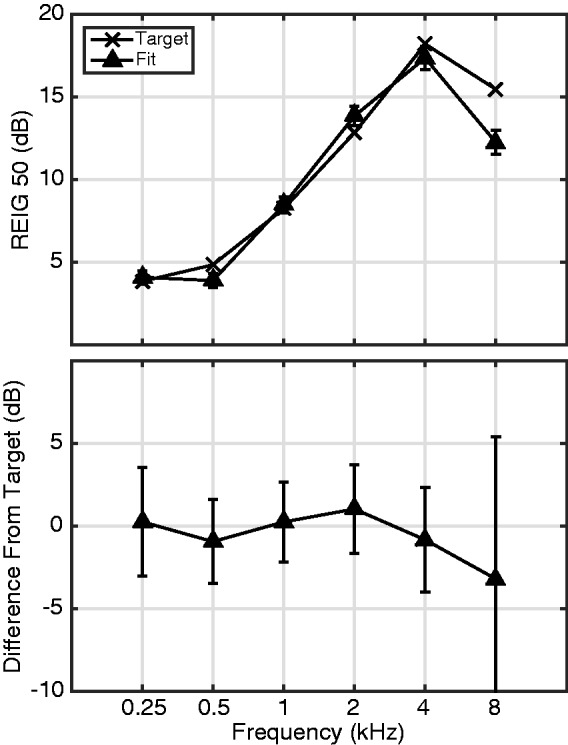
Audiologist Match-to-Target during First-Fit. (Top) NAL-NL2 Target and Measured REIG for a quiet input averaged across all listeners. (Bottom) Average and standard deviation of the difference between target and measured responses computed across all users. REIG = real-ear insertion gain.
The only deviation from audiological best practices was that maximum output was not set individually for each user. Instead the device limited the output to 115 dB SPL in a 2 cc coupler. This value is somewhat above the average values of Loudness Discomfort Level (LDL) for the wide range reported for persons with mild to moderate hearing loss (Dillon & Storey, 1998) and consistent with the maximum acceptable values of SSSPL90 reported by Storey, Dillon, Yeend, and Wigney (1998). Although it is possible that this fixed limit enabled some users to potentially experience uncomfortably loud sounds, the aided scores for the ABP group on the Aversiveness scale of the Abbreviated Profile of Hearing Aid Benefit (APHAB; described later) were well within norms for a WDRC hearing aid (average = 44.2, 56th percentile). It therefore seems unlikely that the use of a fixed maximum output level for all users resulted in loudness discomfort.
After fitting, the participant was given a user manual, along with instructions by the audiologist or research assistant on how to use the hearing aid and iPod. All participants went home following this first fitting using the ABP interface (Figure 6). Participants were instructed to listen in as many environments as possible and take notes about any sound quality concerns. The purpose of this initial field use was to give subjects some experience with the hearing aid before returning to the clinic for fine tuning of the fitting.
Fine-Tuning Session
After the participant spent several days using the hearing aid in their everyday lives, they returned for a Fine-Tuning session. Based on any complaints the participants had about sound quality, the audiologist adjusted the WDRC parameters. The resulting parameter set was stored as the Clinical Fit.
On average, there were 5.3 days between the First-Fit and Fine-Tuning sessions. For analysis of the fine-tuning-related adjustment, the gain was computed for a 60 dB speech-shaped input using the set of WDRC parameters at First-Fit and compared to that for the set at the Fine-Tuning session for the four critical frequencies (see Figure 10). These and all subsequently reported gains were computed from the device settings (for details, see User-Selected Gain subsection). The most common adjustment was a reduction to gain, mostly in response to feedback complaints. The gain reduction was more pronounced in the 4 kHz band.
Figure 10.
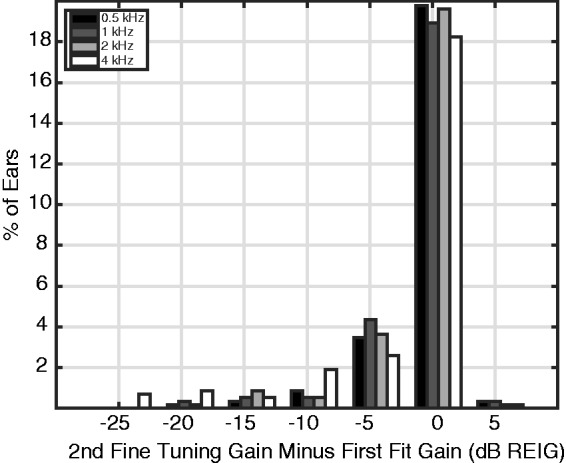
Distribution of changes to gain between First-Fit and Fine-Tuning sessions. REIG = real-ear insertion gain.
In a few cases, the change to gain during fine tuning was substantially larger than an audiologist might normally make to eliminate feedback while fitting a conventional hearing aid. The audiologists did not have access to all the tools they would normally have in fitting a conventional hearing aid, among them adjustment of vent size, fabrication of a custom earmold, or selection of a new hearing aid entirely. Outside of eartip selection, the only way to combat feedback complaints was to reduce gain.
There were 18 ears (12%) for which there was a gain reduction of >10 dB for at least one of the critical frequencies. Exclusion of all ears with fine-tuning gain reduction >10 dB did not change the statistical significance of any of the results reported later. Therefore, no ears with extreme fine-tuning values were removed from analysis.
Once the hearing aid was fine-tuned, the participant was assigned to either the ABP or the Self group. If the participant was assigned to the ABP group, the interface was the same as before (Figure 6), but the WDRC parameters were the ABP parameters selected in the Fine-Tuning session (the Clinical Fit). If the participant was assigned to the Self group, a new interface was presented (DRCs, see Figure 3). The initial setting of the interface for the Self group corresponded to 0 dB REIG. The audiologist described how to use the interface. Specifically, participants were told:
If you are listening to speech, go back and forth between the wheels until you can understand as clearly as possible the talker that you are trying to hear. If you are listening to music, make it sound as good as possible.
Field Use
Once the audiologist felt that the participant understood the instructions, they asked the participant to perform a practice “Star Button Press.” These practice events were repeated until the audiologist believed the user could conduct them on their own. These Star Button Press events provided the in-the-field data during the weeks of field use. The participants were instructed that whenever they were using the hearing aid in their everyday lives, they should launch the app and adjust until they felt that they could not improve the sound quality any further. At this point, they were instructed to press the star button on the UI.
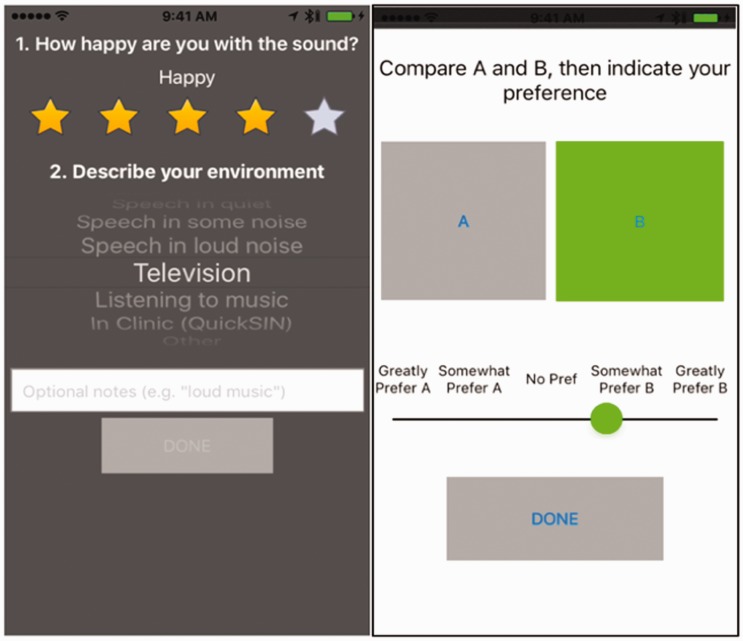
Pressing this button temporarily muted the hearing aid, while two questions were immediately presented on the screen (see Figure 11, left). The first question asked the participant to rate how happy they were with the sound quality (0–5 stars) that was present in the moment just preceding the button press. The second question asked the participant to describe their current listening environment from among a list of common situations. The device was temporarily muted to introduce a short period during which auditory memory of the user settings would fade. Once these questions were answered, a new screen was presented that conducted a blind paired sound quality comparison (A/B comparison, see Figure 11, right). The large A and B buttons were mapped to one of two sets of WDRC parameters: either the WDRC parameters selected by the audiologist at second fine tuning (the Clinical Fit) or the WDRC parameters selected by the participant right before pressing the star button. The assignment of the A/B buttons to the parameter sets was randomly determined on every star button press. The participant pressed the A and B buttons to audition each parameter set. (The first button press unmuted the hearing aid.) The participant could go back and forth as many times as desired. After auditioning both parameter sets, the participant was presented with a slider where they indicated which set they preferred as well as the strength of that preference. The slider was not quantized and could take any value between −2 and +2. Once the participant was satisfied with their response, they pressed the Done button and a set of values was stored. That set of values comprised the participant’s selected WDRC parameter set, the star rating, the listening environment, the A/B preference, and the timestamp. Importantly, upon completing the procedure, the WDRC settings returned to the state they were in immediately prior to pressing the star button. The UI also returned to the adjustment screen that was appropriate for the participant’s group (Figure 3 or Figure 6). Participants in both groups performed star button presses so that the field experience of both groups would be as similar as possible.
Figure 11.
(Left) First screen following Star Button Press asks user for sound quality judgment and report of current sound environment. (Right) Second screen following Star Button Press—participant performs a blind sound quality comparison (AB comparison) between the Audiologist- and Self-Selected sets of WDRC parameters.
Regular phone calls (approximately weekly) were scheduled with laboratory staff. These calls were intended to handle any questions (technical or experiment-related) that the participant had. The participant also had the ability to call/e-mail the experiment staff when needed.
Final Session
At the third and final session, each participant returned the prototype hearing aid and iPod, and completed aided versions of benefit questionnaires, as well as an aided speech-in-noise measure.
Participants completed two paper-and-pencil questionnaires for use in estimating hearing aid benefit: the APHAB (Cox & Alexander, 1995) and the 12-item version of the Speech, Spatial, and Qualities of Hearing questionnaire (SSQ12; Noble, Jensen, Naylor, Bhullar, & Akeroyd, 2013). Participants completed each questionnaire twice: once during the first fit session for unaided hearing and once during the third (final) session for hearing aided with the prototype hearing aid.
Benefit was also measured with the QuickSIN test (Killion, Niquette, Gudmundsen, Revit, & Banerjee, 2004). The participant was seated in a sound-attenuated booth facing a single loudspeaker. The test was comprised of lists of six sentences that were played from that loudspeaker at a constant level of 60 dB HL on the audiometer. The level of colocated background four-talker babble increased across the six sentences for signal-to-noise ratios (SNRs) ranging from +25 to 0 dB SNR (steps of 5 dB). The participant was asked to repeat each sentence. The audiologist scored whether the participant correctly repeated predetermined key words in each sentence. The resulting score was interpreted as SNR loss where a value near 0 indicated better hearing and larger values indicated more difficulty listening in noise. In all tests, two practice lists were presented to the listener. In the first (unaided) session, the practice lists were used to familiarize the participants with the procedure. In the final (aided) session, the participants adjusted the controls in the mobile app during the practice lists to find their favorite setting. The participants then completed three test lists during which they were not allowed to readjust the app.
Results
Field Use
For one participant in the Self group, the iPod malfunctioned near the end of field use, and no app-gathered data (from the Fit Sessions or from Field Use) could be salvaged. Two other participants in the Self group were removed from analysis of in-the-field data because they were initially fit to the wrong prescriptive targets due to an error in the real-ear fitting system.
The average duration of field use was 29.4 days (SD = 7.3) for the ABP group and 30.9 days (SD = 9.2) for the Self group (t70 = −0.48; d = 0.1; p = .63). The average number of star button presses for participants in the ABP and Self groups was 87.9 (SD = 95.4) and 62.9 (SD = 42.2) (t70 = 1.35; d = 0.3; p = .18), respectively. On average, participants in the ABP and Self groups had 54% and 45% of their star button presses occur in the first half of field use, respectively (U = 509; r = .18; p = .12). Finally, the duration of the participant’s adjustment preceding the star button press was estimated by computing elapsed time between app launch and star button press. This average was computed separately for every participant. On average, the duration for the Self group was 60.0 seconds (SD = 51.7) and for the ABP group was 72.9 seconds (SD = 74.0) (t70 = 0.96; d = 0.2; p = .43). Taken together, these analyses indicate that participants in both groups performed similar amounts of star button presses in the field, that those presses were well distributed across the duration of field use, and that the adjustments preceding the star presses were quick (approximately 1 minute).
Environments
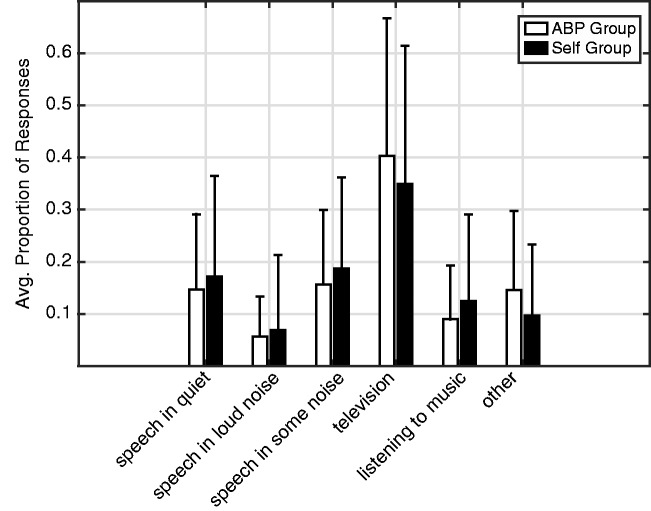
Participants in both groups used the hearing aid in a range of listening environments. For each participant, the proportion of star button presses in each of six selectable categories was computed (see Figure 12). The two groups did not differ in terms of their distribution of star button presses across categories according to Mann–Whitney tests computed separately for each of the six categories (all p values > .36). The star button presses were unevenly distributed across categories according to a Kruskal–Wallis test—χ2(5, 426) = 97.76; η2 = 0.23, p < .0001. This was primarily driven by the fact that there were significantly more presses in the television environment than all others (all possible two-group Mann–Whitney U tests vs. proportion television p < .0001). There were also fewer cases of Speech in Loud Noise than the other speech conditions (all two-group Mann–Whitney tests p < .0001). This distribution is very similar to that reported by Wu and Bentler (2012) in their dosimeter and journal study of environments experienced by persons with hearing impairment: by far the most common activity for both older and younger participants was media at home (TV), and the lowest percentage of time was spent in noisy environments. Importantly, in all analyses reported later, there were no cases in which the observed effects varied significantly across environment.
Figure 12.
Distribution of environments in which star button presses occurred for the ABP (white) and Self (black) groups. Bars show averages and thin lines indicate 1 SD. ABP = Audiologist Best Practices.
User-Selected Gain
For each star button press, a full set of stored WDRC parameters was available for analysis. The gain associated with the user-selected parameter set was estimated by computing the array of instantaneous band gains that would be applied to a 60 dB SPL speech-shaped steady-state noise. The assumed input of 60 dB SPL was chosen because the average sound levels in the environments of hearing aid users have been reported to be from 51 dB SPL (Banerjee, 2011) to 61 dBA (Macrae, 1994). In all cases, REIG is expressed as the quantity that would be observed for a user with average head, torso, and ear acoustics. When overall gain is reported, that value indicates the average of the gain value that would be applied at 0.5, 1, 2, and 4 kHz (four-frequency average) for a 60 dB SPL speech-shaped input. This results in one gain value per ear per star button press. Then, for each ear, the average of those gain values across all star button presses was computed.
Gain correlated with hearing loss severity
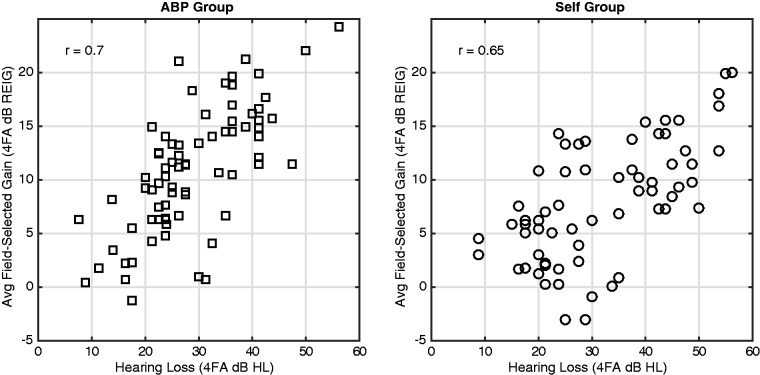
Participants in the Self group selected WDRC parameters resulting in gain that was correlated with the severity of their hearing loss. Figure 13 shows, for participants (ears) in the Self group, the four-frequency average (0.5, 1, 2, and 4 kHz) user-selected overall gain (y-axis) plotted against the four-frequency average air conduction threshold (x-axis) for that ear. There is a strong positive correlation between the values (r68 = .65; p < .0001), indicating that, on average, participants with more hearing loss selected more gain. The comparable correlation for participants in the ABP group is plotted in Figure 13, left (r72 = .70; p < .0001). The correlations are of comparable strength, but the slope of the trend line is slightly, but significantly, steeper in the ABP group (0.42 dB/dB) than in the Self group (0.29 dB/dB) (t140 = 1.99; d = 0.33; p = .048). This reflects the slightly lower average gains selected by the Self group as hearing loss became more severe.
Figure 13.
Relation between hearing loss and field-selected gains for the ABP group (left) and Self group (right). ABP = Audiologist Best Practices; REIG = real-ear insertion gain.
Self-selected gain correlated with audiologist-selected gain
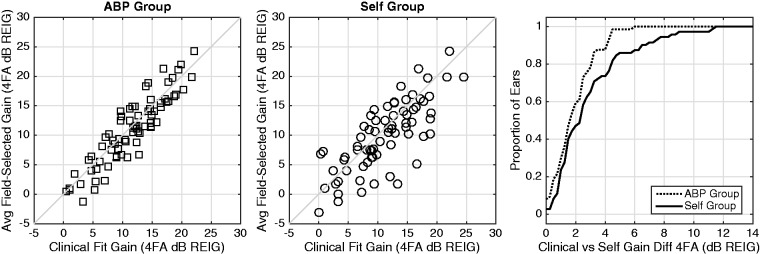
Gain selected by participants in the Self group was correlated with, but slightly lower than, the values selected by the audiologist. The participant-selected gains in the Self group are plotted against the comparable values set by the audiologist after second fine tuning (Figure 14, middle). There is a strong correlation between user-selected and audiologist-selected gain (r68 = 0.66, p < .0001). The user-selected gains were slightly lower than those selected by the audiologist (avg: 1.8 dB). For comparison, the analogous values from the ABP group (who had limited ability to adjust parameters) are plotted in the left panel of Figure 14; the tighter distribution reflects the ±8 dB limits of the volume control available to the ABP group. We also show the cumulative distribution of the clinical versus self differences in Figure 14, right. Here, the difference reflects the absolute value of the clinical-minus-self subtraction of the overall (4FA) gain values. For the Self group (solid line), 50% of users were with 2.6 dB and 90% of users were within 6.7 dB. The comparable values from the ABP group were 1.9 dB and 4.4 dB, respectively. The field-selected gain did not differ across environments according to a Group × Environment analysis of variance (ANOVA) with no main effect of Environment, (F5, 293 = 0.78; η2 = 0.01; p = .57), and no Group × Environment interaction, (F5,293 = 0.4; η2 = 0.007; p = .85). There was a main effect of (Group, F1,293 = 8.33; η2 = 0.03; p = .004), because the ABP group selected more gain (mean = 10.9 dB; SD = 5.8 dB) than the Self group (mean = 8.1 dB, SD = 5.5 dB). For users in the Self group, the difference between the self- and audiologist-selected values (the Clinical Fit) did not depend on age (r68 = −.003; p = .98), four-frequency average hearing loss (r68 = −.05; p = .71), or gender (t68 = 1.26; d = 0.29; p = .22).
Figure 14.
Field-selected gain (y-axis) versus clinical gain (x-axis) for the ABP (left) and Self (middle) groups. Each point is an ear. Cumulative distribution (right) of field-selected versus clinical absolute overall gain differences plotted for ABP (dotted line) and Self (solid line) groups. ABP = Audiologist Best Practices; REIG = real-ear insertion gain.
In the aforementioned analysis, we compared the overall gain difference between the user-selected and audiologist-selected. It is possible that this analysis could result in similar overall gain values even when there is substantial difference in gain per frequency band (e.g., if the band differences are in opposite directions). To examine this, we computed a mean absolute error (MAE) for each listener’s ear. Specifically, the band gains for each fit were computed at 0.5, 1, 2, and 4 kHz as earlier. The absolute value of the difference in gain per band is averaged across bands, separately for each ear. The cumulative distributions of the resulting MAE values are plotted in Figure 15. In the Self group (solid line), 50% of average absolute band gains were within 5.6 dB of the Clinical Fit, and 90% were within 8.6 dB. For the ABP group, where the ability to adjust setting was far more limited, and in 50% of average absolute band gains were within 1.9 dB and 90% were within 4.4 dB (dotted line). Finally, we also sought to determine if the difference in gain between fits was band dependent. We computed the difference between audiologist-selected and user-selected gains for the Self group at 0.5, 1, 2, and 4. This difference did not vary across frequency according to a one-way ANOVA across frequency, (F3,276 = 1.46; η2 = 0.016; p = .23).
Figure 15.
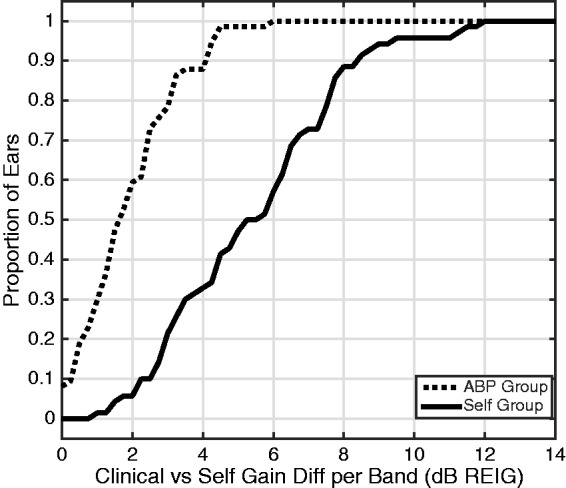
Cumulative distribution of field-selected versus clinical band-average absolute gain differences plotted for ABP (dotted line) and Self (solid line) groups. ABP = Audiologist Best Practices; REIG = real-ear insertion gain.
Star Ratings
Although both groups reported reasonably high ratings on their satisfaction with the sound quality that they could achieve, the Self group was significantly happier. For each participant, the average star rating was computed across all star button presses (see Figure 16). The average star rating in the ABP group was 3.6 (SD = 0.61) and that of the Self group was 4.0 (SD = 0.69). That difference between groups was significant according to a two-way (Group × Environment) ANOVA showing a main effect of Group, (F1,336 = 16.4; η2 = 0.05; p < .0001). There was no main effect of environment, (F5,336 = 0.89; η2 = 0.01; p = .49), and no Group × Environment interaction, (F5,336 = 0.37; η2 = 0.005; p = .87). The star ratings were not correlated with hearing loss severity (four-frequency average threshold) in either group (all p values > .20).
Figure 16.
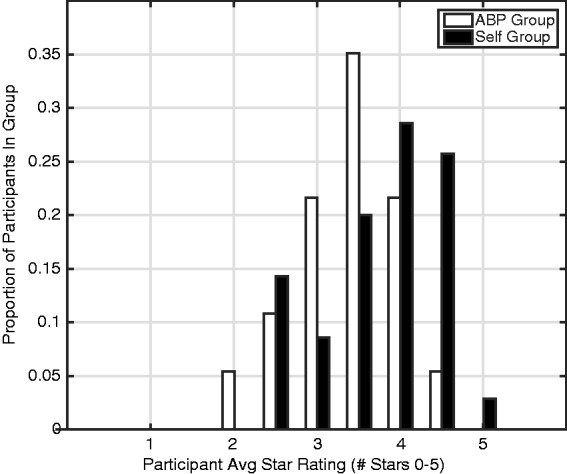
Distribution of star ratings for the ABP (white) and Self (black) groups. The bars of the histogram represent the proportion of listeners in each group whose average star rating falls in each of 11 bins that are equally spaced from 0 to 5 stars in steps of 0.5. ABP = Audiologist Best Practices.
A/B Comparisons
The final stage of each star-button press was the A/B comparison between the participant-selected and audiologist-selected WDRC parameter sets. Each response was reported on a scale between −2 and 2 (the scale corresponds to the horizontal slider in Figure 11, right) where positive numbers indicate a preference for the participant-selected parameters. A score of −2 indicated a “great preference” for the audiologist-selected parameters (the Clinical Fit), 0 indicated “no preference,” and 2 indicated a “great preference” for participant-selected parameters. For each participant, average preference score was computed across all their star button presses. These participant-average preference scores were used in all analyses later.
Both groups preferred their self-selected settings on average more than the Clinical Fit, but that preference was stronger in the Self group than the ABP group (see Figure 17). The population of participants’ scores was slightly, but significantly, higher than zero for both the ABP group (avg: 0.19; t36 = 3.8; d = 0.63; p < .001) and the Self group (avg: 0.59; t34 = 5.4; d = 0.92; p < .001), indicating that both groups preferred the parameters that they selected in the field more than those selected by the audiologist during fine-tuning session. Further investigation revealed a significant difference in variance between the two groups, Levene’s test F(1, 70) = 17.3; η2 = 0.052; p < .0001, presumably due to the narrower distribution of results in the ABP group (Figure 17, white bars). Accordingly, we report nonparametric tests for between-group comparisons. The strength of the preference on the AB task was significantly greater in the Self group than in the ABP group according to a Kruskal–Wallis test, (χ21,70 = 8.03; η2 = 0.010; p = .005). This indicates that the extent to which participants preferred their own settings over the Clinical Fit was greater in the Self group. This effect did not differ across listening environment according to a Kruskal–Wallis test on Environment, (χ25,342 = 2.23; η2 = 0.006; p = .82), computed on all the average ratings at all possible user/environment combinations. There was not a significant correlation between A/B preference score and the binaural four-frequency average hearing loss for either group (all p values > .48). There was also no influence of gender for the ABP (t35 = 0.34; d = 0.11; p = .73) or Self (t33 = 1.83; d = 0.59; p = .08) groups.
Figure 17.
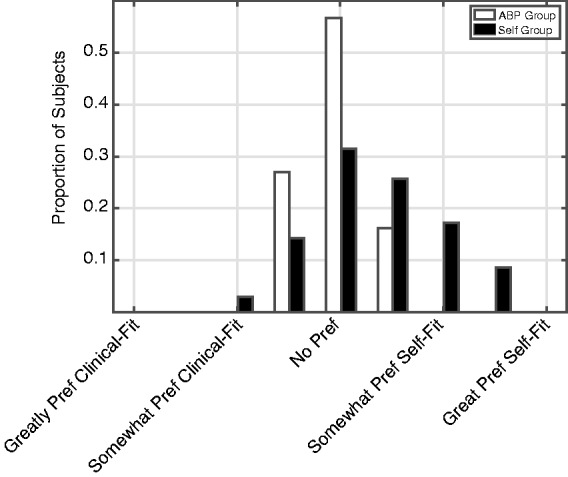
Distribution of participant average AB scores plotted for ABP (white) and Self (black) groups. The bars of the histogram represent the proportion of listeners in each group whose average rating falls in each of nine bins that are equally spaced from −2 to 2 in steps of 0.5. ABP = Audiologist Best Practices.
Benefit Measures
The mean unaided, aided, and benefit scores for APHAB, SSQ12, and QuickSIN tests did not differ between the ABP and Self groups (see Table 2).
Table 2.
Summary Statistics for Benefit Measures.
| Measure |
|||||||||
|---|---|---|---|---|---|---|---|---|---|
| Unaided APHAB | Aided APHAB | APHAB Benefit | Unaided SSQ12 | Aided SSQ12 | SSQ12 Benefit | Unaided QuickSIN | Aided QuickSIN | QuickSIN Benefit | |
| ABP | |||||||||
| Mean | 31.00 | 19.06 | 11.94 | 6.38 | 7.29 | 0.91 | 3.23 | 3.27 | −0.04 |
| SD | 15.22 | 12.97 | 15.14 | 1.78 | 1.44 | 1.93 | 2.59 | 1.88 | 1.99 |
| Min/Max | 12/82 | 1/50 | −9/58 | 2.5/13 | 3.8/9.5 | −7.6/4.6 | −1/11 | 0/8 | −4/7 |
| N | 34 | 34 | 34 | 37 | 37 | 37 | 35 | 35 | 35 |
| Self | |||||||||
| Mean | 31.67 | 17.10 | 14.57 | 5.96 | 7.17 | 1.21 | 4.42 | 4.00 | 0.42 |
| SD | 16.02 | 10.80 | 18.31 | 1.95 | 1.70 | 1.70 | 2.48 | 2.06 | 2.23 |
| Min/Max | 7/67 | 4/51 | −27/54 | 1.3/9.4 | 2.5/9.2 | −1.8/5.3 | 1/14 | 0/9 | −4/9 |
| N | 30 | 30 | 30 | 28 | 28 | 28 | 38 | 38 | 38 |
ABP = Audiologist Best Practices; SD = standard deviation; APHAB = Abbreviated Profile of Hearing Aid Benefit; SSQ = Speech, Spatial, and Qualities of Hearing questionnaire.
APHAB
The global APHAB score is computed by combining the Ease of Communication, Background Noise, and Reverberation subscales. APHAB global benefit score was computed by subtracting the aided APHAB global score from the unaided global score. A higher APHAB benefit score indicates that the participant received more benefit from the hearing aid. The values from 11 participants could not be computed because: (a) It was determined after the experiment that four participants had completed the aided APHAB with reference to their own hearing aids, not the Bose prototype hearing aid; (b) unaided APHAB data were not recorded from one participant; and (c) six participants provided fewer than four responses for at least one of the subscales of the aided APHAB during the final session (Cox, 1997).
The unaided APHAB scores of 31 for both groups are similar to the unaided Profile of Hearing Performance (PHAP, Cox and Gilmore, 1990) scores of the Audiology Best Practices (36) and Consumer-Determined (38) groups in the Humes et al.’s (2017) study of the OTC delivery model, as are the benefit scores of 12 and 15 (12–17 were reported by Humes et al.). These values are consistent with the mild to moderate hearing losses of the participants in both studies: because reported unaided difficulties are relatively low, reported benefit as measured by the APHAB cannot be high. The unaided scores are on the low end of the normative distribution reported by (Johnson, Cox, & Alexander, 2010); however, their sample reported greater hearing loss than the participants in this study.
Overall, 47% of the ABP group and 57% of the Self group showed a benefit score that was greater than the 90% critical difference (9.9; Chisolm, Abrams, McArdle, Wilson, & Doyle, 2005). The two groups did not differ in terms of benefit score (t62 = −0.63, d = 0.16; p = .53). A bootstrapping technique was used to determine whether that lack of difference was attributable to the difference in sample size. One hundred simulations were run, in which scores were randomly removed from the ABP group to match the size of the Self group. In all simulations, there was no significant difference between groups, suggesting that the unbalanced sample size did not influence the results.
Finally, there was also no indication of a between-group difference on any subscale according to a Group × Subscale ANOVA computed on the benefit scores (unaided–aided) where both the main effect of Group, (F1,248 = 0.003; η2 < 0.0001; p = .96), and the Group × Subscale interaction, (F3,248 = 1.48; η2 = 0.12; p = .22), were not significant.
SSQ12
SSQ12 benefit values were computed by subtracting the unaided responses collected in the first session from the aided responses collected at the end. Data from 10 participants could not be computed because they answered the aided version of the SSQ12 with reference to their own hearing aids, not the prototype hearing aid. The average unaided SSQ12 scores (6.38 and 5.96, for ABP and Self groups, respectively) correspond closely to the average score of 5.5 reported by Gatehouse and Noble (2004) for the clinical population on whom the SSQ questionnaire was developed. There was no difference in benefit between the ABP and Self groups (t63 = −0.66, d = 0.17; p = .51). This shorter version of the SSQ has not been validated on any subscales (Noble et al., 2013), so no subscale analyses were done. The same bootstrapping technique was used as on the APHAB data (mentioned earlier) where again no difference between groups across 100 simulations were observed when the sample sizes were matched between groups.
QuickSIN
The unaided SNR loss was subtracted from the aided score to compute QuickSIN benefit, where higher scores indicate more benefit of the hearing aid. The values from two participants could not be computed because unaided QuickSIN data were not recorded for them. There was no difference in benefit between the ABP (avg 0.02, SD = 2.0) and Self (avg 0.42, SD = 2.2) groups (t71 = 2.12, d = 0.22; p = .36). Overall, 16% of the ABP group and 30% of the Self group showed a benefit score that was greater than the 90% critical difference (1.8 dB; Killion et al., 2004).
It was not expected that participants would improve their QuickSIN scores much with amplification, since (a) participants had mild-to-moderate hearing losses, (b) both noise and babble were presented from a single loudspeaker, and (c) the speech level was fairly high (60 dB). Indeed, this was the outcome that was observed. More importantly, participants in the Self group did not improperly adjust their gains in such a way as to make their aided benefit significantly worse than that experienced by the ABP group.
Discussion
In their everyday lives, two groups of listeners with mild-to-moderate hearing loss used prototype hearing aids that were identical except for how the gain and compression parameters were selected. In one group, parameters were selected via Audiologist Best Practices (ABP). In the other (Self) group, the users selected their own parameters via a simple UI comprised of Dimension Reduced Controllers (DRCs). Data gathered in the field indicated that, on average, listeners in the Self group selected overall gain that was correlated with their hearing loss and similar to (though slightly less than) that selected by an audiologist. Furthermore, listeners in the Self group showed a small, but significant, preference for their own settings to those selected by the audiologist and overall were slightly happier with the sound quality than the listeners in the ABP group. Finally, there was no statistically significant difference between the groups using standardized measures of hearing aid benefit/satisfaction.
When evaluating the effectiveness of any self-fitting method, the fundamental question is: does the method allow users to achieve settings that provide satisfactory sound quality and perceived benefit? For the DRCs evaluated here, several lines of evidence point to an affirmative answer. In-the-field star ratings of sound quality were high, that is, four out of a possible five stars (see Figure 16) and questionnaire-based benefit scores were consistent with expectations of successful amplification for persons with mild-to-moderate hearing loss: that is, benefit as measured with the APHAB and other similar questionnaires was limited because the initial reported difficulties were few. For this population, in-the-field star rating and AB comparison data provide a more robust measure of benefit than questionnaire data.
Furthermore, if it is assumed that audiogram-based fitting done by an audiologist using best practices is the bar to which self-fitting methods should be held, a second question for a self-fit method then becomes: When using the self-fit method do users select parameters similar to those that would be selected by a hearing care professional? Once again, the data reported here show that participants in the Self group chose gain appropriate to their hearing losses. In terms of overall gain, the values selected by the Self group were, on average, only 1.8 dB lower than gain selected with audiology best practices. For comparison, the just-noticeable-difference (JND) for broadband increments to sound level in individuals with hearing loss are 1.5 dB (Caswell-Midwinter & Whitmer, 2019). In terms of band-specific gain, the values selected by the self-group were, on average, within 5.6 dB of those selected by an audiologist, and did not vary systematically across frequency. For comparison, the JND for band-limited increments to sound level in individuals with hearing loss is 2.8 dB (Caswell-Midwinter & Whitmer, 2019) using a d ′ value of 1, and 5 to 6 dB when using a d ′ value of 2. Collectively, the data show that, on average, the listeners chose gain that was similar, but not identical, to that chosen by the audiologist, and that the average gain differences corresponded to a barely noticeable difference from the audiologist fitting. The lack of systematic variation of that average gain difference (self vs. clinical) across frequency indicates that the simple experimental interface, based on typical hearing loss shapes and allowing simultaneous adjustment of all bands via the Loudness DRC, did not make systematic errors in terms of the shape of the frequency versus gain curves without requiring the user to make separate bass-, mid-, and treble-range adjustments. However, the fact that the per-band clinical versus self differences (Figure 15) were higher than the overall gain differences (Figure 14) suggests that the shapes of the two frequency versus gain curves did differ at the individual level.
The results reported here provide substantial evidence that it is possible for a non-audiogram-based self-fit method to yield successful amplification outside the laboratory. The design of the experiment provided a unique opportunity for direct, real-time comparison—in users’ own listening environments—of signal processing parameters chosen by the user via the DRCs versus those previously chosen for them by an audiologist. This within-subjects measure is a highly ecologically valid measure, since (a) the only independent variable is fitting method, (b) it is generated in the user’s actual communication situations, and (c) it requires no long-term memory on the user’s part about experience with different settings (as it is done in-the-moment). The experimental design also likely reduced the influence of the initial gain setting, as has been seen in laboratory studies (e.g., Dreschler et al., 2008; Keidser, Dillon, & Convery, 2008). In the current experiment, the initial gain setting in the Self group corresponded to 0 dB REIG and then was adjusted by the user 62.9 times on average during field use, without ever returning to the initial 0-dB REIG setting.
In field data collected via the UI, two factors are worthy of consideration: memory and user “ownership” of settings. The interface for star rating appeared immediately after the device was muted, and therefore users did not make their ratings while listening to the sound. It is, however, highly likely that the users anticipated the star ratings questions, because they were instructed to press the star button only after they had achieved the best sound possible with their adjustments, and they repeated this procedure 77 times (across group average). Even if the users’ responses were partially degraded by memory, that degradation cannot explain the difference in star ratings between groups. In addition, it cannot be ruled out that memory may have had an influence on the AB comparisons. The device was muted for approximately 10 seconds to allow “echoic” memory to decay, which typically occurs within a few seconds (Cowan, 1984). However, this decay has not been tested for hearing aid gain profiles, so it is possible that the users remembered the sound of the settings that they selected. It is also possible that, over time, the user learned to identify the Clinical Fit—especially if that fit differed substantially from their preferences. If that is the case, “psychological ownership” (Convery, Keidser, Dillon, & Hartley, 2011; Pierce, Kostova, & Dirks, 2003)—favoring selections that a user made for themselves over those selected by others—may have influenced the AB comparisons. Once again, however, this effect should be present in both groups and does not explain why the strength of preference for user-selected parameters is stronger in the Self group than the ABP group, unless the strength of the psychological ownership effect varies based on the adjustment range and the UI (the factors that differed between groups). This seems unlikely, since each group performed A/B comparisons with only one of the interfaces, and did not compare them directly. Collectively, the between-group differences each provide independent support that the Self group was able to improve sound quality slightly, but significantly, more than the ABP group.
An often-raised safety concern around self-fit methods is that users might select too much gain and therefore cause hearing damage. There are two arguments against this here: First, the design of the Loudness DRC results in a system where the amount of compression increases as more gain is selected. This compression makes it unlikely that a damaging sound would be presented to the listener because relatively low amounts gain would be applied to a loud input. Second, on average, users selected less gain than the audiologist (see Figure 14, middle). Similar results have been seen elsewhere (e.g., Keidser, Dillon, Carter, & O’Brien, 2012).
It is possible that the lower gain selected by some users reduced audibility and led to suboptimal speech intelligibility benefit. Although there was no difference between groups on the QuickSIN, the relatively high presentation level (60 dB HL) might have reduced the influence of audibility. An intelligibility test more sensitive to audibility might have shown a difference between groups. However, it seems unlikely that standard speech intelligibility tests would have been sensitive enough to show such a difference. For example, Humes et al. (2017) observed similar performance on the CST (a test that presumably has a stronger influence of audibility) between a group that chose their own frequency response from a limited set and another that was fit using audiological best practices.
The observation that no measures were correlated with hearing loss severity shows that, across the range of hearing losses tested here, all users could select appropriate amplification. Therefore, all users were appropriate candidates for self-fit. The limitations imposed by the prototype hearing aid device (the necessity to achieve target gains without feedback) led to selection of participants primarily in the mild-to-moderate hearing loss range. Participants were also primarily new hearing aid users with sensorineural hearing loss. Future work would be needed to see if these results generalize to more severe losses, conductive losses, and experienced hearing aid users. If the range of available settings is the primary determinant of candidacy, then the wide range of possible settings achievable with the DRCs presented here could potentially serve a wider population than the one represented by the subject group of this study.
Finally, it is crucial to emphasize that the conclusions from this study pertain strictly to the self-fitting method used here. They cannot be extended to “self-fitting hearing aids” or OTC hearing aids as general classes. Many potential methods for mapping parameters to UI controls exist, and there are many possible designs for those controls. In addition, the method studied here allows the user to continuously update parameters depending on instantaneous listening needs, whereas other methods determine parameters only during initial device setup. All of these alternatives can potentially affect outcomes and, therefore, the efficacy of other self-fit methods will need to be demonstrated using in-the-field techniques.
Declaration of Conflicting Interests
The authors declared the following potential conflicts of interest with respect to the research, authorship, and/or publication of this article: A. T. S., D. J. V. T., and B. R. are employees of Bose Corporation. S. D. is employed at Northwestern University.
Funding
The authors disclosed receipt of the following financial support for the research, authorship, and/or publication of this article: Funding was provided by the National Institute on Deafness and Other Communication Disorders grant number R44DC013093 to Ear Machine LLC, subsequently transferred to Bose Corporation. The research was conducted under a subcontract to Northwestern University by Bose Corporation. S. D. was the principal investigator at Northwestern. All recruiting, testing, and reporting procedures were reviewed and approved by the Institutional Review Board of Northwestern University.
ORCID iD
Andrew T. Sabin https://orcid.org/0000-0003-4403-0159
References
- Abrams H., Edwards B., Valentine S., Fitz K. (2011). A patient-adjusted fine-tuning approach for optimizing hearing aid response. Hearing Review, 18(3), 18–27. [Google Scholar]
- American National Standards Institute/Consumer Technology Association. (2017). Personal Sound Amplification Performance Criteria (ANSI/CTA 2051-2017). Retrieved from https://webstore.ansi.org/standards/ansi/cta20512017 ansi+&cd=&hl=en&ct=clnk&gl=us
- Banerjee S. (2011). Hearing aids in the real world: Typical automatic behavior of expansion, directionality, and noise management. Journal of the American Academy of Audiology, 22, 34–48. doi:10.3766/jaaa.22.1.5 [DOI] [PubMed] [Google Scholar]
- Boothroyd A., Mackersie C. (2017). A “Goldilocks” approach to hearing-aid self-fitting: User interactions. American Journal of Audiology, 26(3S), 430–435. doi:10.1044/2017_AJA-16-0125 [DOI] [PMC free article] [PubMed] [Google Scholar]
- Boymans M., Dreschler W. (2012). Audiologist-driven versus patient-driven fine tuning of hearing instruments. Trends in Amplification, 16(1), 49–58. doi:10.1177/1084713811424884 [DOI] [PMC free article] [PubMed] [Google Scholar]
- Brody L., Wu H., Stangl E. (2018). A comparison of personal sound amplification products and hearing aids in ecologically relevant test environments. American Journal of Audiology, 27, 581–593. doi:10.1044/2018_AJA-18-0027 [DOI] [PMC free article] [PubMed] [Google Scholar]
- Caswell-Midwinter B., Whitmer W. M. (2019). Discrimination of gain increments in speech-shaped noises. Trends in Hearing, 23. doi:10.1177/2331216518820220 [DOI] [PMC free article] [PubMed] [Google Scholar]
- Centers for Disease Control and Prevention, National Center for Health Statistics. (2004). National health and nutrition examination survey data. Hyattsville, MD: U.S. Department of Health and Human Services, Centers for Disease Control and Prevention.
- Chisolm T., Abrams H., McArdle R., Wilson R., Doyle P. (2005). The WHO-DAS II: Psychometric properties in the measurement of functional health status in adults with acquired hearing loss. Trends in Amplification, 9(3), 111–126. doi:10.1177/108471380500900303 [DOI] [PMC free article] [PubMed] [Google Scholar]
- Ciletti L., Flamme G. A. (2008). Prevalence of hearing impairment by gender and audiometric configuration: Results from The National Health and Nutrition Examination Survey (1999–2004) and The Keokuk County Rural Health Study (1994–1998). Journal of the American Academy of Audiology, 19(9), 672–685. doi:10.3766/jaaa.19.9.3 [DOI] [PubMed] [Google Scholar]
- Convery E., Keidser G., Dillon H., Hartley L. (2011). A self-fitting hearing aid: Need and concept. Trends in Amplification, 15(4), 157–166. doi:10.1177/1084713811427707 [DOI] [PMC free article] [PubMed] [Google Scholar]
- Cowan N. (1984). On short and long auditory stores. Psychological Bulletin, 96(2), 341. doi:10.1037/0033-2909.96.2.341 [PubMed] [Google Scholar]
- Cox R. (1997). Administration and application of the APHAB. The Hearing Journal, 50(4), 32, 35–36, 38, 40–41, 44–45, 48. doi:10.1097/00025572-199704000-00002 [Google Scholar]
- Cox R., Alexander G. (1995). The abbreviated profile of hearing aid benefit. Ear & Hearing, 16(2), 176–186. doi:10.1097/00003446-199504000-00005 [DOI] [PubMed] [Google Scholar]
- Cox R., Gilmore C. (1990). Development of the Profile of Hearing Aid Performance (PHAP). Journal of Speech and Hearing Research, 33, 343–357. doi:10.1044/jshr.3302.343 [DOI] [PubMed] [Google Scholar]
- Dreschler W., Keidser G., Convery E., Dillon H. (2008). Client-based adjustments of hearing aid gain: The effect of different control configurations. Ear and Hearing, 29(2), 214–227. doi:10.1097/AUD.0b013e31816453a6 [DOI] [PubMed] [Google Scholar]
- Dillon H., Storey L. (1998). The National Acoustics Laboratory’s procedure for selecting the saturation sound pressure of hearing aids: Theoretical derivation. Ear and Hearing, 19, 255–266. [DOI] [PubMed] [Google Scholar]
- Gatehouse, S., & Noble, W. (2004). The speech, spatial and qualities of hearing scale (SSQ). International journal of audiology, 43(2), 85–99. doi: 0.1080/14992020400050014 [DOI] [PMC free article] [PubMed]
- Humes L., Rogers S., Quigley T., Main A., Kinney D., Herring C. (2017). The effects of service-delivery model and purchase price on hearing-aid outcomes in older adults: A randomized double-blind placebo-controlled clinical trial. American Journal of Audiology, 26, 53–79. doi:10.1044/2017_AJA-16-0111 [DOI] [PMC free article] [PubMed] [Google Scholar]
- Jenstad L., Van Tasell D., Ewert C. (2003). Hearing aid troubleshooting based on patients’ descriptions. Journal of the American Academy of Audiology, 14(7), 347–360. [PubMed] [Google Scholar]
- Johnson J., Cox R., Alexander G. (2010). Development of APHAB norms for WDRC hearing aids and comparisons with original norms. Ear & Hearing, 31(1), 47–55. doi: 10.1097/AUD.0b013e3181b8397c [DOI] [PubMed] [Google Scholar]
- Keidser G., Dillon H., Carter L., O’Brien A. (2012). NAL-NL2 empirical adjustments. Trends in Amplification, 16(4), 211–223. doi:10.1177/1084713812468511 [DOI] [PMC free article] [PubMed] [Google Scholar]
- Keidser G., Dillon H., Convery E. (2008). The effect of the base line response on self-adjustments of hearing aid gain. The Journal of the Acoustical Society of America, 124(3), 1668–1681. doi:10.1121/1.2951500 [DOI] [PubMed] [Google Scholar]
- Keidser G., Dillon H., Flax M., Ching T., Brewer S. (2011). The NAL-NL2 prescription procedure. Audiology Research, 1(1), 88–90. doi:10.4081/audiores.2011.e24 [DOI] [PMC free article] [PubMed] [Google Scholar]
- Killion M., Niquette P., Gudmundsen G., Revit L., Banerjee S. (2004). Development of a quick speech-in-noise test for measuring signal-to-noise ratio loss in normal-hearing and hearing-impaired listeners. The Journal of the Acoustical Society of America, 116(4), 2395–2405. doi:10.1121/1.1784440 [DOI] [PubMed] [Google Scholar]
- Kuk F., Pape N. (1992). The reliability of a modified simplex procedure in hearing aid frequency-response selection. Journal of Speech, Language, and Hearing Research, 35(2), 418–429. doi:10.1044/jshr.3502.418 [DOI] [PubMed] [Google Scholar]
- Leavitt R., Bentler R., Flexer C. (2018). Evaluating select personal sound amplifiers and a consumer-decision model for OTC amplification. Hearing Review, 25(12), 10–16. [Google Scholar]
- Mackersie C., Boothroyd A., Lithgow A. (2019). A “Goldilocks” approach to hearing aid self-fitting: Ear-canal output and speech intelligibility index. Ear and Hearing, 40(1), 107–115. doi:10.1097/AUD.0000000000000617 [DOI] [PMC free article] [PubMed] [Google Scholar]
- Macrae J. (1994). Prediction of asymptotic threshold shift caused by hearing-aid use. Journal of Speech, Language, and Hearing Research, 37(6), 1450–1458. doi:10.1044/jshr.3706.1450 [DOI] [PubMed] [Google Scholar]
- Moore B., Marriage J., Alcántara J., Glasberg B. (2005). Comparison of two adaptive procedures for fitting a multi-channel compression hearing aid. International Journal of Audiology, 44(6), 345–357. doi:10.1080/14992020500060198 [DOI] [PubMed] [Google Scholar]
- Noble W., Jensen N., Naylor G., Bhullar N., Akeroyd M. (2013). A short form of the Speech, Spatial and Qualities of Hearing scale suitable for clinical use: The SSQ12. International Journal of Audiology, 52(6), 409–412. doi:10.3109/14992027.2013.781278 [DOI] [PMC free article] [PubMed] [Google Scholar]
- Pierce J., Kostova T., Dirks K. (2003). The state of psychological ownership: Integrating and extending a century of research. Review of General Psychology, 7(1), 84–107. doi:10.1037/1089-2680.7.1.84 [Google Scholar]
- Sabin A., Hardies L., Marrone N., Dhar S. (2011). Weighting function-based mapping of descriptors to frequency-gain curves in listeners with hearing loss. Ear and Hearing, 32(3), 399–409. doi:10.1097/AUD.0b013e318202b7ca [DOI] [PubMed] [Google Scholar]
- Scollie S., Cornelisse L., Moodie S., Bagatto M., Laurnagaray D., Beaulac S., Pumford J. (2005). The desired sensation level multistage input/output algorithm. Trends in Amplification, 9(4), 159–197. doi:10.1177/108471380500900403 [DOI] [PMC free article] [PubMed] [Google Scholar]
- Storey L., Dillon H., Yeend I., Wigney D. (1998). The National Acoustic Laboratories’ procedure for selecting the saturation sound pressure level of hearing aids: Experimental validation. Ear & Hearing, 19(4), 267–279. [DOI] [PubMed] [Google Scholar]
- Valente M. (2006). Guideline for audiologic management of the adult patient. Audiology Online Retrived from https://www.audiologyonline.com/articles/guideline-for-audiologic-management-adult-966
- Van Tasell D., Sabin A. (2014). User self-adjustment of a simulated hearing aid using a mobile device. Presented at Conference of the American Auditory Society, Scottsdale, AZ. [Google Scholar]
- Wu Y., Bentler R. (2012). Do older adults have social lifestyles that place fewer demands on hearing? Journal of the American Academy of Audiology, 23, 697–711. doi:10.3766/jaaa.23.9.4 [DOI] [PubMed] [Google Scholar]


