Abstract
The combination of ultra-sensitive assay techniques and recent improvements in the instrumentation used to collect microdroplets of lung fluid (MLF) from exhaled breath has enabled the development of non-invasive lung disease diagnostics that are based on MLF analysis. In one example of this approach, electrospun nylon filters were used to collect MLFs from patients with pulmonary tuberculosis. The filters were washed to obtain liquid probes, which were then tested for human immunoglobulin A (h-IgA) and fractions of h-IgA specific to ESAT-6 and Psts-1, two antigens secreted by Mycobacterium tuberculosis. Probes collected for 10 min contained 100–1500 fg of h-IgA and, in patients with pulmonary tuberculosis, a portion of these h-IgA molecules showed specificity to the secreted antigens. Separate MLFs and their dry residues were successfully collected using an electrostatic collector and impactor developed especially for this purpose. Visualization of MLF dry residues by atomic force microscopy made it possible to estimate the lipid content in each MLF and revealed mucin molecules in some MLFs. This exciting new approach will likely make it possible to detect biomarkers in individual MLFs. MLFs emerging from an infection site (‘hot’ microdroplets) are expected to be enriched with infection biomarkers. This paper discusses possible experimental approaches to detecting biomarkers in single MLFs, as well as certain technological problems that need to be resolved in order to develop new non-invasive diagnostics based on analysing biomarkers in separate MLFs.
Keywords: exhaled air, lung fluid microdroplets, biomarkers, aerosol collection, tuberculosis
1. Introduction
Atmospheric pollution by anthropogenic aerosols notably affects health, elevates the risk of Alzheimer’s disease and other forms of dementia [1], and decreases lifespan [2–4]. Since the lungs are the major organ affected by air pollution, lung disease diagnostics is especially important, and a variety of physical techniques employing x-rays, ultrasound and NMR-based imaging have been introduced to reveal changes in lung tissue. However, these powerful methods cannot catch the molecular signatures that could reveal disease in its early stages, when no serious physical damage to the lung tissue is yet observable. Molecular diagnostics requires samples of lung tissue, e.g. by percutaneous lung biopsy [5] or probing lung fluid obtained in a bronchoalveolar lavage procedure [6]. Both of these procedures are invasive, require certified physicians and cannot be widely used to collect samples to screen large population groups, nor can they be used frequently on the same patient to follow treatment progress.
Yet another important recently suggested application of exhaled biomarkers is their use as indicators of chronic exposure to endogenous environmental pollutants [7]. All of these applications are critically dependent upon collection techniques and upon the ability of analytical techniques to detect trace amounts of biomarkers in exhaled probes.
The need for simple non-invasive techniques for collecting lung fluid has long been recognized, and a few approaches have been developed. Some valuable biomarkers are volatile and leave the lung as vapor; these could be analysed by gas chromatography or mass spectrometry [8], or by using an array of gas sensors (so-called ‘electronic noses’) [9] for a selected set of biomarkers. However, the majority of interesting biomarkers (proteins, DNAs, RNAs, etc) are not volatile and leave the lungs not as vapor, but as sub-micron-sized microdroplets of lung fluid (MLFs) [10]. We will concentrate on such non-volatile biomarkers.
2. Mechanisms of MLF formation
There are conflicting opinions about the location and mechanisms of MLF formation [11–15]. Most evidence, particularly the fact that their concentration increases with increasing tidal volume and inhalation speed [11], points to the rupture of liquid films as the major mechanism. This rupture may happen inside the alveoli when closed alveolar sacs are opened upon inhalation, or in the bronchi and bronchioles when liquid plugs break there. Although a turbulence-induced mechanism has been discussed in the literature [11], it is not supported by solid experimental evidence.
We should keep in mind that MLFs are formed by different mechanisms and that exhaled breath contains a mixture of MLFs originating from different parts of the lungs. Holmgren et al [15] presented evidence for this by measuring the size distribution of MLFs at different tidal volumes: while the number of MLFs smaller than 100 nm was independent of the tidal volume, the concentration of MLFs larger than 500 nm increased ∼100-fold with deep breathing. The authors interpreted this observation as the result of two independent mechanisms. One mechanism, independent of the tidal volume, is a closure mechanism operating in the alveoli, while another mechanism involving the closing and opening of terminal bronchioles contributes to the fraction of larger MLFs exhaled with a deeper breath. We may expect that such smaller and larger MLFs, born in different parts of the lungs, will have different compositions and present different sets of biomarkers. Therefore, further studies of the formation mechanisms are needed to answer many practical questions about where the MLFs are born and how representative their composition is of the lung fluid in general.
Alveoli and small airways often open explosively, producing characteristic sounds called crackles [16]. Crackles have a correlated character: intervals between individual crackles are distributed non-randomly, proceeding in a series of avalanches upon inspiration, so that when inspiration starts, a substantial portion of the lung tissue opens at once in a cooperative manner [17]. Though multiple correlations between crackle characteristics and diseases have been explored, crackles are observed in many healthy people, and explosive opening of airways should be considered normal [16]. The production of MLFs varies substantially in different people. The concentration of exhaled MLFs is affected by the time of day, the depth of the breath, inhalation of a salty mist [18] and other factors. Yields in a series of consecutive breaths may be different: a deep inhalation opens the alveoli with the first deep breath, after which the alveoli remain open and stable [19], thereby reducing MLF production.
3. Correlation between composition of non-volatile substances and that of lung fluid
An important question is: how representative is the composition of exhaled MLFs? Because lung liquid is coated with a surfactant layer, any MLFs formed upon film rupture will also be coated with the surfactant layer. The presence of lipids in MLFs is well-documented [20].
In addition, the lipid composition in the upper airway system is different from that in alveoli [21]; however, a surfactant films covers the conducting airways as well, reducing the surface tension to less than 15 mN m−2 [22].
It follows from the formation mechanisms discussed above that dry residue of MLF will contain an excessive fraction of lipids as compared to a lavage liquid. We presume that, for the same reason, MLFs will be enriched with the surfactant proteins. We have recently shown that the relative volume of lipids in dry residues is higher in smaller MLFs, which is expected if droplets of different sizes are coated with a surfactant layer of uniform thickness [23]. Both lipids and surfactant proteins are capable of concentrating certain substances either directly, by binding them, or indirectly, by providing a hydrophobic environment where hydrophobic substances accumulate. It is expected that the relative content of such hydrophobic substances with a high partition coefficient will be shifted higher in smaller MLFs, which are surfactant-enriched. We are aware of only one attempt to compare the composition of substances in MLFs and in alveolar lining fluid [14].
The ratio of certain ionic species in exhaled breath condensate (EBC) was found to differ from that in alveolar fluid. In particular, the Ca2+:Na+ concentration ratio was five times higher in EBC than in lung fluid. Such a notable difference in the ion concentrations may be explained by the ability of the surfactant protein, SP-A, to form ternary complexes with lipids and Ca2+ [24], a process that results in the accumulation of Ca2+ ions within the surfactant shell of the MLFs. This example illustrates that the potential differences in the composition of MLFs and of lung fluid should always be kept in mind.
4. Non-invasive collection of exhaled non-volatile biomarkers
There are four techniques suitable for the collection of MLFs. Table 1 summarizes their principles of operation and provides a brief description of their advantages and drawbacks. We discuss each technique in further detail below.
Table 1.
Comparison of different techniques used in the collection of MLFs.
| Method | Principle of operation | Advantages | Drawbacks | References |
|---|---|---|---|---|
| EBC | MLFs turn into microdroplets by water condensation in supersaturated exhaled air. Microdroplets settle on cold walls. | Simple, inexpensive, energy-efficient. | High dilution of lung liquid with condensed water. | [25] |
| Filtering | MLFs or their dry residues are retained on a filter by collisions with fibers. | Simple, energy-efficient process; high collection speed; concentrated samples. | Loss of biomarkers due to adsorption on filters. | [20, 26–28] |
| Inertial (impactor) | MLFs are accelerated with air flow and hit a substrate surface. | High collection speed, concentrated samples. | Limited particle size, requires a powerful pump. | [10] |
| Electrostatic collector | MLFs are charged by corona and attracted to an oppositely charged substrate. | Collects even the smallest MLFs and particles. | Slow collection rate, corona products may react with biomarkers. | [23] |
4.1. EBC collection technique
In this technique, MLFs serve as seeds for water condensation when exhaled air is cooled. Because even the smallest MLF grows into a micron-sized water droplet, MLFs of all sizes are collected by using the EBC technique. The method is simple, inexpensive and requires no energy source. Many self-made and commercial devices have been described, and their successful application in diagnostics has been reported [25]. The very high and extremely variable dilution of lung fluid in the EBC samples was noted by many authors as the main limitation of this collection technique [29]. Because of the high dilution, EBC probes need extremely sensitive assay techniques to detect biomarkers or require a substantial pre-concentration of samples [30] after a lengthy collection process [31]. Often, probe samples from many volunteers are combined to increase the concentration of biomarkers [32].
Less-diluted samples may be obtained by using various techniques in which only microdroplets of lung fluid or their dry residues are collected on filters or are collected by using inertial or electrostatic collectors.
4.2. Filters in the collection of exhaled MLFs
Filters allow separation of MLFs from water vapor, resulting in probes with much higher concentrations of biomarkers than those obtained by the EBC collection technique. Swedish scientists successfully applied the technique to detect abused drugs in exhaled air [26] and to measure the lipid composition of MLFs [27]. A simple filter-based disposable device is now available commercially (SensAbues AB, Huddinge, Sweden) [20]. There are two problems with this collection technique: (i) release of collected material into water solution for further analysis; and (ii) selective collection of MLFs of different sizes. The interplay of the different capture mechanisms (diffusion, impaction, sieving) results in good capture results of the smallest (1–20 nm) and the largest (>1000 nm) MLFs; while MLFs 100–200 nm in size substantially penetrate HEPA and all other filters [28].
We recently developed a new electrospun filtering material comprising extremely thin (6–20 nm) nylon nanofibers with a non-random distribution of holes between the fibers. Modified electrospinning technology with gas-phase neutralization of nanofibers now enables the manufacture of filters with threshold-type penetration; all particles and MLFs larger than 120–150 nm are captured completely, and about 70% of the smaller ones are captured [28]. We found that the high curvature of the nanofiber surface results in extremely low protein adsorption on such fibers, so all proteins from the captured particles are completely and rapidly released upon washing (unpublished data).
This filtering material is now used in disposable devices to collect MLFs from patients with pulmonary tuberculosis. Figures 1(a) and (b) present images of the device in assembled and exploded views. Inhaled air is filtered through a commercial mask that stops 95%–99% of the exogeneous aerosols. In some modifications, an additional buffering elastic bag is added to allow collection of sputum microdroplets generated by coughing (figure 1(a)). After collection, the filters are removed from the holder and washed. Because the amount of nylon material in each filter is tiny (∼20 μg), the filter can be completely washed with a small volume (10–100 μL) of water, resulting in a high concentration of biomarkers for further analysis. We will present further examples of using such filters to analyse TB biomarkers in probes collected from patients with pulmonary tuberculosis.
Figure 1.
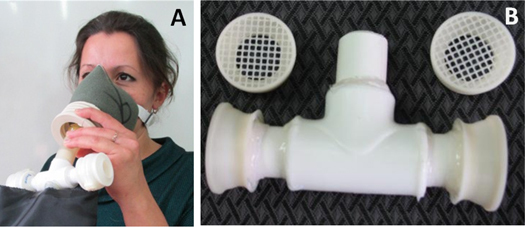
Disposable filters used for collecting MLFs from patients in tuberculosis clinics. (a) Collection of exhaled MLFs with a disposable filter. (b) Holder for two filters.
4.3. Impactors
The collection of MLFs on an impactor is based on their inertial properties, which do not allow them to follow the air flow when the jet direction changes abruptly. Compared to EBC devices and filters, collection by impaction requires a powerful pump to accelerate the exhaled air. The theory behind this type of collection predicts that the higher the air speed in the jet, the smaller the MLFs that are collected [33, 34]. Typically, at the highest speed, a 50% cut-off is achieved for MLFs 300–400 nm in size [33]. Thus, smaller MLFs will be underrepresented in the collected probes. Despite these limitations, impactors attract much attention because of their simplicity, ability to separate MLFs of different sizes, high collection speed, and high concentration of material washed from the substrate. Impactors have been used to analyse dry residues of MLFs by electron microscopy [10], to collect phospholipids in exhaled MLFs for analysis by mass spectrometry [35], and to collect exhaled microbes and viruses as well as their biomarkers [36, 37]. When exhaled air is mixed with air super-saturated with water vapor, the size of the MLFs may be increased upon vapor condensation to allow MLFs as small as 50 nm to be collected by impaction [37].
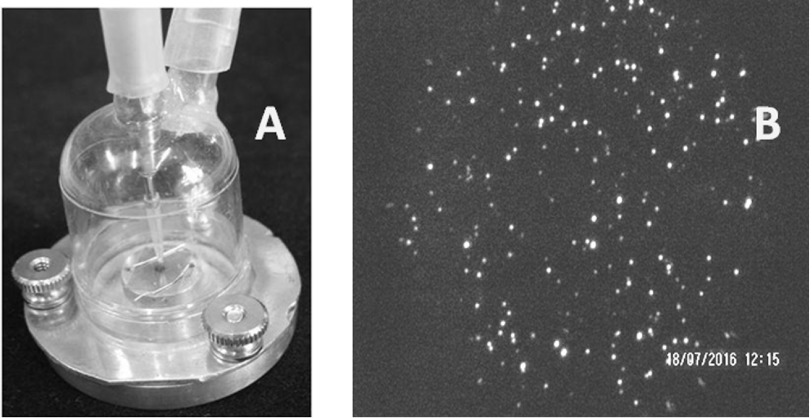
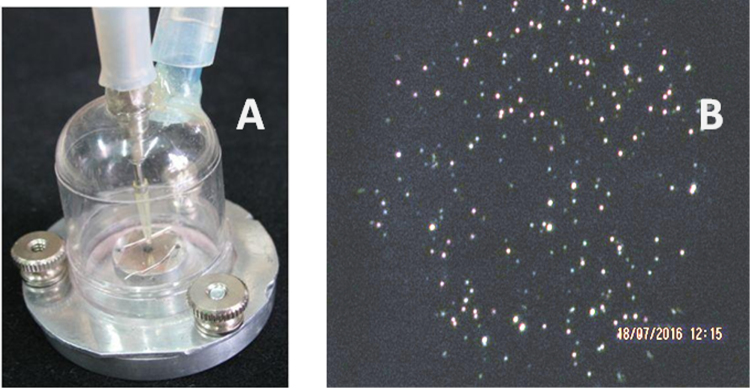
We recently designed and tested a simple impactor for collecting MLFs (see figure 2(a)). It consisted of a thermostated metal base to which a plastic dumbbell-shaped cap is attached with screws. The air is pumped from the cap at a rate of 2.2 l min−1, while exhaled air is fed in through a tube with an inner diameter of 0.7 mm and accelerates to ∼100 m s−1, so that 50% of MLFs with a size of 470 nm are captured [23].
Figure 2.
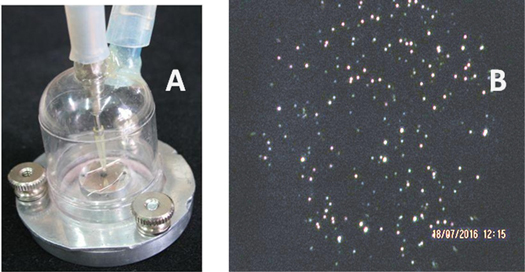
(a) Image of a simple impactor with a thermostated aluminum base enabling control of substrate temperature. (b) Dark-field image of dry residues of MLFs collected on a mica surface at a substrate temperature of 45 °C and a flow rate of 2.2 l min−1.
Collection efficiency depends on a few factors, such as the type of substrate and its temperature, the flow rate, the humidity, and temperature of the exhaled air. At a substrate temperature higher than 45 °C, collected dry residues of MLFs are visible on a transparent substrate (mica, glass) under an optical microscope with dark-field illumination, as illustrated in figure 2(b).
The images of dry residues in figures 3(a) and (b) illustrate that the substrate temperature affects their shape substantially: dry residue particles (DRPs) collected on mica at room temperature have splashes, indicating collisions of liquid MLFs (figure 3(a)), while at higher substrate temperatures the DRPs are compact and surrounded by pools of lipid (figure 3(b)).
Figure 3.
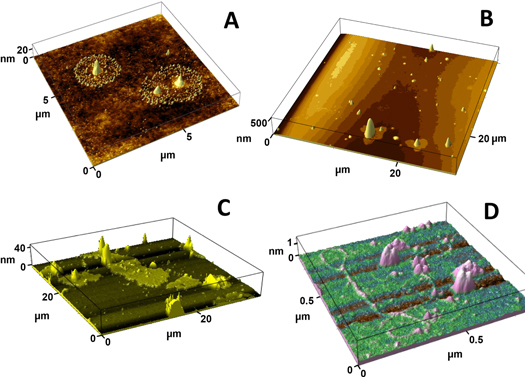
Images of dry residues of exhaled MLFs collected on a mica surface under various conditions using the impactor shown in figure 2(a). (a) After collection on mica at 22 °C. (b) After collection on mica heated to 50 °C. (c) and (d) Images of structures after collection at 45 °C followed by briefly wetting the mica surface by breathing on it.
After the mica surface was briefly exposed to high humidity (by breathing on it), micron-sized pools of a lipid layer with solid inclusions (figure 3(c)) and long polymers (figure 3(d), <1 nm high, presumably mucins [38]) were found on the mica surface. These examples illustrate that atomic force microscopy (AFM) can be successfully used to study exhaled MLFs, thereby providing valuable information about the structure of the dry residues and the MLF composition. For example, the presence of mucins suggests that some of the collected MLFs originated outside of the alveoli, which are free of mucins.
4.4. Electrostatic collector
In an electrostatic collector, micro- and nano-aerosol particles and droplets are first charged in a cloud of ions created in a corona discharge, and then the charged particles are attracted electrostatically to a conducting substrate. A few reports have described the analytical application of such electro-precipitation procedures to sample airborne particles, which are then imaged under an electron microscope [39] or used to monitor environmental bioaerosols [40, 41]. To the best of our knowledge, our recent paper was the first report describing the use of an electrostatic collector to analyse dry residues of MLFs with AFM [23]. The collector allows dry residues to settle on graphite and other conducting substrates with high efficiency because it uses a special electrostatic ‘funnel’ made of a polymer mesh that directs the charged particles onto a conducting substrate to produce a highly dense deposition suitable for AFM imaging. Dry residues of individual MLFs were imaged to reveal their complex inhomogeneous internal structure and changes in shape when exposed to high humidity and to saturated chloroform vapor. Measuring the lipid volume that had spread around each particle in the chloroform vapor enabled us to prove that MLFs of different sizes are coated with a surfactant layer of similar thickness.
Like filters and impactors, an electrostatic precipitator collects both large and small MLFs. Two major drawbacks of electrostatic collectors should be mentioned: (i) their relatively slow volumetric rate [23]; and (ii) generation of radicals and other reactive oxygen species in the corona discharge, which may chemically modify biomarkers in the collected probes. The latter drawback may be substantially diminished by replacing the corona discharge with electrospray as the means to generate a cloud of small ions [42], although nobody has ever reported the applicability of such a technique to the collection of aerosols and exhaled MLFs.
5. Ultra-sensitive assay technique for detection of protein and DNA biomarkers
Reliable estimates of the amounts of non-volatile materials collected over the course of 10 min are 1–10 ng for most people [23, 31]. Obviously, each biomarker will constitute only a small fraction of this amount, and extremely sensitive techniques are required to detect specific biomarkers in the collected probes. Such techniques are well known for DNA and RNA molecules, which may be detected after polymerase chain reaction (PCR) analysis when their number in the collected probes is 10–100 molecules. In fact, DNA alterations were detected in EBC probes as biomarkers in patients with lung cancer [43] and other lung diseases [44].
Considering protein biomarkers and taking into account that (i) proteins constitute ∼10% of the total dry mass of MLFs [31] and (ii) the biomarkers of interest are not among the ‘household’ proteins, we have concluded that the limit of detection (LOD) needed to be at least 1/10 000 of the total non-volatile material collected, or less than ∼100 fg. For a typical protein with MW = 100 kDa, that means at least LOD = 10−18 moles, or 6 ×10⁵ molecules in the probe. At a typical probe volume of 0.1 ml, biomarker concentration will be as low as 10−14 M, much lower than the dissociation constant, Kd, of any known antibody, meaning that all conventional immunoassay formats like ELISA and surface plasmon resonance-based assay are unsuitable.
One way to overcome the affinity-based LOD is to apply extreme amplification, e.g. by using DNA labels and employing PCR analysis to increase signal intensity to attomolar LOD [45] and even to just 100 protein molecules [46].
5.1. Active assay methods
Yet another approach to overcome the affinity limit of antibody molecules and to decrease the LOD of the immunoassay to just a few hundred protein molecules has been developed by one of the authors [47]. It employs electrophoretic collection of charged biomarkers in a microfluidic channel formed between two dialysis membranes, one of which bears spots of antibody molecules covalently linked to the membrane surface. Once a biomarker molecule has been brought over the antibody spot by an electric field inside the 2 μm layer, the biomarker molecule becomes surrounded by highly concentrated antibody molecules. Their concentration within the 2 μm layer, ∼1 μM [48], is much larger than a typical antibody Kd. The law of mass action makes the biomarker molecule bind one or a few antibodies independently of the biomarker concentration. Those few biomarker molecules that are caught on the spots can then be detected with magnetic beads coated with a secondary antibody. This method makes it possible to bypass the limited affinity of receptor molecules and discover just a few hundred protein molecules in a 50–100 μL probe within 3–5 min [47].
5.2. Detection of tuberculosis biomarkers in exhaled breath
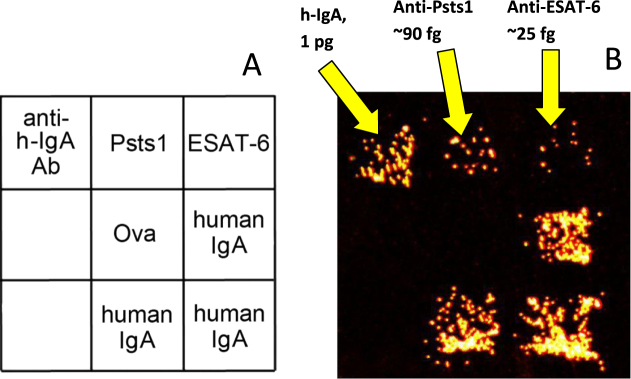
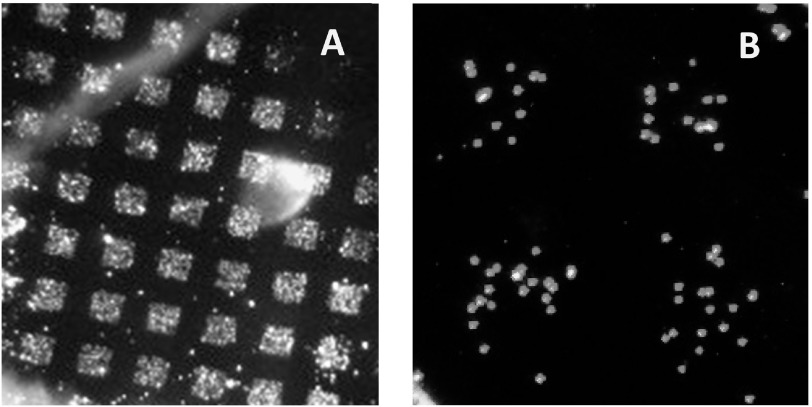
The active immunoassay technique described above was used to analyse probes of exhaled MLFs collected on the filters shown in figure 1(a). Microarrays containing spots of two antigens secreted by mycobacteria (ESAT-6 and Psts-1) and spots of human IgA and anti-hIgA antibodies were manufactured on a dialysis membrane as described earlier [48]. After collection for 10 min from air exhaled by a patient with pulmonary tuberculosis, the filters were extracted with a buffer solution and the extracts were tested for the presence of human IgA specific to each secreted antigen. The study was approved by the Ethical Committee of the Central Tuberculosis Research Institute in Moscow where the probes were collected.
Using the titration procedure described in our recent paper [48], we estimated the absolute amounts of the total IgA antibodies and the antibodies specific to each of the secreted antigens. An example of this assay for one patient with pulmonary tuberculosis is presented in figure 4(b). As can seen in the image, antibodies to the secreted mycobacterial antigens were readily detected even when their number in the probe was as low as 105 molecules.
Figure 4.
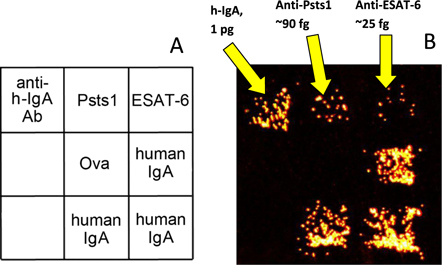
Example assay of exhaled biomarkers in a probe collected from a patient with pulmonary tuberculosis using the filter shown in figure 1(a). (a) Structure of the microarray used in the active assay. (b) Dark-field image of a pattern of microarray-bound magnetic beads coated with antibody molecules specific to human IgA after the IgA molecules were electrophoretically captured from the probe by using the procedure described in [48].
6. Limitations of diagnostics based on assay of biomarkers in the collected probes
In all recent assays, the biomarkers were analysed in whole probes collected from a single person or even from a combined probe collected by a number of volunteers, as in proteomic analysis of EBC probes [32]. Due to the extremely low concentration of biomarkers, the probes were also subjected to pre-concentration. Several drawbacks of this conventional approach to analysis of MLFs should be emphasized. First, certain biomarkers from a limited infection zone are diluted with multiple household proteins from MLFs emerging from a ‘healthy’ lung. Numerous household proteins might interfere with the immunoassay and the assay of DNA biomarkers by PCR analysis. Second, it is impossible to determine in the whole probe what fraction of MLFs (big or small) bears useful biomarkers. Third, it is impossible to attribute a combination of different biomarkers to a certain fraction of MLFs. Such considerations prompted us to suggest an alternative approach to the analysis of biomarkers in which the biomarkers are analysed in individual MLFs.
7. Analysis of separate MLFs and dry residues
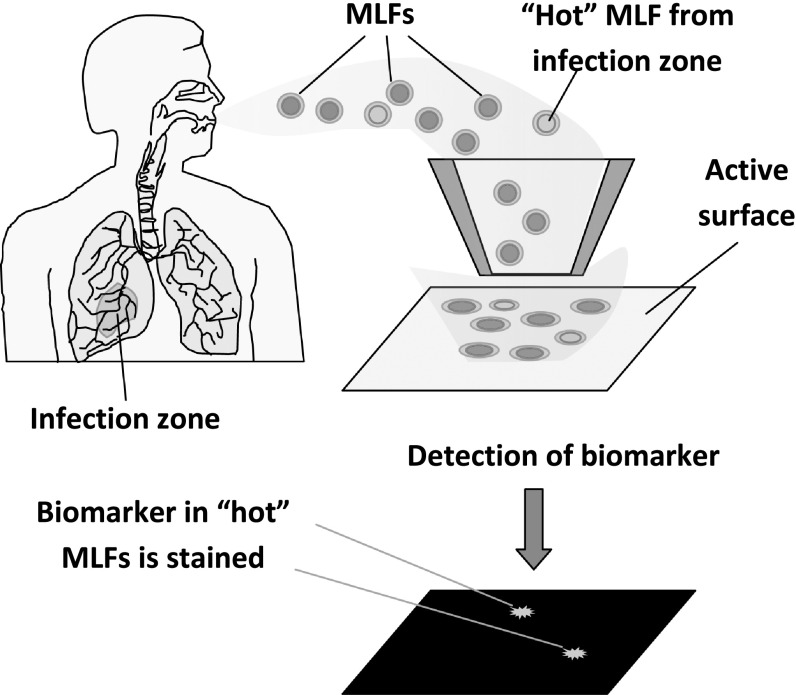
The new approach is schematically illustrated in figure 5. We suggest that each MLF or its dry residue be collected on a surface using an electrostatic collector or impactor. All protein molecules are covalently attached to the pre-activated substrate surface, and certain biomarkers are further detected using sensitive probes. Such probes may be fabricated by linking biomarker-specific antibodies and other receptor molecules with known ability to recognize biomarkers (e.g., concanavalin a to detect glycoproteins) to a sensitive label enabling single molecule detection. Examples of ultra-sensitive detection have been reported for gold nanoparticles [49] and for magnetic beads [47] as such labels.
Figure 5.
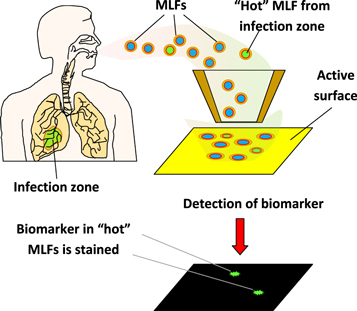
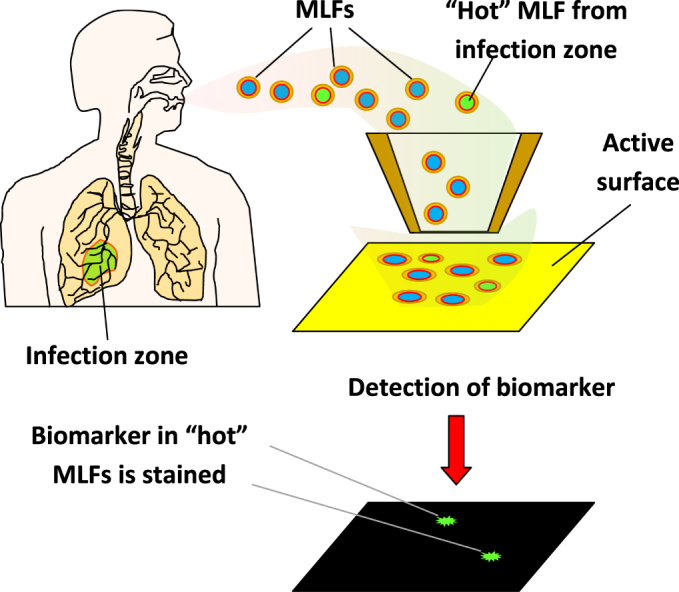
Principle of diagnostics based on detection of biomarkers in each individual exhaled microdroplet.
7.1. Assay of h-IgA molecules in separate MLFs
In a proof-of-principle experiment, exhaled microdroplets were collected by impactor on an activated surface, and all the proteins were linked to the surface in a humid chamber. IgA molecules were then detected among the other proteins immobilized. Collection was onto a glass substrate coated with a layer of cross-linked carboxymethyl cellulose (CMC) freshly activated with EDC/NHS (1-ethyl-3-(3-dimethylamino) propyl carbodiimide and N-hydroxysuccinimide) as described in our recent paper [50]. MLFs were deposited through a metal grid (150 mesh, for a transmission electron microscope) using the impactor shown in figure 2(a). The microarray of deposited dry residues is shown in figure 6(a). After deposition, the CMC substrate was placed into a humid chamber for 1 h to allow protein molecules to link by reacting with NHS esters on the surface. The surface was then blocked in 0.5 M glycine solution, pH = 9.0.
Figure 6.
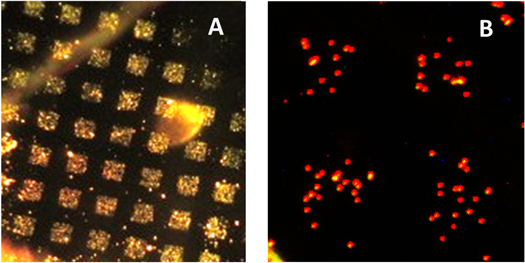
(a) Microarray of MLFs deposited on a CMC surface through a metal grid using the impactor shown in figure 2(a). The image was taken under dark-field illumination. (b) Pattern of magnetic beads coated with anti-hIgA left on the surface after the beads contacted the microarray.
Magnetic beads (MyOne, Invitrogen, Carslbad, CA) coated with antibodies against human IgA were suspended in phosphate buffered saline buffer with 0.5% polyvinyl alcohol and 0.5% polyvinylpyrrolidone, and a droplet of the suspension was then placed onto the substrate to allow the beads to settle on the surface. Free beads were then carefully washed off the surface, leaving the pattern of bound magnetic beads presented in figure 6(b). In control experiments, when human IgA was added to the suspension of magnetic beads before it was applied to the microarray, no pattern was observed. This result supports the idea that specific antigen–antibody bonds hold the magnetic beads, as shown in figure 6(b).
8. Trends and future directions
Refinement in the instrumentation used to collect MLFs and increases in the sensitivity of assay techniques used to analyse collected material are noted trends in the development of diagnostics by exhaled air. When the LOD reaches the level of a few biomarker molecules, a qualitatively different approach may be realized in which the presence of biomarkers in each collected microdroplet may be detected. With this approach, MLFs formed in different locations may be identified by size, presence of certain indicators (e.g., mucins) and set of biomarkers inherent to a particular infection.
However, multiple technological problems need to be solved to ensure that detection is reliable and the positions of the deposited ‘hot’ MLFs and bound biomarker molecules correlate, as illustrated in the schematic in figure 5. First, a substrate with special properties needs to be developed including: (i) low surface roughness to preclude loss of biomarkers in the surface voids and crevices; (ii) controllable wettability; (iii) the presence of chemical entities enabling covalent linking of proteins, DNAs and other biomarkers of interest to the surface; (iv) a lack of non-specific interactions with magnetic beads, quantum dots and other labels used in detection. Second, biospecific labels enabling detection of biomarkers with extremely low LOD are needed, such as magnetic beads or Q-dots modified with antibodies. Besides using particles to label the collected biomarkers, these may also be discovered with specific scanning probe techniques: AFM with cantilever tips coated with specific antibodies; tip-enhanced Raman spectroscopy [51, 52]; and scanning tunneling spectroscopy [53]. All these techniques have the ability to detect a limited number of biomarker molecules.
The development of non-invasive diagnostics of lung diseases is an exciting example of truly multi-disciplinary research in which biology, medicine, physics and chemistry are intermixed; progress is dependent on understanding the fundamentals of lung anatomy, breathing physiology, aerosol physics and on the development of ultra-sensitive analytical techniques. Once the multiple technological problems are solved, we could obtain a new instrument for the painless and easy diagnosis of lung diseases that makes it possible to screen across large population groups and evaluate the environmental effects of atmospheric pollution on human health [7].
Acknowledgments
The authors acknowledge funding from the Russian Science Foundation (grant 15-15-00086). The authors appreciate fruitful discussions with Igor Kanev, a member of the Laboratory of Nanostructures and Nanotechnology. We are grateful to Dr Tamara Morozova for her help in preparing the manuscript and to Jennifer Guernsey for her assistance in manuscript editing.
References
- 1.Underwood E. The polluted brain. Science. 2017;355:342–5. doi: 10.1126/science.355.6323.342. [DOI] [PubMed] [Google Scholar]
- 2.Chena Y, Ebenstein A, Greenstone M, Lie H. Evidence on the impact of sustained exposure to air pollution on life expectancy from China’s Huai River policy. Proc. Natl Acad. Sci. 2013;110:12936–41. doi: 10.1073/pnas.1300018110. [DOI] [PMC free article] [PubMed] [Google Scholar]
- 3.Lelieveld J, Evans J S, Fnais M, Giannadaki D, Pozzer A. The contribution of outdoor air pollution sources to premature mortality on a global scale. Nature. 2015;525:367–71. doi: 10.1038/nature15371. [DOI] [PubMed] [Google Scholar]
- 4.Wes J J, et al. What we breathe impacts our health: improving understanding of the link between air pollution and health. Environ. Sci. Technol. 2016;50:4895–904. doi: 10.1021/acs.est.5b03827. [DOI] [PubMed] [Google Scholar]
- 5.Winokur R S, Pua B B, Sullivan B W, Madoff D C. Percutaneous lung biopsy: technique, efficacy, and complications. Semin. Intervent. Radiol. 2013;30:121–7. doi: 10.1055/s-0033-1342952. [DOI] [PMC free article] [PubMed] [Google Scholar]
- 6.Meyer K C, Raghu G. Bronchoalveolar lavage for the evaluation of interstitial lung disease: is it clinically useful? Eur. Res. J. 2011;38:761–9. doi: 10.1183/09031936.00069509. [DOI] [PubMed] [Google Scholar]
- 7.Pleil J D, Stiegel M A. Evolution of environmental exposure science: using breath-borne biomarkers for ‘discovery’ of the human exposome. Anal. Chem. 2013;85:9984–90. doi: 10.1021/ac402306f. [DOI] [PubMed] [Google Scholar]
- 8.Neuhaus S, Seifert L, Vautz W, Nolte J, Bufe A, Peters M. Comparison of metabolites in exhaled breath and bronchoalveolar lavage fluid samples in a mouse model of asthma. J. Appl. Physiol. 2011;111:1088–95. doi: 10.1152/japplphysiol.00476.2011. [DOI] [PubMed] [Google Scholar]
- 9.Nakhleh M K, et al. Diagnosis and classification of 17 diseases from 1404 subjects via pattern analysis of exhaled molecules. ACS Nano. 2017;11:112–25. doi: 10.1021/acsnano.6b04930. [DOI] [PMC free article] [PubMed] [Google Scholar]
- 10.Papineni R S, Rosenthal F S. The size distribution of droplets in the exhaled breath of healthy human subjects. J. Aerosol. Med. 1997;10:105–16. doi: 10.1089/jam.1997.10.105. [DOI] [PubMed] [Google Scholar]
- 11.Johnson G R, Morawska L. The mechanism of breath aerosol formation. J. Aerosol Med. Pulm. Drug Deliv. 2009;22:229–37. doi: 10.1089/jamp.2008.0720. [DOI] [PubMed] [Google Scholar]
- 12.Janicka M, Kot-Wasik A, Kot J, Namiesnik J. Isoprostanes-biomarkers of lipid peroxidation: their utility in evaluating oxidative stress and analysis. Int. J. Mol. Sci. 2010;11:4631–59. doi: 10.3390/ijms11114631. [DOI] [PMC free article] [PubMed] [Google Scholar]
- 13.Haslbeck K, Schwarz K, Hohlfeld J M, Seume J R, Koch W. Submicron droplet formation in the human lung. J. Aerosol Sci. 2010;41:429–38. doi: 10.1016/j.jaerosci.2010.02.010. [DOI] [Google Scholar]
- 14.Bondesson E, Jonsson L T, Bengtsson T, Wollmer P. Exhaled breath condensate—site and mechanism of formation. J. Breath Res. 2009;3:016005. doi: 10.1088/1752-7155/3/1/016005. [DOI] [PubMed] [Google Scholar]
- 15.Holmgren E, Gerth E, Ljungstrom A C, Almstrand P, Larsson B, Bake A C, Olin A C. Effects of breath holding at low and high lung volumes on amount of exhaled particles. Respir. Physiol. Neurobiol. 2013;185:228–34. doi: 10.1016/j.resp.2012.10.010. [DOI] [PubMed] [Google Scholar]
- 16.Pasterkamp H, Kraman S S, Wodicka G R. Respiratory sounds. Advances beyond the stethoscope. Am. J. Respir. Crit. Care Med. 1997;156:974–87. doi: 10.1164/ajrccm.156.3.9701115. [DOI] [PubMed] [Google Scholar]
- 17.Alencar A M, Majumdar A M, Hantos Z, Buldyrev S V, Stanley Y E, Suki B. Crackles and instabilities during inflation. Physica A . 2005;357:18–26. doi: 10.1016/j.physa.2005.05.047. [DOI] [Google Scholar]
- 18.Edwards D A, Man J C, Brand P, Katstra J P, Sommerer K, Stone H A, Nardell E, Scheuch G. Inhaling to mitigate exhaled bioaerosols. Proc. Natl Acad. Sci. 2004;101:17383–8. doi: 10.1073/pnas.0408159101. [DOI] [PMC free article] [PubMed] [Google Scholar]
- 19.Namati E, Thiesse J, de Ryk J, McLennan G. Alveolar dynamics during respiration. Are pores of Kohn a pathway to recruitment? Am. J. Respir. Cell. Mol. Biol. 2008;38:572–8. doi: 10.1165/rcmb.2007-0120OC. [DOI] [PMC free article] [PubMed] [Google Scholar]
- 20.Ullah S, Sandqvist S, Beck O. Measurement of lung phosphatidylcholines in exhaled breath particles by a convenient collection procedure. Anal. Chem. 2015;87:11553–60. doi: 10.1021/acs.analchem.5b03433. [DOI] [PubMed] [Google Scholar]
- 21.Uhliarova B, Svec M, Calkovska A. Surfactant and its role jn the upper respiratory system and eustachian tube. Acta Medica Martiniana. 2012;12:12–21. doi: 10.2478/v10201-011-0028-2. [DOI] [Google Scholar]
- 22.Geiser M, Schurch S, P Gehr P. Influence of surface chemistry and topography of particles on their immersion into the lung’s surface lining layer. J. Appl. Physiol. 2003;94:1793–801. doi: 10.1152/japplphysiol.00514.2002. [DOI] [PubMed] [Google Scholar]
- 23.Morozov V N, Mikheev A Y. A collection system for dry solid residues from exhaled breath for analysis via atomic force microscopy. J. Breath Res. 2017;11:016006. doi: 10.1088/1752-7163/aa5359. [DOI] [PubMed] [Google Scholar]
- 24.Bi X, Taneva S, Keough K M W, Mendelsohn R, Flach C R. Thermal stability and DPPC/Ca2+ interactions of pulmonary surfactant SP-A from bulk-phase and monolayer IR spectroscopy. Biochemistry. 2001;40:13659–69. doi: 10.1021/bi011188h. [DOI] [PubMed] [Google Scholar]
- 25.Kubán P, Foret F. Exhaled breath condensate: Determination of non-volatile compounds and their potential for clinical diagnosis and monitoring. A review. Analytica Chimica Acta. 2013;805:1–18. doi: 10.1016/j.aca.2013.07.049. [DOI] [PubMed] [Google Scholar]
- 26.Tinglev S, Ullah G, Ljungkvist E, Viklund A C, Olin O, Beck O. Characterization of exhaled breath particles collected by an electret filter technique. J. Breath Res. 2016;10:026001. doi: 10.1088/1752-7155/10/2/026001. [DOI] [PubMed] [Google Scholar]
- 27.Beck O, Stephanson N, Sandqvist S, Frank J. Detection of drugs of abuse in exhaled breath using a device for rapid collection: comparison with plasma, urine and self-reporting in 47 drug users. J. Breath Res. 2013;7:026006. doi: 10.1088/1752-7155/7/2/026006. [DOI] [PubMed] [Google Scholar]
- 28.Mikheev A Y, Shlyapnikov Y M, Kanev I L, Avseenko A V, Morozov V N. Filtering and optical properties of free standing electrospun nanomats from nylon-4,6. Eur. Polymer J. 2016;75:317–28. doi: 10.1016/j.eurpolymj.2016.01.001. [DOI] [Google Scholar]
- 29.Effros R M, Dunning M B, Biller J, Shaker R. The promise and perils of exhaled breath condensate. Am. J. Physiol. Lung Cell Mol. Physiol. 2004;287:L1073–80. doi: 10.1152/ajplung.00069.2004. [DOI] [PubMed] [Google Scholar]
- 30.Konstantinidi E M, Lappas A S, Tzortzi A S, Behrakis P K. Exhaled breath condensate: technical and diagnostic aspects. Sci. World J. 2015;2015:25. doi: 10.1155/2015/435160. [DOI] [PMC free article] [PubMed] [Google Scholar]
- 31.Bredberg A, Gobom J, Almstrand A C, Larsson P, Blennow K, Olin A C, Mirgorodskaya E. Exhaled endogenous particles contain lung proteins. Clinical Chem. 2012;58:431–40. doi: 10.1373/clinchem.2011.169235. [DOI] [PubMed] [Google Scholar]
- 32.Muccillia V, Salettia R, Cunsoloa V, Hob J, Gilic E, Contec E, Sichilic S, Vancheric C, Foti S. Protein profile of exhaled breath condensate determined by high resolution mass spectrometry. J. Pharm. Biomed. Anal. 2015;105:134–49. doi: 10.1016/j.jpba.2014.11.050. [DOI] [PubMed] [Google Scholar]
- 33.Marple V A, Liu B Y H. Characteristics of laminar jet impactors. Environ. Sci. Technol. 1974;8:648–54. doi: 10.1021/es60092a003. [DOI] [Google Scholar]
- 34.Hinds W C. Aerosol Technology: Properties, Behavior, and Measurement of Airborne Particles. 2nd edn. New York: Wiley; 1999. [Google Scholar]
- 35.Almstrand A C, Ljungstrom E, Lausmaa J, Bake B, Sjovall P, Olin A C. Airway monitoring by collection and mass spectrometric analysis of exhaled particles. Anal. Chem. 2009;81:662–8. doi: 10.1021/ac802055k. [DOI] [PubMed] [Google Scholar]
- 36.Xu Z, Shen F, Li X, Wu Y, Chen Q, Jie X, Yao M. Molecular and microscopic analysis of bacteria and viruses in exhaled breath collected using a simple impaction and condensing method. PLoS ONE. 2012;7:e41137. doi: 10.1371/journal.pone.0041137. [DOI] [PMC free article] [PubMed] [Google Scholar]
- 37.McDevitt J J, Koutrakis P, Ferguson S T, Wolfson J M, Fabian M P, Martins M, Pantelic J, Milton D K. Development and performance evaluation of an exhaled-breath bioaerosol collector for influenza virus. Aerosol Sci. Technol. 2013;47:444–51. doi: 10.1080/02786826.2012.762973. [DOI] [PMC free article] [PubMed] [Google Scholar]
- 38.Zappone B, Patil N J, Madsen J B, Pakkanen K I, Lee S. Molecular structure and equilibrium forces of bovine submaxillary mucin adsorbed at a solid–liquid interface. Langmuir. 2015;31:4524–33. doi: 10.1021/acs.langmuir.5b00548. [DOI] [PubMed] [Google Scholar]
- 39.Miller A, Frey G, King G, Sunderman C. A handheld electrostatic precipitator for sampling airborne particles and nanoparticles. Aerosol Sci. Technol. 2010;44:417–27. doi: 10.1080/02786821003692063. [DOI] [Google Scholar]
- 40.Tan M, Shen F, Yao M, Zhu T. Development of an automated electrostatic sampler (AES) for bioaerosol detection. Aerosol Sci. Technol. 2011;45:1154–60. doi: 10.1080/02786826.2011.582193. [DOI] [Google Scholar]
- 41.Park J W, Kim H R, Hwang J. Continuous and real-time bioaerosol monitoring by combined aerosol-to-hydrosol sampling and ATP bioluminescence assay. Anal. Chim. Acta. 2016;941:101e107. doi: 10.1016/j.aca.2016.08.039. [DOI] [PubMed] [Google Scholar]
- 42.Teppera G, Kessick R. A study of ionization and collection efficiencies in electrospray-based electrostatic precipitators. Aerosol Sci. 2008;39:609–17. doi: 10.1016/j.jaerosci.2008.03.005. [DOI] [Google Scholar]
- 43.Carpagnano G E, Pia Foschino-Barbaro M, Spanevello A, Resta O, Carpagnano F, Mule G, Pinto R, Tommasi S, Paradiso A. 3p Microsatellite signature in exhaled breath condensate and tumor tissue of patients with lung cancer. Am. J. Respir. Crit. Care Med. 2008;177:337–41. doi: 10.1164/rccm.200707-1136OC. [DOI] [PubMed] [Google Scholar]
- 44.Carpagnano G E, Lacedonia D, Carone M, Soccio P, Cotugno G, Palmiotti G A, Scioscia G, Foschino Barbaro M P. Study of mitochondrial DNA alteration in the exhaled breath condensate of patients affected by obstructive lung diseases. J. Breath Res. 2016;10:026005. doi: 10.1088/1752-7155/10/2/026005. [DOI] [PubMed] [Google Scholar]
- 45.Nam J M, Thaxton C S, Mirkin C A. Nanoparticle-based bio–bar codes for the ultrasensitive detection of proteins. Science. 2003;301:1884–6. doi: 10.1126/science.1088755. [DOI] [PubMed] [Google Scholar]
- 46.Zhang H, Li X F, Le X C. Binding-induced DNA assembly and its application to yoctomole detection of proteins. Anal. Chem. 2012;84:877–84. doi: 10.1021/ac203207g. [DOI] [PubMed] [Google Scholar]
- 47.Morozov V N, Groves S, Turell M J, Bailey C. Three minutes-long electrophoretically assisted zeptomolar microfluidic immunoassay with magnetic beads detection. J. Am. Chem. Soc. 2007;129:12628–9. doi: 10.1021/ja075069m. [DOI] [PubMed] [Google Scholar]
- 48.Shlyapnikov Y M, Morozov V N. Titration of trace amounts of immunoglobulins in a microarray-based assay with magnetic labels. Chim. Acta. 2017;966:47–53. doi: 10.1016/j.aca.2017.02.037. [DOI] [PubMed] [Google Scholar]
- 49.Nam J W, Thaxton C S, Mirkin C A. Nanoparticle-based bio–bar codes for the ultrasensitive detection of proteins. Science. 2003;301:1884–6. doi: 10.1126/science.1088755. [DOI] [PubMed] [Google Scholar]
- 50.Shlyapnikov Y M, Shlyapnikova E A, Morozov V N. Carboxymethylcellulose film as a substrate for microarray fabrication. Anal. Chem. 2014;86:2082–9. doi: 10.1021/ac403604j. [DOI] [PubMed] [Google Scholar]
- 51.Jiang N, Kurouski D, Pozzi E A, Chiang N, Hersam M C, Van Duyne R P. Tip-enhanced Raman spectroscopy: from concepts to practical applications. Chem. Phys. Lett. 2016;659:16–24. doi: 10.1016/j.cplett.2016.06.035. [DOI] [Google Scholar]
- 52.Kumar N, Mignuzzi S, Su W, Roy D. Tip-enhanced Raman spectroscopy: principles and applications. EPJ Techniques and Instrumentation. 2015;2:9. doi: 10.1140/epjti/s40485-015-0019-5. [DOI] [Google Scholar]
- 53.Di Ventra M, Taniguchi M. Decoding DNA, RNA and peptides with quantum tunneling. Nat. Nanotechnol. 2016;11:117–26. doi: 10.1038/nnano.2015.320. [DOI] [PubMed] [Google Scholar]


