

Abstract
The ability to predict the impact of cis-regulatory sequence on gene expression would facilitate discovery in fundamental and applied biology. Here, we combine polysome profiling of a library of 280,000 randomized 5′ UTRs with deep learning to build a predictive model that relates human 5′ UTR sequence to translation. Together with a genetic algorithm, we use the model to engineer new 5′ UTRs that accurately direct specified levels of ribosome loading, providing the ability to tune sequences for optimal protein expression. We show that the same approach can be extended to chemically modified RNA, an important feature for applications in mRNA therapeutics and synthetic biology. We test 35,000 truncated human 5′ UTRs and 3,577 naturally occurring variants and show that the model predicts ribosome loading of these sequences. Finally, we provide evidence of 45 SNVs associated with human diseases that substantially change ribosome loading and thus may represent a molecular basis for disease.
The sequence of the 5′ untranslated region (5′ UTR) is a primary determinant of translation efficiency1,2. While many cis-regulatory elements within human 5′ UTRs have been characterized individually, the field still lacks a means to accurately predict protein expression from 5′ UTR sequence alone, limiting the ability to estimate the effects of genome-encoded variants and the ability to engineer 5′ UTRs for precise translation control. Massively parallel reporter assays (MPRAs) – methods that assess thousands to millions of sequence variants in a single experiment – coupled with machine learning have proven useful in addressing similar voids by producing quantitative biological insight that would be difficult to achieve through traditional approaches3–9.
Earlier MPRAs designed to learn aspects of 5′ UTR cis-regulation relied on FACS10,11 or growth selection12 to stratify libraries by activity. These techniques require the expression of a single library variant per cell that must be transcribed within the cell from a DNA template, making it difficult to distinguish between the effects of transcriptional and translational control. Polysome profiling13 overcomes this limitation by enabling single cells to translate tens to hundreds of in vitro transcribed (IVT) and transfected mRNA variants. Polysome profiling has been used extensively to measure translation of native RNA isoforms14,15 but isolating the role of 5′ UTR regulation has been difficult due to differences in the size and sequence of the concomitant coding sequences and 3′ UTRs.
Here we report the development of an MPRA that measures the translation of hundreds of thousands of randomized 5′ UTRs via polysome profiling and RNA sequencing. We then use the data to train a convolutional neural network (CNN) that can predict ribosome loading from sequence alone.
Results
MPRA design and validation
To build a model capable of predicting the ribosome loading of human 5′ UTR variants and designing new 5′ UTRs for targeted expression (Fig. 1a), we first created a 280,000-member gene library with random 5′ UTRs but constant eGFP coding sequence and 3′ UTR (Fig. 1b). Specifically, the 5′ UTR of each construct begins with 25 nucleotides of defined sequence used for PCR amplification, followed by 50 nucleotides of fully random sequence before the eGFP coding sequence. HEK293T cells were transfected with IVT library mRNA and harvested after 12 hours. Polysome fractions were collected and sequenced (Supplementary Fig. 1). For a given UTR, the relative counts per fraction were multiplied by the number of ribosomes associated with each fraction and then summed to obtain a measured Mean Ribosome Load (MRL) (Supplementary Note 1). Below, we refer to the entire workflow required to measure the MRL of all 5′ UTRs in a library, i.e. library transfection, polysome profiling, high-throughput sequencing and MRL analysis, as a “polysome profiling experiment”. We initially focused on the first 50 bases upstream of the CDS to specifically investigate the regulatory signals that mediate the initiation of translation beyond ribosomal recruitment to the 5′ cap. Intriguingly, variants within the 50 nt window directly adjacent to the start codon are under stronger negative selection than those further upstream16, providing another motivation to focus on this window.
Figure 1.
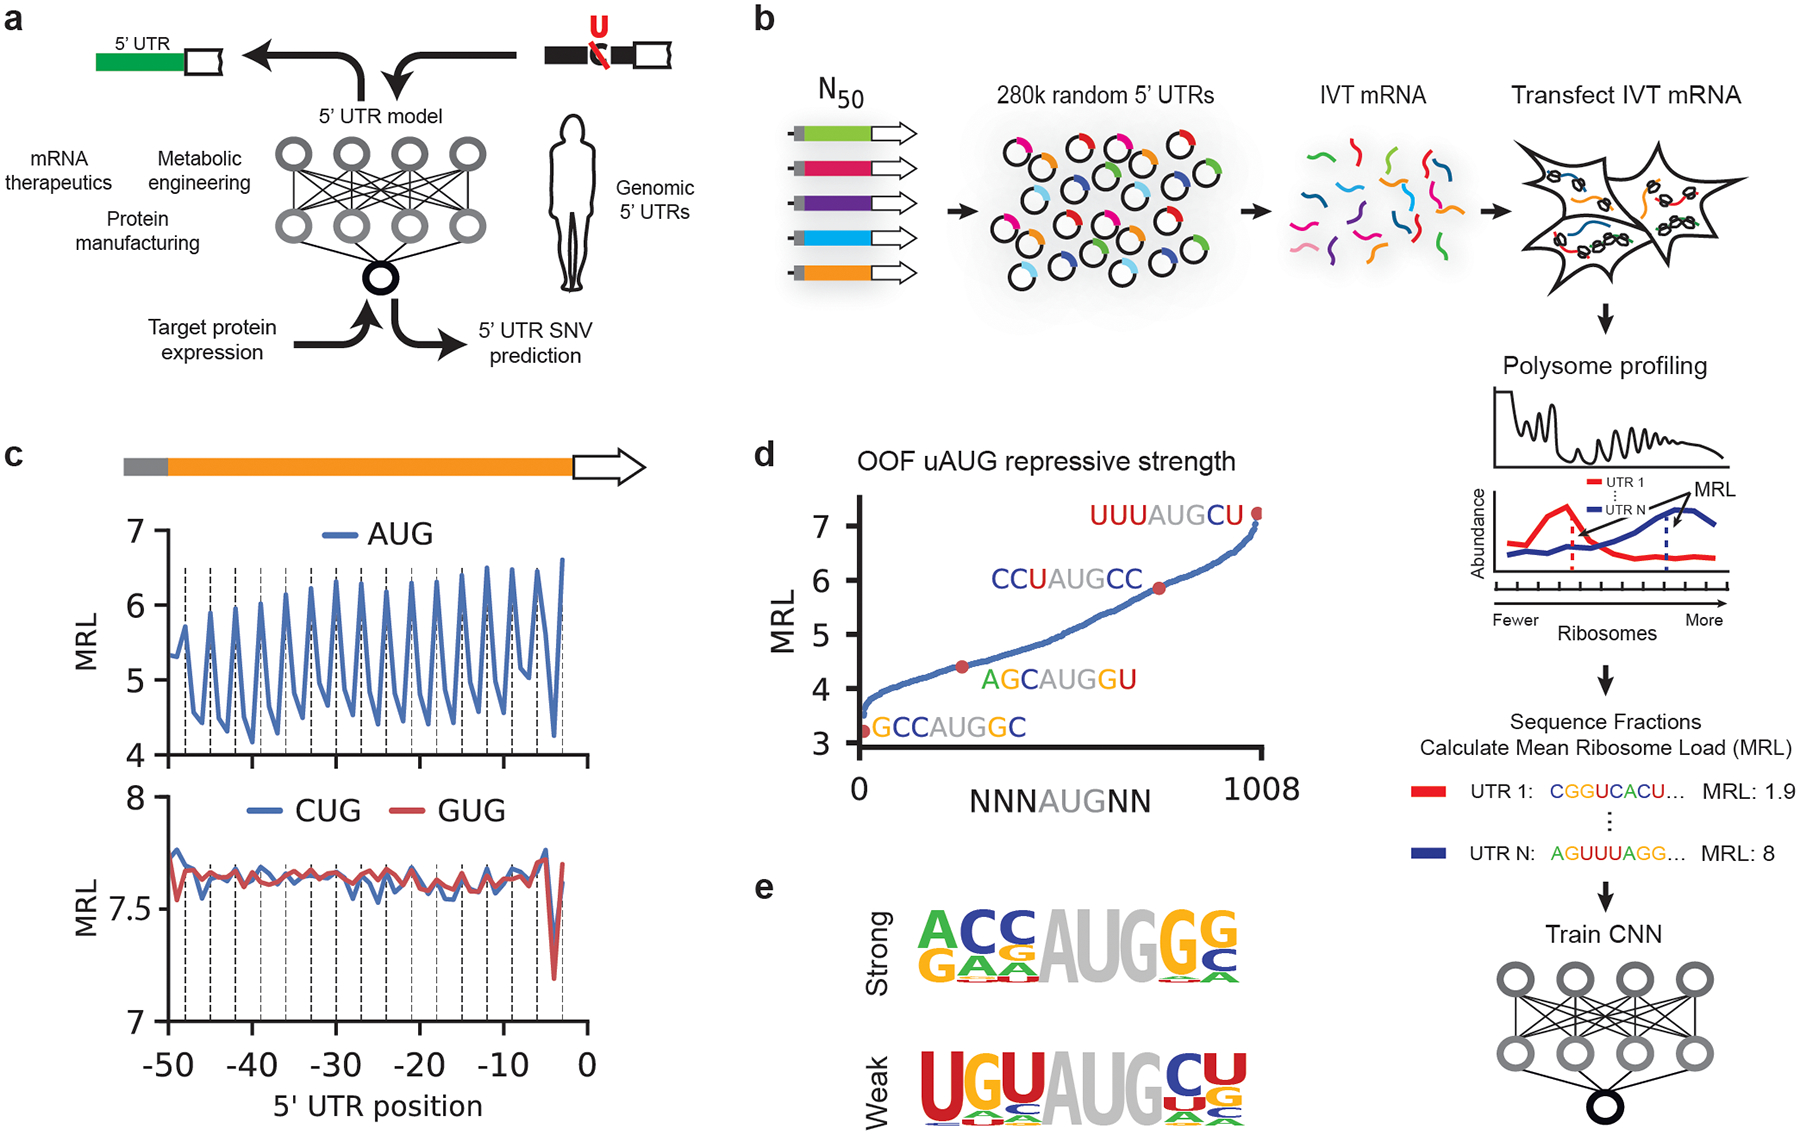
A library of 280,000 random 50-mers as 5′ UTRs for eGFP. (a) A 5′ UTR model capable of predicting translation from sequence is used to evaluate the effect of 5′ UTR SNVs and to engineer new sequences for optimal protein expression. (b) A library of 280,000 members was built by inserting a T7 promoter followed by 25 nt of defined 5′ UTR sequence, a random 50-mer, and the eGFP coding sequence into a plasmid backbone. Library IVT mRNA was produced by in vitro transcription from a linearized DNA template obtained through PCR from the plasmid library. Cells transfected with library IVT mRNA were grown for 12 hours before polysome profiling. Read counts per fraction were used to calculate Mean Ribosome Loads (MRL) for each UTR and the resulting data were used to train a convolutional neural network (CNN). (c) Out-of-frame upstream AUGs (uAUGs) reduce ribosome loading (vertical lines indicate positions that are in-frame with the eGFP CDS). A similar but much weaker periodicity is observed for CUG and GUG. (d) The repressive strength of all out-of-frame variations of NNNATGNN. (e) Nucleotide frequencies were calculated for the 20 most repressive (‘strong’) and least repressive (‘weak’) TIS sequences.
To validate our approach, we asked whether it captured known aspects of translation regulation. Translation initiation is largely dependent on start codons and their context and position relative to a CDS12,17. Our data clearly show the expected decrease in ribosome loading for sequences with either out-of-frame upstream start codons (uAUGs) (Fig. 1c) or upstream open reading frames (uORFs) (Supplementary Fig. 2b)18,19. On average, we observed considerably lower use of CUG and GUG as alternative start codons compared to AUG (Fig. 1c and Supplementary Figs. 3 and 4) unlike other reports that show widespread usage of non-AUG start sites15,20,21, possibly because these alternative start codons are used more often under stress conditions22. Still, we found that CUG and GUG start codons can impact ribosome loading, especially when surrounded by strong sequence context (Supplementary Figs. 3 and 4). The region surrounding the start codon, known as the translation initiation site (TIS) or the Kozak sequence, is a primary determinant of whether a ribosome will begin translation. We scored the repressive strength of all out-of-frame TISs by finding the mean MRL of sequences with all permutations of NNNAUGNN (except where NNN is AUG) (Fig. 1d). Using the 20 most repressive and 20 least repressive sequences, we calculated nucleotide frequencies for the strongest and weakest TISs. This analysis recapitulated the importance of a purine (A or G) at position −3 relative to AUG and a G at +4 (Fig. 1e)10,23,24. Ultimately, these data suggest that each TIS sequence can uniquely tune translation initiation to a fine degree. Translation initiation and elongation is also affected by RNA secondary structure that forms within 5′ UTRs and coding sequences, with strong structures showing the most negative effect on translation17,25. By calculating UTR minimum free energies (MFE)26 and comparing them to UTR MRLs, we captured and quantitated this repressive effect of secondary structure on ribosome load (Supplementary Fig. 2c)17,25.
Modeling 5′ UTRs and ribosome loading
We set out to develop a model, Optimus 5-Prime (Supplementary Code), that could quantitatively capture the relationship between 5′ UTR sequences and their associated MRLs. To this end, we trained a convolutional neural network (CNN) with 260,000 of the 280,000-member eGFP library. The remaining 20,000 sequences were withheld for testing. After an exhaustive grid search to find optimal hyperparameters (Fig. 2a, Online Methods), Optimus 5-Prime could explain 93% of MRL variation in the test set (Fig. 2b). A model trained on data from another polysome profiling experiment performed similarly (Supplementary Fig. 5a). By comparison, position-specific k-mer (k = 1–6) linear models could at best explain 66% of the variation in the test set (Supplementary Figs. 6 and 7, Supplementary Table 1).
Figure 2. Modeling 5′ UTR sequences and ribosome loading.
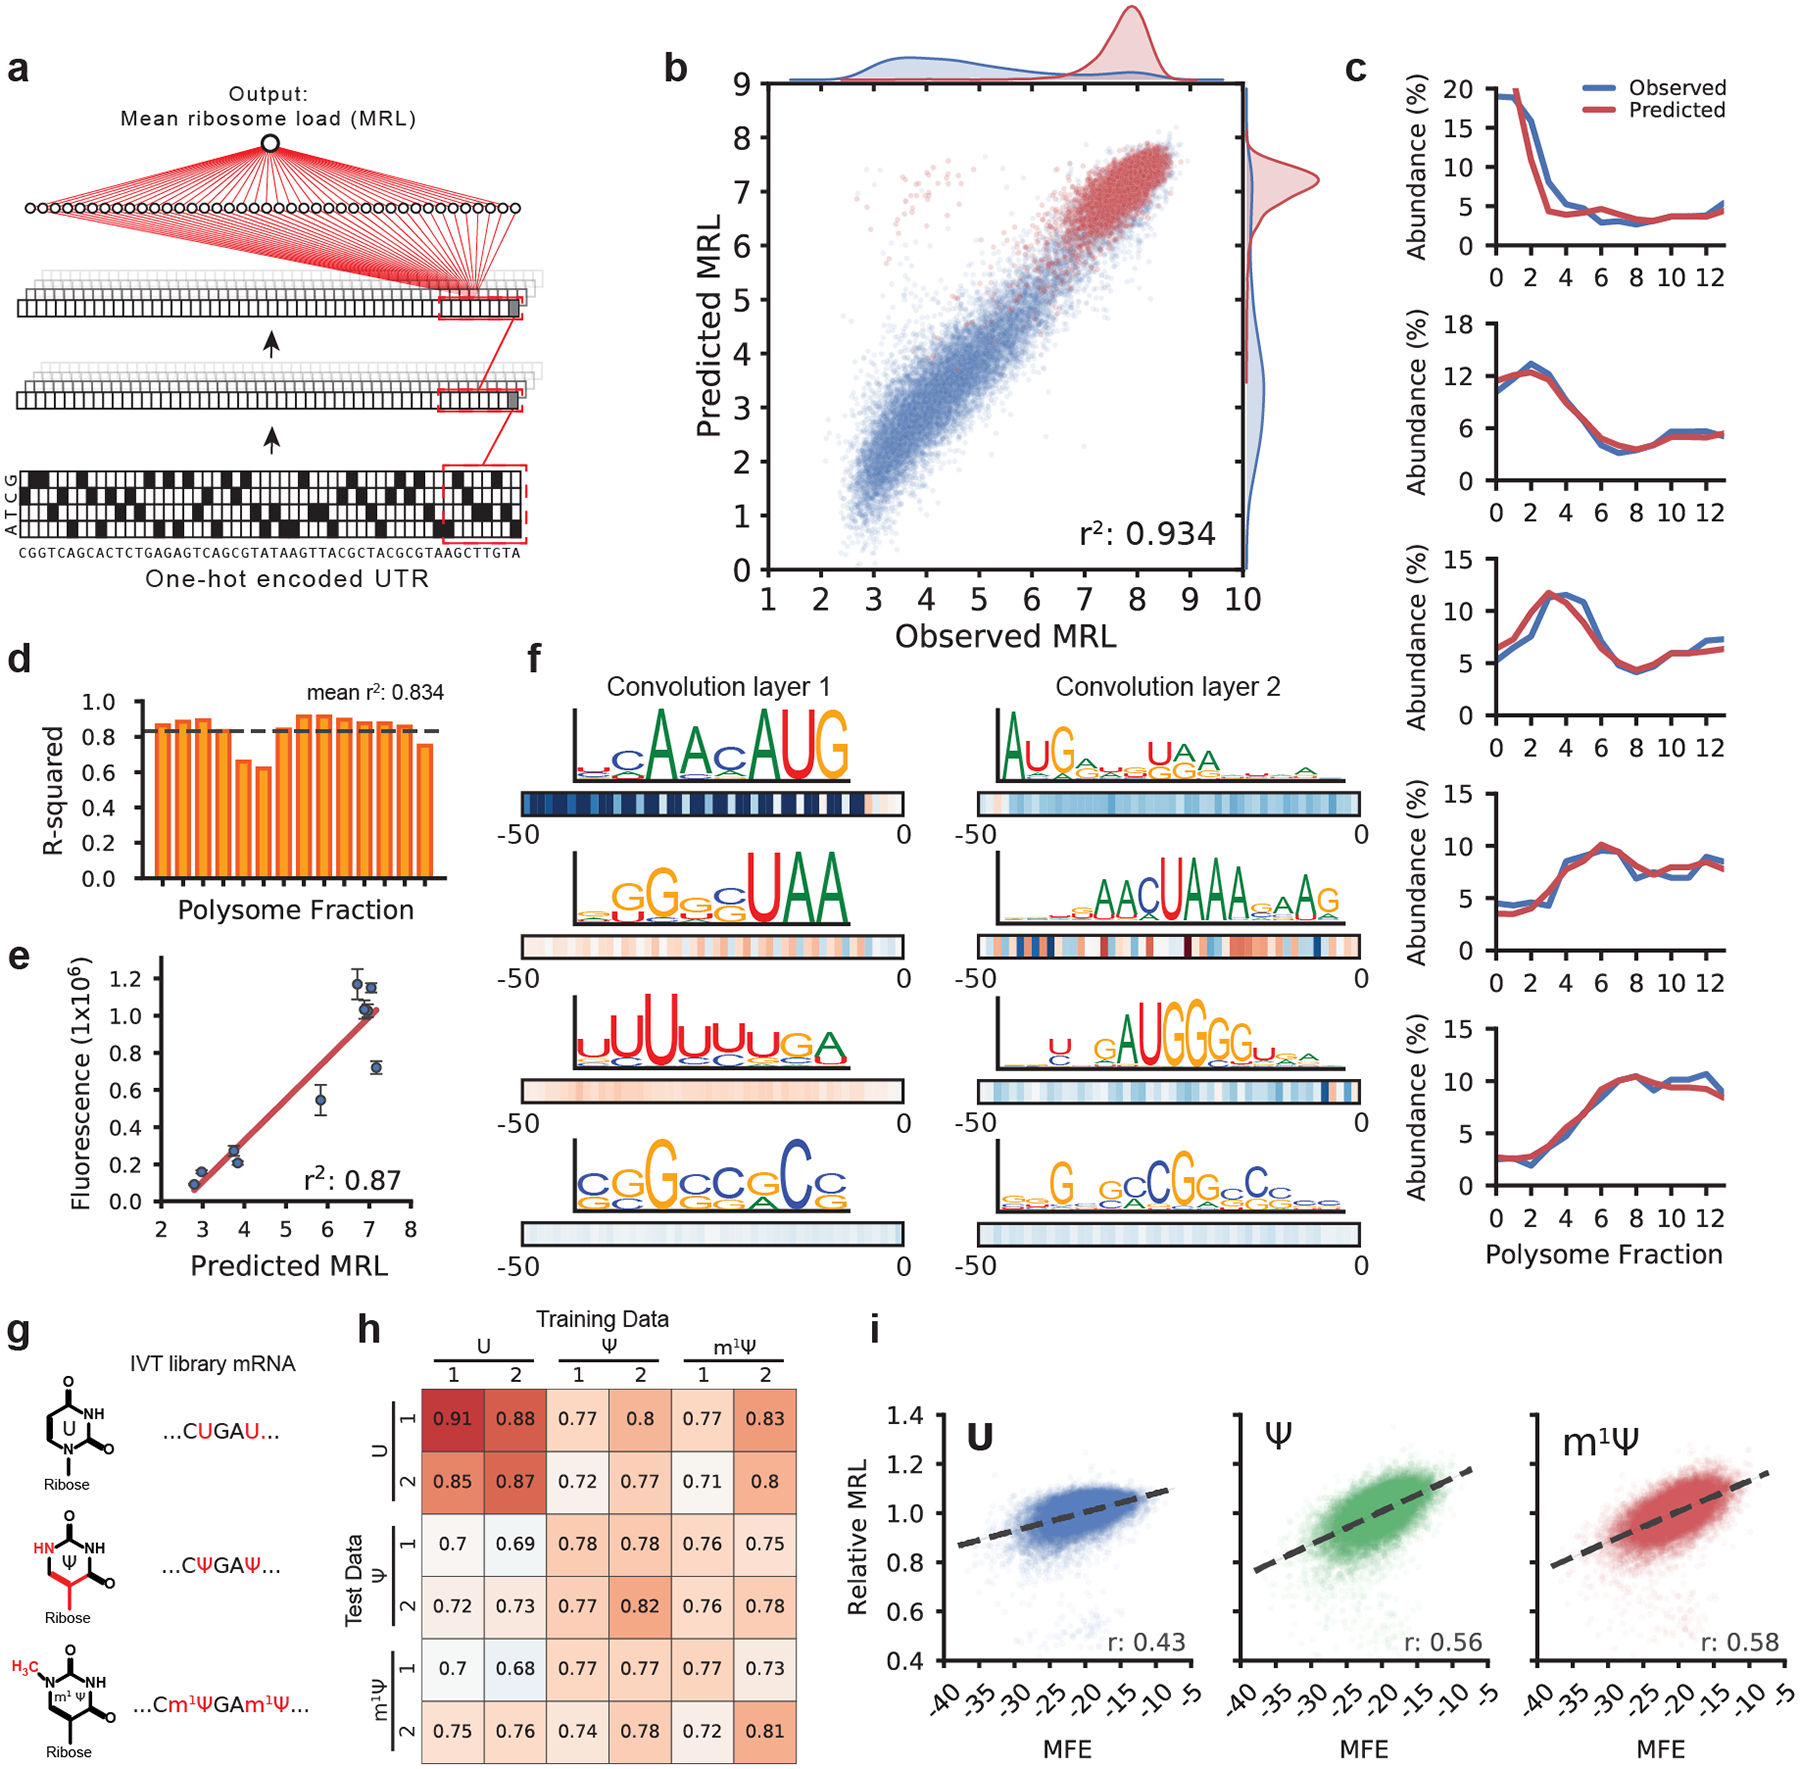
(a) Optimus 5-Prime structure: A one-hot encoded 5′ UTR sequence is fed into a CNN composed of three convolution layers and a fully connected layer to produce a linear output predicting MRL. (b) Optimus 5-Prime trained on 260,000 UTRs and tested on 20,000 held-out sequences could explain 93% of the variability in observed MRLs. Blue dots represent sequences with an uAUG while red dots represent sequences without uAUG (n = 20,000). (c) A similar model was trained to predict the polysome profile distribution of an individual 5′ UTR. The observed (blue) and predicted (red) polysome distribution of 5 random picked example UTRs out of 20,000 in the test set spanning MRLs from 4 to 8 (top to bottom) are shown. (d) The performance of the polysome profile model per fraction ranged from an r2 of 0.621 to 0.915 and an average of 0.834 across all fractions (n = 20,000). (e) eGFP expression for ten UTRs selected from the library were evaluated via eGFP fluorescence using IncuCyte live cell imaging (n = 3, centers are the means, error bars are s.e.m.). Predicted MRL and fluorescence are highly correlated (r2: 0.87, n = 10). For details, see Supplementary Table 2. (f) Visualization of four out of 120 filters from the first convolution layer (left) and four out of 120 filters from the second convolution layer. Boxes below show correlation (Pearson r) between filter activation and MRL at each UTR position. Filters learned important regulatory motifs such as start and stop codons, uORFs, and GC-rich regions likely involved in secondary structure formation. (g) IVT mRNA from the eGFP library were generated with pseudouridine (Ψ) or 1-methylpseudouridine (m1 Ψ) in place of uridine (U) and evaluated by polysome profiling and modeling. (h) Model performance trained and tested on different data sets (r-squared). The unmodified RNA (U) models perform best with U data, while the Ψ and m1 Ψ models perform equally well with Ψ and m1 Ψ test data (n = 20,000). (i) Ribosome loading as a function of MFE. U is less dependent on secondary structure than Ψ and m1 Ψ (Pearson r: 0.43, 0.56, and 0.58, respectively. n = 19,976).
So far, we used MRL as a simple measure for translation but the raw data also captures how often a given sequence occurs in each polysome fraction. We thus set out to build a model capable of predicting the full polysome distribution for a given sequence. Using a similar network architecture but with 14 linear outputs representing the polysome fractions (Supplementary Fig. 8), the model captured the relationship between 5′ UTR sequence and distribution of ribosome occupancy on held out test data remarkably well (Fig. 2c), explaining an average of 83% of variation across all fractions (Fig. 2d). To test whether the mean ribosome load prediction corresponds to actual protein expression, we selected and synthesized mRNAs containing 10 different UTRs from the library with a wide range of observed MRLs. We then transfected these mRNAs into HEK293 cells and measured eGFP fluorescence using IncuCyte live cell imaging. Fluorescence and predicted MRL were highly correlated (r2: 0.87) and the most poorly translated sequence showed 15-fold less fluorescence than the best (Fig. 2e). We also tested Optimus 5-Prime on 77 5′ UTRs previously designed by Ferreira et al.27 and characterized using a fluorescent reporter system in six different cell lines. UTRs were designed to result in a range of expression levels by inserting one or multiple uORFs. Our model’s MRL predictions correlated well with the independently reported fluorescence levels (r2: 0.73–0.85, Supplementary Fig. 9).
Finally, to learn whether Optimus 5-Prime would generalize to other coding sequences, we built a separate degenerate 5′ UTR mRNA library with an mCherry CDS replacing eGFP. Following the polysome profiling and modeling procedure as above, we found that the model, although only trained on the eGFP library, still performed well, explaining 77% and 78% of the variation in MRL for two independent polysome profiling experiments of this new reporter library (Supplementary Fig. 5). The decrease in accuracy is explained in part due to differences between the eGFP and mCherry polysome profiling protocols (Online Methods).
To aid interpretation of the model we applied visualization techniques developed in computer vision and recently popularized in computational biology4,8,28. Visualization of the filters in the first and second convolution layer revealed recognizable motifs including strong TIS sequences (e.g. ACCAUG), stop codons (TAA, TGA, TAG), uORFs, non-canonical start codons (CUG, GUG), and sequences composed of multiples of CG or AU likely involved in secondary structure formation (Fig. 2f and Supplementary Fig. 10). Of note, several filters did not fall into either of these categories and also did not match previously described PWMs for RNA binding proteins (Tomtom29 and the Homo sapiens RBP database30), suggesting the possibility for previously undescribed regulatory interactions.
Evaluation of mRNA containing Ψ and m1Ψ
The two uridine analogs pseudouridine (Ψ) or 1-methyl-pseudouridine (m1Ψ) are widely used for mRNA therapeutics because they can increase mRNA stability and help modulate the host immune response31,32. We applied our method to transcripts bearing either Ψ and m1Ψ instead of uridine (U) (Fig. 2g) and found that the model trained on the unmodified (U) library could explain 68% to 76% of the measured variability in the Ψ and m1Ψ polysome profiling data, respectively (Fig. 2h). Prediction accuracy could be further improved by training the models directly on data from the modified RNAs (the same held-out library sequences were used in all test sets to ensure consistency). This is likely due to the model learning the impact of Ψ and m1Ψ on the formation of secondary structure33. Concordantly, mean ribosome load is more positively correlated with a UTR’s predicted minimum free energy (MFE) for Ψ (r = 0.56) and m1Ψ (r = 0.58) than for U (r = 0.43) (Fig. 2i).
5′ UTR design for targeted ribosome loading
As a further test of our model’s capabilities, we asked whether it could be used to engineer completely novel, functional 5′ UTRs. A tool capable of designing 5′ UTRs for a targeted level of protein expression would be a valuable asset for mRNA therapeutics and metabolic engineering. While there has been some success in this effort in prokaryotes, yeast and even mammalian cells27,34–36, a fully rational approach to designing functional 5′ UTRs has not yet been implemented. We developed a genetic algorithm that iteratively edits an initial random 50-mer (not contained in the 280,000 sequence library) until it is predicted by the model to load a target number of ribosomes and thus achieve an intended level of translation activity (Fig. 3a). The model used for this process was developed before Optimus 5-Prime in Figure 2 and differs slightly in terms of network architecture (Online Methods) and performance (r2: 0.92) (Supplementary Fig. 11) (Online Methods). We designed two sets of UTRs for testing. The sequences in the first set were designed to target MRLs of 3, 4, 5, 6, 7, 8, 9, and a no-limit maximum (Fig. 3b). The second set was designed to follow the step-wise evolution of a UTR. For this second set, we started the algorithm to first select for sequences with low ribosome loading and then, after 800 iterations, to select for high ribosome loading. Each unique sequence generated by the algorithm as the UTR evolved was synthesized and tested (Fig. 3c and Supplementary Fig. S12a–d). We did this for 20 sequences where upstream AUGs were allowed and another 20 in which AUGs were not allowed. Both sequences containing uAUGs and not containing them could span the full MRL range.
Figure 3. Design of new 5′ UTRs.
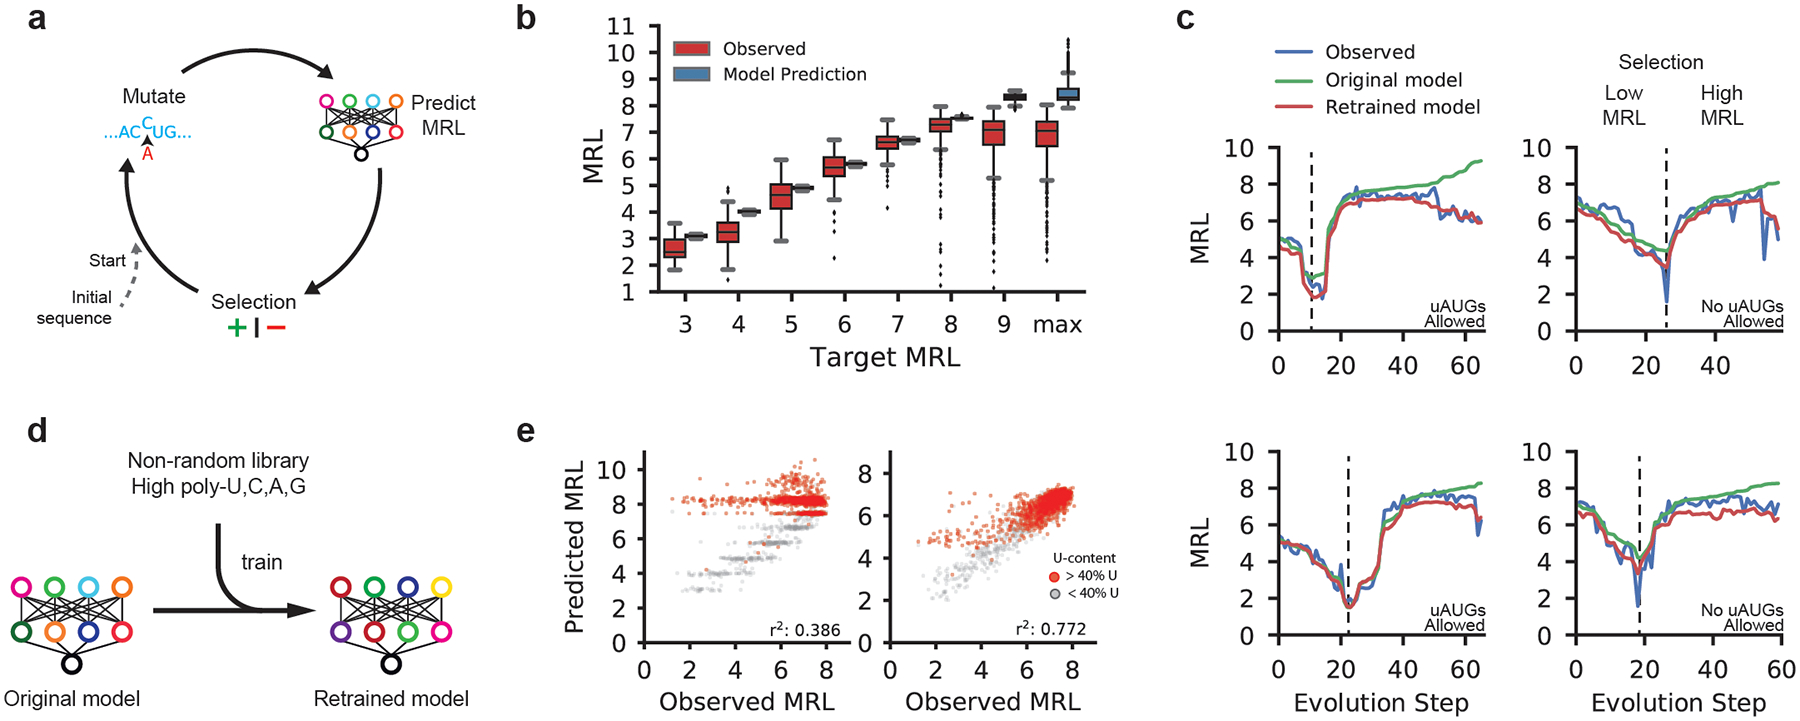
(a) Diagram of a genetic algorithm that was used in conjunction with Optimus 5-Prime to evolve sequences to target specific levels of ribosome loading. (b) Comparison between the predicted MRLs and observed MRLs for evolved 5′ UTRs for targeted ribosome loading. All 16 box plots are defined in terms of the sample size, minima, median, maxima and percentiles (Supplementary Table 3). (c) Step-wise evolution analysis. Randomly initialized UTRs were first evolved for low ribosome loading and then for high ribosome (selection change at dashed line). Four out of 80 (Supplementary Fig. 11a–d) examples are shown. Examples on the left were permitted to have uAUGs while those on the right were not. Each unique sequence that was generated during the evolution process was synthesized and tested by polysome profiling. The original Optimus 5-Prime prediction (green) and the observed MRL eventually diverge, but the predictions from the retrained Optimus 5-Prime (red) more accurately reflect the data. (d) The original Optimus 5-Prime is retrained using sequences from the designed library with high poly-U, C, A, and G stretches which occur rarely in the random library. (e) The accuracy of the retrained Optimus 5-Prime increased when predicting the high poly-U sequences (red) generated by the genetic algorithm (r2: 0.386 to 0.772, n = 2,146).
Of the 12,000 total UTRs evolved for targeted expression in the first set, the median MRL for targets 3 through 8 followed the expected trend from low to high with low variability within each group. For the step-wise evolved UTRs in the second set, predicted MRLs (green) closely matched the trend of the observed (blue) along the trajectory. While we created sequences with high ribosome loading (Supplementary Fig. 12e), in both sets the prediction from the model and the observed MRL eventually diverged as the model produced UTRs with very high predicted MRLs. We suspected that the divergence between predictions and measurements at very high MRL values might reflect the unusual sequence composition of the maximally evolved UTRs which often contained multiple long stretches of poly-U – sequences rarely seen in the random library. We corrected the model by training it (Fig. 3d) for four additional iterations with 6,082 UTRs from the target MRL sub-library, which had a much higher frequency of homopolymers, and 2,695 previously unseen random UTRs. Reevaluation of held-out sequences from the ‘target MRL’ library showed a dramatic improvement in comparison to the original model (r2 from 0.386 to 0.772) (Fig. 3e and Supplementary Fig. 13a) as did the predicted loading of the step-wise evolved sequences (Fig. 3c red line and Supplementary Fig. 12a–d). Using this expanded dataset, we retrained the Optimus 5-Prime model in Figure 2, which showed increased accuracy with all sub-libraries and unchanged performance with random library sequences (Supplementary Fig. 13b). Due to this improvement, we used the retrained version of Optimus 5-Prime from this point on.
Predicting the effect of human 5′ UTR variants on ribosome loading
Can a model trained only on synthetic sequences predict how human 5′ UTR sequences control translation? Assessing model performance on endogenous transcripts is challenging due to confounding contributions of 3′ UTRs and coding sequence lengths. As an alternative approach, we synthesized and tested via polysome profiling a 5′ UTR library consisting of the first 50 nucleotides preceding the start codon of 35,212 common human transcripts as well as 5′ UTR fragments carrying 3,577 variant sequences from the ClinVar database37 that occur within these regions; the same eGFP context as the randomized library was used. Using the retrained model, we were able to explain 81% of the observed variation in MRL with the common and SNV 5′ UTR sequences (Fig. 4a) showing that, despite training on random sequences, the model was able to learn the cis-regulatory rules of human 5′ UTR sequences that lay directly upstream of a coding sequence.
Figure 4. Model performance with human 5′ UTRs and generalization to varying lengths 5′ UTRs.
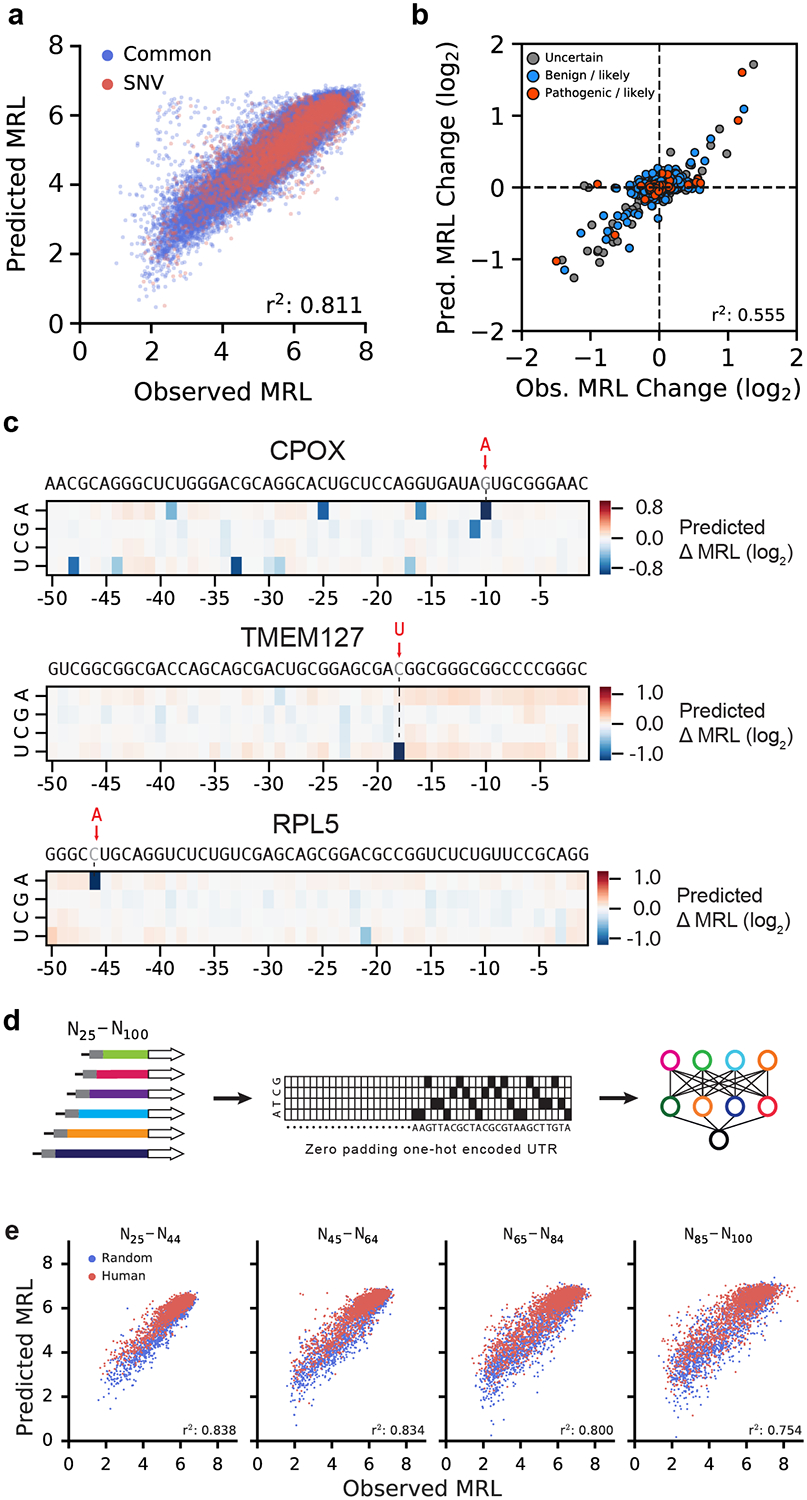
(a) The first 50 nucleotides preceding the CDS of 35,212 human transcripts and an additional 3,577 UTRs with SNVs (ClinVar) were evaluated using our polysome profiling method with eGFP used as the CDS. The retrained Optimus 5-Prime could explain 81.1% of the observed variation in MRL (n = 25,000). (b) The log2 change in MRL between an SNV and its common sequence was compared to the predicted change between the two (r2: 0.555, n = 1,597). SNV classification labels are from the ClinVar database. (c) In silico saturation mutagenesis and model prediction of MRL change for all 5’ UTR variants of CPOX, TMEM127 and RPL5. The three annotated Clinvar variants, rs867711777 (CPOX, G > A), rs121908813 (TMEM127, C > U), and rs376208311 (RPL5, C > A), are predicted to have the most dramatic effect on ribosome loading. (d) A library of 76,319 random 5’UTRs with varying lengths from 25 to 100 nucleotides was used to train the generalized Optimus 5-Prime. Sequences are one-hot encoded and zero padded to 100 nucleotides long if shorter than 100. (e) 7,600 random (blue dots) and 7,600 human (red dots) sequences are tested using the generalized Optimus 5-Prime. 100 sequences of each length (25–100) are represented. Model accuracy (r2: 0.754 to 0.838) is shown in predicting MRLs on different range of lengths of 5’ UTRs (From left to right: n = 4,000; n = 4,000; n = 4,000; n = 3,200.).
Genetic variants play a major role in phenotypic differences between individuals38 and how these sequences affect translation is only beginning to be understood39,40. But existing approaches to this problem, such as quantitative trait locus (QTL) analysis and genome wide association studies (GWAS) are limited to common variants and cannot scale to the enormous number of rare 5′ UTR variants occurring in the human population. In contrast, a model-based approach can in principle be used to score the impact of any 5′ UTR variant on translation. With this in mind, we investigated Optimus 5-Prime’s ability to predict the effect of disease relevant-variants by testing its performance in predicting the ribosome load change between pairs of wild-type (‘common’) and SNV-containing 5′ UTR sequences, measured as log2 difference. The majority of SNVs had little to no effect, but 45 had log2 differences greater than 0.5 or less than −0.5 (Supplementary Table 4, Clinvar SUB4797518). Overall, Optimus 5-Prime could explain 55% of the observed MRL change (Fig. 4b) and accurately predicted the direction of change for 64% of the variants. The relatively lower predictive accuracy compared to direct variant effect prediction is a consequence of the increased noise due to comparing two measurements. Moreover, a majority of variants do not impact translation, resulting in a large cluster of variants for which the MRL change is close to zero where measurements are dominated by noise. Importantly, the model can explain 76% of the change of variants with log2 differences greater than 0.5 or less than −0.5 (Supplementary Fig. 14a). As an example, one of the ClinVar variants with sizeable differences in MRL, rs867711777, is found in the 5′ UTR of the CPOX gene and shows a log2 difference of −0.89. The depletion of CPOX reduces heme biosynthesis and is the cause of hereditary coproporphyria (HCP)41. The large MRL difference suggests that this SNV, labeled as uncertain in the ClinVar database, could be pathogenic. The variant rs376208311 lies in the 5′ UTR of the ribosomal subunit gene RPL5 and shows a −0.87 log2 difference in MRL. This variant is associated with Diamond-Blackfan anemia (BDA). One cause of the disease is a result of either the disruption or downregulation of RPL542. Another SNV, rs121908813, is implicated in familial pheochromocytoma, a condition characterized by tumors found in the neuroendocrine system that secrete high levels of catecholamines43. In our assay, the variant UTR shows a −1.5 log2 difference in MRL compared to the wild type 5′ UTR sequence. TMEM127 acts as a tumor suppressor and decreased expression of it could explain the observed pathogenicity of this variant. For the three examples, the model predicts that, of all possible variants, these specific SNVs, all of which introduce an upstream start codon, would most dramatically affect ribosome loading (Fig. 4c). We also identified 2,308 additional SNVs that resulted from oligo synthesis errors, and found that 103 of them showed MRL changes greater than 0.5 or less than −0.5 in log2 scale (Supplementary Fig. 14b).
Modeling human 5′ UTRs of varying length
Human 5′ UTR sequences vary in length from tens to thousands of nucleotides with a median length of 218 nt44,45. Because only 13% of human 5′ UTRs are shorter than 50 nt and thus covered by Optimus 5-Prime, we next asked whether the approach introduced here could be extended to longer 5′ UTRs. To this end, we first created a 5′ UTR library where the length of the random sequence upstream of the start codon ranged from 25 to 100 nt, which would increase the coverage of human 5′ UTRs to 29%. After polysome profiling and RNA sequencing, we retained 83,919 distinct 5′ UTRs spanning the entire length distribution from 25–100 nt. As observed with the 50 nt library, sequences containing uAUGs had a lower median MRL than similar length sequences not containing them. Moreover, for sequences not containing uAUGs, the MRL slightly increased with length, likely because longer transcripts can accommodate more ribosomes (Supplementary Fig. 15a). We then retrained our model to capture and predict the impact of both sequence and length on MRL. To accommodate sequences up to 100 nucleotides in length, we increased the width of the input layer but otherwise retained the same network architecture as before (Fig. 4d). To ensure that 5′ UTRs of every length would be represented equally, we took the 100 5′ UTRs with the deepest read coverage at every length (~10% of the library) as the test set, rather than using the top 10% of the entire population. The remaining 90% was used for training. In fact, we found that the average number of sequencing reads per library member rapidly decreased with increasing UTR length, likely because of the decreasing yield of full-length sequences for longer 5′ UTRs (Supplementary Fig. 15b). We also created a second test set consisting of 7,600 human 5′ UTRs – 100 UTRs for every length from 25 to 100 nt. The generalized Optimus 5-Prime model performed well on both the human (r2: 0.78) and random (r2: 0.84) sequences (Supplementary Fig. 15c,d) and for 5′ UTRs of any length (Fig. 4e, r2: 0.75–0.84). The slight decrease in performance observed for longer 5′ UTRs is due to lower read coverage for longer sequences and concomitant decrease in the quality of the test set. These results suggest that the approach we developed here is not limited to fixed-length UTRs and could be extended even beyond a 100 nt window by synthesizing correspondingly longer 5′ UTRs for model training.
Discussion
The method developed here, which combines polysome profiling of a randomized 5′ UTR library with deep learning, has provided a wealth of information detailing the relationship between the 5′ UTR sequence preceding a CDS and regulation of translation. The data and model enabled the quantitative assessment of secondary structure, uAUGs and uORFs, Kozak sequences, and other cis-regulatory sequence elements in the context of unmodified mRNA, Ψ, and m1Ψ-modified mRNA. Optimus 5-Prime, the CNN trained on the data has notable performance, explaining up to 93% of mean ribosome load variation in the test set and up to 81% of variation for 38,789 truncated human UTRs. In future work, this approach could be further generalized to include the impact of the mRNA 5′ terminal including 5′ cap structure and even 3′ UTR sequence on ribosome loading. Our model also proved capable of predicting the effect of disease-relevant 5′ UTR variants on translation, even suggesting mechanisms of action. Of note, predictions are not limited to common variants or even those that have been previously described; instead the model can be used to screen every possible SNV, insertion or deletion in the 100 bases upstream of the start codon – there are millions in the human genome - and select those for further study that have the strongest impact on ribosome loading and thus the highest likelihood of being pathogenic. Finally, using Optimus 5-Prime and a genetic algorithm, we were able to engineer new 5′ UTR sequences for targeted ribosome loading, enabling even more forward-looking applications in synthetic biology and precision medicine.
Online Methods
Randomized 50-mer 5′ UTR Library.
A vector (pET 28) encoding a T7 promoter followed by 25 nt of a defined 5′ UTR (GGGACATCGTAGAGAGTCGTACTTA) and eGFP was linearized with AgeI to allow for the insertion of the 5′ UTR library between the defined sequence and the CDS. The defined 25 nt sequence allows for PCR amplification after reverse transcription. Two nucleotides at positions +11 (C to A) and +14 (C to T) in the eGFP CDS were changed in order to introduce stop codons (TAA) in frame −1 and −2 relative to ATG. The oligo (Supplementary Table 5: primer 282) that was used for library insertion contains the defined 5′ UTR, followed by 50 nt of randomized bases and 21 nt that overlap the eGFP sequence (includes the ATG start site) (IDT). A reverse primer (primer 283) complementary to the 21 nt eGFP overlap was used to produce a double-stranded product via Klenow extension with Klenow polymerase I (NEB). The vector and insert were assembled by Gibson reaction (NEB) and the product was electroporated into 5-alpha electrocompetent E. coli (NEB). A small portion of the electroporation was plated and resulted in ~750,000 cfu and the rest was grown in liquid culture overnight (both under kanamycin selection). The isolated plasmid is the eGFP library.
The same process above was performed, with some modifications, to produce the mCherry library. The same defined 5′ UTR that lies upstream of the randomized 50-mer UTR in the eGFP construct, was used (primer 252). Klenow extension with primer 253 created the double-stranded insert that was assembled with the AgeI linearized backbone by Gibson reaction. The mCherry CDS, however, does not have intentionally-placed stop codons.
eGFP Library Sequence.
Bold indicates the defined 5′ end of the 5′ UTR. The 50-mer random (and non-random in the case of the designed library) UTR immediately follows. The underlined sequence corresponds to a truncated poly-A signal. During in vitro transcription, a 70 nt long poly-A tail is added at the 3′ end.
GGGACATCGTAGAGAGTCGTACTTA(N50)atgggcgaattaagtaagggcgaggagctgttcaccggggtggtgcccatcctggtcgagctggacggcgacgtaaacggccacaagttcagcgtgtccggcgagggcgagggcgatgccacctacggcaagctgaccctgaagttcatctgcaccaccggcaagctgcccgtgccctggcccaccctcgtgaccaccctgacctacggcgtgcagtgcttcagccgctaccccgaccacatgaagcagcacgacttcttcaagtccgccatgcccgaaggctacgtccaggagcgcaccatcttcttcaaggacgacggcaactacaagacccgcgccgaggtgaagttcgagggcgacaccctggtgaaccgcatcgagctgaagggcatcgacttcaaggaggacggcaacatcctggggcacaagctggagtacaactacaacagccacaacgtctatatcatggccgacaagcagaagaacggcatcaaggtgaacttcaagatccgccacaacatcgaggacggcagcgtgcagctcgccgaccactaccagcagaacacccccatcggcgacggccccgtgctgctgcccgacaaccactacctgagcacccagtccaagctgagcaaagaccccaacgagaagcgcgatcacatggtcctgctggagttcgtgaccgccgccgggatcactctcggcatggacgagctgtacaagttcgaataaagctagcgcctcgactgtgccttctagttgccagccatctgttgtttg
mCherry Library Sequence.
The sequence shares the same defined 5′ end and truncated BGH poly-A signal sequences as the eGFP library.
GGGACATCGTAGAGAGTCGTACTTA(N50)atgcctcccgagaagaagatcaagagcgtgagcaagggcgaggaggataacatggccatcatcaaggagttcatgcgcttcaaggtgcacatggagggctccgtgaacggccacgagttcgagatcgagggcgagggcgagggccgcccctacgagggcacccagaccgccaagctgaaggtgaccaagggtggccccctgcccttcgcctgggacatcctgtcccctcagttcatgtacggctccaaggcctacgtgaagcaccccgccgacatccccgactacttgaagctgtccttccccgagggcttcaagtgggagcgcgtgatgaacttcgaggacggcggcgtggtgaccgtgacccaggactcctccctgcaggacggcgagttcatctacaaggtgaagctgcgcggcaccaacttcccctccgacggccccgtaatgcagaagaagaccatgggctgggaggcctcctccgagcggatgtaccccgaggacggcgccctgaagggcgagatcaagcagaggctgaagctgaaggacggcggccactacgacgctgaggtcaagaccacctacaaggccaagaagcccgtgcagctgcccggcgcctacaacgtcaacatcaagttggacatcacctcccacaacgaggactacaccatcgtggaacagtacgaacgcgccgagggccgccactccaccggcggcatggacgagctgtacaagtcttaacgcctcgactgtgccttctagttgccagccatctgttgtttg
In vitro Transcription.
A template for in vitro transcription was produced via PCR of the library plasmid with primer 254 and 255 and KAPA Hi-Fi polymerase (Kapa Biosystems). The double-stranded DNA product has the T7 promoter at the 5′ end and a truncated BGH poly-A signal sequence followed by 70 nt of poly-A (introduced with primer 254) at the 3′ end. The IVT reaction used the HiScribe T7 High Yield RNA Synthesis Kit (NEB) and 3´-0-Me-m7G(5′)ppp(5′)G RNA Cap (NEB) was used as the cap structure analog. The DNA template was digested with DNase I (NEB) and the IVT mRNA was purified using RNA Clean & Concentrator (Zymo Research). This protocol was used to produce the unmodified eGFP IVT mRNA and mCherry IVT mRNA for transfection. For synthesis of individual mRNAs for assessment of expression, linear DNA templates were assembled containing a T7 polymerase promoter, 5′ UTR, coding sequence, 3′ UTR, and template encoded polyA tail. mRNA transcription and purification were carried out as described previously46. For mRNA libraries containing alternatives to uridine, UTP was replaced with pseudouridine-5′-triphosphate or N1-methylpseudouridine-5′-triphosphate in the transcription. The final mRNAs utilized Cap1 to increase mRNA translation efficiency. After purification, the mRNA was diluted in citrate buffer to the desired concentration.
IVT mRNA Transfection.
HEK293T cells were plated on 10 cm cell culture dishes 24 hours before transfection (1 – 2 million per plate). At 60% to 80% confluency, cells were transfected with 14.5 μg of library mRNA using Lipofectamine MessengerMAX (Thermo Fisher Scientific) following the manufacturer’s protocol. Washed plates with 10 ml 1x DBPS and 10 ml media (DMEM with 10% FBS and 1% Penicillin-Streptomycin) after one hour of incubation. Cells were lysed 12 hours after transfection.
Cell Lysis and RNA Isolation.
Salt solution (10x): 100 mM NaCl, 100 mM MgCl2, 100 mM Tris-HCl pH 7.5, and RNase-free water (Zuccotti P, Modelska A 2016). Wash buffer: 100 μg/ml cycloheximide (NEB) in RNase-free DPBS (10 ml per plate). Lysis buffer: 1x salt solution, 1% of 20% Triton X-100, 1 mM DTT, 0.2 U/μl SUPERase-In (Thermo Fisher Scientific), 100 μg/ml cycloheximide. Wash buffer and lysis buffer were chilled throughout the protocol. After 12 hours of growth at 37 °C, cells were placed on ice and media was aspirated. Translating ribosomes were halted by adding 5 ml of wash buffer and were then placed at 37 °C for 5 minutes followed by aspiration on ice. Cells were washed by adding 5 ml wash buffer and aspirating thoroughly. Cells were then lysed by 300 μl of ice-cold lysis buffer, scraped, and cell clumps disrupted by pipetting ~5 times, and then placed into a pre-chilled microcentrifuge tube. Lysis solution was incubated for 10 minutes on ice and then triturated by passing through a 25-G needle 10 times14. Debris was cleared by centrifugation at 16,000 x g for 5 minutes. Supernatant was supplemented with 1.5 μl of 1 U/μl DNase I (final concentration of 0.005 U/μl) and placed on ice for 30 minutes. Lysate was then stored at −80 °C or proceeded directly to polysome profiling.
Polysome Profiling.
Sucrose gradient buffers contained either 20% or 55% (w/v) sucrose and 100 mM KCl, 20 mM HEPES pH 7.2, 10 mM MgCl2. 5.4 ml of 20% sucrose was gently layered over 5.4 ml of 55% sucrose in an ultracentrifuge tube. The tube was then sealed with parafilm and placed on its side and left overnight at 4°C. Approximately 2 h before use, the gradient was returned to its upright position. Once prepared cell lysate was layered over the gradient and centrifuged for 3 hours at 151,000 x g using Beckman SW-41 Ti rotor.
mCherry Library Polysome Profiling Protocol.
Sucrose gradient buffers contained either 7% or 47% (w/v) sucrose and 150 mM NaCl, 20 mM Tris-HCl pH 7.2, 5 mM MgCl2, and 1 mM DTT. 5.4 ml of 7% sucrose was gently layered over 5.4 ml of 47% sucrose in an ultracentrifuge tube. The tube was then sealed with parafilm and placed on its side and left overnight at 4°C. Approximately 2 h before use, the gradient was returned to its upright position. Once prepared cell lysate was layered over the gradient and centrifuged for 1 hour and 45 minutes at 39,000 RPM using Beckman SW-41 Ti rotor.
Polysome Fraction Processing and Next-Generation Sequencing.
Fractions of 500 μl corresponding to ribosome peaks including the 40s and 60s peaks were individually collected and processed. 500 μl of TRIzol (Thermo Fisher Scientific) was added to each fraction and vortexed. After incubating at room temperature for 5 minutes, 100 μl of chloroform was added, vortexed and incubated for 5 minutes at room temperature. Fractions were spun at 13,000 x rpm for 10 minutes and the RNA from the supernatant was purified following the protocol for RNA Clean & Concentrator (Zymo Research). Eluted in 15 μl of RNase-free water. The purified RNA was reverse transcribed using SuperScript IV (Thermo Fisher Scientific) and the gene-specific primer 289, for eGFP libraries, and primer 220, for mCherry libraries. Both RT primers have unique molecular indices (UMIs). The products were then amplified with overhangs for Illumina-based sequencing; the reverse primers contain barcodes that indicate the polysome fraction from which the RT product was derived. A custom read 1 forward primer anneals to the defined 5′ end of the 5′ UTR; the mCherry library and the eGFP library share the same 5′ end sequence. Products were sequenced with the Illumina NextSeq platform using NextSeq 500/550 v2 High Output 75 cycle kits.
Sequence Processing.
Raw sequence files, separated by their fraction-associated barcodes, were processed with Cutadapt47, outputting the 50 nt UTR and 9 – 15 nt of the N-terminal of the CDS. UTRs were clustered and UMIs were counted using Bartender48. The eGFP library contained approximately 750,000 unique sequences and the mCherry library contained approximately 500,000 sequences. UTRs were removed if the CDS sequence did not match the intended sequence. Because many of the remaining sequences had very few reads, we took the top 280,000 for the eGFP library and the top 200,000 for the mCherry library. No sequences between the eGFP and mCherry library matched. To normalize differences in total read counts between fractions, relative reads were calculated within each fraction. Using these values, the relative distribution of reads for each UTR across the fractions was determined. Mean ribosome load was calculated by multiplying each fraction’s relative distribution of reads by the number of ribosomes associated with each fraction and these values were summed (Supplementary Note 1).
Translation Validation.
Ten 5′ UTR sequences with a wide range of MRLs were selected from the eGFP library and individually cloned into the same vector as the randomized library (discussed above). IVT mRNA were synthesized and HEK293 cells were transfected with Lipofectamine 2000 then monitored for eGFP fluorescence using an IncuCyte S3 Live Cell Analysis System. Expression was reported as the maximum eGFP fluorescence over a 20.5-hour time window.
Convolution Neural Network.
All code was written in Python 2.7 and all neural network development was done using Keras49 and TensorFlow backend50. For hyperparameter selection, the top 50,000 sequences, in terms of total read counts per UTR, were used. We performed 10-fold cross-validation grid search to exhaustively test hyperparameter combinations of convolution layers (2, 3), convolution filter lengths (8, 10, 12), number of convolution filters (40, 80, 120), number of nodes in the dense layer (40, 80, 120), dropout probability between all layers (0, 0.2, 0.4). The best hyperparameter combination:
1st convolution layer: 120 filters (8x4), ReLU activation, 0% dropout
2nd convolution layer: 120 filters (8x1), ReLU activation, 0% dropout
3rd convolution layer: 120 filters (8x1), ReLU activation, 0% dropout
Dense layer: 40 nodes, 20% dropout
Output layer: 1 linear output
For the unmodified U eGFP model, 260k UTRs were used for training while 20k were used to evaluate the model. The model was trained over three epochs before overfitting occurred. Before training, we first sorted the UTRs based on the number of total reads; those with the highest read counts were used for the test set. UTRs with more reads have higher resolution and so more accurately reflect their mean ribosome load compared to low read, and thus noisier UTRs (Supplementary Fig. 15a–c). However, the model performs nearly as well after randomly splitting the training (260,000) and test (20,000) sets (Supplementary Fig. 15d).
Polysome Profile Model.
After performing the same grid search as the model trained to predict the mean ribosome load of a sequence, the best hyperparameters for polysome profile CNN are as follows:
1st convolution layer: 120 filters (8x4), ReLU activation, 0% dropout
2nd convolution layer: 120 filters (8x1), ReLU activation, 0% dropout
3rd convolution layer: 120 filters (8x1), ReLU activation, 0% dropout
Dense layer: 80 nodes, 10% dropout
Output layer: 14 linear output
The same training / test split as for the MRL model was used.
Model used for evolving new UTRs.
1st convolution layer: 40 filters (8x4), ReLU activation, 0% dropout
2nd convolution layer: 40 filters (8x4), ReLU activation, 0% dropout
Dense layer: 40 nodes, 20% dropout
Output layer: 1 linear output
k-mer Linear Model.
UTR sequences were represented as k-mers at each position of the UTR. These position-specific k-mers were used as features for training a model via linear regression. 1-mers to 6-mers were tested. Training involved regularization to limit overfitting and 5-fold cross validation. The same training / test sets used in building the CNN were used.
Filter Visualization.
For each filter, 2,000 8-mers from the eGFP 5′ UTR library that showed the highest activation were selected. From these, position-weight matrices (PWMs) were calculated and used to visualize the sequence compositions that strongly activate each filter. Visualization of the 2nd convolution layer involves a wider sequence window (15 bases) and PWMs were calculate with fewer k-mers (max 200).
Filter Activation by UTR Position.
For a given filter, the filter’s activation at each UTR position was assessed (only the top 100,000 UTRs in terms of total read counts were analyzed). These activations, position by position, were compared to UTR MRLs and a Pearson r was calculated. Negative values indicate a negative correlation between filter activation and MRL. Positive values indicate that filter activation and MRLs are positively correlated.
Relationship between UTR structure and MRL for U, Ψ, and m1Ψ.
The MFE for 20,000 UTRs from the eGFP library were calculated using Nupack26 and compared to the MRLs from U, Ψ, and m1Ψ data sets.
Genetic algorithm for designing new 5′ UTR sequences.
The 5′ UTR model used for evolving new sequences was trained with a different architecture than the main model (see “Model used for evolving new UTRs“ above) used throughout the manuscript; sometime after training this first model we determined that adding a third convolution layer and additional filters to each layer showed improved performance.
All sequence evolutions began with randomized sequences. Over a set number of iterations, a single randomly selected base, or two with a 50% probability, were introduced and the fitness was evaluated using the model. If the new sequence scored higher, or closer to the target mean ribosome load then it was accepted, otherwise, the unchanged sequence was selected.
Evolution for Target Mean Ribosome Load.
We evolved three distinct sets of targeted expression: sequences without upstream AUGs (uAUGs) and upstream stops, sequences where uAUGs and upstream stops were allowed, and sequences where uAUGs were not allowed but upstream stops were. Each set evolved initially random sequences to hit mean ribosome loads of 3, 4, 5, 6, 7, 8, 9, and maximum. 200 sequences for 3 – 7 and 1000 sequences for 8, 9, maximum were selected. In total, including the three sequence conditions, 12,000 sequences were synthesized and tested via polysome profiling. Regarding Figure 2B, the predicted values are scaled to the observed values within the data. This creates a discrepancy between the categorical names (x axis markers) and the predicted MRL which are the values that should be used for the comparison between observed and predicted.
Step-wise Evolution of Sequences.
As a sequence evolves using our algorithm, a new sequence is created if its score is improved relative to its previous state. We recorded the sequences for these steps and tested their performance relative to the model prediction. Four distinct conditions were used and 20 UTRs for each were evolved, totaling 80 UTR step-wise evolution examples. The first two were evolved to the highest ribosome load over 800 iterations; one allowed for uAUGs and the other did not. The third condition evolved sequences to the lowest ribosome load over 800 iterations and then changed the selective pressure for highest ribosome load over 800 iterations while allowing uAUGs. The fourth condition is the same as the third except that uAUGs were not permitted. In total, beginning with 20 sequences for each condition, 7,526 UTRs were generated for analysis.
Selection of Human UTR Sequences.
All human 5′ UTR transcripts from the human genome, as annotated by Ensembl, were retrieved using Biomart51. The first 50 nt sequences upstream of the annotated translation initiation sites were selected for synthesis, totaling 35,212 sequences.
Selection of 5′ UTR SNV.
All sequence variants in the ClinVar database37 occurring in the selected UTR regions above were selected for synthesis, totaling 3,577 sequences.
Control / Reanalysis of Library UTRs.
5,000 of the eGFP library sequences were selected over a range of mean ribosome loads. These were synthesized and tested via polysome profiling with the rest of the designed sequences.
Synthesis of Designed 50 nt Sequences.
All designed and human 5′ UTR sequences were synthesized by CustomArray, Inc. Fragments were PCR amplified and cloned into the pET 28 eGFP vector described above.
Design and Synthesis of varying Lengths 5′ UTR Sequences.
Random and human 5’UTR sequences of varying length (25–100 nt) were synthesized by Agilent Technologies. All human 5′ UTR transcripts from the human genome, as annotated by Ensembl, were retrieved using Biomart51. The first 100 nt upstream of the annotated translation initiation sites were selected for synthesis, totaling 17,586 sequences in the length range from 25 to 100 nucleotides. Fragments were PCR amplified and cloned into the pET 28 eGFP vector described above.
Generalized CNN for 5’UTRs up to 100 nt.
The generalized model used the same CNN architecture as the model trained only on 50 nt UTRs. 76,319 random sequences with lengths ranging from 25 to 100 nucleotides were used for training. The input space was expanded to 100 nucleotides using one-hot encoding; for sequences shorter than 100 nt zero padding was used. The top 100 sequences at each length, as measured by total read counts per UTR, were used to test the model’s accuracy, resulting in a test set of 7,600 random 5’UTRs. A test set consisting of 7,600 human 5’UTRs was created similarly: out of 15,555 human UTRs that were detected in the sequencing data, the top 100 UTRs by read count at each length were used as part of the test set.
Statistics.
All r-squared values are the square of the correlation coefficient of linear least-squares regression. All boxplots and violin plots have median as the center, and first and third quartile as the box upper and lower edges. The upper line is the third quartile plus 1.5 times interquartile range and the lower line is the first quartile minus 1.5 times interquartile range. Maxima and minima are identified. All violin plots have standard deviation identified. All p-values are obtained from two-tailed t-test and were calculated using python package scipy.stats.ttest_ind. Sample sizes and p-values were indicated in relevant figures. Additional information can be found in the Life Sciences Reporting Summary.
Supplementary Material
Acknowledgments
We would like to thank A. Rosenberg and J. Linder for helpful discussions on data analysis and modeling. We would also like to thank M. Moore, A. Hsieh, and Y. Lim for constructive comments on the manuscript. We are grateful to C. Wang for providing the fluorescence data from Ref. 27. This work was supported by a sponsored research agreement by Moderna Therapeutics and NIH grant R01CA207029 to G.S.
Footnotes
Competing interests
PJS, BW, GS, and DRM declare no competing interests. DR, VP, and IM are employees and shareholders of Moderna Therapeutics.
Data availability. The authors declare that all data supporting the findings of this study are available at GEO accession GSE114002.
Code availability
Supplementary code of Optimus 5-Prime was provided. All code is available at [https://github.com/pjsample/human_5utr_modeling]
References:
- 1.Araujo PR et al. Before it gets started: Regulating translation at the 5′; UTR. Comparative and Functional Genomics (2012). doi: 10.1155/2012/475731 [DOI] [PMC free article] [PubMed] [Google Scholar]
- 2.Jackson RJ, Hellen CUT & Pestova TV The mechanism of eukaryotic translation initiation and principles of its regulation. Nature Reviews Molecular Cell Biology (2010). doi: 10.1038/nrm2838 [DOI] [PMC free article] [PubMed] [Google Scholar]
- 3.Angermueller C, Pärnamaa T, Parts L & Stegle O Deep learning for computational biology. Mol. Syst. Biol (2016). doi: 10.15252/msb.20156651 [DOI] [PMC free article] [PubMed] [Google Scholar]
- 4.Alipanahi B, Delong A, Weirauch MT & Frey BJ Predicting the sequence specificities of DNA- and RNA-binding proteins by deep learning. Nat. Biotechnol (2015). doi: 10.1038/nbt.3300 [DOI] [PubMed] [Google Scholar]
- 5.Zhou J & Troyanskaya OG Predicting effects of noncoding variants with deep learning–based sequence model. Nat. Methods (2015). doi: 10.1038/nmeth.3547 [DOI] [PMC free article] [PubMed] [Google Scholar]
- 6.Kleftogiannis D, Kalnis P & Bajic VB DEEP: A general computational framework for predicting enhancers. Nucleic Acids Res. (2015). doi: 10.1093/nar/gku1058 [DOI] [PMC free article] [PubMed] [Google Scholar]
- 7.Liu F, Li H, Ren C, Bo X & Shu W PEDLA: Predicting enhancers with a deep learning-based algorithmic framework. Sci. Rep (2016). doi: 10.1038/srep28517 [DOI] [PMC free article] [PubMed] [Google Scholar]
- 8.Kelley DR, Snoek J & Rinn JL Basset: Learning the regulatory code of the accessible genome with deep convolutional neural networks. Genome Res. (2016). doi: 10.1101/gr.200535.115 [DOI] [PMC free article] [PubMed] [Google Scholar]
- 9.Zhao W et al. Massively parallel functional annotation of 3’ untranslated regions. Nat. Biotechnol (2014). doi: 10.1038/nbt.2851 [DOI] [PMC free article] [PubMed] [Google Scholar]
- 10.Noderer WL et al. Quantitative analysis of mammalian translation initiation sites by FACS-seq. Mol. Syst. Biol (2014). doi: 10.15252/msb.20145136 [DOI] [PMC free article] [PubMed] [Google Scholar]
- 11.Kosuri S et al. Composability of regulatory sequences controlling transcription and translation in Escherichia coli. Proc. Natl. Acad. Sci (2013). doi: 10.1073/pnas.1301301110 [DOI] [PMC free article] [PubMed] [Google Scholar]
- 12.Cuperus JT et al. Deep learning of the regulatory grammar of yeast 5′untranslated regions from 500,000 random sequences. Genome Res. (2017). doi: 10.1101/gr.224964.117 [DOI] [PMC free article] [PubMed] [Google Scholar]
- 13.Zuccotti P & Modelska A Studying the Translatome with Polysome Profiling in Post-Transcriptional Gene Regulation (ed. Dassi E) 59–69 (Humana Press, 2016). doi: 10.1007/978-1-4939-3067-8 [DOI] [PubMed] [Google Scholar]
- 14.Floor SN & Doudna JA Tunable protein synthesis by transcript isoforms in human cells. Elife (2016). doi: 10.7554/eLife.10921 [DOI] [PMC free article] [PubMed] [Google Scholar]
- 15.Wang X, Hou J, Quedenau C & Chen W Pervasive isoform-specific translational regulation via alternative transcription start sites in mammals. Mol. Syst. Biol (2016). doi: 10.15252/msb.20166941 [DOI] [PMC free article] [PubMed] [Google Scholar]
- 16.Whiffin N et al. Characterising the loss-of-function impact of 5’ untranslated region variants in whole genome sequence data from 15,708 individuals. bioRxiv (2019). doi: 10.1101/543504 [DOI] [Google Scholar]
- 17.Hinnebusch AG, Ivanov IP & Sonenberg N Translational control by 5′-untranslated regions of eukaryotic mRNAs. Science (2016). doi: 10.1126/science.aad9868 [DOI] [PMC free article] [PubMed] [Google Scholar]
- 18.Morris DR & Geballe AP Upstream Open Reading Frames as Regulators of mRNA Translation. Mol. Cell. Biol (2000). doi: 10.1128/MCB.20.23.8635-8642.2000 [DOI] [PMC free article] [PubMed] [Google Scholar]
- 19.Johnstone TG, Bazzini AA & Giraldez AJ Upstream ORFs are prevalent translational repressors in vertebrates. EMBO J. (2016). doi: 10.15252/embj.201592759 [DOI] [PMC free article] [PubMed] [Google Scholar]
- 20.Lee S et al. Global mapping of translation initiation sites in mammalian cells at single-nucleotide resolution. Proc. Natl. Acad. Sci (2012). doi: 10.1073/pnas.1207846109 [DOI] [PMC free article] [PubMed] [Google Scholar]
- 21.Reuter K, Biehl A, Koch L & Helms V PreTIS: A Tool to Predict Non-canonical 5’ UTR Translational Initiation Sites in Human and Mouse. PLoS Comput. Biol (2016). doi: 10.1371/journal.pcbi.1005170 [DOI] [PMC free article] [PubMed] [Google Scholar]
- 22.Starck SR et al. Translation from the 5’ untranslated region shapes the integrated stress response. Science (80-. ) (2016). doi: 10.1126/science.aad3867 [DOI] [PMC free article] [PubMed] [Google Scholar]
- 23.Hinnebusch AG The Scanning Mechanism of Eukaryotic Translation Initiation. Annu. Rev. Biochem (2014). doi: 10.1146/annurev-biochem-060713-035802 [DOI] [PubMed] [Google Scholar]
- 24.Kozak M Point mutations define a sequence flanking the AUG initiator codon that modulates translation by eukaryotic ribosomes. Cell (1986). doi: 10.1016/0092-8674(86)90762-2 [DOI] [PubMed] [Google Scholar]
- 25.Kozak M Influences of mRNA secondary structure on initiation by eukaryotic ribosomes. Proc. Natl. Acad. Sci (1986). doi: 10.1073/pnas.83.9.2850 [DOI] [PMC free article] [PubMed] [Google Scholar]
- 26.Zadeh JN et al. NUPACK: Analysis and design of nucleic acid systems. J. Comput. Chem (2011). doi: 10.1002/jcc.21596 [DOI] [PubMed] [Google Scholar]
- 27.Ferreira JP, Overton KW & Wang CL Tuning gene expression with synthetic upstream open reading frames. Proc. Natl. Acad. Sci (2013). doi: 10.1073/pnas.1305590110 [DOI] [PMC free article] [PubMed] [Google Scholar]
- 28.Bogard N, Linder J, Rosenberg AB & Seelig G Predicting the Impact of cis-Regulatory Variation on Alternative Polyadenylation. bioRxiv (2018). doi: 10.1101/300061 [DOI] [Google Scholar]
- 29.Gupta S, Stamatoyannopoulos JA, Bailey TL & Noble WS Quantifying similarity between motifs. Genome Biol. (2007). doi: 10.1186/gb-2007-8-2-r24 [DOI] [PMC free article] [PubMed] [Google Scholar]
- 30.Ray D et al. A compendium of RNA-binding motifs for decoding gene regulation. Nature (2013). doi: 10.1038/nature12311 [DOI] [PMC free article] [PubMed] [Google Scholar]
- 31.Karikó K et al. Incorporation of pseudouridine into mRNA yields superior nonimmunogenic vector with increased translational capacity and biological stability. Mol. Ther (2008). doi: 10.1038/mt.2008.200 [DOI] [PMC free article] [PubMed] [Google Scholar]
- 32.Anderson BR et al. Incorporation of pseudouridine into mRNA enhances translation by diminishing PKR activation. Nucleic Acids Res. (2010). doi: 10.1093/nar/gkq347 [DOI] [PMC free article] [PubMed] [Google Scholar]
- 33.Kierzek E et al. The contribution of pseudouridine to stabilities and structure of RNAs. Nucleic Acids Res. (2014). doi: 10.1093/nar/gkt1330 [DOI] [PMC free article] [PubMed] [Google Scholar]
- 34.Seo SW et al. Predictive design of mRNA translation initiation region to control prokaryotic translation efficiency. Metab. Eng (2013). doi: 10.1016/j.ymben.2012.10.006 [DOI] [PubMed] [Google Scholar]
- 35.Jensen MK & Keasling JD Recent applications of synthetic biology tools for yeast metabolic engineering. FEMS Yeast Research (2015). doi: 10.1111/1567-1364.12185 [DOI] [PubMed] [Google Scholar]
- 36.Salis HM, Mirsky EA & Voigt CA Automated design of synthetic ribosome binding sites to control protein expression. Nat. Biotechnol (2009). doi: 10.1038/nbt.1568 [DOI] [PMC free article] [PubMed] [Google Scholar]
- 37.Landrum MJ et al. ClinVar: Public archive of interpretations of clinically relevant variants. Nucleic Acids Res. (2016). doi: 10.1093/nar/gkv1222 [DOI] [PMC free article] [PubMed] [Google Scholar]
- 38.Hernandez RD et al. Singleton Variants Dominate the Genetic Architecture of Human Gene Expression. SSRN (2018). doi: 10.2139/ssrn.3151998 [DOI] [Google Scholar]
- 39.Battle A et al. Impact of regulatory variation from RNA to protein. Science (80-. ) (2015). doi: 10.1126/science.1260793 [DOI] [PMC free article] [PubMed] [Google Scholar]
- 40.Cenik C et al. Integrative analysis of RNA, translation, and protein levels reveals distinct regulatory variation across humans. Genome Res. (2015). doi: 10.1101/gr.193342.115 [DOI] [PMC free article] [PubMed] [Google Scholar]
- 41.Wang B & Bissell DM Hereditary Coproporphyria. (University of Washington, Seattle, Seattle (WA), 2012). [Google Scholar]
- 42.Boria I et al. The ribosomal basis of diamond-blackfan anemia: Mutation and database update. Hum. Mutat (2010). doi: 10.1002/humu.21383 [DOI] [PMC free article] [PubMed] [Google Scholar]
- 43.Qin Y et al. Germline mutations in TMEM127 confer susceptibility to pheochromocytoma. Nat. Genet (2010). doi: 10.1038/ng.533 [DOI] [PMC free article] [PubMed] [Google Scholar]
- 44.Mignone F, Gissi C, Liuni S, Pesole G & others. Untranslated regions of mRNAs. Genome Biol (2002). doi: 10.1186/gb-2002-3-3-reviews0004 [DOI] [PMC free article] [PubMed] [Google Scholar]
- 45.Leppek K, Das R & Barna M Functional 5′ UTR mRNA structures in eukaryotic translation regulation and how to find them. Nature Reviews Molecular Cell Biology (2018). doi: 10.1038/nrm.2017.103 [DOI] [PMC free article] [PubMed] [Google Scholar]
Methods-only References
- 46.Richner JM et al. Vaccine Mediated Protection Against Zika Virus-Induced Congenital Disease. Cell (2017). doi: 10.1016/j.cell.2017.06.040 [DOI] [PMC free article] [PubMed] [Google Scholar]
- 47.Martin M Cutadapt removes adapter sequences from high-throughput sequencing reads. EMBnet.journal (2011). doi: 10.14806/ej.17.1.200 [DOI] [Google Scholar]
- 48.Zhao L, Liu Z, Levy SF & Wu S Bartender: a fast and accurate clustering algorithm to count barcode reads. Bioinformatics (2017). doi: 10.1093/bioinformatics/btx655 [DOI] [PMC free article] [PubMed] [Google Scholar]
- 49.Chollet F Keras (2015). URL http://keras.io (2017).
- 50.Abadi M et al. TensorFlow : A System for Large-Scale Machine Learning This paper is included in the Proceedings of the TensorFlow : A system for large-scale machine learning. Proc 12th USENIX Conf. Oper. Syst. Des. Implement (2016). doi: 10.1126/science.aab4113.4 [DOI] [Google Scholar]
- 51.Smedley D et al. BioMart - Biological queries made easy. BMC Genomics (2009). doi: 10.1186/1471-2164-10-22 [DOI] [PMC free article] [PubMed] [Google Scholar]
Associated Data
This section collects any data citations, data availability statements, or supplementary materials included in this article.