

Abstract
Multi-target pharmacology of small molecule cancer drugs significantly contributes to their mechanism of action, side effects, emergence of drug resistance, and opens ways to repurpose, combine or customize drug therapy. In most cases the set of targets affected at therapeutic concentrations is not fully characterized and/or the interaction efficacy values are not accurately quantified. We collected information about multiple targets for each cancer drug along with their experimental effective concentrations or binding activities from multiple sources. All multi-target activity values for each drug then were used to build two proximity network pharmacology maps of anti-cancer drugs and targets of those drugs, respectively. Together with the network map, we showed that the majority of the cancer drugs had substantial multi-target pharmacology based on our current knowledge. In addition, most of the cancer drugs simultaneously affect macromolecular targets from different classes and types. The target subset can further be accentuated and personalized by patient sample specific expression data. The network maps of cancer drugs and targets, as well as all quantified activity data were integrated into a freely available database, CancerDrugMap (http://ruben.ucsd.edu/dnet/maps/drugnet.html). The identified multi-target pharmacology of cancer drugs is essential for improving the efficacy of individually prescribed drugs and drug combinations and minimization of adverse effects.
Graphical Abstract
Introduction
Cancer remains an unsolved healthcare challenge which involves multiple hallmarks, pathways, and individual targets1. Despite the significant progress in drug discovery in recent years, the problem remains unsolved due to the diversity of cancer types/subtypes, limited efficacy, excessive toxicity, and acquired treatment resistance2. Further complications come from the apparent failure of the “one gene, one drug, one disease” paradigm when applied to cancer3. For example, cancer cells may have salvage or compensatory pathways counteracting the intended drug mechanism3, 4. In addition, even though a small molecule drug may be designed to be specific to the “primary” target, in reality the drug and its metabolites will typically manifest multiple “off-target” activities which can be beneficial, adverse, or neutral5, 6. Therefore, multi-target pharmacology of drugs needs to be taken into consideration and characterized and quantified. On one hand, exploring multi-target pharmacology of existing drugs can help to identify the potential side effects of drugs and repurpose existing drugs for new cancer types. On the other hand, relevant and efficacious drug combinations can be proposed if multi-target pharmacology is taken into consideration.
Currently, there are several databases, such DrugBank7, Therapeutic Target Database (TTD)8, ChEMBL9, PubChem10, BindingDB11, and SuperTarget12, that contain the drug-target information. The data on multiple target activities of each drug is a big step forward. However, none of those databases alone is both complete and quantitative. These data, whether complete or not, can be transformed into networks of drugs and their targets. Building network maps of drugs and targets based on the complex interaction of multiple drugs and multiple targets is quite challenging. Several attempts have been made to show the complex interaction by: 1) connecting drugs with shared targets to form drug maps; 2) connecting targets with shared drugs to form target maps; 3) connecting drugs and targets to form drug-target bipartite maps13–17. However, these maps are both too complex and highly variable because the data sources may be inconsistent, the list of drug-target interactions keeps growing, and the considerations for quantitative contribution or threshold for each edge may be missing or oversimplified.
Here we analyzed the multi-target properties of cancer drugs and generated comprehensive network pharmacology maps of cancer drugs and targets. We extended and updated target lists for all cancer drugs from various sources and quantified them according to the drug-target binding activity values. The resulting network pharmacology maps of cancer drugs and targets, CancerDrugMap (http://ruben.ucsd.edu/dnet/maps/drugnet.html), revealed a higher than expected level of multi-target pharmacology of small molecule drugs, most of which even have targets from different classes. The compiled dataset and maps may be helpful to understand the complexity and difference of pharmacological effects of related drugs, repurpose the drugs for specific patient profiles or develop better drug combinations.
Methods and Materials
Data collection
Drugs in CancerDrugMap were taken from the following sources: 1) drugs with WHO Anatomical Therapeutic Chemical (ATC) code starting with L01, namely antineoplastic agents; 2) drugs included in the NCI cancer drug list (accessed August 24th, 2018) which have direct antineoplastic effects. Drugs taken from the NCI website may have ATC codes other than L01. For each anti-cancer drug, its target-interaction data were extracted and combined mainly from ChEMBL and PubChem, where the data annotated as “inactive” were excluded. For 101 out of 237 cancer drugs, the drug-target pairs were further extended from the following sources: 1) research publications (67 drugs); 2) FDA drug related documents (30 drugs); 3) European Medicines Agency (EMA) drug reviews (3 drugs); 4) product monograph from the manufacturers (e.g. Dabrafenib); 5) books (e.g. Catumaxomab and Daunorubicin); and 6) US Patents from Google Patent Database (e.g. Alemtuzumab). The drug-target interaction values were transformed into a unified value like pChEMBL (referred to as pAct) which is the logarithmic value of binding/inhibition affinities (Kd/Ki) or half maximal effective/inhibition concentration (EC50/IC50), shown by the following equation18; the maximal pAct was taken if multiple pAct values were found.
Some drug-target interaction data in ChEMBL and PubChem were annotated as “inconclusive”, meaning that more experiments might be needed to validate those interactions. These annotations were kept and used if no “active” interactions were reported. For the DNA/RNA targeting drugs, their targets were named based on the mode of action. For example, NA_ALK denotes the target of alkylating agents. NA_TEM denotes the target of nucleoside analog cancer drugs which act as terminators of DNA replication or RNA transcription. NA_ICL denotes the target of drugs that can intercalate into DNA/RNA and inhibit the replication or transcription. NA_NCB denotes the target of drugs that bind to DNA/RNA through non-covalent interaction. For each cancer drug, apart from target binding activities, we also estimated its number of occurrences from the FDA adverse event reporting system (FAERS)19 and collected the first FDA approval dates. The FAERS database was pre-processed to standardize the data structure, to homogenize the field names and contents, and to translate diverse set of alternative drug names into their generic names as described previously20. In addition, we incorporated the endogenous transporter, carrier, and enzyme information for each cancer drug from DrugBank. We also extracted the RNAseq gene expression data of each target from 1019 cancer cell lines from Cancer Cell Line Encyclopedia (CCLE)21. The target identifiers were translated into gene names, and their expression values from individual cell lines were additionally averaged per tissue type.
Distance calculation between cancer drugs
Based on the target binding activities of all cancer drugs, we built a distance function to calculate the dissimilarities between drugs. First, a 237 (drugs) by 783 (targets) matrix was built. A row in the matrix represents a drug, while a column represents a target. The matrix element Mik corresponds to the binding activity of drug i and target k, shown as the pAct form (e.g. 8 in the matrix means the binding activity is 10 nM). We subtracted the baseline of 5 from all non-zero matrix elements, and set negative elements to zero. Therefore, a zero element Mik in Matrix 1 means that drug i is not known to bind to target k or the interaction between drug i and target k is too weak.
Second, based on the matrix M values, distances between drugs (i and j) were calculated according to equations (1), (2), and (3). The overall distance between two drugs is comprised of two parts: distance calculated from target’s binding similarity (Dbinding) and distance calculated from ATC codes of drugs (DATC) as the length of minimal dendrogram path between two drugs divided by the maximal dendrogram path length (e.g. distance between “L-01-A-A-01” and “L-01-A-B-02” is 0.4). The distances between drugs range from 0 to 1, where 0 means identical and 1 means totally different.
| (1) |
| (2) |
Distance calculation between drug targets
Similar to the drug distance definition, distances between drug targets were calculated from two parts, distance calculated based on drug binding similarity (Dbinding), and distance calculated based on Gene Ontology (GO)22similarity (DGO), see equation 3. To calculate the Dbinding, the previous 237 by 783 drug target matrix was transposed, so that a row Mi represents a target i. The matrix element Mik corresponds to the binding activity of target i and drug k. Similarly, the baseline of five was subtracted from all non-zero matrix elements.
Following the established un-weighted vector-based distance function23–26, the GO distance was calculated for 783 targets on the basis of a GO terms matrix (783 by 5938). The GO terms of each drug target were extracted from the UniProt database27. A binary GO term matrix was built, in which a row in the matrix denotes a target, while a column denotes a GO term. Matrix element Mik shows whether the target i contain the GO term j or not by 1 and 0, respectively.
With those two matrices and the following equations (3) to (5), distances between pairs of targets were calculated. The distance ranges from 0 to 1, where small distance means that two targets are similar in terms of drug binding and GO annotation.
| (3) |
where
| (4) |
| (5) |
Network map generation
The drug network, target network, and target expression network were generated with the Graphviz package, including the Neato tool28 based on the calculated distances between drugs and targets. The maps are comprised of nodes and edges. Nodes in drug and target maps represent cancer drugs and drug targets respectively. The node sizes and node outline thicknesses in drug and target maps were calculated from drug-target interaction data with equations shown in Table 1. Edges were generated to connect drugs or targets within the distance thresholds (0.28 for cancer drug map, 0.35 for drug target map), which were selected to make the maps compact, visible, and clear. To compare the different distance functions, we also generated the drug and target maps solely based on drug-target interaction data to stress the pharmacological similarities between drugs and targets. We also generated network target maps with their expression levels in each cancer cell lines and tissues. In the target expression network maps, the sizes and opacity values of nodes corresponded to their expression level in the cell line or tissue, which were calculated according to the equations in Table 1.
Table 1.
Equations to calculate the node size, opacity, and outline thickness for drug maps, target maps, and target expression maps. RPKM, reads per kilo base per million mapped reads, is the target expression value in cell lines and tissues.
| Drug maps | Target maps | Target expression maps | |
|---|---|---|---|
| Node size | max(8 × ln(RPKMt + 1), 8) | ||
| Node opacity | 1 | 1 or (eq 6) * | (eq 6) |
| Node thickness |
Node opacity in the drug focused target maps was calculated according to the (eq 1).
Drug and target classification and statistics
All cancer drugs were classified into nine classes based on their ATC codes, as L01A, L01B, L01C, L01D, L01X, L02, L03, L04, and other codes (A, B…). For the drug target statistics, the L01X class was further divided into L01XC, L01XE, and other L01X (L01XA, L01XX…). All targets were classified into nine classes. The first six classes include kinases, other enzymes, nuclear receptors, G-protein coupled receptors (GPCR), transporters, and nucleic acids. If a target doesn’t belong to any of those classes, it was classified based on its principal location: membrane, nucleus, or other. The distributions of targets per drug and drugs per target in each class were generated as box-whisker plots with GraphPad Prism 7.01.
Cross-class targeting statistics
For each class of targets, cancer drugs binding to a member of the target class with activities pAct higher than 5 were considered as drugs binding to the target class. For two target classes, the overlaps of their drug sets were calculated as the fraction of the size of the intersection of two drug sets over the size of the smaller set.
Results
Multi-target pharmacology has been found for most of the cancer drugs
A list of 237 cancer drugs was obtained from the drugs with Anatomical Therapeutic Chemical (ATC) code L01 and in the NCI cancer drug list29. The drug-target interaction data were collected from eight different sources, quantified, and converted to the uniform pAct (-Log(molar concentration)) values (See Methods). To reduce the noise of low activity drug-target interaction, targets with binding activity (pAct) lower than 5 were not included. Almost half of the cancer drugs fall into the category L01X, which contains antibodies (L01XC), kinase inhibitors (L01XE), etc. In addition, about 17% of cancer drugs are not classified into the L01 (antineoplastic) category, meaning that those drugs are mainly used for some other diseases, but they also show anticancer effects (Fig. 1a). Target-wise, only 27% of the drugs, typically biologics/antibodies, have only one characterized target. The majority of cancer drugs are known to have multiple targets. Nearly half of the known cancer drug targets are kinases, due to the fact that most kinase inhibitors (ATC code: L01XE) have been tested against the other kinases.
Figure 1.

Diagrams of (a) ATC code distributions of 237 cancer drugs and (b) drug target classes.
The number of targets per drug in each class is shown in Fig 2. To focus on significant drug-target interaction, we only counted the drug-target pairs with binding activities better than 10μM (pAct higher than 5). The majority of the cancer drugs have two or more known targets, in particular after the antibodies (L01XC) and biologics are excluded. Drugs in the L01XE class (protein kinase inhibitors) have many more known targets than other classes. Most of the drugs in the L01XC class (monoclonal antibodies) have only one target, unless the antibodies are conjugated with a small molecule drug, such as inotuzumab ozogamicin.
Figure 2.

Distribution of numbers of targets per drug in each class of cancer drugs, boxes were sorted by the median values.
The number of drugs per target, with pAct greater than 5, in each target class is shown in Fig 3, which could indicate the common target classes of cancer drugs. There are only four targets in the nucleic acid class, leading to the largest number of drugs per target. These nucleic acid targets are special because the drug actions are not as specific as protein targeting drugs. The second most popular target type is protein kinase, despite the large number of kinases, because protein kinase inhibitors (L01XE drug class) are known to act on many kinases concurrently and with significant target overlap.
Figure 3.

Distribution of numbers of drugs per target in each class of drug targets, boxes were sorted by the median values.
New cancer drug development focuses on antibodies and kinase inhibitor
To study the trends of preferred anticancer drug types and target classes, we collected the first FDA approval date of each cancer drug. Most of the newly approved (after 2010) cancer drugs belong to the monoclonal antibody (L01XC) and protein kinase inhibitor (L01XE) classes (Fig 4a). Since the drugs in L01XE class mainly target various protein kinases, targets in the kinase class have the most newly approved drugs (Fig. 4b). Similarly, Fig. 4b shows that many transmembrane proteins are targeted by newly approved antibodies (L01XC). In addition, the L01XX class has many newly approved drugs targeting newly discovered mechanisms and targets, such as Smoothened receptor (vismodegib, sonidegib), histone deacetylase (vorinostat, belinostat…), proteasome (botezomib, ixazomib…), etc. Discovering and targeting new pathways and proteins continues to lead to new cancer drug developments.
Figure 4.

Statistics of drugs based on the first approval date. (a) Number of drugs in each drug class, (b) number of drugs binding to each class of targets.
Single cancer drug against multiple target classes
To further explore the multi-target pharmacology of cancer drugs, we studied whether the multiple targets of a drug belong to the same target class or not. We calculated the number of drugs that have known targets belonging to each pair of two target classes (see Methods and Materials), shown in Fig. 5a. Most of the target class pairs have overlaps in their drug list, which corresponds to the fact that over half of the drugs have targets belonging to two or more classes, which we named as “cross-class targeting” (Fig. 5b). Therefore, the cross-class targeting is a relatively common phenomenon for cancer drugs, and we expect an even higher fraction of cross-class targeting drugs after further research is carried out. One target class that has a significantly low overlap with other classes is the “transmembrane protein”. Because many of the targets in this class are receptors of antibodies which usually have single-target pharmacology.
Figure 5.

Cross-class targeting of cancer drugs. (a) Heatmap showing the overlap of drug sets of two classes of targets, the dark green cells show the drug sets of two classes are highly overlapped. (b) Pie graph of percentage of drugs hitting a given number of target classes.
Drug approval date and number of known targets
It is likely that there is a correlation between the number of known drug-target activities and the time of the drug on the market. We compared the number of known targets for drugs with different approval date ranges. The first approval date was used if the drug has been approved for multiple indications and/or formulations. Drugs were classified into four date ranges, drugs approved before 2000, between 2000 and 2010, after 2010, and not approved (see Fig. 6). As expected, drugs approved before 2000 had a larger median number of known targets, while the other three ranges had smaller but comparable values. However, some newly approved drugs, especially protein kinase inhibitors (L01XE), had many more known targets than other drugs (see Fig. 6).
Figure 6.
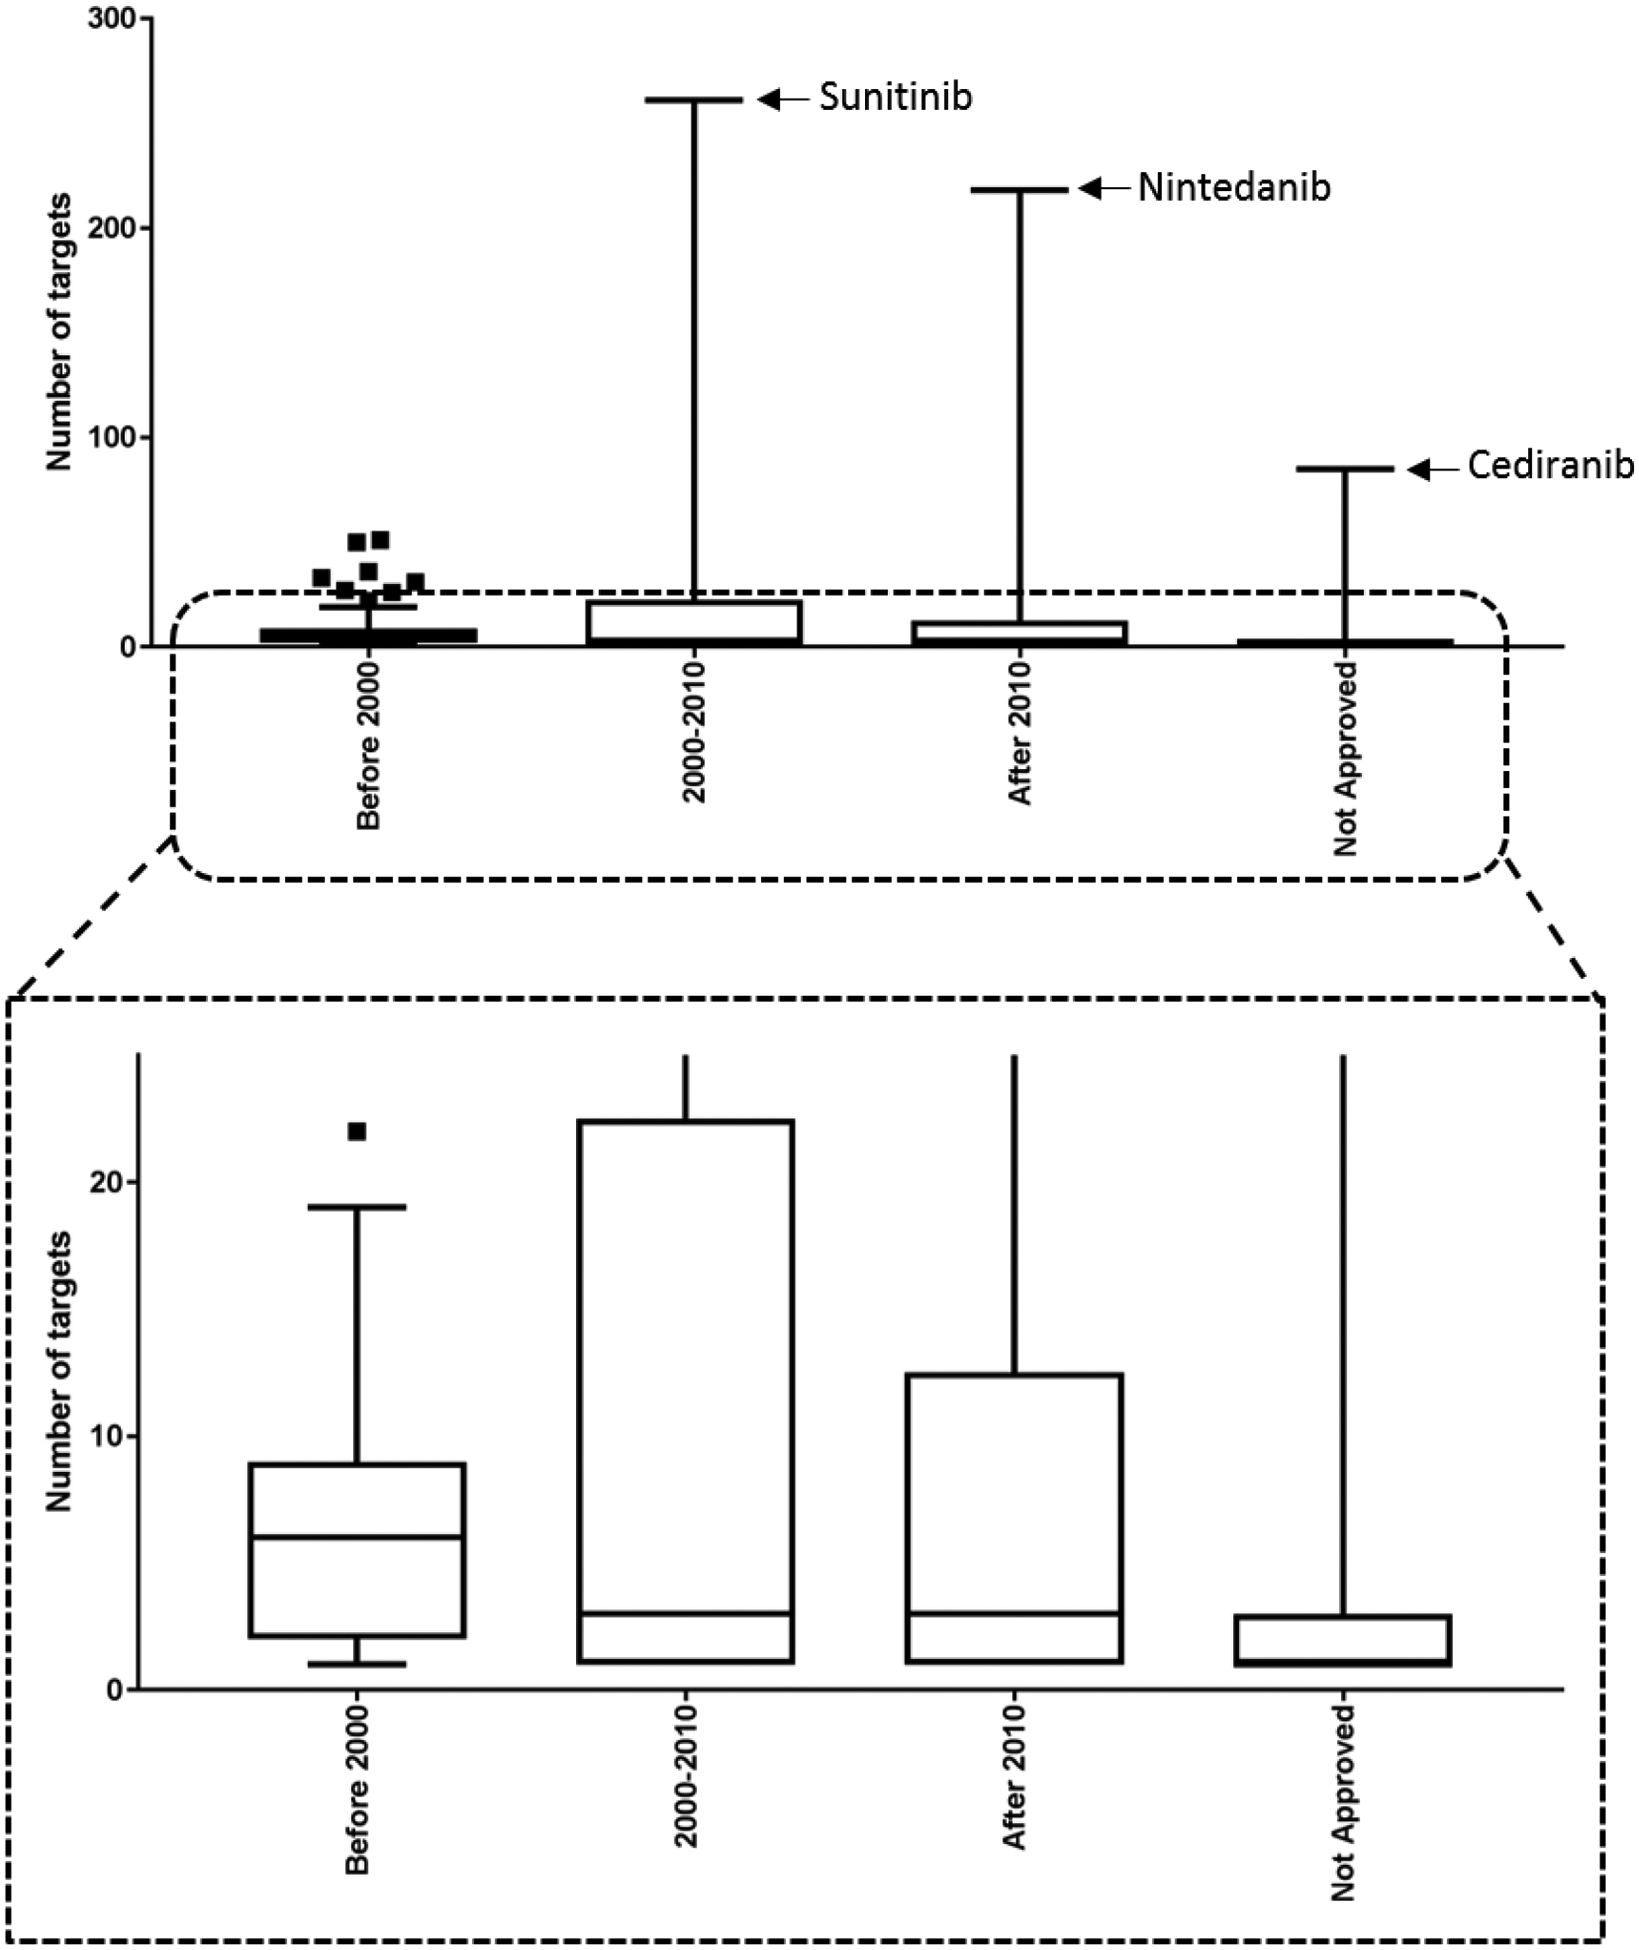
Distribution of number of target per drug in each category based on the approval date.
Network pharmacology map and web database layout
To directly show the pharmacology network of cancer drugs, we built sets of two proximity maps, drug-drug map and target-target map. In the drug-drug proximity map (Fig. 7), drugs are organized based on fraction of shared targets and ATC code similarities. Drugs are shown as nodes with different colors, and edges connect drugs with the highest target similarities and ATC code similarities. All anti-cancer drugs in the map were classified into nine classes based on their ATC codes, which correspond to different colors of nodes. Inside the node for each drug we incorporated several features of the drug. The Yin-Yang symbol marked covalent drugs which act through covalently binding to their targets, including covalent enzyme inhibitors, alkylating agents, and some nucleoside analogs. The black box symbol marked drugs which have black box warnings in their FDA labels, which are usually more toxic and need special precautions. We also estimated the approximate number of occurrences of each drug from the FAERS database, shown as the black crosses under the drug name. Maps of each of the nine classes of drugs were also generated and can be accessed through the menu. A set of alternative drug maps was also generated in which the distances between drugs were calculated only from drug-target interaction values to emphasize the pharmacological similarity of cancer drugs.
Figure 7.
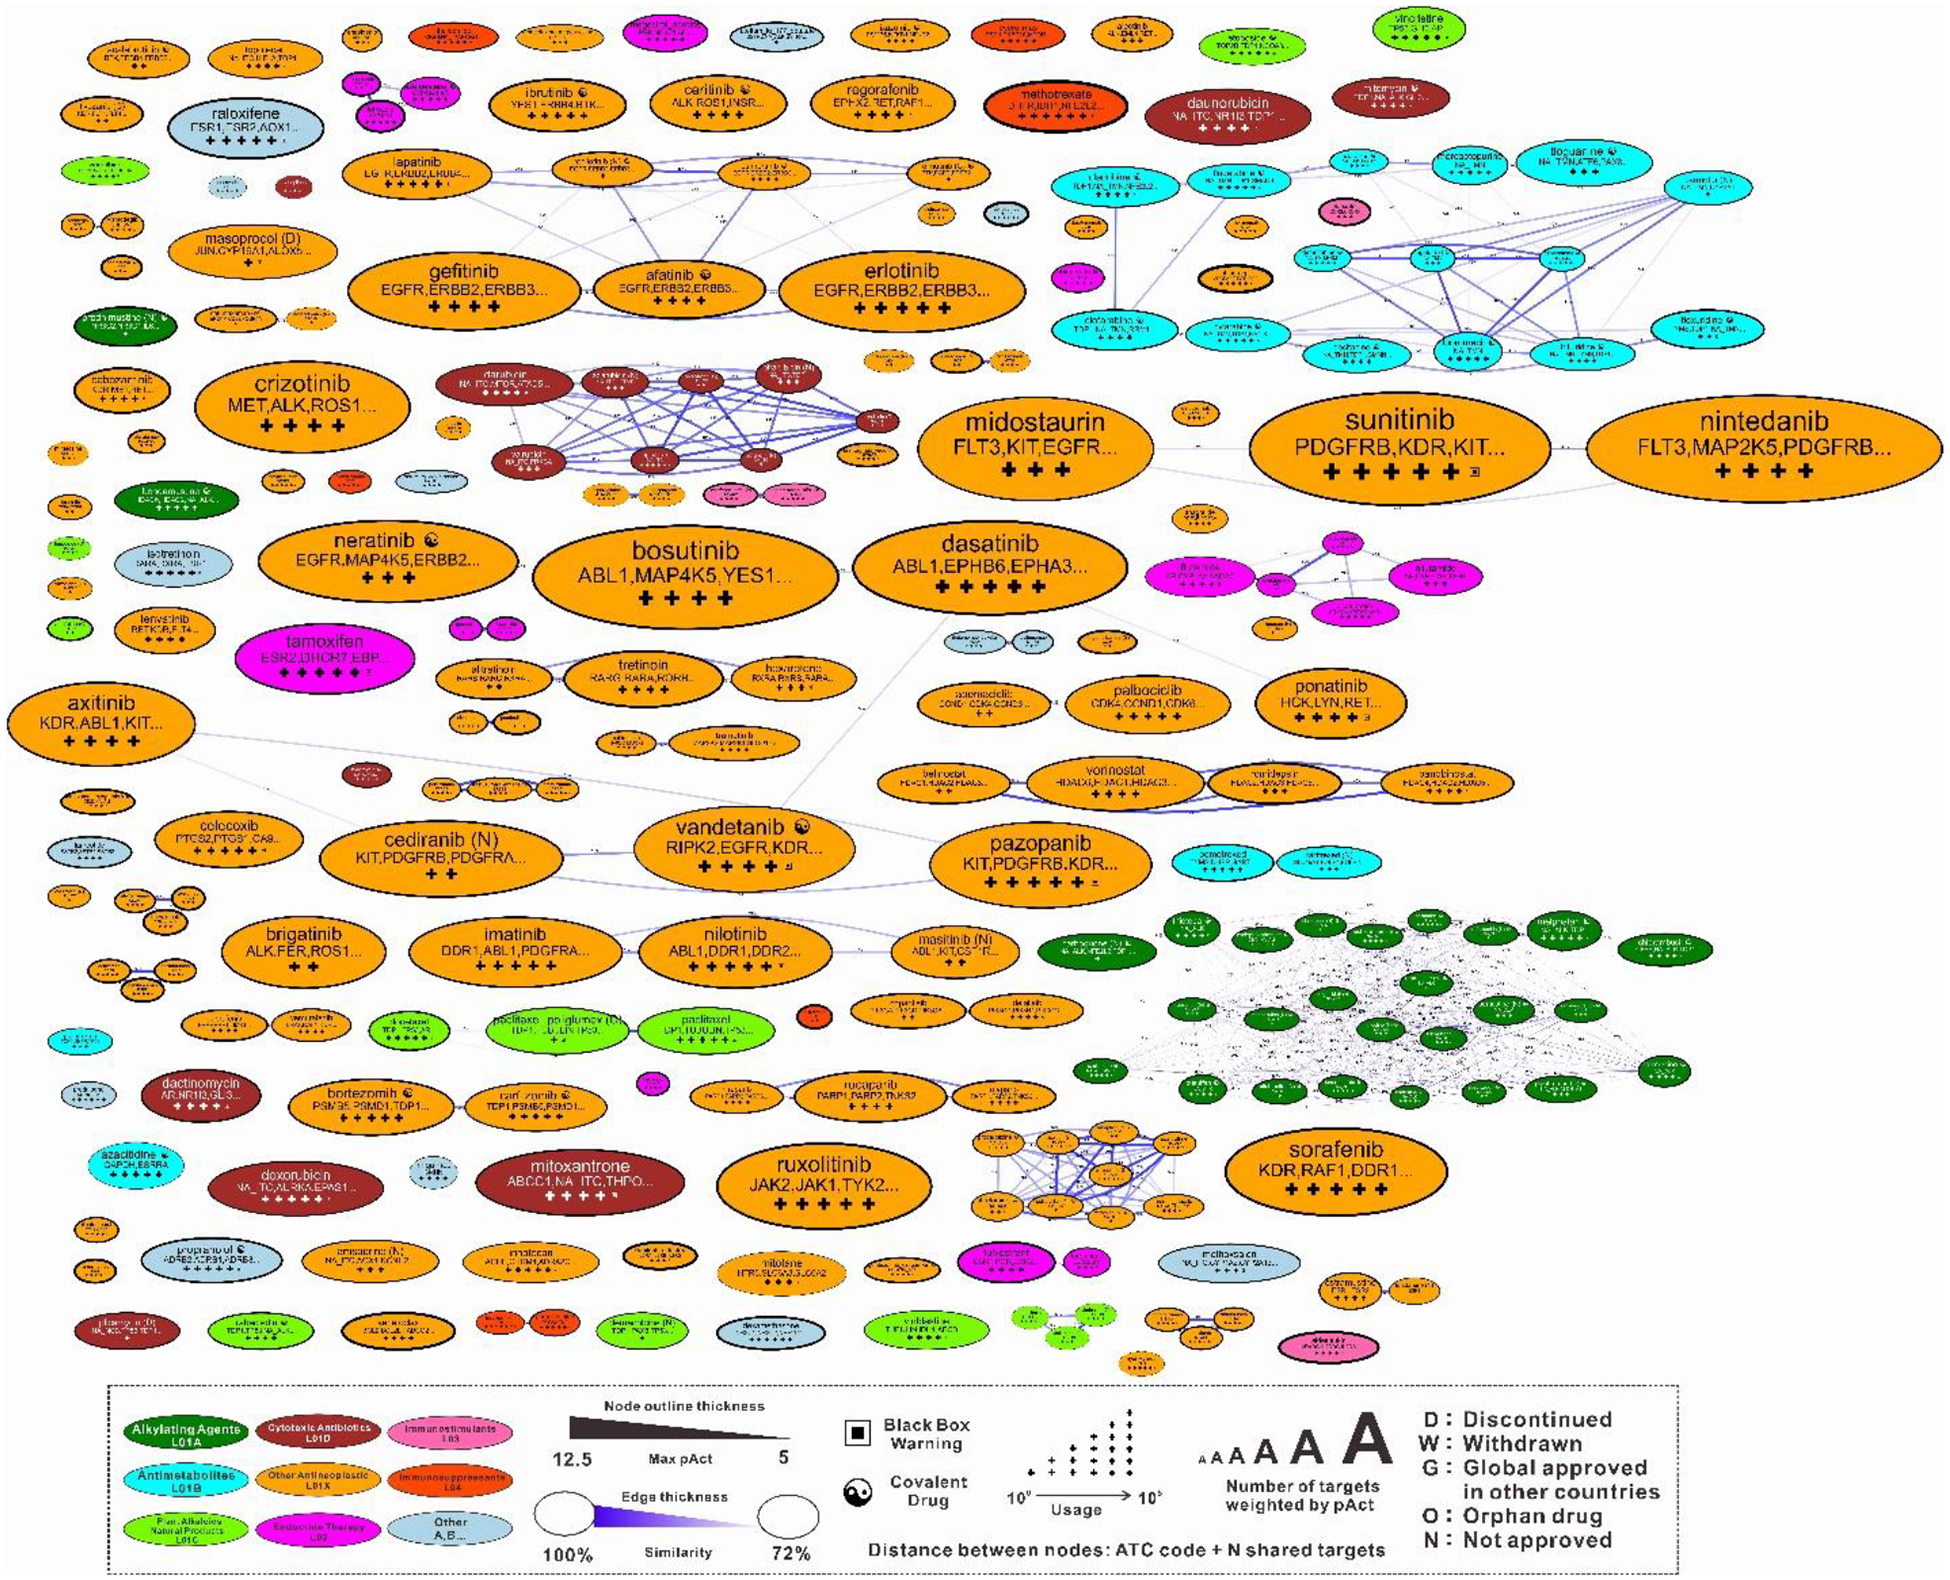
Network map of all cancer drugs. Drugs are classified into nine classes based on their ATC codes and colored differently. Drugs within the highest target similarities and ATC code similarities are connected with edges. Size of each node represents the activities weighted sum of number of targets of each drug.
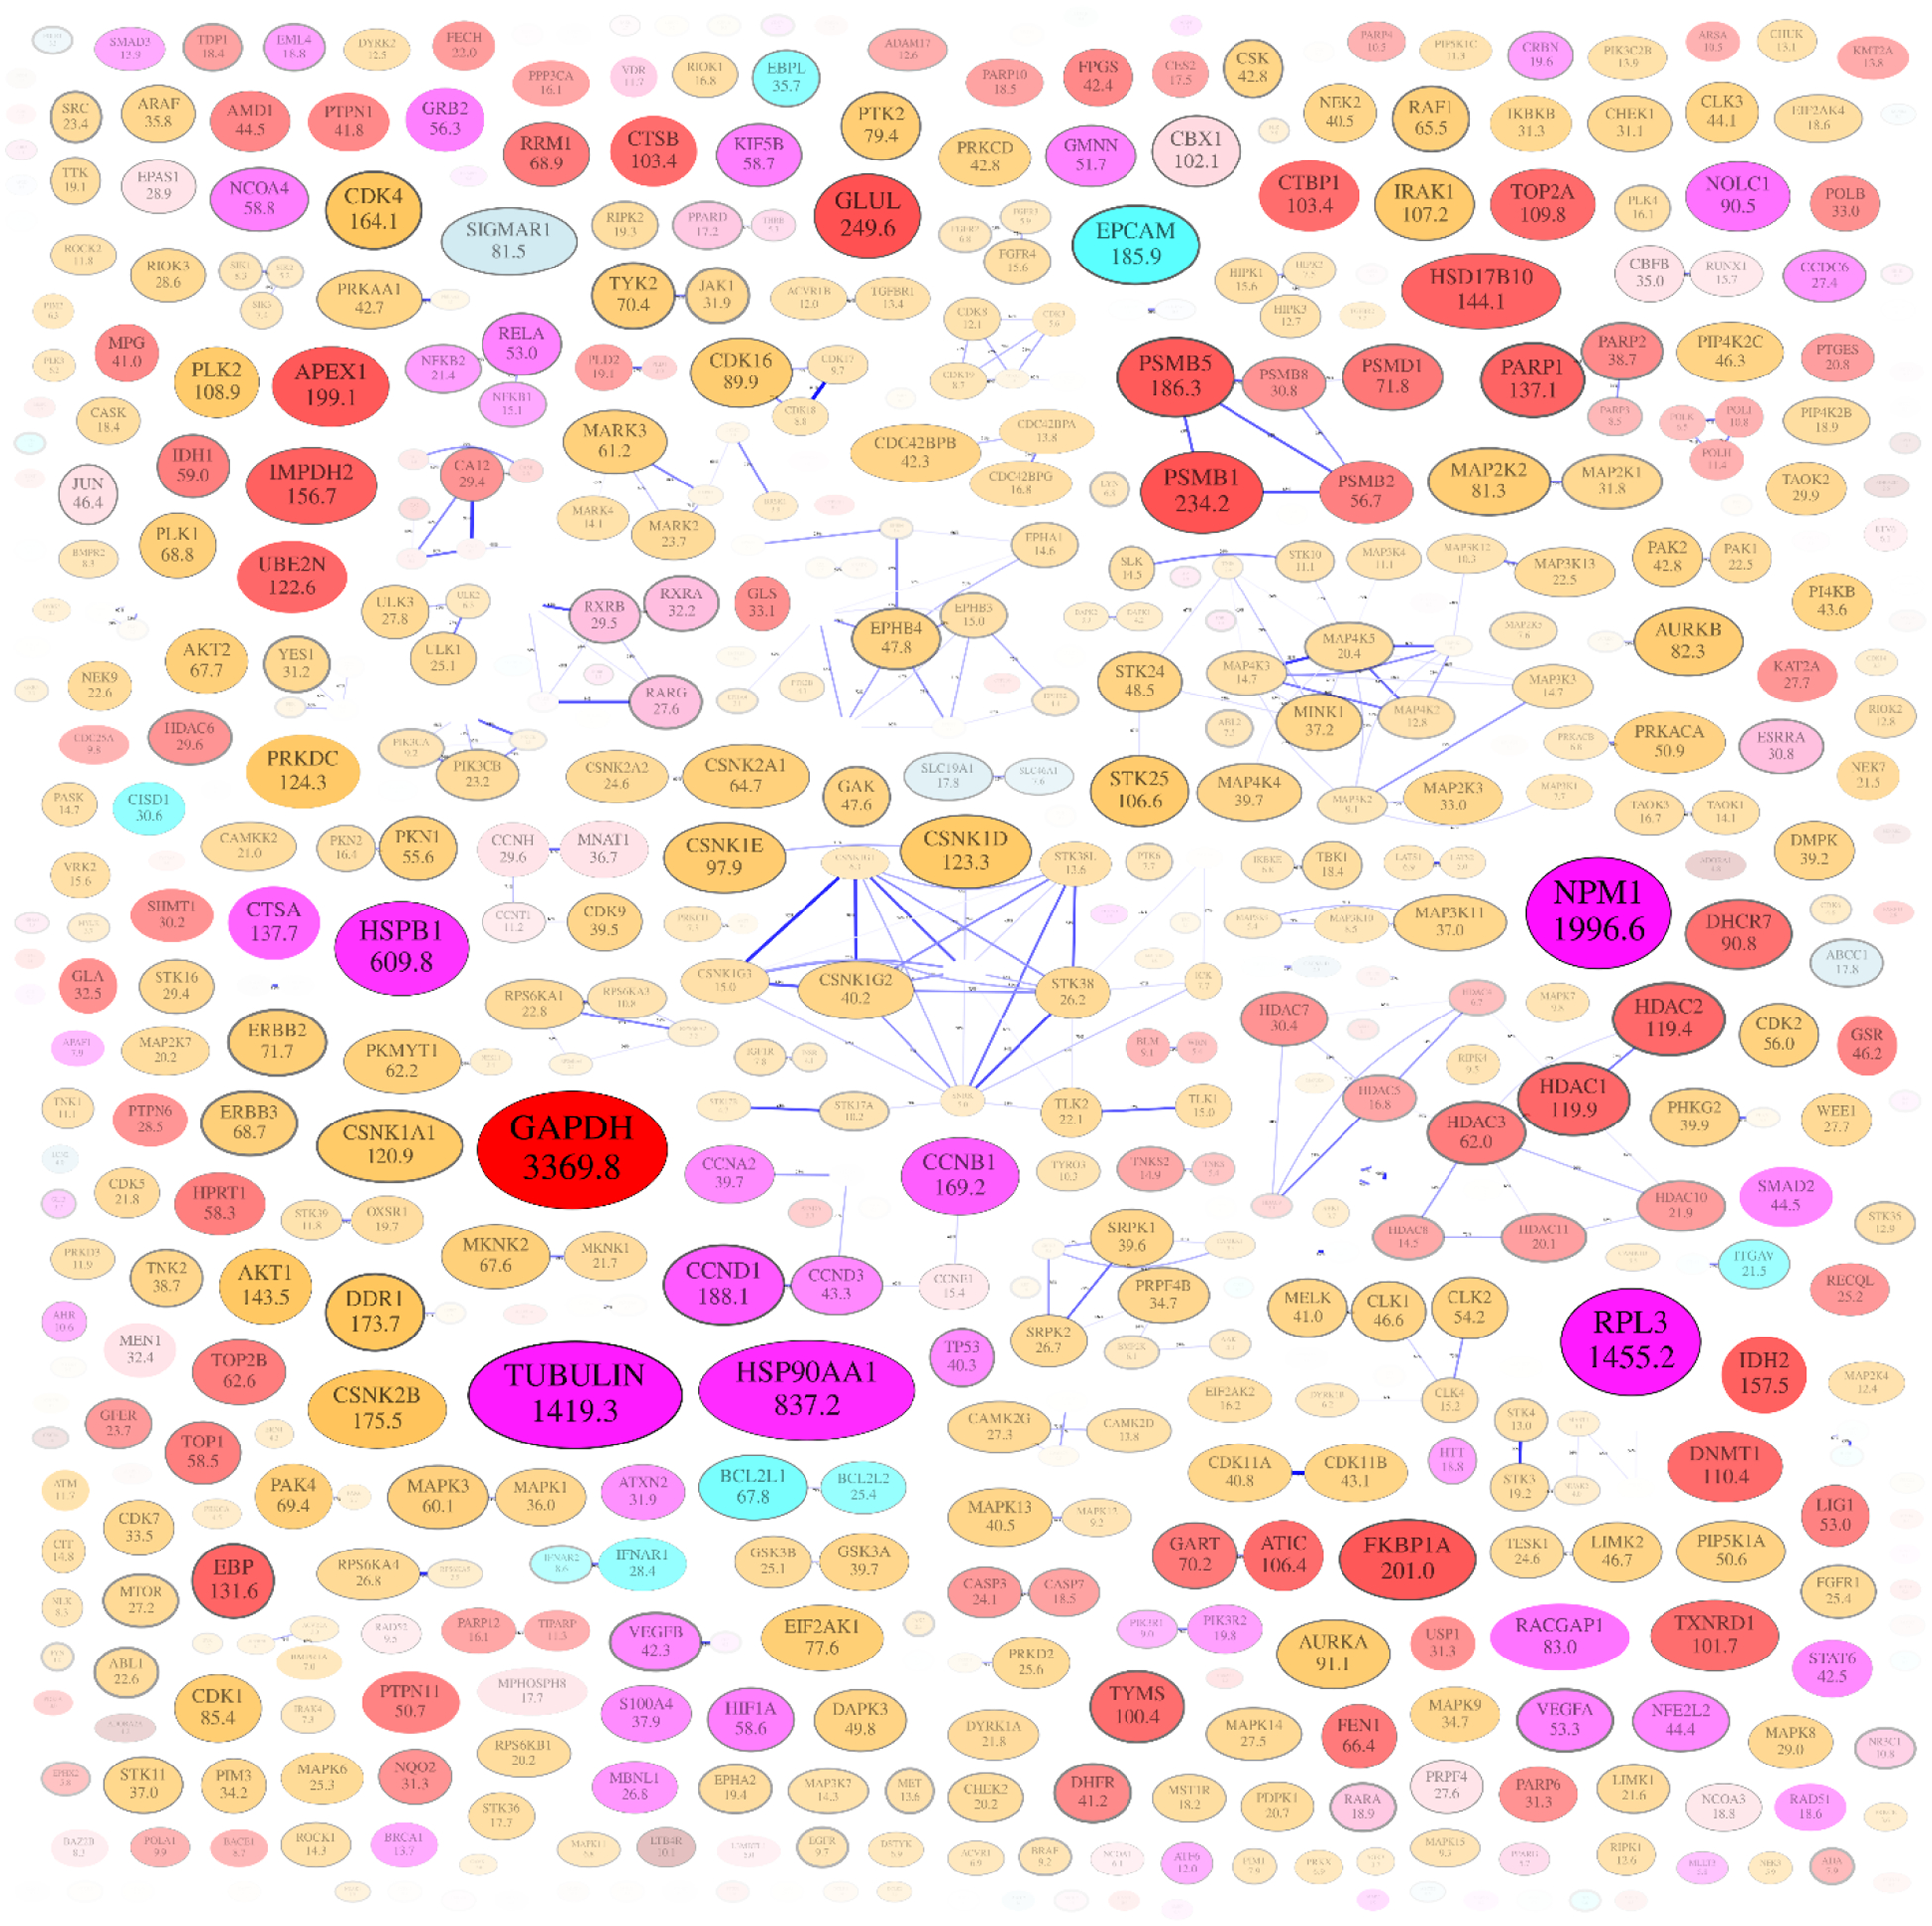
In the target-target proximity map (Fig. 8), targets are organized based on the number of concurrently hitting drugs and gene ontology (GO) similarities. Targets are shown as nodes with different colors, and edges connect the closest targets. Targets were classified into nine classes and colored differently to improve the readability of the map. In each target node, the gene name of protein was used except for nucleic acid and Tubulin which is comprised of various subunits. The number under the gene name illustrates the highest binding activity from all anti-cancer drugs for this target. Maps of each target class were also generated and can be accessed in the menu. A set of alternative target maps was also generated where the distances between targets were derived only from drug-target interaction values to emphasize the pharmacological similarity of targets.
Figure 8.

Network map of cancer drug targets. Targets are classified into nine classes and colored differently. The closest targets are connected with edges. The size of a node represents the activities weighted sum of number of drugs binding to the target.
A set of expression-value-informed target maps was generated for a various cancer cell lines and tissues by incorporating the expression data of each target into the maps. We extracted the expression level data of each target from the cancer cell line encyclopedia (CCLE)21, and incorporated the expression data to the map. As shown in Fig. 9, the sizes of nodes correspond to the median expression levels of targets in 51 different breast cancer cell lines. The poorly expressed targets were also made pale, so that we can easily identify the highly expressed targets for the cell line of interest.
Figure 9.
Network map of targets of cancer drugs. The median expression level of each target in the breast cancer cell line is incorporated. Size of each node corresponds expression value (Reads per kilo base per million mapped reads, RPKM) of each target which is also shown as the number inside. Nodes with low expression values are pale to highlight the highly expressed proteins.
Besides the network maps, we also generated an information page for each cancer drug and target. These pages can be accessed through clicking the nodes in the drug or target map or searching their names. A drug information page contains some basic information of the drug, such as CAS number, ATC code, and current approval status. The target binding activities of the drug is shown as a table and a bar graph. Using this feature a user can easily figure out the current knowledge about the targets of this drug. In addition, while the drug-drug map only shows connections between drugs within a cutoff distance (0.28), the information page of drug X contains the top-ranking multi-target pharmacology neighbors of drug X. Therefore, we can find the drugs with similar multi-target pharmacology. To study the pharmacokinetics and drug-drug interactions, we included the transporters, carriers and enzymes of each drug in the information page, together with their activity type (substrate, inhibitor, inducer, etc.). To analyze the effects of concurrent usage of cancer drugs, we analyzed the FAERS database and counted the number of records where two cancer drugs were used together. This is displayed as a bar graph in the information page of drug X, and mostly contains drugs which were combined with drug X in FAERS records. However, we should point out that the number of records in FAERS not only means that the drug combination has been used, it also means that one of the drugs or the drug combination is responsible for the reported adverse effects. The information page of target X contains a bar graph with drugs binding to target X, and the likely concurrent targets of target X. For protein targets, we generated a box and whisker graph of the expression levels of each target in different tissues. Additionally, the expression data is displayed in a table.
The complexity of the full drug or target network map can be reduced by focusing on a particular target or drug. The median tissue target expression values may be visualized on the same target map using the opacity property. The focused maps from two drugs or targets can be combined into a single table format to emphasize the differences and overlaps between the two. The filtering feature connects the drug map and target map, and makes it easier for users to explore the multi-target pharmacology of cancer drugs.
Discussion
With the relatively low success rate of the typical single-target drug discovery paradigm in recent years, multi-target drug and network pharmacology provides a more realistic conceptual framework in both small-molecule cancer therapeutics and other drug development2, 3, 14, 15, 30–33. Our study of cancer drugs revealed that multi-target pharmacology is an expected and inherent property for small-molecule therapeutics. The majority of cancer drugs are already known to hit multiple targets and target classes at therapeutic concentrations. Naturally, these considerations don’t extend to monoclonal antibodies that are highly specific to a single target. The cross-class targeting by a single therapeutic is also expected, because receptors and enzymes for the same substrate may differ by backbone topology, yet contain similar binding sites34. In addition, some protein targets contain multiple small-molecule binding sites, which may allow chemically diverse drugs to bind35–37. For example, it has been shown that protein kinase inhibitors such as, imatinib and nilotinib, are also able to target smoothened receptor of the Hedgehog pathway; celecoxib targets prostaglandin G/H synthase 2, carbonic anhydrases, and several nuclear receptors38, 39.
Even though our study showed that most of the cancer drugs had multiple known targets (the median number of already known concurrent targets of cancer drugs is 5), we believe that the multi-target pharmacology characterizations of cancer drugs is still under-explored. For example, we showed that protein kinase inhibitors (ATC code: L01XE) have a significantly larger number of targets than drugs in other classes. We believe this difference is from the large number of kinases and the experimental availability of the kinase activity panel. However, drugs outside of the L01XE class may not be tested against the whole kinase panel, even if some specific kinase binding activities might be tested. Consequently, we believe the difference of target set sizes of different drug classes results from insufficient experiments. Therefore, our current maps and derivative distributions are built from all experimentally tested and quantified drug-target interactions known today. Naturally, the maps may change as new interactions are discovered and characterized. The current map only represents the presently known sub-group of the full drug-target interaction set. The extent of multi-target pharmacology of small-molecule cancer drugs may expand in the future due to continuous research and improved target identification techniques. As a second tier, computer-based predictions can be performed to identify likely new targets of cancer drugs and prioritize them for experimental validation40.
This analysis illustrates that the majority of small-molecule cancer drugs have multiple known targets, whereas the biologics (e.g. antibodies) are usually highly specific to one target. The multi-target activities of small-molecule drugs may be both uniquely beneficial and adverse, while the single-target activity of biologics may be insufficient or suboptimal. A recent multi-target drug community challenge, also known as the DREAM challenge, highlighted the emerging appreciation of optimal multi-target profiles: the expected drug candidates were supposed to aim at four different targets simultaneously and avoid three or five other targets41.
Network maps are an efficient way to visualize and explore the multi-target pharmacology matrix of drugs42. In the cancer drug map, we can identify clusters of cancer drugs with similar target activity profiles. Using a quantitative description of multi-target activities of drugs provides a more realistic basis for therapeutic recommendations and new drug development objectives. In addition to the target activity values, we can also project the protein expression data of a specific cancer or patient to this target map, helping to figure out more effective drugs or combination therapies. Furthermore, the network maps can also be used to build predictive models for drug efficacy and drug combination synergy. The distance function for drugs may vary to fit the purpose of the analysis. For example, in a recently published work, the distance between drugs was calculated from target network connectivity counts based on the protein-protein interactome43. We adopted the activity-value-weighted distance function together with the ATC-graph-based shortest path distance for drug pairs.
In conclusion, the substantial and inevitable multi-target pharmacology of small-molecule cancer drugs needs to be incorporated into the mechanism of drug actions, therapeutic strategies and drug discovery objectives30–32, 44–46. Here we analyzed the already known multi-target pharmacology properties of cancer drugs. By compiling the drug-target interaction data from various sources, we greatly expanded the number of targets of cancer drugs. We showed that the majority of cancer drugs affect multiple targets at therapeutic concentrations, and over a half of the cancer drugs are known to hit different target classes concurrently. The multi-target pharmacology network of cancer drugs is still not fully explored, and it will grow with the advance of high-throughput experimental binding and activity assays. In addition, based on the expanded drug-target binding activities data, we built cancer drug network maps and target network maps and made them available as a web database, CancerDrugMap. The database contains a comprehensive cancer drug-target interaction data with an emphasis on realistic multi-target pharmacology at therapeutic drug concentrations and target expression levels in different cell lines. This information may be valuable for repurposing drugs to different cancer types, for identifying complementary and synergistic drug combinations, and for customizing prescriptions for patient-specific target profiles.
Acknowledgement
The authors thank Hooree Amerkhanian, Yingyan Zhuang and Ittipat Meewan for helping collect the drug and target data. We also thank Chris X Edwards, Chengjin Sun, and Lei Zhang for helping normalize and standardize the FAERS data and set up the web database. We thank Conall Sauvey for proofreading the manuscript. Author FK acknowledges the Department of Health Research, New Delhi, India for LTFF fellowship (Award No.: DHR/HRD/LTFF-12-2015-16 dated March 31, 2016).
Funding Sources
FK was supported by LTFF fellowship of the Department of Health Research, New Delhi, India (Award No.: DHR/HRD/LTFF-12-2015-16 dated March 31, 2016).
Abbreviations
- ATC
anatomical therapeutic chemical
- FAERS
FDA adverse event reporting system
- CCLE
cancer cell line encyclopedia
- GO
gene ontology
- GPCR
G-protein coupled receptor
Footnotes
The authors declare no potential conflicts of interest.
Reference
- 1.Hanahan D; Weinberg Robert A., Hallmarks of Cancer: The Next Generation. Cell 2011, 144, 646–674. [DOI] [PubMed] [Google Scholar]
- 2.Hutchinson L; Kirk R, High Drug Attrition Rates—Where Are We Going Wrong? Nat. Rev. Clin. Oncol 2011, 8, 189–190. [DOI] [PubMed] [Google Scholar]
- 3.Hopkins AL, Network Pharmacology: The Next Paradigm in Drug Discovery. Nat. Chem. Biol 2008, 4, 682–690. [DOI] [PubMed] [Google Scholar]
- 4.Kaelin WG Jr, The Concept of Synthetic Lethality in the Context of Anticancer Therapy. Nat. Rev. Cancer 2005, 5, 689–698. [DOI] [PubMed] [Google Scholar]
- 5.Campillos M; Kuhn M; Gavin A-C; Jensen LJ; Bork P, Drug Target Identification Using Side-Effect Similarity. Science 2008, 321, 263–266. [DOI] [PubMed] [Google Scholar]
- 6.Overington JP; Al-Lazikani B; Hopkins AL, How Many Drug Targets Are There? Nat. Rev. Drug Discovery 2006, 5, 993–996. [DOI] [PubMed] [Google Scholar]
- 7.Wishart DS; Feunang YD; Guo AC; Lo EJ; Marcu A; Grant JR; Sajed T; Johnson D; Li C; Sayeeda Z; Assempour N; Iynkkaran I; Liu Y; Maciejewski A; Gale N; Wilson A; Chin L; Cummings R; Le D; Pon A; Knox C; Wilson M, DrugBank 5.0: A Major Update to the DrugBank Database for 2018. Nucleic Acids Res. 2018, 46, D1074–D1082. [DOI] [PMC free article] [PubMed] [Google Scholar]
- 8.Li YH; Yu CY; Li XX; Zhang P; Tang J; Yang Q; Fu T; Zhang X; Cui X; Tu G; Zhang Y; Li S; Yang F; Sun Q; Qin C; Zeng X; Chen Z; Chen YZ; Zhu F, Therapeutic Target Database Update 2018: Enriched Resource for Facilitating Bench-to-Clinic Research of Targeted Therapeutics. Nucleic Acids Res. 2018, 46, D1121–D1127. [DOI] [PMC free article] [PubMed] [Google Scholar]
- 9.Gaulton A; Hersey A; Nowotka M; Bento AP; Chambers J; Mendez D; Mutowo P; Atkinson F; Bellis LJ; Cibrián-Uhalte E; Davies M; Dedman N; Karlsson A; Magariños MP; Overington JP; Papadatos G; Smit I; Leach AR, The ChEMBL Database in 2017. Nucleic Acids Res. 2017, 45, D945–D954. [DOI] [PMC free article] [PubMed] [Google Scholar]
- 10.Kim S; Thiessen PA; Bolton EE; Chen J; Fu G; Gindulyte A; Han L; He J; He S; Shoemaker BA; Wang J; Yu B; Zhang J; Bryant SH, PubChem Substance and Compound Databases. Nucleic Acids Res. 2016, 44, D1202–D1213. [DOI] [PMC free article] [PubMed] [Google Scholar]
- 11.Gilson MK; Liu T; Baitaluk M; Nicola G; Hwang L; Chong J, BindingDB in 2015: A Public Database for Medicinal Chemistry, Computational Chemistry and Systems Pharmacology. Nucleic Acids Res. 2016, 44, D1045–D1053. [DOI] [PMC free article] [PubMed] [Google Scholar]
- 12.Günther S; Kuhn M; Dunkel M; Campillos M; Senger C; Petsalaki E; Ahmed J; Urdiales EG; Gewiess A; Jensen LJ; Schneider R; Skoblo R; Russell RB; Bourne PE; Bork P; Preissner R, SuperTarget and Matador: Resources for Exploring Drug-Target Relationships. Nucleic Acids Res. 2008, 36, D919–D922. [DOI] [PMC free article] [PubMed] [Google Scholar]
- 13.Yıldırım MA; Goh K-I; Cusick ME; Barabási A-L; Vidal M, Drug—Target Network. Nat. Biotechnol 2007, 25, 1119–1126. [DOI] [PubMed] [Google Scholar]
- 14.Cheng F; Liu C; Jiang J; Lu W; Li W; Liu G; Zhou W; Huang J; Tang Y, Prediction of Drug-Target Interactions and Drug Repositioning via Network-Based Inference. PLoS Comput. Biol 2012, 8, e1002503. [DOI] [PMC free article] [PubMed] [Google Scholar]
- 15.Lu J-J; Pan W; Hu Y-J; Wang Y-T, Multi-Target Drugs: The Trend of Drug Research and Development. PLoS One 2012, 7, e40262. [DOI] [PMC free article] [PubMed] [Google Scholar]
- 16.Santos R; Ursu O; Gaulton A; Bento AP; Donadi RS; Bologa CG; Karlsson A; Al-Lazikani B; Hersey A; Oprea TI; Overington JP, A Comprehensive Map of Molecular Drug Targets. Nat. Rev. Drug Discovery 2016, 16, 19–34. [DOI] [PMC free article] [PubMed] [Google Scholar]
- 17.Hert J; Keiser MJ; Irwin JJ; Oprea TI; Shoichet BK, Quantifying the Relationships among Drug Classes. J. Chem. Inf. Model 2008, 48, 755–765. [DOI] [PMC free article] [PubMed] [Google Scholar]
- 18.Bento AP; Gaulton A; Hersey A; Krüger FA; Papadatos G; Chambers J; Mak L; Bellis LJ; Davies M; Nowotka M; Santos R; McGlinchey S; Light Y; Overington JP, The ChEMBL Bioactivity Database: An Update. Nucleic Acids Res 2013, 42, D1083–D1090. [DOI] [PMC free article] [PubMed] [Google Scholar]
- 19.Fang H; Su Z; Wang Y; Miller A; Liu Z; Howard PC; Tong W; Lin SM, Exploring the FDA Adverse Event Reporting System to Generate Hypotheses for Monitoring of Disease Characteristics. Clin. Pharmacol. Ther 2014, 95, 496–498. [DOI] [PMC free article] [PubMed] [Google Scholar]
- 20.Makunts T; Cohen IV; Awdishu L; Abagyan R, Analysis of Postmarketing Safety Data for Proton-Pump Inhibitors Reveals Increased Propensity for Renal Injury, Electrolyte Abnormalities, and Nephrolithiasis. Sci. Rep 2019, 9, 2282. [DOI] [PMC free article] [PubMed] [Google Scholar]
- 21.Barretina J; Caponigro G; Stransky N; Venkatesan K; Margolin AA; Kim S; Wilson CJ; Lehár J; Kryukov GV; Sonkin D; Reddy A; Liu M; Murray L; Berger MF; Monahan JE; Morais P; Meltzer J; Korejwa A; Jané-Valbuena J; Mapa FA; Thibault J; Bric-Furlong E; Raman P; Shipway A; Engels IH; Cheng J; Yu GK; Yu J; Aspesi P; de Silva M; Jagtap K; Jones MD; Wang L; Hatton C; Palescandolo E; Gupta S; Mahan S; Sougnez C; Onofrio RC; Liefeld T; MacConaill L; Winckler W; Reich M; Li N; Mesirov JP; Gabriel SB; Getz G; Ardlie K; Chan V; Myer VE; Weber BL; Porter J; Warmuth M; Finan P; Harris JL; Meyerson M; Golub TR; Morrissey MP; Sellers WR; Schlegel R; Garraway LA, The Cancer Cell Line Encyclopedia Enables Predictive Modelling of Anticancer Drug Sensitivity. Nature 2012, 483, 603–607. [DOI] [PMC free article] [PubMed] [Google Scholar]
- 22.Ashburner M; Ball CA; Blake JA; Botstein D; Butler H; Cherry JM; Davis AP; Dolinski K; Dwight SS; Eppig JT, Gene Ontology: Tool for the Unification of Biology. Nat. Genet 2000, 25, 25–29. [DOI] [PMC free article] [PubMed] [Google Scholar]
- 23.Popescu M; Keller JM; Mitchell JA, Fuzzy Measures on the Gene Ontology for Gene Product Similarity. IEEE/ACM Trans. Comput. Biol. Bioinf 2006, 3, 263–274. [DOI] [PubMed] [Google Scholar]
- 24.Mistry M; Pavlidis P, Gene Ontology Term Overlap as a Measure of Gene Functional Similarity. BMC Bioinf 2008, 9, 327. [DOI] [PMC free article] [PubMed] [Google Scholar]
- 25.Pesquita C; Faria D; Falcão AO; Lord P; Couto FM, Semantic Similarity in Biomedical Ontologies. PLoS Comput. Biol 2009, 5, e1000443. [DOI] [PMC free article] [PubMed] [Google Scholar]
- 26.Mamano N; Hayes WB, SANA NetGO: A Combinatorial Approach to Using Gene Ontology (GO) Terms to Score Network Alignments. Bioinformatics 2017, 34, 1345–1352. [DOI] [PubMed] [Google Scholar]
- 27.The UniProt Consortium, UniProt: The Universal Protein Knowledgebase. Nucleic Acids Res 2017, 45, D158–D169. [DOI] [PMC free article] [PubMed] [Google Scholar]
- 28.Ellson J; Gansner ER; Koutsofios E; North SC; Woodhull G Graphviz and Dynagraph — Static and Dynamic Graph Drawing Tools In Graph Drawing Software, Jünger M; Mutzel P, Eds.; Springer Berlin Heidelberg: Berlin, Heidelberg, 2004, pp 127–148. [Google Scholar]
- 29.Cancer Drugs - National Cancer Institute. https://www.cancer.gov/about-cancer/treatment/drugs (2018/08/24),
- 30.Giordano S; Petrelli A, From Single-To Multi-Target Drugs in Cancer Therapy: When Aspecificity Becomes an Advantage. Curr. Med. Chem 2008, 15, 422–432. [DOI] [PubMed] [Google Scholar]
- 31.Poornima P; Kumar JD; Zhao Q; Blunder M; Efferth T, Network Pharmacology of Cancer: From Understanding of Complex Interactomes to the Design of Multi-Target Specific Therapeutics From Nature. Pharmacol. Res 2016, 111, 290–302. [DOI] [PubMed] [Google Scholar]
- 32.Tang J; Aittokallio T, Network Pharmacology Strategies Toward Multi-Target Anticancer Therapies: From Computational Models to Experimental Design Principles. Curr. Pharm. Des 2014, 20, 23–36. [DOI] [PMC free article] [PubMed] [Google Scholar]
- 33.Hopkins AL, Network Pharmacology. Nat. Biotechnol 2007, 25, 1110–1111. [DOI] [PubMed] [Google Scholar]
- 34.Duran-Frigola M; Siragusa L; Ruppin E; Barril X; Cruciani G; Aloy P, Detecting Similar Binding Pockets to Enable Systems Polypharmacology. PLoS Comput. Biol 2017, 13, e1005522. [DOI] [PMC free article] [PubMed] [Google Scholar]
- 35.Kufareva I; Ilatovskiy AV; Abagyan R, Pocketome: An Encyclopedia of Small-Molecule Binding Sites in 4D. Nucleic Acids Res. 2011, 40, D535–D540. [DOI] [PMC free article] [PubMed] [Google Scholar]
- 36.Lallous N; Dalal K; Cherkasov A; Rennie P, Targeting Alternative Sites on the Androgen Receptor to Treat Castration-Resistant Prostate Cancer. Int. J. Mol. Sci 2013, 14, 12496–12519. [DOI] [PMC free article] [PubMed] [Google Scholar]
- 37.Siarheyeva A; Senisterra G; Allali-Hassani A; Dong A; Dobrovetsky E; Wasney Gregory A.; Chau I; Marcellus R; Hajian T; Liu F; Korboukh I; Smil D; Bolshan Y; Min J; Wu H; Zeng H; Loppnau P; Poda G; Griffin C; Aman A; Brown Peter J.; Jin J; Al-awar R; Arrowsmith Cheryl H.; Schapira M; Vedadi M, An Allosteric Inhibitor of Protein Arginine Methyltransferase 3. Structure 2012, 20, 1425–1435. [DOI] [PubMed] [Google Scholar]
- 38.Morphy R; Rankovic Z, Designed Multiple Ligands. An Emerging Drug Discovery Paradigm. J. Med. Chem 2005, 48, 6523–6543. [DOI] [PubMed] [Google Scholar]
- 39.Gupta AK; Gupta RA; Soni LK; Kaskhedikar SG, Exploration of Physicochemical Properties and Molecular Modelling Studies of 2-Sulfonyl-Phenyl-3-Phenyl-Indole Analogs As Cyclooxygenase-2 Inhibitors. Eur. J. Med. Chem 2008, 43, 1297–1303. [DOI] [PubMed] [Google Scholar]
- 40.Bottegoni G; Favia AD; Recanatini M; Cavalli A, The Role of Fragment-Based and Computational Methods in Polypharmacology. Drug Discovery Today 2012, 17, 23–34. [DOI] [PubMed] [Google Scholar]
- 41.Schlessinger A; Abagyan R; Carlson HA; Dang KK; Guinney J; Cagan RL, Multi-targeting Drug Community Challenge. Cell Chem. Biol 2017, 24, 1434–1435. [DOI] [PubMed] [Google Scholar]
- 42.Lamb J, The Connectivity Map: A New Tool for Biomedical Research. Nat. Rev. Cancer 2007, 7, 54–60. [DOI] [PubMed] [Google Scholar]
- 43.Cheng F; Kovács IA; Barabási A-L, Network-Based Prediction of Drug Combinations. Nat. Commun 2019, 10, 1197. [DOI] [PMC free article] [PubMed] [Google Scholar]
- 44.Cavalli A; Bolognesi ML; Minarini A; Rosini M; Tumiatti V; Recanatini M; Melchiorre C, Multi-target-Directed Ligands To Combat Neurodegenerative Diseases. J. Med. Chem 2008, 51, 347372. [DOI] [PubMed] [Google Scholar]
- 45.Fang J; Wu Z; Cai C; Wang Q; Tang Y; Cheng F, Quantitative and Systems Pharmacology. 1. In Silico Prediction of Drug–Target Interactions of Natural Products Enables New Targeted Cancer Therapy. J. Chem. Inf. Model 2017, 57, 2657–2671. [DOI] [PMC free article] [PubMed] [Google Scholar]
- 46.Cheng F; Jia P; Wang Q; Zhao Z, Quantitative Network Mapping of the Human Kinome Interactome Reveals New Clues for Rational Kinase Inhibitor Discovery and Individualized Cancer Therapy. Oncotarget 2014, 5, 3697–3710. [DOI] [PMC free article] [PubMed] [Google Scholar]