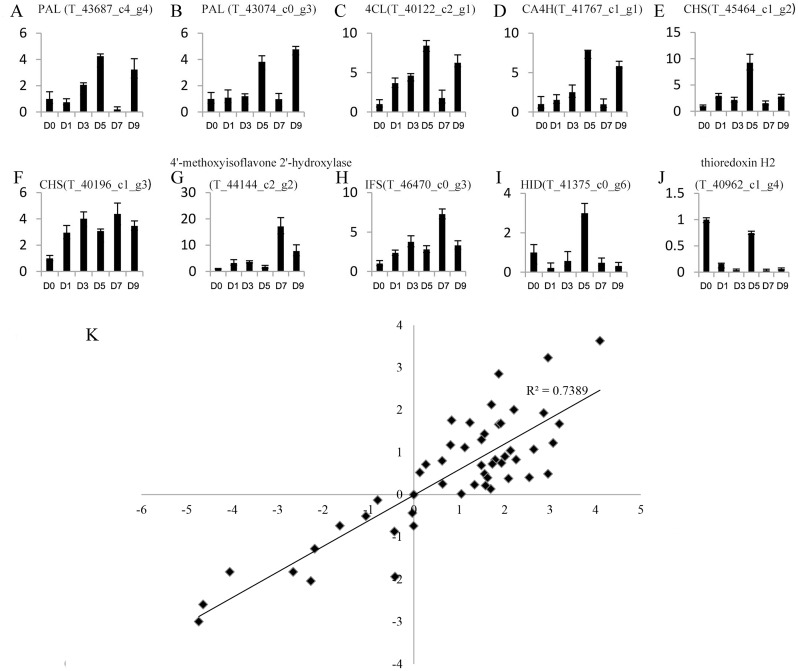
Figure 4. Expression profiles of 10 unigenes by qRT-PCR (A–J) and the correlation of the results between qRT-PCR and RNA-Seq (K).
(A–J) Fold changes of the unigenes are shown. The average expression levels in the controls were set to 1. Error bars represent standard error. (K) The correlation between the qRT-PCR and RNA-Seq expression levels. The X-axis represents log2 fold change in the expression levels found by qRT-PCR. The Y-axis indicates the log2 value of the expression level fold change from RNA-Seq.

