Abstract
Aggregation of human α-synuclein (αSyn) is linked to Parkinson’s disease (PD) pathology. The central region of the αSyn sequence contains the non-amyloid β-component (NAC) crucial for aggregation. However, how NAC flanking regions modulate αSyn aggregation remains unclear. Using bioinformatics, mutation, and NMR we identify a 7-residue sequence, named P1 (residues 36-42), that controls αSyn aggregation. Deletion or substitution of this ‘master-controller’ prevents aggregation at pH 7.5 in vitro. At lower pH, P1 synergises with a sequence containing the PreNAC region (P2, residues 45-57) to prevent aggregation. Deleting P1 (ΔP1) or both P1 and P2 (ΔΔ) also prevents age-dependent αSyn aggregation and toxicity in C. elegans models and prevents αSyn-mediated vesicle fusion by altering the conformational properties of the protein when lipid-bound. The results highlight the importance of a master-controller sequence motif that controls both αSyn aggregation and function- a region that could be targeted to prevent aggregation in disease.
Introduction
The aggregation of α-synuclein (αSyn), a neuronal protein with a primary locus at pre-synaptic nerve termini of the central nervous system1, is closely associated with Parkinson’s disease (PD) and other synucleinopathies2,3. PD affects more than 1% of the world population over the age of 60 and 10 million people worldwide4. The aetiology of PD and the processes by which αSyn self-assembles to and causes toxicity is not fully understood. For example, while monomeric αSyn is intrinsically disordered in vitro and in vivo5,6, it forms an array of oligomers7,8 and fibril structures9, only some of which are cytotoxic or infectious7.
The primary sequence of αSyn comprises three regions (Figure 1A). The N-terminal region (residues 1-60), is basic and contains 6 to 9 conserved imperfect repeats (KTKEGV) crucial for membrane binding10. The central NAC region (residues 61-95), has been shown to be necessary and sufficient for the aggregation of αSyn11,12. This region also forms the core of some, but not all, αSyn amyloid fibril structures13–15. Finally, the C-terminal region (residues 96-140) is highly flexible and enriched in acidic residues. Although αSyn is an intrinsically disordered protein (IDP), it has a smaller radius of gyration16–18 and collisional cross section19 than expected for a 140-residue random coil20. Its compaction is driven by transient long range electrostatic and hydrophobic interactions between the chemically distinct domains17,21. Given its distinct charge patterning (12 basic residues in the N-terminal region and 15 acidic residues in the C-terminal region), the conformational properties of αSyn are dependent on the solution pH and ionic strength16–18,21, which in turn affect the aggregation rate of the NAC region22,23.
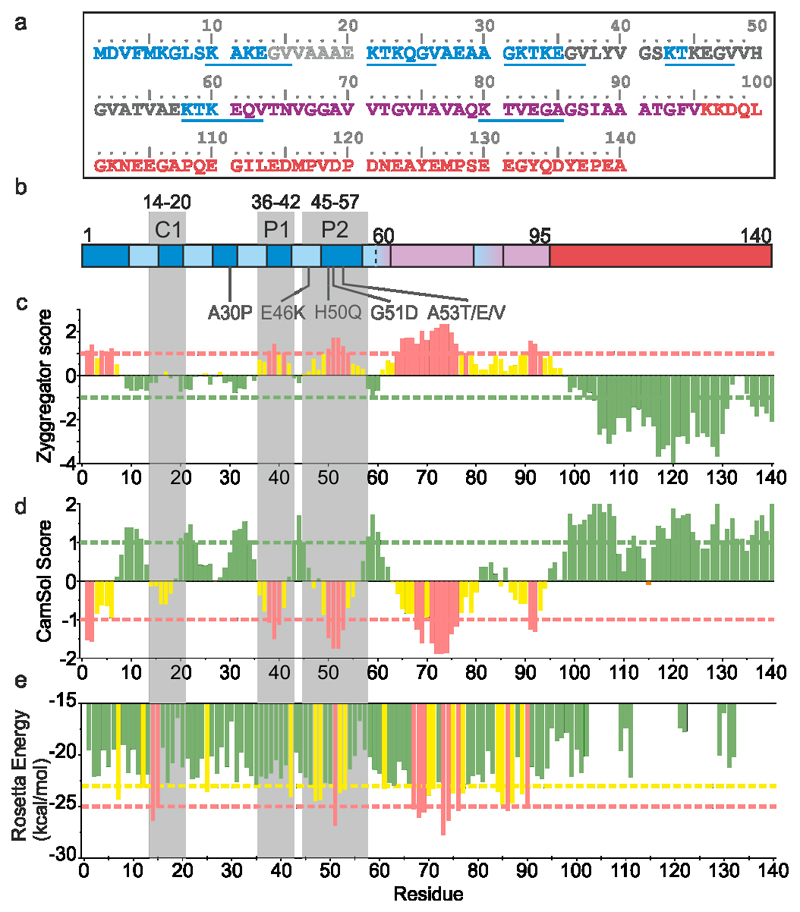
Figure 1. Aggregation and solubility profiles of αSyn.
a) The sequence of human αSyn. The N-terminal region (1-60), NAC region (61-95) and C-terminal region (96-140) are coloured in blue, pink, and red, respectively. The C1 and P1/P2 regions shown in (b) are coloured pale grey and dark grey respectively. The imperfect KTKEGV repeats are underlined in blue. b) Regions of αSyn highlighting the imperfect KTKEGV repeats in the N-terminal region (light blue), the positions of the seven familial PD mutants, and the P1, P2 and C1 control sequence highlighted as in (a). c), d) and e) Zyggregator37, Camsol38 and ZipperDB39 profiles for the αSyn sequence, respectively. Red bars indicate aggregation-prone/low solubility regions. Yellow bars indicate residues with a higher than average aggregation propensity/low solubility, but which do not meet the threshold. Red dashed lines indicate the low solubility/high aggregation propensity threshold, while green dashed lines show threshold values for high solubility/low aggregation propensity. For Zipper DB, the yellow dashed line shows the threshold value of residues with a high probability of β-zipper formation39. Data for graphs in c-e are available as Source Data.
The effects of sequence changes on the conformational properties and aggregation rates of IDPs have been widely studied24–28. Notably for αSyn, the seven known familial point mutations that lead to early onset PD are clustered in a region (residues 30-53) that flanks NAC (Figure 1A). Deletion of two of the imperfect repeats (residues 9-30), or truncation of the C-terminal region by 11 to 37 residues, increase the rate of αSyn aggregation29–31, while insertion of two additional N-terminal imperfect repeats (by duplication of residues 9-30) inhibits aggregation30, highlighting the important, but complex, roles of these regions in modulating assembly. Other studies have suggested that the region preceding NAC (residues 47-56, known as PreNAC) is an important modulator of αSyn aggregation, as this region contains the familial mutations and is able to aggregate into amyloid-like fibrils in isolation32. This sequence also forms the inter-protofilament interface in some13,14,33, but not all13, αSyn amyloid fibril structures. However, the molecular mechanism(s) by which this region modulates assembly remain unclear.
Here, we used in silico methods to identify two sequence motifs named P1 (residues 36-42) and P2 (residues 45-57) in the N-terminal region of αSyn that have limited solubility and significant aggregation propensity. We show that these regions are critical for aggregation in vitro and when expressed in vivo as a αSyn-YFP fusion in the bodywall muscle cells of C. elegans34. Paramagnetic relaxation enhancement (PRE) NMR experiments reveal pH- and salt-dependent interactions of these motifs with the NAC and C-terminal regions of the protein, the presence of which correlates with an increased aggregation rate. Finally, we show that P1 and P2 are important for αSyn-mediated membrane fusion35,36, since their deletion prevents lipid tubule formation and alters the structure of the lipid-bound protein. Together, the results identify P1 as the ‘master-controller’ of αSyn aggregation as this region governs the conformational properties and aggregation propensity of αSyn at neutral pH. This region also acts synergistically with P2 (PreNAC) to control assembly at low (lysosomal) pH. The results portray the tug-of-war between function and aggregation in this IDP, with the presence of the P1/P2 regions being essential for vesicle fusion, while simultaneously enhancing amyloid formation.
Results
Identification of the P1 and P2 motifs in the N-terminal region of αSyn
To investigate the role of the flanking regions of αSyn in aggregation we analysed its sequence (Figure 1a) using Zyggregator (amyloid propensity37); Camsol (local solubility38) and ZipperDB (β-zipper propensity39) (Figure 1b-e). This revealed three sequences in the N-terminal region predicted to have low solubility (similar to NAC): 2DVFMKGL7, 36GVLYVGS42(named P1) and 45KEGVVHGVATVAE57 (named P2). These regions also have high amyloid propensity as judged by Zyggregator, while ZipperDB identified P2, but not P1 or the N-terminal segment as aggregation-prone. Since the role of the N-terminal region of αSyn (residues 1-30) has previously been studied by characterisation of deletion40 and extension30 variants, this region was not considered further here. The PreNAC region (residues 47-56) was identified by Eisenberg and colleagues32 and forms part of P2 (residues 45-57). This region also contains six of the seven known familial PD point mutations (Figure 1a). Previous studies have identified a potential role for the P1 and P2 regions in αSyn aggregation, with 47-56 forming amyloid-like aggregates in isolation32, while others have shown that inducing β-hairpin formation in the P1/P2 region (residues 37VLYVGSK43 and 48VVHGVAT54) stabilised by binding to a β-wrapin (an engineered binding protein) prevents fibril formation41–43. Precisely how these sequences affect aggregation in the intact protein, however, remained unclear.
The P1 and P2 regions control aggregation
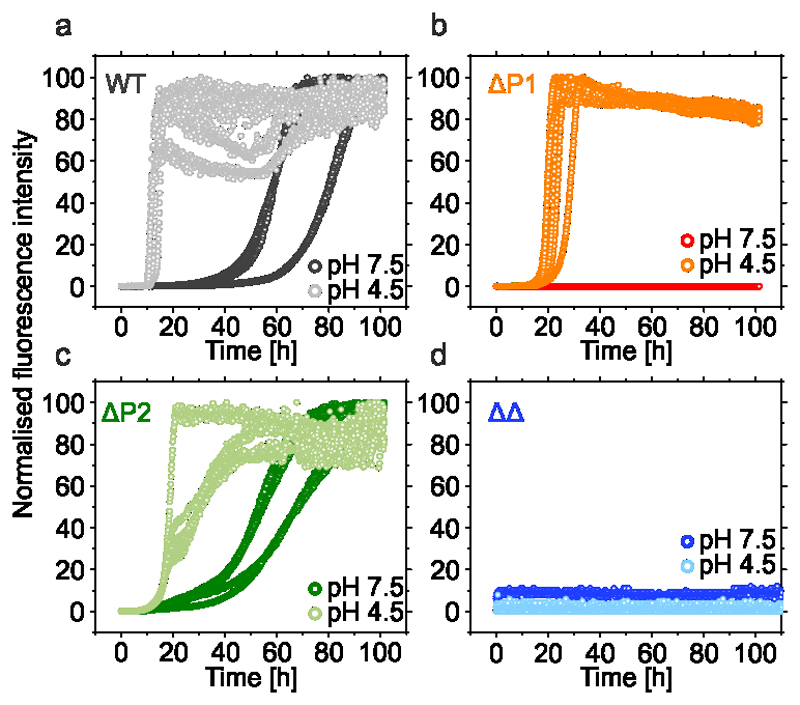
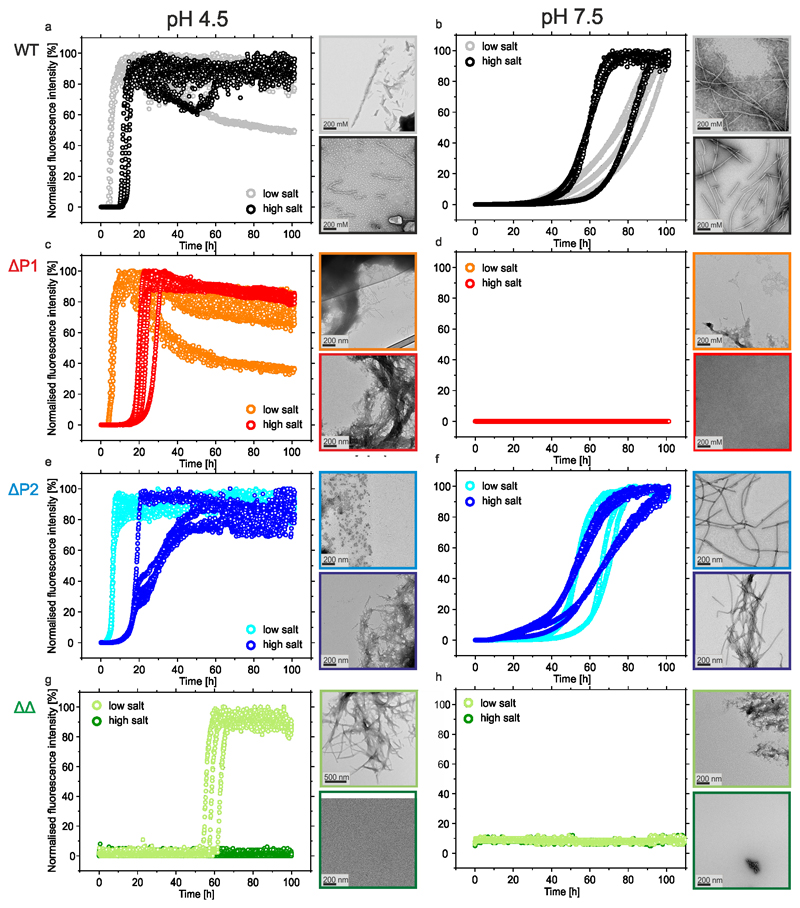
To investigate how P1 and P2 affect αSyn aggregation, these regions were deleted individually (ΔP1 and ΔP2) or in tandem (ΔΔ) and the rate of aggregation monitored using thioflavin T (ThT) fluorescence and compared with those of WT αSyn (Figure 2a-d, Extended Data Figure 1a-h and Supplementary Table 1). The aggregates formed after 100 h were also imaged by negative stain transmission electron microscopy (TEM) (Extended Data Figure 1) and fibril yield determined by centrifugation (Supplementary Table 1). The results showed that decreasing the pH from 7.5 to 4.5 (mimicking cytosolic and lysosomal pH, respectively) in 200 mM NaCl accelerates the rate of aggregation of WT αSyn, decreasing the lag-time ~6-fold and increasing the elongation rate ~10-fold (Figure 2a, Supplementary Table 1) consistent with previous results44,45. Aggregation of WT αSyn is also affected by ionic strength46, with assembly into amyloid occurring more rapidly at pH 4.5 at low (20mM added NaCl) compared with high (200 mM added NaCl) ionic strength, while aggregation is more rapid at pH 4.5 than pH 7.5 at both ionic strengths tested (Extended Data Figure 1a,b and Supplementary Table 1).
Figure 2. The kinetics of aggregation of WT αSyn and P1/P2 deletion variants.
a-d The aggregation kinetics of 100 μM WT αSyn (a); ΔP1 (b); ΔP2 (c) or ΔΔ variants (d). Dark and light colours denote incubations carried out at pH 7.5 (20 mM Tris HCl, 200 mM NaCl, pH 7.5) or pH 4.5 (20 mM sodium acetate, 200 mM NaCl, pH 4.5), respectively. All experiments were carried out at 37 °C with agitation at 600 rpm and measured in at least triplicate. Lag times and elongation rates were determined for every single curve using OriginPro (see Methods), means and s.d. are listed in Supplementary Table 1. The fibril yield under each condition, determined by SDS PAGE subsequent to centrifugation (see Methods), is shown in Supplementary Table 1. Data for all graphs are available as Source Data.
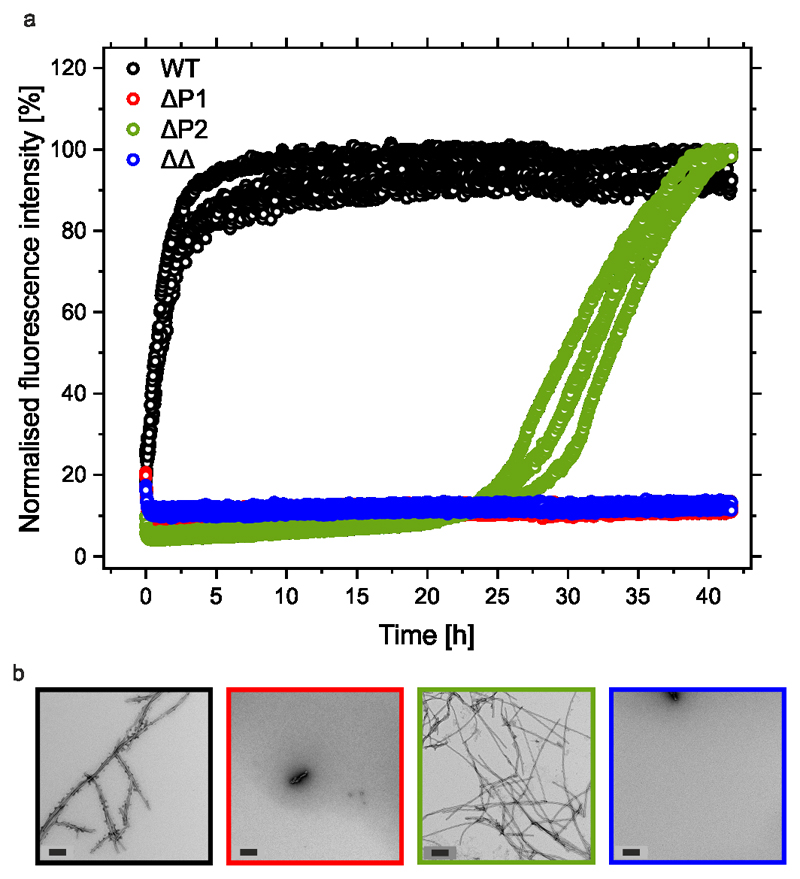
Remarkably, deleting the 7-residue P1 sequence abolished aggregation (over 100 h) at pH 7.5 at low and high ionic strength (Figure 2b, Extended Data Figure 1d, Supplementary Table 1). Deletion of P1 has a smaller effect at pH 4.5, with little effect at low ionic strength and a ~2-fold increase in the lag time and a ~2-fold decrease in the elongation rate at high ionic strength (Figure 2b, Extended Data Figure 1c, Supplementary Table 1). By contrast, deletion of P2 results in only modest effects under all conditions studied (Figure 2c, Extended Data Figure 1e,f, Supplementary Table 1). Strikingly, the ΔΔ variant did not aggregate (over 100 h) at both pH values at high ionic strength, or at pH 7.5 at low ionic strength, and the lag time of assembly was increased ~15-fold at pH 4.5 in low ionic strength buffer (Figure 2d, Extended Data Figure 1g,h and Supplementary Table 1). This suggests a dominant role for P1 in controlling the aggregation rate of this 140-residue IDP and shows that the effects of P1 are synergistic with P2 at pH 4.5. ΔP1 and ΔΔ were also unable to elongate seeds formed at pH 7.5 from WT αSyn, whilst ΔP2 formed fibrils slowly (Extended Data Figure 2), suggestive of a structural incompatibility of these sequences with fibril seeds formed from the WT protein.
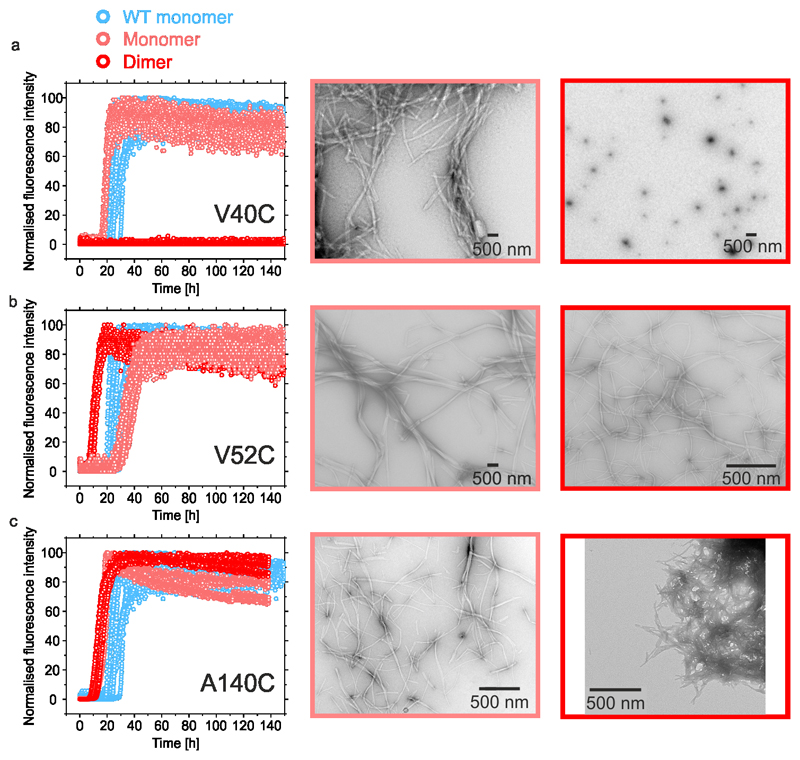
The importance of P1 and P2 in promoting aggregation was also assessed by measuring the aggregation rate of disulfide cross-linked dimers of αSyn created by introducing Cys residues in P1 (V40C), P2 (V52C) or at the C-terminus (A140C). In the presence of 2 mM DTT, each variant formed amyloid with kinetics similar to those of WT αSyn (Figure 3a-c, Supplementary Table 1). Dimerisation (confirmed by SEC-MALS (see Methods)) prevented aggregation (for at least 140 h) for V40C (Figure 3a). However, such an effect was not observed for V52C or A140C (Figure 3b,c, Supplementary Table 1), supporting the finding that P1 is important for aggregation. The positional sensitivity of the dimerisation site was not observed previously when αSyn was cross-linked by dityrosine formation at Y39 and Y125, Y133 or Y13647 suggesting a strict steric/positional sensitivity of inhibition. This could act at the stage of dimer formation, or by the imposed dimerisation altering the structure of seeds/oligomers formed later during assembly.
Figure 3. ThT fluorescence assays of disulfide locked αSyn dimers.
a-c Aggregation kinetics and negative stain TEM images of endpoint (140 h) aggregates of 100 μM V40C (a), V52C (b) or A140C (c) monomers or dimers. Incubations of monomeric or disulfide locked dimers of αSyn are shown in light and dark red, respectively. Aggregation kinetics of WT αSyn are shown in blue. The same data for the WT αSyn are shown overlaid for all three variants. All experiments were measured in at least triplicate. TEMs with light border show end point images of reduced samples and dark borders show end point images of disulfide bonded dimers. Each image was collected from a representative sample for each condition., All assays were carried out in 20 mM sodium acetate buffer, containing 200 mM NaCl, pH 4.5 (including 2 mM DTT for reduced samples), 37 °C with agitation at 600 rpm. Data for all ThT graphs are available as Source Data.
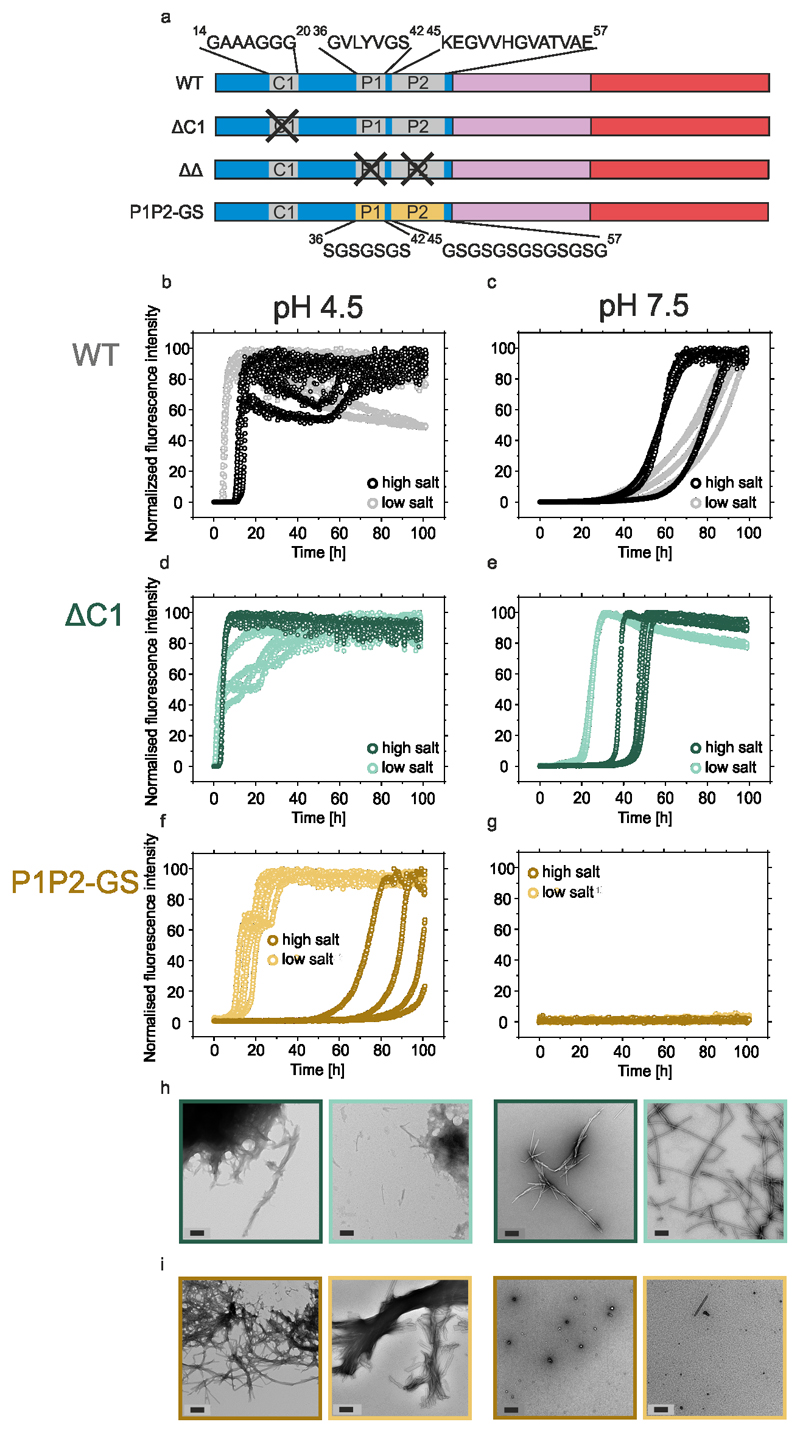
The presence of up to nine imperfect repetitive KTKEGV sequences in the N-terminal region of αSyn raised the possibility that the effects of deleting P1 and/or P2 may result from changes in the spatial organisation of the repeats (Figure 1b). To assess this possibility, a variant was constructed in which a seven-residue sequence in a different location in the N-terminal region was deleted (residues 14-20, denoted ΔC1) (Figure 1b). ΔC1 was designed to mimic the general features of P1 as closely as possible i.e. the sequence deleted is of the same length and similar positioning between imperfect repeats as P1. In contrast to the marked effects of deleting P1, ΔC1 had no significant effect at pH 7.5 or pH 4.5 at high ionic strength, and even accelerated aggregation (decreasing the lag-time ~10-fold) at pH 4.5 at low ionic strength (Extended Data Figure 3a-d, Supplementary Table 1). Fibrils were also observed after 140 hours in all conditions as judged by negative stain EM and quantification of soluble protein remaining (Extended Data Figure 3g, Supplementary Table 1). A second control variant, named P1P2-GS, was also created in which the 7 residues in P1 and 13 residues in P2 were replaced with alternating Gly-Ser sequences, 7 and 13 residues in length, respectively, preserving the spacing of the imperfect repeats (Extended Data Figure 3a). At pH 7.5 P1P2-GS did not aggregate at low or high ionic strength, similar to the behaviour of ΔΔ (Extended Data Figure 3g,i, Supplementary Table 1). At pH 4.5, aggregation did occur (Extended Data Figure 3f,i, but was significantly retarded compared with WT αSyn (Supplementary Table 1). These data show that the effect of P1 and P2 on aggregation is mainly sequence-specific and does not result from alterations in the length of the N-terminal region or the spacing of the imperfect repeats.
P1 and P2 make multiple intra-molecular contacts that promote amyloid formation
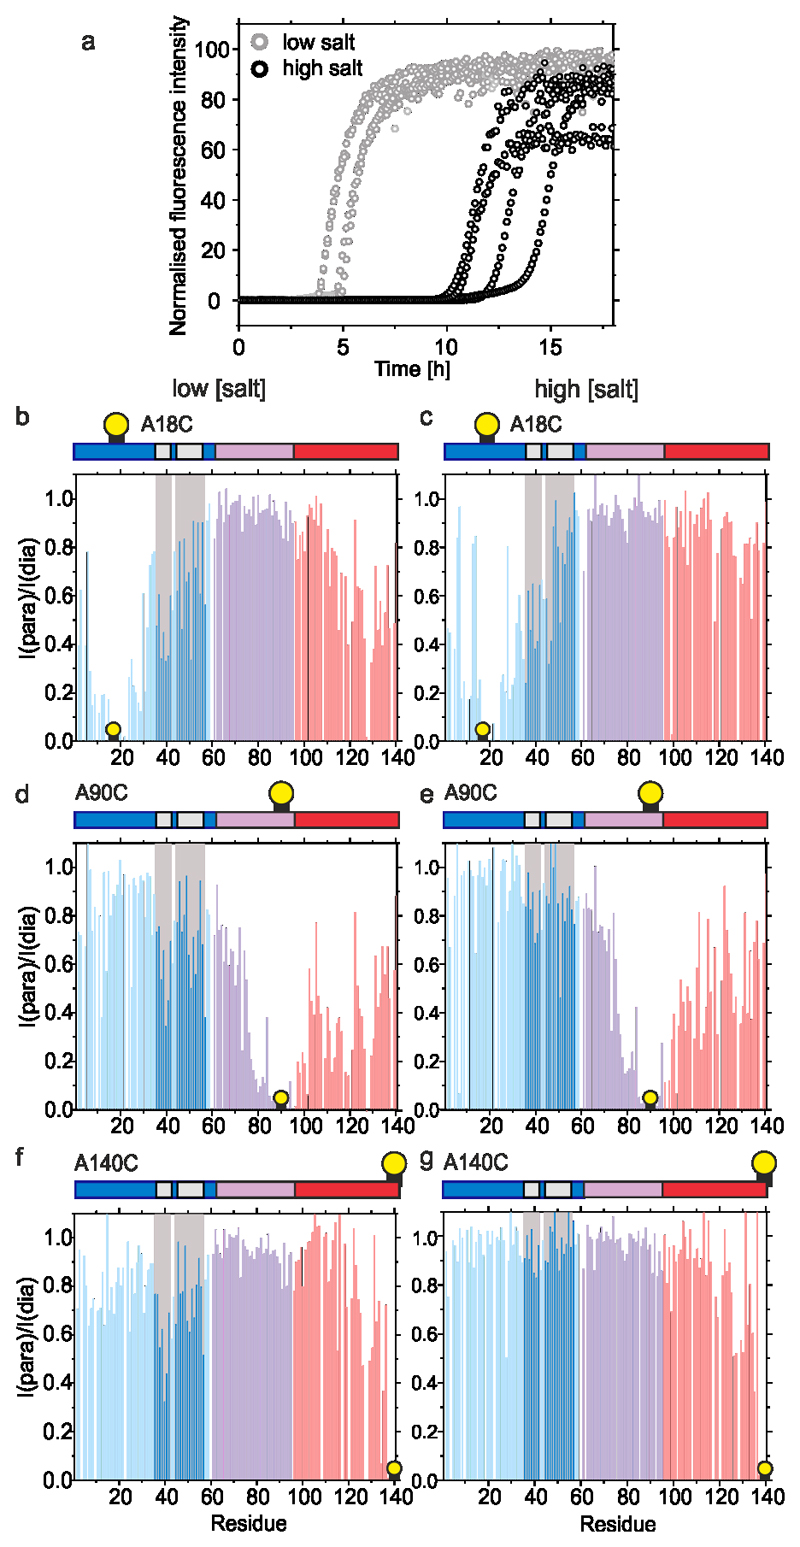
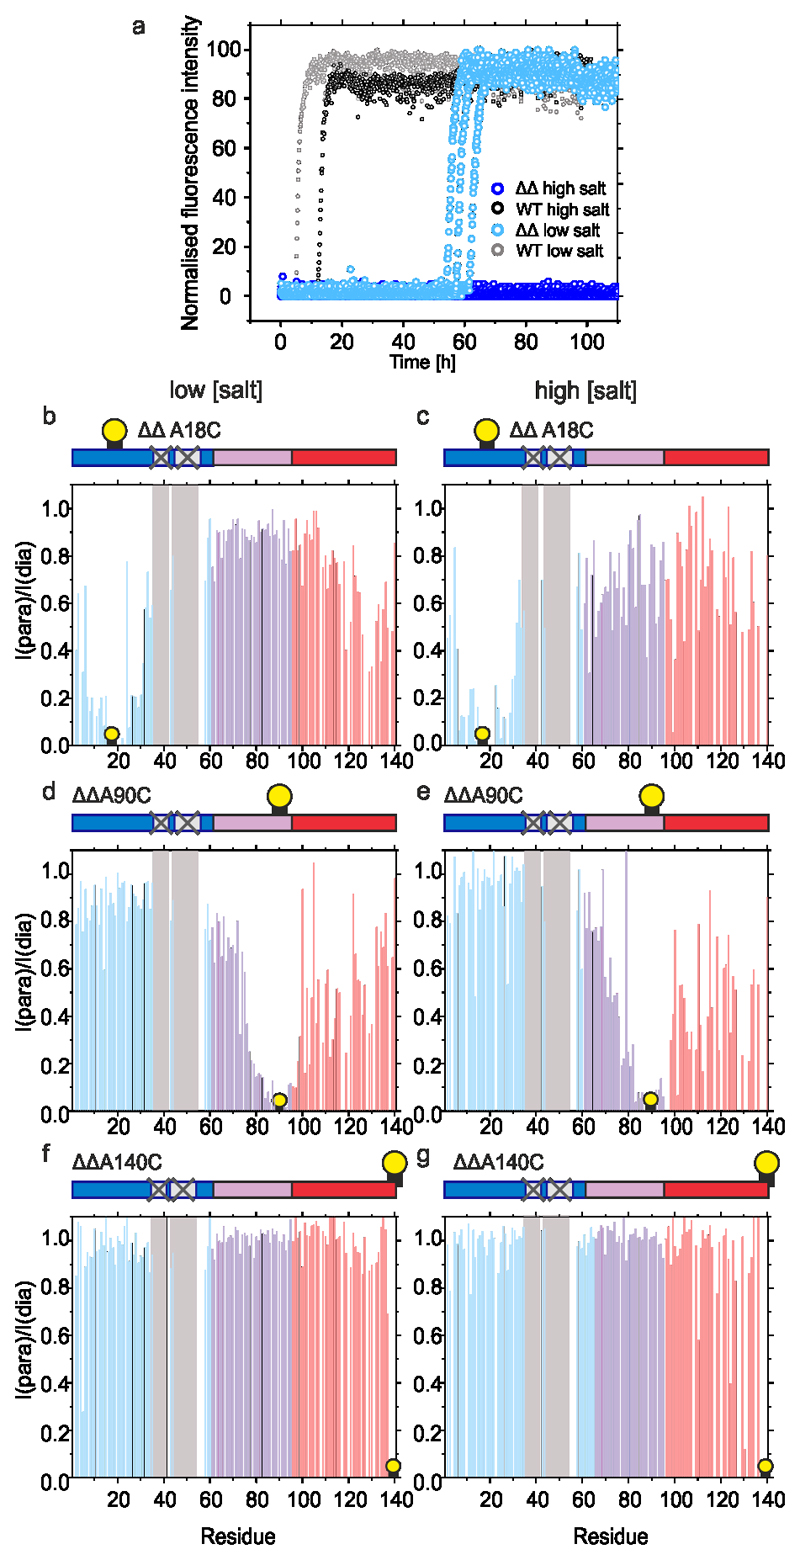
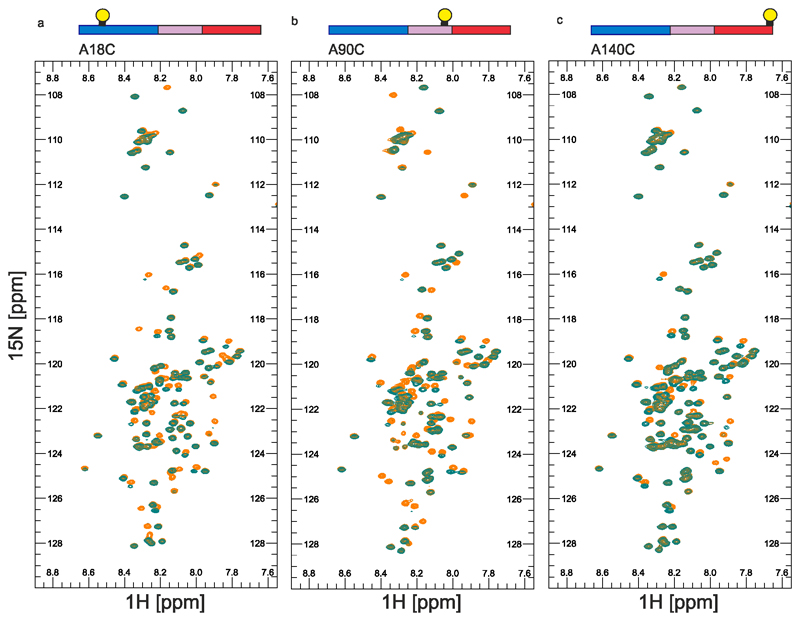
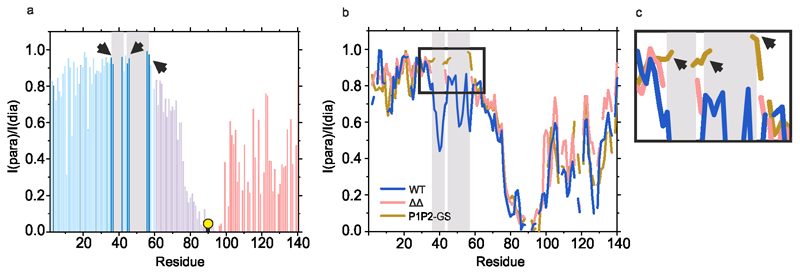
To determine whether P1 and P2 affect the conformational properties of αSyn monomers that alter their ability to assemble into amyloid, WT αSyn and ΔΔ were examined using Paramagnetic Relaxation Enhancement NMR (PRE NMR). This approach allows rare (0.5 – 5 % population) and transient interactions to be investigated. Previous studies used NMR PREs to investigate the conformational properties of WT αSyn at pH 2.5, 3.0, 6.0, 7.4 and 7.5 using protein concentrations from 100 μM to 650 μM at 15 °C17,21,44,48–50. The familial PD mutations (A30P, A53T)51 and β- and γ-Syn52 have also been investigated using this approach. To determine how deletion of P1 and P2 affects the conformational properties of αSyn monomers, 15N WT αSyn containing a single Cys introduced at positions 18 (αSyn A18C), 90 (αSyn A90C), or 140 (αSyn A140C) were expressed, purified and their 1H-15N HSQC spectra assigned at pH 4.5 (Methods). Each protein was then covalently labelled with the paramagnetic spin label S-(1-oxyl-2,2,5,5-tetramethyl-2,5-dihydro-1H-pyrrol-3-yl)methyl methanesulfonothioate (MTSL) and NMR PRE experiments performed to detect transient intramolecular interactions. Control experiments confirmed that inter-molecular interactions are not observed at the protein concentration used (see Methods). Under conditions that promote rapid aggregation of WT αSyn (pH 4.5, 20 mM NaCl (low salt), Figure 4a) long range intramolecular interactions between specific regions are observed for all three PRE probes (Figure 4b,d,f, Extended Data Figure 4). Specific intramolecular interactions between the N- and C-terminal regions of the protein were observed, as exemplified by significant PRE effects when MTSL was placed at residue 18 (Figure 4b), with a smaller reciprocal PRE effect from MTSL at residue 140 with the N-terminal region (Figure 4f)), consistent with previous results at other pH values17,23,44. Significant contacts are also observed between NAC and the C-terminal region, consistent with previous analyses at pH 2.5 and 3.021,44. Importantly, and by contrast with previous results23, significant PREs are observed between P1 (and some residues in P2) and residues near the N-terminus (using αSyn A18, Figure 4b), as well as to NAC (using αSyn A90C, Figure 4d) and to C-terminal regions (using αSyn A140C, Figure 4f). Previous meta-analysis of 11 PRE NMR studies also showed evidence of the P1 and P2 regions as an interaction hub53. Importantly, under conditions in which aggregation is slowed (pH 4.5, 200 mM NaCl (high salt)) (Figure 4a), these intramolecular interactions to P1/P2 (most markedly those involving PREs from residues 90 and 140) are decreased in magnitude (compare Figure 4b,d,f with Figure 4c,e,g), consistent with electrostatic interactions, possibly involving K45, E46, H49 or E57 in P2, or residues that juxtapose P1 (K32, K34, E35, K43) and/or P2 (E61), being involved. The observation that weaker long range intra-molecular interactions with P1/P2 results in slower aggregation kinetics suggests that these interactions are important in defining the aggregation rate.
Figure 4. Intramolecular PRE experiments for WT αSyn.
a) Aggregation kinetics (note the short timescale depicted) of WT αSyn (100 μM in 20 mM sodium acetate, pH 4.5, at low (20 mM added NaCl) or high (200 mM added NaCl) ionic strength at 37 °C). b-g Intramolecular PRE intensity ratios of amide protons (paramagnetic/diamagnetic) for WT αSyn variants with MTSL spin labels at A18C (b,c), A90C (d,e) or A140C (f,g) at low (b,d,f) or high (c,e,g) ionic strengths, 15 °C, as indicated. Blue, pink and red bars show intensity ratios for the N-terminal, NAC and C-terminal regions, respectively. Dark blue bars highlighted in grey point out the position of the P1/P2 region. Schematics are shown above each plot with a consistent colour scheme. The location of spin labels are denoted by a yellow circle. Grey panels highlight the location of the P1/P2 regions. Data for all graphs are available as Source Data.
To determine how removing P1 and P2 affects the conformational properties of monomeric αSyn, the PRE experiments were repeated under identical conditions (pH 4.5 at low and high ionic strength) using ΔΔ αSyn. These conditions result in slow (low salt) or no (high salt) fibril formation, respectively (Figure 5a). The resulting PRE profiles (Figure 5b-g) show that the long range contacts between the N- and C-terminal regions and the NAC and C-terminal region are mostly maintained in ΔΔ, while contacts to P1/P2 were removed. Interestingly, while contacts between the N-terminal region (residue 18) and NAC/C-terminal region and NAC (residue 90) and the N-/C-terminal regions are similar in WT and ΔΔ αSyn, those between the C-terminal region (residue 140) and the N-terminal region are smaller in ΔΔ, indicative of a complex interplay of interactions that depends intimately on the sequence and solution conditions. A further control experiment in which intramolecular PREs were measured for P1P2-GS with MTSL at residue 90 showed a similar response, with the long range intra-molecular PREs remaining in this construct and hints that the PRE effect to the P1 and P2 regions observed for WT αSyn, is significantly reduced in P1P2-GS (Extended Data Figure 5).Thus, removal of P1/P2 does not prevent compaction of the αSyn sequence, yet a significant reduction in aggregation is observed, demonstrating the crucial importance of the P1/P2 sequences in determining the aggregation of αSyn.
Figure 5. Intramolecular PRE experiments for ΔΔ αSyn.
a) Aggregation kinetics (note different timescale compared with Extended Data Figure 1) of ΔΔ and WT αSyn (100 μM in 20 mM sodium acetate, pH 4.5, 37 °C at low (20 mM added NaCl) or high (200 mM added NaCl) ionic strength). b-g) Intramolecular PRE intensity ratios of amide protons (paramagnetic/diamagnetic) for variants with MTSL spin labels at A18C (b,c), A90C (d,e) or A140C (f,g) at low (b,d,f) or high (c,e,g) ionic strengths, at 15 °C, as indicated. Data for all graphs are available as Source Data.
The roles of P1 and P2 in initiating intermolecular interactions
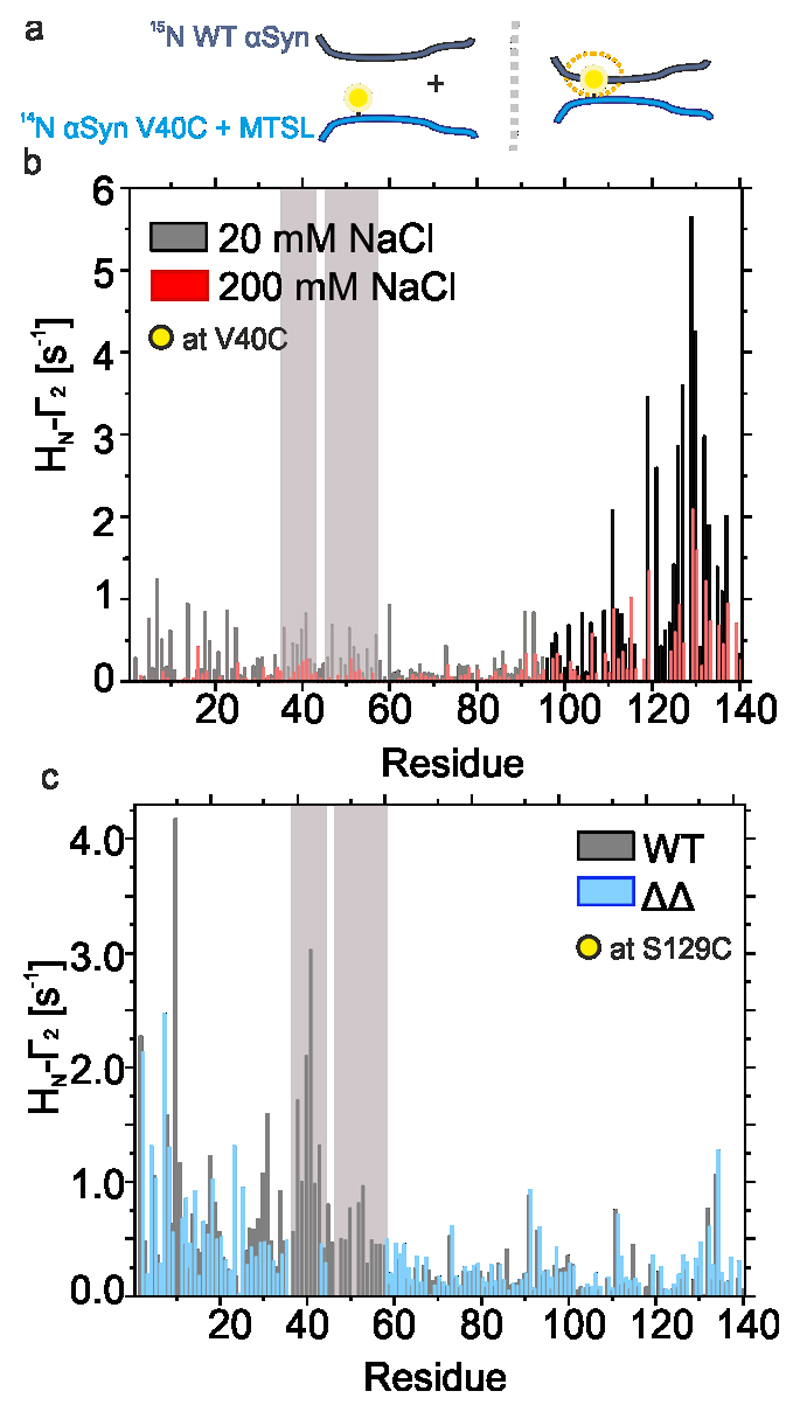
At high protein concentrations (500 μM), αSyn forms transient inter-molecular interactions, in which residues 38-45 (corresponding closely to the P1 region (36-42)), make weak inter-chain interactions with residues 124-140, at least at pH 6.0 at low ionic strength (10 mM MES, 0 M NaCl)54. To determine whether removal of P1 and P2 disrupts these inter-molecular interactions, 250 μM 14N αSyn was labelled with MTSL at residue 40 (V40C) or 129 (S129C) and incubated with 250 μM 15N WT αSyn at pH 4.5 at low and high ionic strength. Intermolecular PREs (via R2 relaxation experiments) were then measured to identify inter-chain contacts (Extended Data Figure 6a,b). The results showed that residue 40 (in the P1 region) makes intermolecular contacts primarily with residues in the negatively charged C-terminal region of WT αSyn (Extended Data Figure 6b), in agreement with published results54. At high ionic strength (retarded aggregation), this effect is decreased, consistent with these inter-molecular interactions being important in the early stages of aggregation (Extended Data Figure 6b). Finally, intermolecular PREs were determined with MTSL at residue 129 (Extended Data Figure 6c). These experiments showed a significant PRE from residue 129 to the P1 and P2 regions, as well as to the N-terminal ~20 residues in WT αSyn. Importantly, the latter interactions are maintained in ΔΔ, whilst interactions with P1/P2 are no longer possible (Extended Data Figure 6c), showing that the inter-molecular contacts between the N- and C-termini are independent of the presence of P1/P2. Together, the results reinforce the importance of the P1/P2 regions in driving aggregation, not just because of their local insolubility and high aggregation-propensity, but also because they determine the conformational properties of the monomeric IDP and formation of transient intermolecular interactions with the C-terminal region, that define its ability to aggregate into amyloid.
P1 and P2 are drivers of aggregation in vivo
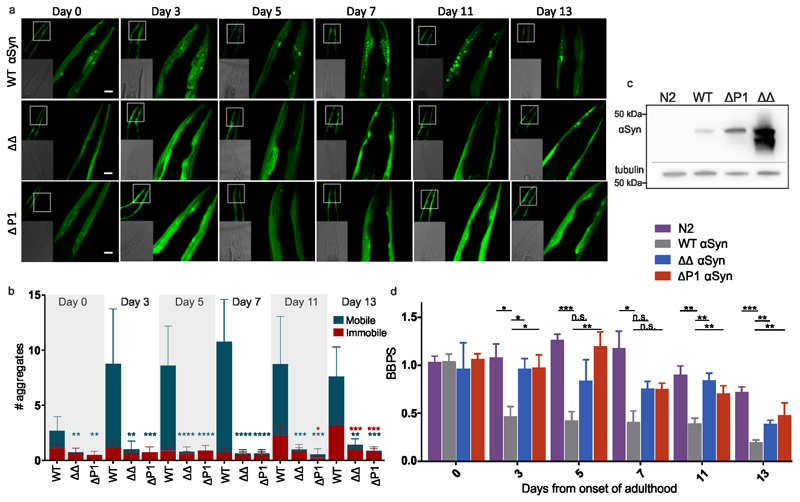
The effect of deleting P1 and P2 on αSyn aggregation in vivo was assessed by expressing WT αSyn, ΔP1 or ΔΔ fused C-terminally to YFP in C. elegans muscle cells34. Figure 6a shows that WT αSyn::YFP forms inclusions that are visible as foci in L4 larvae (Day 0). Foci increase in number as the animals age, and the proteostasis network declines55,56, reaching a plateau from Day 3 to Day 13 of adulthood, as reported previously34. In marked contrast, animals expressing ΔP1::YFP or ΔΔ::YFP formed few, if any, visible aggregates throughout ageing (Figure 6a,b), even though the expression levels of these proteins is higher than WT αSyn (Figure 6c). Notably, by contrast with WT αSyn::YFP, the total number of ΔP1::YFP or ΔΔ::YFP foci did not increase during ageing, with few aggregates observed even at Day 13 (Figure 6b). The percentage of immobile WT αSyn::YFP aggregates increased ~4-fold from Day 7 to Day 13 of adulthood as measured by FRAP (Figure 6b). By comparison, ΔP1 and ΔΔ αSyn::YFP formed only few aggregates (1 to 2 foci) that were immobile (Figure 6b). Even in aged worms motility remained similar to healthy N2 wild-type animals between Days 0-3 (Figure 6d), with slightly reduced (2-fold) thrashing rates observed in ΔΔ::YFP and ΔP1::YFP at Day 13 of adulthood (Figure 6d). In contrast, C. elegans expressing WT αSyn::YFP showed an age-dependent decline of motility between Days 3 and 13 compared with N2 worms (Figure 6d). Thus, deletion of P1 or both P1/P2 prevents both age-dependent aggregation of αSyn in vivo and suppresses aggregation-induced proteotoxicity.
Figure 6. Deletion of P1 or P1/P2 in C. elegans expressing αSyn::YFP suppresses aggregation and proteotoxicity.
a) Confocal microscopy images showing the head region of transgenic C. elegans expressing WT αSyn, ΔΔ or ΔP1 tagged C-terminally to YFP in the bodywall muscle during ageing (Day 0 to Day 13 of adulthood). Scale bar, 10 μm. b) Number of mobile and immobile inclusions larger than ~2 μm2 per animal between the tip of the nose and pharyngeal bulb during ageing determined using FRAP. Data shown are the mean and s.e.m. for three independent experiments (biological replicates); in each experiment, 10 worms (n = 10) were assessed for each time point. (n=10 worms). Blue stars indicate significance between the number of mobile aggregates of animals expressing WT αSyn or the variants ΔP1 or ΔΔ. Red stars indicate significance between the number of immobile aggregates exhibited in animals expressing WT αSyn compared with mutant animals. *P<0.05; **P<0.01; ***P<0.001; ****P<0.0001. A one-sided Student’s t test was used in all cases. c) Western blot analysis of protein extracts isolated from N2, WT αSyn::YFP, ΔP1::YFP and ΔΔ::YFP animals using an anti-αSyn antibody (Methods). Tubulin was used as a loading control. The loading control (anti-tubulin) was run on a different gel/membranes loaded with the same protein sample and treated and analysed in the same manner. The images were cropped showing all relevant bands. (d) Number of body bends per second (BBPS) of N2, WT αSyn::YFP, ΔP1::YFP and ΔΔ::YFP animals from Day 0 (L4 stage) through to Day 13 of adulthood. Data shown are mean and s.e.m. for three independent experiment; in each experiment, 10 worms were assessed for each time point. n=10 for each experiment and error bars represent SEM of three biological replicates. n.s. = not significant; **P<0.01; *P<0.05, a one-sided test was used. Data for graphs in b-d are available as Source Data.
The importance of P1/P2 in membrane remodelling
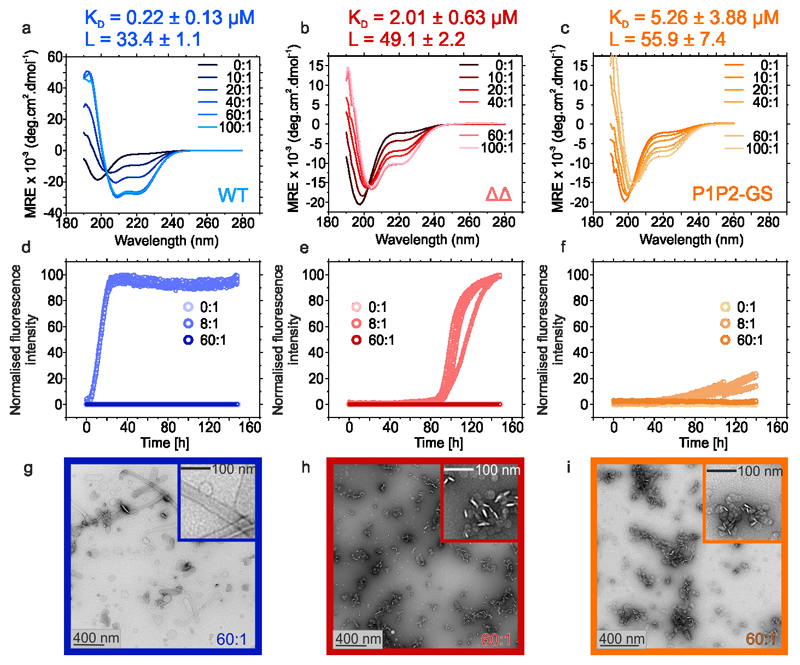
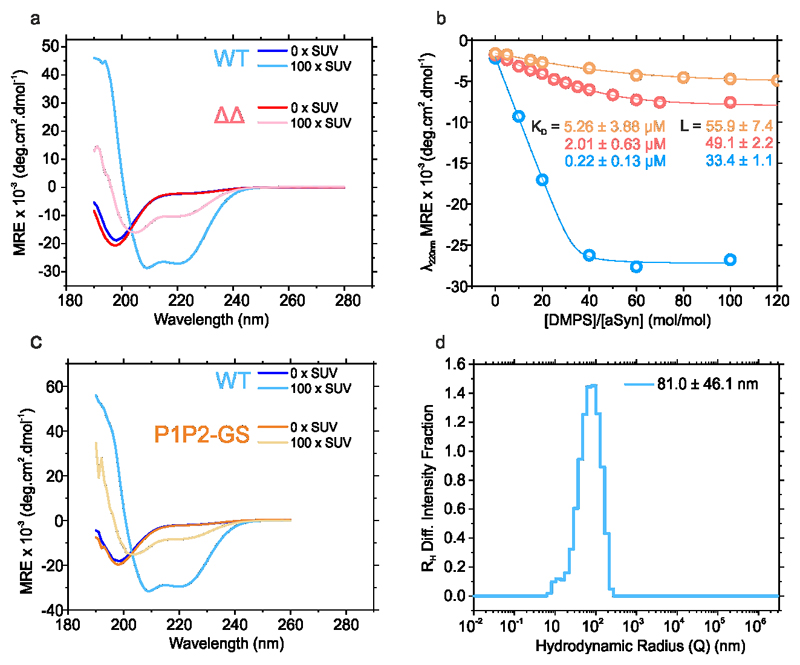
As P1 and P2 are located in the membrane-binding N-terminal region of αSyn, we explored whether P1/P2 also play a role in the function of αSyn in remodelling membrane vesicles35,57,58. αSyn forms α-helical structure in its N-terminal region (residues 1-97) upon membrane binding59,60 which subsequently enhances aggregation of the protein into amyloid fibrils61. To determine whether ΔΔ is also able to adopt α-helical structure upon lipid binding, and whether this induces fibril formation, the protein was incubated with liposomes prepared from 1,2-dimyristoyl-sn-glycero-3-phospho-L-serine (DMPS), one of the major lipids in synaptic vesicles. The secondary structure of the protein was then monitored using far UV CD. The resulting data (Figure 7a,b and Extended Data Figure 7a) showed that ΔΔ is able to bind to these vesicles, but adopts only 30% helical structure when membrane bound, whilst 64 % helicity would be expected assuming similar helix formation to WT αSyn. Lipid titration experiments revealed that the affinity of ΔΔ for lipid is ~10-fold weaker than WT αSyn (KD = 2.01 ± 0.63 μM and 0.22 ± 0.13 μM for ΔΔ and WT αSyn, respectively) (Figure 7a,b, Extended Data Figure 7b). The stoichiometry value, L, indicative of the total number of DMPS molecules in the bilayer involved in binding one αSyn molecule, is similar for both proteins (49 and 33, respectively) (Figure 7a,b, Extended Data Figure 7b). P1P2-GS responds to DMPS liposomes similarly to ΔΔ (Figure 7c, Extended Data Figure 7b,c). Thus, the effect of P1/P2 is sequence specific and does not result from changing the spacing of the imperfect repeats.
Figure 7. Lipid-induced aggregation kinetics of WT αSyn and its variants.
a-c Far-UV CD spectra of 25 μM WT αSyn (a), ΔΔ (b) or P1P2-GS (c) incubated with increasing ratios of [DMPS]:[protein]. KD and L values were calculated from the change in MRE at λ222nm fitted to a single step binding model61 (Extended Data Figure 7b). Aggregation kinetics of 50 μM αSyn WT (d), ΔΔ (e) or P1P2-GS (f) incubated with 0:1, 8:1 or 60:1 [DMPS]:[protein] (20 mM sodium phosphate, pH 6.5; 30 °C, no shaking). g-j TEM images of representative samples of WT αSyn (g), ΔΔ (h) or P1P2-GS (i) at the endpoint of the incubations (150 h) in the presence of 60:1 [DMPS]:[protein]. Data for graphs in a-f are available as Source Data.
DMPS liposomes have also been shown to accelerate αSyn aggregation by promoting heterogeneous primary nucleation61. To assess whether ΔΔ αSyn is able to nucleate amyloid formation when bound to these 160 nm diameter liposomes (Extended Data Figure 7d), the aggregation kinetics of WT αSyn, ΔΔ and P1P2-GS were monitored at different [DMPS]:[αSyn] molar ratios (Figure 7d-f). Consistent with previous results, WT αSyn does not form amyloid in the absence of liposomes under the conditions employed (20 mM sodium phosphate, pH 6.5)61, while an excess of lipid (60:1 [M:M]) also prevents aggregation by depleting the concentration of lipid-free monomer available for elongation61. At an 8:1 [DMPS]:[αSyn] ratio, however, WT αSyn aggregates rapidly (Figure 7d), as reported previously61. While ΔΔ is able to nucleate amyloid formation at a ratio of 8:1 [M:M] [DMPS]:[αSyn], the rate of aggregation is slowed significantly (lag times = 4.9 ± 0.3 h and 93.0 ± 2.6 h for WT and ΔΔ, respectively) (Figure 7e, Supplementary Table 1), presumably because less helical structure is formed in ΔΔ in the lipid-bound state. Consistent with this P1P2-GS is able to aggregate, but very slowly, when lipid bound (Figure 7c,f and Extended Data Figure 7b). Negative stain TEM of sample at the endpoints of these incubations at 60:1 [DMPS]:[αSyn] [M:M] are shown in (Figures 7g-i). Remarkably, while WT αSyn causes the coalescence of liposomes into long lipid tubes, as reported previously35, this is not observed upon incubation with ΔΔ or P1P2-GS. Instead, incubation with these proteins results in the formation of small, prefibrillar-like aggregates (Figure 7h,i (inset)) which associate with the liposome surfaces and appear to cause liposome fission, releasing smaller spherical liposomes (Figure 7h,i). Thus, in addition to controlling the aggregation of αSyn in vitro and in vivo, P1/P2 affect the function of αSyn in re-modelling lipid vesicles.
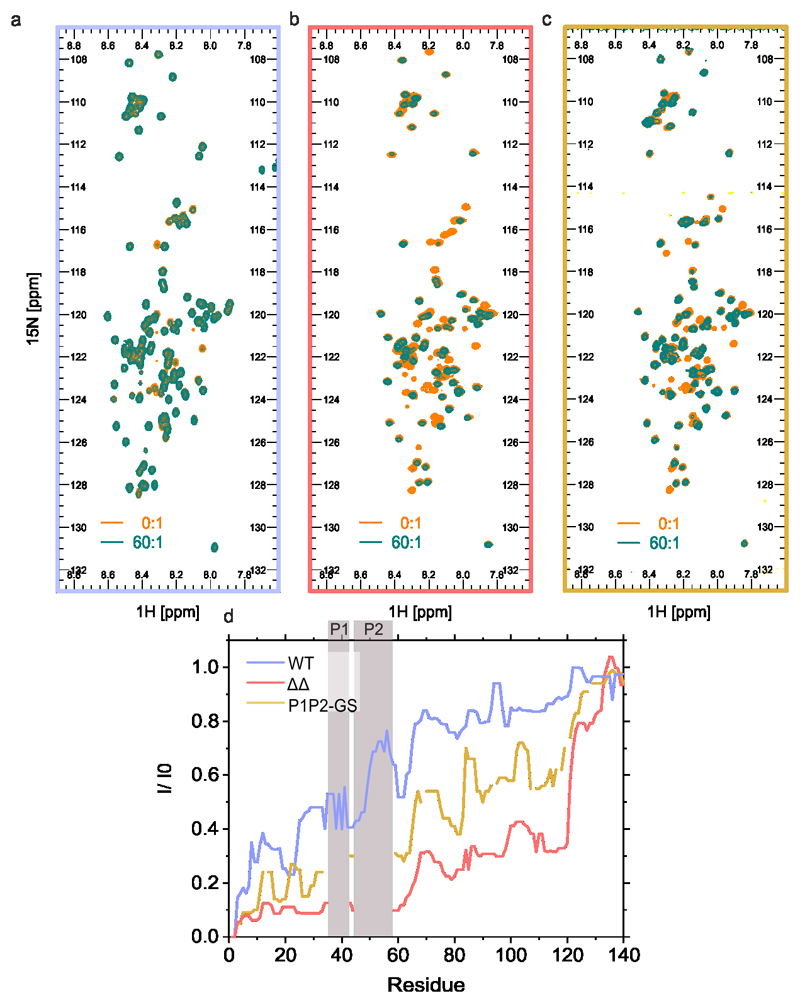
Finally, membrane binding of WT, ΔΔ and P1P2-GS were measured in residue-specific detail by acquiring 15N-1H HSQC NMR spectra of the proteins in the presence or absence of saturating amounts (60:1 {M:M] [DMPS]:[αSyn]) of liposomes (Figure 8a-c). Due to the slow tumbling rates of liposomes, resonances of residues that bind strongly are reduced in intensity, whilst those of lipid free/weakly bound residues have higher intensity in the liposome-bound state62. Strikingly, these data showed significant differences in the residues involved in lipid binding, with all but the C-terminal ~20 residues binding strongly to lipid in ΔΔ, whilst a much smaller interface is formed for WT αSyn. P1P2-GS exhibited intermediate behaviour, suggesting that both the sequence and the relative position of P1 and P2 play a role in lipid binding (Figure 8d). Thus, the P1/P2-regions control the lipid-binding properties of distal regions of the αSyn sequence, structure in the lipid-bound state and perturb membrane remodelling, without preventing binding to DMPS liposomes.
Figure 8. NMR experiments detailing the molecular basis of liposome binding of WT αSyn ΔΔ and P1P2-GS.
1H-15N HSQC NMR spectra of a) WT αSyn, b) ΔΔ and c) P1P2-GS in the presence (green) or absence (orange) of a 60:1 ratio of [DMPS]:[protein]. d) Intensity ratios (presence/absence of liposomes) of cross-peaks for WT αSyn (blue), ΔΔ (red) and P1P2-GS (orange) are shown by illustrating the median value over a rolling window of five residues determined using OriginPro. The position of P1 and P2 is highlighted with grey bars. Note that residues 36-42 and 45-57 are deleted in ΔΔ and these residues (replaced with (SG)3S (P1) and (GS)6G (P2)) could not be assigned for P1P2-GS. Data for graph in d are available as Source Data.
Discussion
The P1 sequence is a ‘master-controller’ of αSyn aggregation
We have identified a sequence in the N-terminal region of αSyn (residues 36-42 (P1)) that plays a key role in determining the ability of the protein to form amyloid fibrils in vitro and in vivo. Remarkably, we show that the seven residue P1 segment is specifically required for aggregation, with its deletion preventing aggregation in vitro at neutral pH and in bodywall muscle cells of C. elegans, despite the protein retaining the crucial NAC region12. By performing aggregation assays and NMR PRE experiments under conditions which either favour (pH 4.5 (lysosomal conditions), low ionic strength) or deter (pH 7.5 (cytosolic), high ionic strength) (Supplementary Table 1) amyloid growth, we have been able to correlate changes in monomer conformation (e.g. changes in the intra-molecular long-range interactions for P1/P2 measured by NMR-PRE at pH 4.5) induced by sequence changes in the P1/P2 region with aggregation propensity. Based on these observations we define the P1 region as a ‘master-controller’ of αSyn aggregation, in that this region controls αSyn self-assembly, synergistically with the P2 (Pre-NAC) region32 under some conditions (specifically at low pH values that mimic the lysosomal environment, relevant for αSyn in vivo63). These regions exert their control by fine-tuning intra- and inter-molecular contacts both locally within the N-terminal region, and with the distal NAC and C-terminal regions, yielding a conformational ensemble that is either aggregation-prone (retaining P1 or P1/P2) or protected from aggregation (P1 or P1/P2 deleted or substituted with Gly-Ser), presumably via exposure/sequestration of the crucial12,22,23 NAC region. The precise molecular mechanism by which this is accomplished, including the relative importance of each residue in P1 in defining the protein’s behaviour, remain to be elucidated. Deletion of P1/P2 could also affect the structure and aggregation-competence of oligomers formed later during aggregation. Whatever the precise mechanism of action, the sensitivity of aggregation to pH and ionic strength suggests that P1/P2 control αSyn aggregation by a delicate balance of hydrophobicity and charge, such that aggregation becomes highly sensitive to the solution conditions. This may rationalise why P1/P2 interactions eluded detection in previous studies at pH values below21,44,48 or above17,44,48–50 pH 4.5. Thus, while NAC is necessary and sufficient for αSyn aggregation12, the ability to prevent aggregation at pH 7.5 by removal or substitution of a single, specific, 7-residue sequence provides a striking demonstration of the crucial effect of flanking regions in amyloid formation.
The importance of flanking region(s) has been demonstrated for other aggregation-prone proteins, including the P17 region in exon 1 of huntingtin25,26,28, the N-terminal region (residue 11-16) of amyloid β (Aβ40)64, residues 306-311 in tau65, the aggregation prone motifs 14–22, 53–58, and 69–72 in the N-terminal region of Apo-I24 and the N-terminal six amino acids of β2-microglobulin66. At longer timescales, or under more favourable conditions for aggregation (e.g. at pH 4.5 and low ionic strength (Extended Data Figure 1g) or at pH 6.5 in the presence of DMPS liposomes (Figure 7e)), ΔΔ is able to form amyloid, highlighting the crucial role of the transient intra- and inter-molecular interactions made by the N-terminal region of αSyn in imposing kinetic control on the thermodynamically favourable process of amyloid formation.
Our discovery that P1 and P2 are also required for the function of αSyn in vesicle remodelling adds to the growing evidence that the N-terminal region of αSyn is important for both its physiological function and its disease aetiology57,67. Notably, P2 encompasses six of the seven early onset familial PD mutations68 (Figure 1b). This region also forms the protofilament interface in some13,14,33, but not all13, structures of αSyn fibrils formed in vitro, and this region can form amyloid in isolation32. Hoyer and colleagues also showed that the aggregation of αSyn can be inhibited in vitro and in vivo by the binding of a β-wrapin41,43 to residues 37-54, which encompasses both P1 and P2, with the NMR structure of the complex revealing β-hairpin formation involving residues 37VLYVGSK43 and 48VVHGVAT54 of αSyn41. Engineering an intramolecular disulphide bond between residues 41 and 48 has also been shown to inhibit αSyn aggregation in the absence of β-hairpin formation42, presumably because this perturbs the structure around P1 and P2 that we show here to be vital for fibril formation. Mutation of Y39 to Ala also prevents aggregation and Y39 has been shown to be responsible (together with F94) for binding small molecules able to retard aggregation62. Finally, a cyclised peptide of residue 36-55 has been shown to adopt a β-hairpin structure that self-assembles into cytotoxic oligomers, the authors suggesting that this region, rather than NAC, nucleates oligomer formation11. Together, the data presented here highlight the vital importance of P1 and P2 in controlling αSyn aggregation, demonstrating that aggregation is not initiated by the NAC region alone. Using a C. elegans model expressing αSyn in the bodywall muscles, deletion of P1 or both P1 and P2 suppressed age-dependent αSyn inclusion body formation as well as the associated toxicity, resulting in animals with improved health-span, even at advanced age. Displacing the interactions made by P1 and/or P2 may thus pave the way to routes to control αSyn aggregation using small molecules or other reagents that target these sites.
Frustration between aggregation and function
Given that deletion of P1 and P2 neutralises the deleterious effects of NAC on αSyn aggregation, why is the sequence of these regions retained by evolution? While the physiological function(s) of αSyn remain unclear, stabilisation, sequestration, and fusion of pre-synaptic vesicles are thought to be involved in its repertoire of functions36,57,69. Distinct membrane binding sites within the N-terminal region involving residues 1-25 and 65-97 have been proposed to play a critical role in tethering vesicles prior to membrane fusion35,36. Here we show that deleting part of the ‘passive’ linker region between these two sites (residues 36-57 in P1/P2) prevents the function of αSyn in membrane remodelling, generating liposome morphologies that are distinct from the large fused tubular structures formed by the WT protein (Figure 7g-i). Together with their effects on aggregation, the results demonstrate the frustration between function and aggregation in this IDP, with the presence of the P1/P2 region being required for function, whilst simultaneously generating a sequence that enhances amyloid assembly. Such a delicate balance rationalises why single point mutations such as A53T, E46K and others68, enhance Parkinson’s disease onset by simultaneously causing loss-of-function and gain-of-toxic function activities. For an IDP such as αSyn the aggregation propensity of such aggregation-prone, yet functionally important regions, cannot be protected by the framework of a folded tertiary structure, making such sequences especially prone to be the causative agents of disease. Indeed 17 of the 48 currently known human amyloidogenic proteins are IDPs or contain intrinsically disordered regions3. Such sequences enable dangerous liaisons since their intrinsic amyloid potential is exposed, unabridged by the protection of a native structure. Nonetheless, the presence of such newly discovered and characterised ‘master-controllers’ of aggregation within the αSyn sequence offers exciting potentials to control amyloid formation by binding small molecules, chaperones, biologics or other agents to these regions. Given the fine balance of weak intra- and inter-molecular interactions that control the early stages of aggregation into amyloid, minor alterations in the shape of the interaction energy landscape could disable aggregation without significantly perturbing function. Further experiments will be needed to identify whether other IDPs contain ‘master-controllers’ of aggregation, to identify the role of each of the seven amino acids in P1 in encoding the ability to control αSyn aggregation and function and to clarify the molecular mechanism of fibril growth inhibition by P1 in more detail.
Methods
Mutagenesis, expression and purification
αSyn containing single Cys variants, the P1P2-GS control (P1 (7 aa) replaced with (SG)3S and P2 (13 aa) with (GS)6G) and/or deletions of C1, P1 and/or the P2 regions were engineered into the gene sequence for WT αSyn via Q5 site directed mutagenesis (NEB). 14N, 15N and 13C/15N labelled αSyn variants were expressed recombinantly in Escherichia coli BL21 (DE3) cells and the protein purified as described previously70. In the case of 15N and/or 13C labelled protein, expression was performed in HCDM1 minimal medium with 15N enriched NH4Cl and 13C enriched glucose. Note that by contrast with Masuda et al.71 there was no evidence of mis-incorporation of Cys for Try at residue 136, as the correct molecular masses of all proteins were confirmed by mass spectrometry (WT: 14 459 ± 0.27 Da; ΔP1: 13 784 ± 0.50 Da; ΔP2: 13 182 ± 0.96 Da; ΔΔ: 12506 ± 0.03 Da; ΔC1: 13 861 ± 0.56 Da; P1P2-GS: 13947.4 ± 0.06 Da) (spectra are available at https://doi.org/10.5518/707). Additionally, the NMR spectrum of all proteins was fully assigned with residue 136 being confirmed as Tyr. Proteins were lyophilised and stored at -20°C. Proteins were resolubilised in buffer immediately before experiments were carried out. There was no evidence for covalent dimers forming during storage (samples were analysed before and after storage by ESI-MS). Different buffer conditions were used to analyse the behaviour of the proteins at pH 7.5 (20mM Tris HCl) or pH 4.5 (20 mM sodium acetate), with high (200 mM NaCl) or low (20 mM NaCl) salt concentrations. The isoelectric points of the protein variants are: WT: 4.67; ΔP1: 4.67; ΔP2: 4.60; ΔΔ: 4.60; ΔC1: 4.72; P1P2-GS: 4.60 (calculated using ProtParam tool from ExPASy).
In silico methods to determine aggregation propensity
The aggregation propensity was analysed by using the online tools Camsol38, Zyggregator37 and ZipperDB39 at pH 7.0.
Aggregation assays monitored by ThT fluorescence
100 μL samples of 100 μM αSyn variants in the required buffers were incubated with 20 μM ThT in sealed 96-well flat bottom assay plates (Corning, non-binding surface) in a FLUOstar Omega plate reader (BMG Labtech) at 37 °C with continuous orbital agitation at 600 rpm. The fluorescence of ThT was excited at 444 nm and fluorescence emission was monitored at 480 nm. The elongation rate was determined by fitting a gradient to the linear part of the ThT-curve, the lag time was taken as the intercept of the line to the baseline fluorescence signal, using OriginPro software (OriginPro 2018b 64Bit). This analysis was performed with a minimum of three replicate experiments. The standard deviations were calculated for repeated measurements (Supplementary Table 1). Fibril yields were determined via centrifugation (30 min 13,000 rpm (Microfuge SN 100/90) and analysis of remaining soluble material compared to the starting material using SDS PAGE. For this, SDS-PAGE gels were imaged on the Alliance Q9 Imager (Uvitec) and band intensities were determined using ImageJ 1.52a. Repeat experiments and loading controls indicating an error of ~10% in quantifying band intensity using this approach. Experiments monitoring lipid-induced aggregation were performed as above, except that aggregation was followed under quiescent conditions, 30 °C with a protein concentration of 50 μM. To prepare seeds of WT αSyn, 500 μL of 600 μM αSyn in Tris HCl pH 7.5, 20 mM NaCl was stirred with a magnet stirrer at 1200 rpm at 45 °C for 48 h. Fibrils were then sonicated twice for 30 sec with a break of 30 sec at 40 % maximum power using a Cole-Parmer-Ultraprocessor-Sonicator. The resulting seeds (10 % (v/v)) were added to 100 μM monomer and elongation measured in 20 mM Tris HCl, pH 7.5, containing 20 mM NaCl, 20 μM ThT at 37 °C using quiescent conditions.
Negative stain TEM
Samples at ThT incubation endpoints (usually 100 h) were diluted 1 in 10 or 1 in 5 with 18 MΩ H2O and then applied to carbon coated copper grids in a dropwise fashion. Grids were then dried with filter paper, washed three times with 18 MΩ H2O in a dropwise fashion, drying with filter paper after each wash, before fibril samples were negatively stained by the addition of 1% (w/v) uranyl acetate, added and blotted twice as before. Images were recorded on a Joel JEM-1400 or FEI Tecnai T12 electron microscope.
Preparation of disulfide locked dimeric αSyn species
To allow the formation of disulfide linkages between monomeric αSyn Cys variants, 400 μM αSyn was incubated in 100 mM, Tris HCl, pH 8.4 for 2 h at room temperature. Protein samples were then added to a HiLoadTM 26/60 Superdex 75 preparative grade gel filtration column (GE Healthcare) in 50 mM ammonium bicarbonate, pH 8.0, which allowed monomer and dimers to be resolved. Disulfide locked dimeric αSyn was then lyophilised and stored at -20 °C. The presence of disulfide linkages was validated using reducing and non-reducing SDS-PAGE with SEC-MALS used to validate the purification of dimeric constructs. For the latter, 50 μL of a 30 μM sample of αSyn was injected onto a TOSOH G200SWXL column equilibrated with 20 mM Tris HCl, containing 200 mM NaCl, pH 7.5. The protein peak was eluted into a Wyatt miniDawnTreos system with three angle detection and the data analysed using Astra 6.0.3® software supplied with the instrument.
NMR Backbone assignments of WT αSyn, αSyn P1P2-GS and αSyn ΔΔ
WT and ΔΔ αSyn variants were 13C/15N uniformly labelled for NMR backbone assignments purposes. 200 μM of protein in 20 mM sodium acetate, 20mM NaCl, 10% (v/v) D2O, 0.02% (w/v) sodium azide, pH 4.5 at 15 °C was used to acquire triple correlation experiments: HNCO, HNcaCO, HNCACB, HNcoCACB, HNN-TOCSY, hNcaNNH and hNcaNNH. All experiments were acquired using non-uniform sampling, where just 45% of sparse data was recorded on a Bruker AVANCE III 750 MHz spectrometer equipped with a triple resonance TCI-cryoprobe.
NMR data processing and spectra reconstruction were performed using NMRpipe72 and data analysis with ccpNMR-Analysis software73. HN, Cα and Cβ chemical shifts were deposited at Biological Magnetic Resonance Bank (BMRB) with access numbers 27900, 27901 and 28045 for WT αSyn, ΔΔ and P1P2-GS, respectively.
Paramagnetic Relaxation Enhancement NMR experiments
αSyn Cys variants were incubated with 5 mM DTT in 20 mM Tris HCl, 200 mM NaCl, pH 7.5 for 30 min. DTT was then removed by a Zeba spin column (PD10 column, GE Healthcare) and the sample labelled immediately by incubation with a 40-fold molar excess MTSL for 16 h at 4 °C in 20 mM Tris HCl, 200 mM NaCl, pH 7.5. Excess spin label was removed by Zeba spin column (PD10 column) and protein eluted in the required buffer. Spin-labelled αSyn constructs were used directly or stored at -80 °C. In all cases 100 % labelling at a single site was confirmed using ESI-MS. For intramolecular PRE experiments, 1H-15N HSQC spectra were obtained using 100 μM 15N spin labelled αSyn in 20 mM acetate buffer pH 4.5 containing 20 mM or 200 mM NaCl, 10% (v/v) D2O, 0.02% (w/v) sodium azide on an AVANCE III Bruker spectrometer (600 MHz) equipped with a triple channel QCI-P cryoprobe. All NMR experiments were carried out at 15 °C. Diamagnetic spectra were obtained following the addition of 2 mM ascorbic acid. Note that small changes in chemical shift occur upon adding this acid to the protein spectra and reduction was not complete, leading to small residual intensity of some resonances in the spectra especially when MTSL was added to A90C (see legend to Extended Data Figure 4). Note that this does not affect the conclusions drawn since it underestimates, rather than overestimates the magnitude of the PRE measured. Spectra were processed in Topspin (Bruker) using CCPN74. Peak heights were used to calculate intensity ratios (paramagnetic/diamagnetic). Control experiments in which 50 μM 15N αSyn and 14N αSyn-MTSL were mixed showed no PREs, ruling out intermolecular interactions at this protein concentration under the conditions used. PRE effects arising from non-specific binding of the hydrophobic probe MTSL to αSyn was ruled out by performing experiments in which 100 μM free MTSL was added to 100 μM 15N αSyn WT (lacking Cys) in which no PREs were observed. Replicate measurements of the PRE intensity ratios (I/I0) using different preparations of WT αSyn in high and low salt conditions enabled per-reside errors to be determined. On average these were +/- 0.05. These data are available in (https://doi.org/10.5518/707). Intermolecular PRE experiments were carried out by mixing 250 μM 15N WT or ΔΔ αSyn with 250 μM 14N-MTSL labelled protein. T2 transverse relaxation experiment was performed based in HSQC pulse sequence75 with 10 T2 delays (from 16.96 to 610.56 ms), under paramagnetic and diamagnetic conditions. Data processing was performed using NMRpipe72. Cross peaks intensities at each T2-delay were analysed using PINT and fitted to a single exponential decay using PINT. The effective HN-Γ2 rate was calculated as the difference between the R2 rate in the paramagnetic versus the diamagnetic samples (Equation 1):
| Eq. 1 |
Maintenance and generation of transgenic C. elegans strains and in vivo aggregation measurements
The WT αSyn gene used was fused C-terminally to YFP in vector pPD30.3834. This vector was modified to delete amino acids 36-42 (ΔP1) or residues 36-42 and 45-57 (ΔΔ) by PCR mutagenesis. Transgenic C. elegans expressing each construct were then generated by microinjection of ΔP1αSyn::YFP or ΔΔαSyn::YFP constructs into the germline of N2 nematodes, resulting in strains PVH214 pccEx021[unc-54p::a-synuclein ΔP1::YFP] and PVH198 pccEx001[unc-54p::a-synuclein ΔP1ΔP2::YFP] (Nemametrix). Nematodes expressing WTαsyn::YFP were created using gene bombardment and kindly provided by Ellen Nollen34.
For imaging, C. elegans was cultured on NGM plates seeded with E. coli OP50-1 at 20 °C as described previously76. C. elegans was imaged using a Zeiss LSM880 confocal fluorescent microscope through a 10× 1.0 or a 20× 1.0 numerical aperture objective with a 514 nm line for excitation of YFP. Before imaging, age-synchronised animals at different ages (Day 0 (L4 stage) to Day 13) were anesthetised using 5 mM Levamisole solution in M9 buffer and mounted on 2% (w/v) agar pads. The number of αSyn::YFP foci were then counted and the mobility of all foci in at least 10 animals per time point and in three independent cultures of C. elegans (biological replicates) was determined using FRAP, as described previously34. Note that the higher expression levels of the ΔP1 and ΔΔ constructs does not affect the FRAP analysis, as FRAP measures relative fluorescence intensities of similar size photo-bleached and unbleached regions within the same animal.
To determine motility of the worms, a total of 30 age-synchronised animals were used for each assay and each experiment was repeated at least three times. Animals were moved into M9 buffer at indicated time points (Day 0 through to Day 13 of adulthood) and thrashing rates were measured by counting body bends for 15 s using the wrMTrck plugin for ImageJ (available at http://www.phage.dk/plugins/wrmtrck.html)77. Error bars represent SEM of three biological replicates.
Immunoblotting
Nematodes were collected from plates, washed in M9 buffer, and resuspended in lysis buffer (20 mM Tris HCl, pH 7.5; 10 mM ß-mercaptoethanol; 0.5% (v/v) Triton X-100; supplemented with complete protease inhibitor (Roche) before shock freezing in liquid nitrogen. Three freeze-thaw cycles were performed before the worm pellet was ground with a motorized pestle, and lysed on ice, in the presence of 0.025 U/mL benzonase (Sigma). The lysate was centrifuged at 1000 rpm for 1 min in a table top centrifuge to pellet the carcasses. Protein concentration was determined using Bradford assay (Bio-Rad). Samples were then mixed 1:1 with SDS loading buffer (2% (w/v) SDS, 10 % (v/v) glycerol, 0.1 % (w/v) bromophenol blue, 100 mM DTT), boiled for 10 min and 25 μg final protein was loaded onto a 4-20% gradient Tris HCl gel (Bio-Rad). Protein bands were blotted onto a PVDF membrane and αSyn and tubulin (control) were visualised using a mouse anti-αSyn antibody (syn211 (1:5000) (NeoMarkers)) or mouse anti-tubulin antibody (1:5000) (Sigma), followed by an anti-mouse horse-radish peroxidase-coupled secondary antibody (1:5000). Bands were visualised using the SuperSignal West Pico Plus Chemiluminescence Substrate (Thermo).
Liposome preparation
1,2-dimyristoyl-sn-glycero-3-phospho-L-serine (DMPS) (sodium salt, Avanti Polar Lipids) was dissolved in 20 mM sodium phosphate buffer, pH 6.5 and stirred at 45 °C for 2 h. The solution was then frozen and thawed 5-times using dry ice and a water bath at 45 °C, respectively. Preparation of liposomes was then carried out by sonication in a bath sonicator (U50 ultrasonic bath, Ultrawave) for 1 h. The sizes of liposomes were measured using dynamic light scattering (DLS). For DLS 250 μL of 100 μM samples were injected into a Wyatt miniDawnTreos system (equipped with an additional DLS detector) and the data analysed using Astra 6.0.3® software supplied with the instrument. Filtered (0.22 μm) and de-gassed buffer, kept cool on ice to minimise bubble formation inside the instrument, was used to obtain 5 min baselines before and after sample injection. A 3 min sample window was used for the analysis by the software. Using this analysis the liposomes were found to have a diameter ≈ 160 nm.
CD spectroscopy and lipid binding experiments
CD samples were prepared by incubating 25 μM WT αSyn, ΔΔ or P1P2-GS with different concentrations of DMPS liposomes in 20 mM sodium phosphate buffer, pH 6.5. Far-UV CD spectra were acquired in in 1 mm path length quartz cuvettes (Hellma) using a ChirascanTM plus CD Spectrometer (Applied Photophysics). CD spectra were acquired using a 2 nm bandwidth, 1 s time step, data collected at 1 nm increments at 30 °C. An average of 3 scans (190-260 nm) were acquired per sample. The data were fitted to determine the secondary structure content using Dichroweb78.
KD and stoichiometry values were calculated from CD data using the protocol described in61 using the fitting function shown in Equation 2:
| Eq. 2 |
where XB is the fraction of αSyn bound to the membrane, L represents the number of DMPS molecules interacting with one molecule of α-Syn and can be described as:
| Eq. 3 |
where B is the amount of αSyn bound to liposomes and L is the number of DMPS molecules interacting with one molecule of α-Syn.
NMR experiments to monitor liposome binding
1H-15N HSQC NMR spectra were obtained using 25 μM 15N WT αSyn, P1P2-GS or ΔΔ αSyn in the absence or presence of 60:1 [DMPS]:[αSyn] ratios. Experiments were carried out in 20 mM sodium phosphate, pH 6.5 (as in61) containing 10% (v/v) D2O, 0.02% (w/v) sodium azide on an AVANCE III Bruker spectrometer (600 MHz) equipped with a cryogenic probe. All NMR experiments were carried out at 20 °C. Published assignments were used to analyse the data (BMRB 16543)58. Spectra were processed in Topspin (Bruker) and analysed in CCPN. Peak heights were used to calculate intensity ratios of αSyn in the presence versus in the absence of liposomes.
Further information on experimental design is available in the Nature Research Reporting Summary linked to this article
Extended Data
Extended data Figure 1. Aggregation kinetics of αSyn variants at different pH and salt conditions including TEM images of the aggregates (if any) formed at the end point.
ThT fluorescence assays at pH 4.5 or pH 7.5 of a,b) WT αSyn, c,d) ΔP1, e,f) ΔP2 and g,h) ΔΔ at high (200 mM NaCl) or low (20 mM NaCl) ionic strength (n≥3). Negative stain TEM images of representative samples of the aggregates formed at the end point (100 h) are shown alongside each plot using the same colour scheme. The fibril yield under each condition, determined by SDS PAGE subsequent to centrifugation (see Methods) is shown in Supplementary Table S1.
Extended data Figure 2. Cross-seeding αSyn variants using seeds created from WT αSyn.
a) ThT fluorescence assays of αSyn variants (100 μM) WT (black), ΔP1 (red), ΔP2 (green), ΔΔ (blue)) seeded with 10 % (v/v) WT αSyn fibril seeds formed at pH 7.5 (n≥3). Seeding assays were performed at pH 7.5, low salt (20 mM added NaCl), 37 °C, quiescent. b) End-point (42 h) TEM images of representative samples of fibrils from the seeding experiments using the same colour codes. Scale bars are 200 nm.
Extended data Figure 3. Aggregation kinetics of ΔC1 and P1P2-GS.
a) Schematic of WT, ΔC1, ΔΔ and P1P2-GS αSyn variants including the amino acid sequence of deleted C1 region and substituted P1/P2 region. ThT assays at pH 4.5 or pH 7.5 of b,c) WT αSyn, d,e) ΔC1 (Δ14-20), or f,g) P1P2-GS (dark and light colours depict assays in high (200 mM added NaCl) or low (20 mM added NaCl) conditions, respectively (n≥3). h,i) Negative stain TEM images of representative samples at the endpoint (100 h) of the incubation of h) ΔC1 or i) P1P2-GS, with colour coding consistent with c-f. Scale bars are 200 nm. The fibril yield under each condition, determined by SDS PAGE subsequent to centrifugation (see Methods) is shown in Supplementary Table S1.
Extended data Figure 4. 1H-15N HSQC NMR spectra showing intramolecular PRE NMR experiments on WT αSyn in 20 mM sodium acetate buffer, 20 mM NaCl, pH 4.5, 15 °C.
Overlaid are paramagnetic (green) and diamagnetic (orange) spectra for WT αSyn labelled at positions a) A18C, b) A90C or c) A140C. Schematics are shown above each spectrum with the N-terminal (blue), NAC (pink) and C-terminal (red) regions highlighted. The location of spin label is denoted by a yellow circle. Note that small chemical shift changes are observed upon reduction with ascorbic acid, which can be attributed to small changes in pH (see Methods). As a consequence 2 mM ascorbic acid was used throughout this study, resulting in incomplete reduction of the MTSL-labelled sample. This does not affect the pattern of PREs observed and results in an underestimate of the PRE effect (especially for residues in the NAC region as K80, G84, S87, I88, A89, K96, Q99).
Extended data Figure 5. Intramolecular PRE experiment for P1P2-GS αSyn.
a) Intramolecular PRE intensity ratios of amide protons (paramagnetic/diamagnetic) for P1P2-GS αSyn with the MTSL spin label at A90C at low ionic strengths (20 mM NaCl), 15 °C, pH 4.5. Blue, pink and red bars show intensity ratios for residues in the N-terminal, NAC and C-terminal regions, respectively. Dark blue bars highlight residues in the P1/P2 regions that could be assigned and measured. The grey boxes mark the P1/P2 regions. Black arrows show only a small PRE effect is observed in the P1/P2 region for P1P2-GS. Due to the repeating Gly and Ser residues in the P1/P2 sequence not all residues could be assigned (Methods). b) Comparison of a rolling window (over 5 residues for easier comparison) of the PRE effects for WT (blue), ΔΔ (red) and P1P2-GS (orange) αSyn. The black box is zoomed out in c) to highlight residues in the P1/P2-region. The data for WT and ΔΔ are shown in Figures 4d and 5d.
Extended data Figure 6. The role of P1 and P2 in intermolecular interactions.
a) Schematic of intermolecular PRE experiments. 14N and 15N αSyn are illustrated as cyan and dark blue chains, respectively. MTSL is shown as a yellow circle. b) HN-Γ2 rates for WT αSyn labelled with MTSL at position 40 (A40C) at pH 4.5 in low salt (20 mM added NaCl) (black) or high salt (200 mM added NaCl) (red) conditions, 15 °C. Bars depict residue specific HN-Γ2 rates. c) HN-Γ2 rates at pH 4.5 under low salt (20 mM added NaCl) for WT (black) or ΔΔ (blue) αSyn labelled at position 129 (S129C). Bars depict residue-specific HN-Γ2 rates.
Extended data Figure 7. CD binding assays of αSyn WT, ΔΔ and P1P2-GS to DMPS LUVs.
a) Far-UV CD spectra of 25 μM WT αSyn (blue) or ΔΔ (red) incubated in the absence or presence of liposomes (100:1 (M/M) DMPS:αSyn). b) Change of CD signal of WT αSyn (blue), ΔΔ (red) or P1P2-GS (orange) at 220 nm as a function of [DMPS]/[αSyn] ratio. Data were fitted (solid lines) to a single-step binding model, yielding the affinity (Kd) and stoichiometry value (L) (the number of DMPS molecules in the bilayer that are involved in binding to one molecule of αSyn56. c) Far-UV CD spectra of 25 μM WT αSyn (blue) or P1P2-GS (orange) incubated in the absence or presence of 100-times molar excess of DMPS LUVs. d) Dynamic light scattering of DMPS liposomes showing they have a hydrodynamic radius (RH) of on 81 nm.
Supplementary Material
Acknowledgments
We thank members of our research groups for helpful discussions throughout this work. We also thank Theo Karamanos for helpful advice about NMR PRE data analysis, Ellen Nollen (University of Groningen) for the kind gift of the plasmid encoding YFP-αSyn, Leon Willis for help with SEC-MALS analysis, Bob Schiffrin for his help with the Kd fitting and the mass spectrometry facility for help with characterisation of all purified proteins. SER acknowledges funding from the European Research Council under the European Union’s Seventh Framework Programme FP7.2007-2013/Grant agreement number 322408 and Wellcome Trust (204963). CPAD was supported by BBSRC (BB/K02101X/1) and by the ERC (322408), SCG by BBSRC (BB/M011151/1), RMM by Wellcome Trust (204963) and SMU by the Wellcome Trust (215062/Z/18/Z). PvOH is also funded N3CR grant (NC/P001203/1). We thank the Wellcome Trust (094232) and University of Leeds for the purchase of the Chiroscan CD spectrometer, the electron microscopes and NMR instrumentation.
Footnotes
Data availability
Chemical shift assignments can be accessed using BMRB numbers 27900 (WT-αSyn), 27901 (ΔΔ αSyn) and 28045 (P1P2-GS αSyn). Source data for Figure 1c-e, Figure 2a-d, Figure 3a-c, Figure4a-g, Figure 5a-g. Figure 6b,d, Figure 7a-f and Figure 8d and Extended Figure 1a-h, Extended Figure 2a, Extended Figure 3b-g, Extended Figure 5a,b, Extended Figure6b,c and Extended Figure 7a-d are available with the paper online. Other datasets generated during and/or analysed during the current study are available in the University of Leeds data repository (https://doi.org/10.5518/707).
Author Contributions
CPAD and SMU prepared samples, designed and performed fluorescence, NMR experiments, EM and other biochemical studies, JM, SCG and PvOH performed the experiments with C. elegans. CPAD, SMU and GNK performed CD experiments. RMM performed NMR assignment and assisted with NMR data analysis and interpretation. SER and DJB developed the ideas and supervised the work. All authors contributed to the preparation of the manuscript.
Competing interests
No authors have competing interests.
References
- 1.Iwai A, Masliah E, Yoshimoto M, Ge NF, Flanagan L, et al. The precursor protein of non-a-beta component of Alzheimers-disease amyloid is a presynaptic protein of the central-nervous-system. Neuron. 1995;14:467–475. doi: 10.1016/0896-6273(95)90302-x. [DOI] [PubMed] [Google Scholar]
- 2.Dettmer U, Selkoe D, Bartels T. New insights into cellular alpha-synuclein homeostasis in health and disease. Curr Opin Neurobiol. 2016;36:15–22. doi: 10.1016/j.conb.2015.07.007. [DOI] [PubMed] [Google Scholar]
- 3.Iadanza MG, Jackson MP, Hewitt EW, Ranson NA, Radford SE. A new era for understanding amyloid structures and disease. Nat Rev Mol Cell Biol. 2018 doi: 10.1038/s41580-018-0060-8. [DOI] [PubMed] [Google Scholar]
- 4.Tysnes O-B, Storstein A. Epidemiology of Parkinson’s disease. J Neural Transm. 2017;124:901–905. doi: 10.1007/s00702-017-1686-y. [DOI] [PubMed] [Google Scholar]
- 5.Weinreb PH, Zhen W, Poon AW, Conway KA, Lansbury PT. NACP, a protein implicated in Alzheimer's disease and learning, is natively unfolded. Biochemistry. 1996;35:13709–13715. doi: 10.1021/bi961799n. [DOI] [PubMed] [Google Scholar]
- 6.Theillet F-X, Binolfi A, Bekei B, Martorana A, Rose HM, et al. Structural disorder of monomeric α-synuclein persists in mammalian cells. Nature. 2016;530:45. doi: 10.1038/nature16531. [DOI] [PubMed] [Google Scholar]
- 7.Fusco G, Chen SW, Williamson PTF, Cascella R, Perni M, et al. Structural basis of membrane disruption and cellular toxicity by α-synuclein oligomers. Science. 2017;358:1440–1443. doi: 10.1126/science.aan6160. [DOI] [PubMed] [Google Scholar]
- 8.Chen SW, Drakulic S, Deas E, Ouberai M, Aprile FA, et al. Structural characterization of toxic oligomers that are kinetically trapped during alpha-synuclein fibril formation. Proc Natl Acad Sci U S A. 2015;112:E1994–2003. doi: 10.1073/pnas.1421204112. [DOI] [PMC free article] [PubMed] [Google Scholar]
- 9.Peelaerts W, Bousset L, Van der Perren A, Moskalyuk A, Pulizzi R, et al. Alpha-synuclein strains cause distinct synucleinopathies after local and systemic administration. Nature. 2015;522:340–+. doi: 10.1038/nature14547. [DOI] [PubMed] [Google Scholar]
- 10.Bartels T, Ahlstrom LS, Leftin A, Kamp F, Haass C, et al. The N-terminus of the intrinsically disordered protein α-synuclein triggers membrane binding and helix folding. Biophys J. 2010;99:2116–2124. doi: 10.1016/j.bpj.2010.06.035. [DOI] [PMC free article] [PubMed] [Google Scholar]
- 11.Salveson PJ, Spencer RK, Nowick JS. X-ray crystallographic structure of oligomers formed by a toxic β-hairpin derived from α-synuclein: Trimers and higher-order oligomers. J Am Chem Soc. 2016;138:4458–4467. doi: 10.1021/jacs.5b13261. [DOI] [PMC free article] [PubMed] [Google Scholar]
- 12.Giasson BI, Murray IV, Trojanowski JQ, Lee VM. A hydrophobic stretch of 12 amino acid residues in the middle of alpha-synuclein is essential for filament assembly. J Biol Chem. 2001;276:2380–6. doi: 10.1074/jbc.M008919200. [DOI] [PubMed] [Google Scholar]
- 13.Li B, Ge P, Murray KA, Sheth P, Zhang M, et al. Cryo-em of full-length α-synuclein reveals fibril polymorphs with a common structural kernel. Nat Commun. 2018;9:3609. doi: 10.1038/s41467-018-05971-2. [DOI] [PMC free article] [PubMed] [Google Scholar]
- 14.Guerrero-Ferreira R, Taylor NMI, Mona D, Ringler P, Lauer ME, et al. Cryo-EM structure of alpha-synuclein fibrils. Elife. 2018;7 doi: 10.7554/eLife.36402. [DOI] [PMC free article] [PubMed] [Google Scholar]
- 15.Tuttle MD, Comellas G, Nieuwkoop AJ, Covell DJ, Berthold DA, et al. Solid-state NMR structure of a pathogenic fibril of full-length human alpha-synuclein. Nat Struct Mol Biol. 2016;23:409–15. doi: 10.1038/nsmb.3194. [DOI] [PMC free article] [PubMed] [Google Scholar]
- 16.Allison JR, Varnai P, Dobson CM, Vendruscolo M. Determination of the free energy landscape of alpha-synuclein using spin label nuclear magnetic resonance measurements. J Am Chem Soc. 2009;131:18314–18326. doi: 10.1021/ja904716h. [DOI] [PubMed] [Google Scholar]
- 17.Bertoncini CW, Jung YS, Fernandez CO, Hoyer W, Griesinger C, et al. Release of long-range tertiary interactions potentiates aggregation of natively unstructured alpha-synuclein. Proc Natl Acad Sci U S A. 2005;102:1430–1435. doi: 10.1073/pnas.0407146102. [DOI] [PMC free article] [PubMed] [Google Scholar]
- 18.Rao JN, Jao CC, Hegde BG, Langen R, Ulmer TS. A combinatorial nmr and EPR approach for evaluating the structural ensemble of partially folded proteins. J Am Chem Soc. 2010;132:8657–8668. doi: 10.1021/ja100646t. [DOI] [PMC free article] [PubMed] [Google Scholar]
- 19.Phillips AS, Gomes AF, Kalapothakis JM, Gillam JE, Gasparavicius J, et al. Conformational dynamics of α-synuclein: Insights from mass spectrometry. Analyst. 2015;140:3070–3081. doi: 10.1039/c4an02306d. [DOI] [PubMed] [Google Scholar]
- 20.Uversky VN, Li J, Fink AL. Evidence for a partially folded intermediate in alpha-synuclein fibril formation. J Biol Chem. 2001;276:10737–10744. doi: 10.1074/jbc.M010907200. [DOI] [PubMed] [Google Scholar]
- 21.Wu KP, Weinstock DS, Narayanan C, Levy RM, Baum J. Structural reorganization of alpha-synuclein at low pH observed by NMR and REMD simulations. J Mol Biol. 2009;391:784–796. doi: 10.1016/j.jmb.2009.06.063. [DOI] [PMC free article] [PubMed] [Google Scholar]
- 22.Hoyer W, Cherny D, Subramaniam V, Jovin TM. Impact of the acidic C-terminal region comprising amino acids 109–140 on α-synuclein aggregation in vitro. Biochemistry. 2004;43:16233–16242. doi: 10.1021/bi048453u. [DOI] [PubMed] [Google Scholar]
- 23.Stephens AD, Zacharopoulou M, Kaminski Schierle GS. The cellular environment affects monomeric α-synuclein structure. Trends Biochem Sci. 2018 doi: 10.1016/j.tibs.2018.11.005. [DOI] [PubMed] [Google Scholar]
- 24.Das M, Mei X, Jayaraman S, Atkinson D, Gursky O. Amyloidogenic mutations in human apolipoprotein A-I are not necessarily destabilizing–a common mechanism of apolipoprotein A-I misfolding in familial amyloidosis and atherosclerosis. The FEBS journal. 2014;281:2525–2542. doi: 10.1111/febs.12809. [DOI] [PMC free article] [PubMed] [Google Scholar]
- 25.Hoop CL, Lin H-K, Kar K, Hou Z, Poirier MA, et al. Polyglutamine amyloid core boundaries and flanking domain dynamics in huntingtin fragment fibrils determined by solid-state nuclear magnetic resonance. Biochemistry. 2014;53:6653–6666. doi: 10.1021/bi501010q. [DOI] [PMC free article] [PubMed] [Google Scholar]
- 26.Bugg CW, Isas JM, Fischer T, Patterson PH, Langen R. Structural features and domain organization of huntingtin fibrils. J Biol Chem. 2012;287:31739–31746. doi: 10.1074/jbc.M112.353839. [DOI] [PMC free article] [PubMed] [Google Scholar]
- 27.Colvin MT, Silvers R, Ni QZ, Can TV, Sergeyev I, et al. Atomic resolution structure of monomorphic Aβ42 amyloid fibrils. J Am Chem Soc. 2016;138:9663–9674. doi: 10.1021/jacs.6b05129. [DOI] [PMC free article] [PubMed] [Google Scholar]
- 28.Lucato CM, Lupton CJ, Halls ML, Ellisdon AM. Amyloidogenicity at a distance: How distal protein regions modulate aggregation in disease. J Mol Biol. 2017;429:1289–1304. doi: 10.1016/j.jmb.2017.03.021. [DOI] [PubMed] [Google Scholar]
- 29.Crowther RA, Jakes R, Spillantini MG, Goedert M. Synthetic filaments assembled from C-terminally truncated α-synuclein. FEBS Lett. 1998;436:309–312. doi: 10.1016/s0014-5793(98)01146-6. [DOI] [PubMed] [Google Scholar]
- 30.Kessler JC, Rochet J-C, Lansbury PT. The N-terminal repeat domain of α-synuclein inhibits β-sheet and amyloid fibril formation. Biochemistry. 2003;42:672–678. doi: 10.1021/bi020429y. [DOI] [PubMed] [Google Scholar]
- 31.Izawa Y, Tateno H, Kameda H, Hirakawa K, Hato K, et al. Role of C-terminal negative charges and tyrosine residues in fibril formation of alpha-synuclein. Brain and Behavior. 2012;2:595–605. doi: 10.1002/brb3.86. [DOI] [PMC free article] [PubMed] [Google Scholar]
- 32.Rodriguez JA, Ivanova MI, Sawaya MR, Cascio D, Reyes FE, et al. Structure of the toxic core of alpha-synuclein from invisible crystals. Nature. 2015;525:486–90. doi: 10.1038/nature15368. [DOI] [PMC free article] [PubMed] [Google Scholar]
- 33.Li Y, Zhao C, Luo F, Liu Z, Gui X, et al. Amyloid fibril structure of α-synuclein determined by cryo-electron microscopy. Cell Res. 2018;28:897. doi: 10.1038/s41422-018-0075-x. [DOI] [PMC free article] [PubMed] [Google Scholar]
- 34.Van Ham TJ, Thijssen KL, Breitling R, Hofstra RM, Plasterk RH, et al. C. Elegans model identifies genetic modifiers of α-synuclein inclusion formation during aging. PLoS genetics. 2008;4:e1000027. doi: 10.1371/journal.pgen.1000027. [DOI] [PMC free article] [PubMed] [Google Scholar]
- 35.Fusco G, Pape T, Stephens AD, Mahou P, Costa AR, et al. Structural basis of synaptic vesicle assembly promoted by alpha-synuclein. Nat Commun. 2016;7 doi: 10.1038/ncomms12563. [DOI] [PMC free article] [PubMed] [Google Scholar]
- 36.Lautenschläger J, Stephens AD, Fusco G, Ströhl F, Curry N, et al. C-terminal calcium binding of α-synuclein modulates synaptic vesicle interaction. Nat Commun. 2018;9:712. doi: 10.1038/s41467-018-03111-4. [DOI] [PMC free article] [PubMed] [Google Scholar]
- 37.Tartaglia GG, Vendruscolo M. The Zyggregator method for predicting protein aggregation propensities. Chem Soc Rev. 2008;37:1395–1401. doi: 10.1039/b706784b. [DOI] [PubMed] [Google Scholar]
- 38.Sormanni P, Aprile FA, Vendruscolo M. The camsol method of rational design of protein mutants with enhanced solubility. J Mol Biol. 2015;427:478–490. doi: 10.1016/j.jmb.2014.09.026. [DOI] [PubMed] [Google Scholar]
- 39.Thompson MJ, Sievers SA, Karanicolas J, Ivanova MI, Baker D, et al. The 3D profile method for identifying fibril-forming segments of proteins. Proc Natl Acad Sci U S A. 2006;103:4074–4078. doi: 10.1073/pnas.0511295103. [DOI] [PMC free article] [PubMed] [Google Scholar]
- 40.Terada M, Suzuki G, Nonaka T, Kametani F, Tamaoka A, et al. The effect of truncation on prion-like properties of α-synuclein. J Biol Chem. 2018;293:13910–13920. doi: 10.1074/jbc.RA118.001862. [DOI] [PMC free article] [PubMed] [Google Scholar]
- 41.Mirecka EA, Shaykhalishahi H, Gauhar A, Akgul S, Lecher J, et al. Sequestration of a beta-hairpin for control of alpha-synuclein aggregation. Angew Chem Int Ed Engl. 2014;53:4227–30. doi: 10.1002/anie.201309001. [DOI] [PubMed] [Google Scholar]
- 42.Shaykhalishahi H, Gauhar A, Wordehoff MM, Gruning CS, Klein AN, et al. Contact between the beta1 and beta2 segments of alpha-synuclein that inhibits amyloid formation. Angew Chem Int Ed Engl. 2015;54:8837–40. doi: 10.1002/anie.201503018. [DOI] [PubMed] [Google Scholar]
- 43.Agerschou ED, Saridaki T, Flagmeier P, Galvagnion C, Komnig D, et al. An engineered monomer binding-protein for α-synuclein efficiently inhibits the proliferation of amyloid fibrils. Elife. 2019;8:e46112. doi: 10.7554/eLife.46112. [DOI] [PMC free article] [PubMed] [Google Scholar]
- 44.Cho MK, Nodet G, Kim HY, Jensen MR, Bernado P, et al. Structural characterization of α-synuclein in an aggregation prone state. Protein Sci. 2009;18:1840–1846. doi: 10.1002/pro.194. [DOI] [PMC free article] [PubMed] [Google Scholar]
- 45.Buell AK, Galvagnion C, Gaspar R, Sparr E, Vendruscolo M, et al. Solution conditions determine the relative importance of nucleation and growth processes in α-synuclein aggregation. Proc Natl Acad Sci. 2014;111:7671–7676. doi: 10.1073/pnas.1315346111. [DOI] [PMC free article] [PubMed] [Google Scholar]
- 46.Hoyer W, Antony T, Cherny D, Heim G, Jovin TM, et al. Dependence of α-synuclein aggregate morphology on solution conditions. J Mol Biol. 2002;322:383–393. doi: 10.1016/s0022-2836(02)00775-1. [DOI] [PubMed] [Google Scholar]
- 47.Wördehoff MM, Shaykhalishahi H, Groß L, Gremer L, Stoldt M, et al. Opposed effects of dityrosine formation in soluble and aggregated α-synuclein on fibril growth. J Mol Biol. 2017;429:3018–3030. doi: 10.1016/j.jmb.2017.09.005. [DOI] [PMC free article] [PubMed] [Google Scholar]
- 48.Wu K-P, Baum J. Detection of transient interchain interactions in the intrinsically disordered protein α-synuclein by nmr paramagnetic relaxation enhancement. J Am Chem Soc. 2010;132:5546–5547. doi: 10.1021/ja9105495. [DOI] [PMC free article] [PubMed] [Google Scholar]
- 49.Dedmon MM, Lindorff-Larsen K, Christodoulou J, Vendruscolo M, Dobson CM. Mapping long-range interactions in α-synuclein using spin-label NMR and ensemble molecular dynamics simulations. J Am Chem Soc. 2005;127:476–477. doi: 10.1021/ja044834j. [DOI] [PubMed] [Google Scholar]
- 50.Wu K-P, Kim S, Fela DA, Baum J. Characterization of conformational and dynamic properties of natively unfolded human and mouse α-synuclein ensembles by NMR: Implication for aggregation. J Mol Biol. 2008;378:1104–1115. doi: 10.1016/j.jmb.2008.03.017. [DOI] [PMC free article] [PubMed] [Google Scholar]
- 51.Bertoncini CW, Fernandez CO, Griesinger C, Jovin TM, Zweckstetter M. Familial mutants of α-synuclein with increased neurotoxicity have a destabilized conformation. J Biol Chem. 2005;280:30649–30652. doi: 10.1074/jbc.C500288200. [DOI] [PubMed] [Google Scholar]
- 52.Sung Y-h, Eliezer D. Residual structure, backbone dynamics, and interactions within the synuclein family. J Mol Biol. 2007;372:689. doi: 10.1016/j.jmb.2007.07.008. [DOI] [PMC free article] [PubMed] [Google Scholar]
- 53.Esteban-Martín S, Silvestre-Ryan J, Bertoncini CW, Salvatella X. Identification of fibril-like tertiary contacts in soluble monomeric α-synuclein. Biophys J. 2013;105:1192–1198. doi: 10.1016/j.bpj.2013.07.044. [DOI] [PMC free article] [PubMed] [Google Scholar]
- 54.Janowska MK, Wu K-P, Baum J. Unveiling transient protein-protein interactions that modulate inhibition of alpha-synuclein aggregation by beta-synuclein, a pre-synaptic protein that co-localizes with alpha-synuclein. Scientific reports. 2015;5:15164–15164. doi: 10.1038/srep15164. [DOI] [PMC free article] [PubMed] [Google Scholar]
- 55.Ben-Zvi A, Miller EA, Morimoto RI. Collapse of proteostasis represents an early molecular event in Caenorhabditis elegans aging. Proc Natl Acad Sci. 2009;106:14914–14919. doi: 10.1073/pnas.0902882106. [DOI] [PMC free article] [PubMed] [Google Scholar]
- 56.Labbadia J, Morimoto RI. Repression of the heat shock response is a programmed event at the onset of reproduction. Mol Cell. 2015;59:639–650. doi: 10.1016/j.molcel.2015.06.027. [DOI] [PMC free article] [PubMed] [Google Scholar]
- 57.Diao J, Burré J, Vivona S, Cipriano DJ, Sharma M, et al. Native α-synuclein induces clustering of synaptic-vesicle mimics via binding to phospholipids and synaptobrevin-2/VAMP2. Elife. 2013;2:e00592. doi: 10.7554/eLife.00592. [DOI] [PMC free article] [PubMed] [Google Scholar]
- 58.Bodner CR, Dobson CM, Bax A. Multiple tight phospholipid-binding modes of α-synuclein revealed by solution NMR spectroscopy. J Mol Biol. 2009;390:775–790. doi: 10.1016/j.jmb.2009.05.066. [DOI] [PMC free article] [PubMed] [Google Scholar]
- 59.Fusco G, De Simone A, Gopinath T, Vostrikov V, Vendruscolo M, et al. Direct observation of the three regions in α-synuclein that determine its membrane-bound behaviour. Nat Commun. 2014;5:3827. doi: 10.1038/ncomms4827. [DOI] [PMC free article] [PubMed] [Google Scholar]
- 60.Jao CC, Hegde BG, Chen J, Haworth IS, Langen R. Structure of membrane-bound α-synuclein from site-directed spin labeling and computational refinement. Proc Natl Acad Sci. 2008;105:19666–19671. doi: 10.1073/pnas.0807826105. [DOI] [PMC free article] [PubMed] [Google Scholar]
- 61.Galvagnion C, Buell AK, Meisl G, Michaels TC, Vendruscolo M, et al. Lipid vesicles trigger alpha-synuclein aggregation by stimulating primary nucleation. Nat Chem Biol. 2015;11:229–34. doi: 10.1038/nchembio.1750. [DOI] [PMC free article] [PubMed] [Google Scholar]
- 62.Fonseca-Ornelas L, Eisbach SE, Paulat M, Giller K, Fernández CO, et al. Small molecule-mediated stabilization of vesicle-associated helical α-synuclein inhibits pathogenic misfolding and aggregation. Nat Commun. 2014;5:5857. doi: 10.1038/ncomms6857. [DOI] [PubMed] [Google Scholar]
- 63.Jackson MP, Hewitt EW. Cellular proteostasis: Degradation of misfolded proteins by lysosomes. Essays Biochem. 2016;60:173–180. doi: 10.1042/EBC20160005. [DOI] [PMC free article] [PubMed] [Google Scholar]
- 64.Brännström K, Öhman A, Nilsson L, Pihl M, Sandblad L, et al. The N-terminal region of amyloid β controls the aggregation rate and fibril stability at low ph through a gain of function mechanism. J Am Chem Soc. 2014;136:10956–10964. doi: 10.1021/ja503535m. [DOI] [PubMed] [Google Scholar]
- 65.Chen D, Drombosky KW, Hou Z, Sari L, Kashmer OM, et al. Tau local structure shields an amyloid-forming motif and controls aggregation propensity. Nat Commun. 2019;10:2493. doi: 10.1038/s41467-019-10355-1. [DOI] [PMC free article] [PubMed] [Google Scholar]
- 66.Esposito G, Michelutti R, Verdone G, Viglino P, Hernandez H, et al. Removal of the N-terminal hexapeptide from human β2-microglobulin facilitates protein aggregation and fibril formation. Protein Sci. 2000;9:831–845. doi: 10.1110/ps.9.5.831. [DOI] [PMC free article] [PubMed] [Google Scholar]
- 67.Goedert M. Alpha-synuclein and neurodegenerative diseases. Nat Rev Neurosci. 2001;2:492. doi: 10.1038/35081564. [DOI] [PubMed] [Google Scholar]
- 68.Mehra S, Sahay S, Maji SK. α-synuclein misfolding and aggregation: Implications in Parkinson’s disease pathogenesis. Biochimica et Biophysica Acta (BBA)-Proteins and Proteomics. 2019 doi: 10.1016/j.bbapap.2019.03.001. [DOI] [PubMed] [Google Scholar]
- 69.Cabin DE, Shimazu K, Murphy D, Cole NB, Gottschalk W, et al. Synaptic vesicle depletion correlates with attenuated synaptic responses to prolonged repetitive stimulation in mice lacking α-synuclein. J Neurosci. 2002;22:8797–8807. doi: 10.1523/JNEUROSCI.22-20-08797.2002. [DOI] [PMC free article] [PubMed] [Google Scholar]
- 70.Martin EM, Jackson MP, Gamerdinger M, Gense K, Karamonos TK, et al. Conformational flexibility within the nascent polypeptide-associated complex enables its interactions with structurally diverse client proteins. The Journal of biological chemistry. 2018;293:8554–8568. doi: 10.1074/jbc.RA117.001568. [DOI] [PMC free article] [PubMed] [Google Scholar]
- 71.Masuda M, Dohmae N, Nonaka T, Oikawa T, Hisanaga S-i, et al. Cysteine misincorporation in bacterially expressed human α-synuclein. FEBS Lett. 2006;580:1775–1779. doi: 10.1016/j.febslet.2006.02.032. [DOI] [PubMed] [Google Scholar]
- 72.Delaglio F, Grzesiek S, Vuister GW, Zhu G, Pfeifer J, et al. NMRPipe: A multidimensional spectral processing system based on UNIX pipes. J BioMol NMR. 1995;6:277–293. doi: 10.1007/BF00197809. [DOI] [PubMed] [Google Scholar]
- 73.Skinner SP, Fogh RH, Boucher W, Ragan TJ, Mureddu LG, et al. CcpNmr analysisassign: A flexible platform for integrated NMR analysis. J BioMol NMR. 2016;66:111–124. doi: 10.1007/s10858-016-0060-y. [DOI] [PMC free article] [PubMed] [Google Scholar]
- 74.Fogh R, Ionides J, Ulrich E, Boucher W, Vranken W, et al. The ccpn project: An interim report on a data model for the NMR community. Nat Struct Mol Biol. 2002;9:416. doi: 10.1038/nsb0602-416. [DOI] [PubMed] [Google Scholar]
- 75.Tang C, Schwieters CD, Clore GM. Open-to-closed transition in apo maltose-binding protein observed by paramagnetic NMR. Nature. 2007;449:1078. doi: 10.1038/nature06232. [DOI] [PubMed] [Google Scholar]
- 76.Brenner S. The genetics of Caenorhabditis elegans. Genetics. 1974;77:71–94. doi: 10.1093/genetics/77.1.71. [DOI] [PMC free article] [PubMed] [Google Scholar]
- 77.Nussbaum-Krammer CI, Neto MF, Brielmann RM, Pedersen JS, Morimoto RI. Investigating the spreading and toxicity of prion-like proteins using the metazoan model organism C. elegans. JoVE (Journal of Visualized Experiments) 2015:e52321. doi: 10.3791/52321. [DOI] [PMC free article] [PubMed] [Google Scholar]
- 78.Whitmore L, Wallace B. Dichroweb, an online server for protein secondary structure analyses from circular dichroism spectroscopic data. Nucleic Acids Res. 2004;32:W668–W673. doi: 10.1093/nar/gkh371. [DOI] [PMC free article] [PubMed] [Google Scholar]
Associated Data
This section collects any data citations, data availability statements, or supplementary materials included in this article.


