Abstract
Variable-temperature nano-electrospray ionization coupled with ion mobility spectrometry-mass spectrometry is used to investigate the thermal denaturation of the tetrameric protein concanavalin A. As the solution temperature is increased, changes in mass spectra and collision cross section distributions provide evidence for discrete structural changes that occur at temperatures that are ~40 to 50 degrees below the temperature required for tetramer dissociation. The subtle structural changes are associated with four distinct tetramer conformations with unique melting temperatures. Gibbs-Helmholtz analysis of the free energies determined with respect to the most abundant “native” state yields heat capacities of ΔCp = 1.6 ± 0.3, −2.2 ± 0.4, and −2.9 ± 1.6 kJ·K−1·mol−1, and temperature dependent enthalpies and entropies for the three non-native conformations. Analysis of the thermochemistry indicates that the high-temperature products are entropically stable until the threshold for tetramer dissociation, and changes in heat capacity are consistent with increases in solvation of polar residues. Our findings suggest these high-temperature non-native states result from an increase in disorder at surface exposed regions. Such studies provide valuable insight towards the structural details of non-native states.
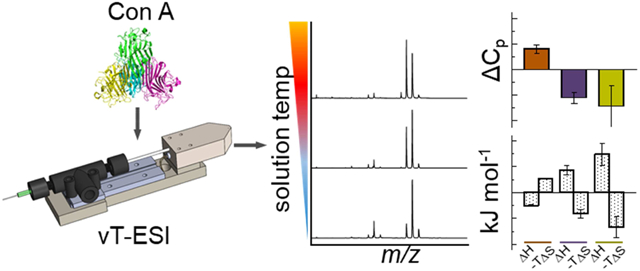
Graphical Abstract
1. Introduction
The protein data bank (PDB) now contains more than 150,000 structures, making it a tremendous resource for efforts aimed at predicting1,2 and designing proteins.3-7 While in recent years the accuracy of computed structures has improved markedly, most predictions focus on native conformations – only a small fraction of available data describe non-native or partially-folded forms (e.g., intermediates or denatured states).1,8-10 Characterization of these conformations will provide a better understanding of why different structures are favored. And, non-native structures are key to understanding fundamental aspects of proteostasis, the molecular origins of aging, as well as the etiology of misfolding based diseases, such as Alzheimer’s and Parkinson’s.11-13 Studies of non-native states are difficult because these species are often disfavored; thus, the abundances of non-native states are low and they are often transient in nature as they may reform the native state. Additionally, non-native structures are especially sensitive to changes in solvent composition,14-17 pH,18,19 heat,20,21 and small molecule binding.22,23
A number of research groups have developed variable temperature (vT) electrospray ionization (ESI) sources to allow mass spectrometry (MS) readouts of structural changes that are induced in solution upon heating.21-33 We recently combined these methods with ion mobility spectrometry (IMS) and found that it is possible to follow structural transitions associated with denaturation in remarkable detail. Inclusion of IMS provides a means of separating different conformations that are trapped upon evaporative cooling of ESI droplets. Compact (folded structures) with smaller collision cross sections have higher mobilities than elongated (unfolded) conformations.34 By incrementally heating the protein solution it is possible to follow the equilibrium distribution of structures that is produced upon thermally denaturing the native state.
In this work, we use vT-ESI-IMS-MS to study the thermal denaturation of homotetrameric concanavalin A (ConA) from C. ensiformis (Scheme 1). ConA is a lectin commonly used in affinity and enrichment chromatography. Monomers (MW ~26 kDa) consist almost entirely of β-sheet structures35 and can bind one transition metal (typically Mn2+), one Ca2+, and one saccharide in the active site.36 ConA dimerizes at acidic pH;37,38 above pH ~6, the protonation states of key acidic and basic residues (e.g., His-51 and His-127) promote the formation of the tetrameric form. Saccharide-bound tetramers have D2 symmetry whereas ligand-free forms have equivalent interfaces between monomer units, arranging the dimers of dimers in a pseudo tetrahedron.39 Differential scanning calorimetry studies indicate that tetrameric ConA is quite thermally stable and irreversibly dissociates at the melting temperature (Tm ~ 350 K).40,41 Below, we show that ligand-free tetramers undergo a subtle structural change prior to complex disassembly and tetramer dissociation. Analysis of IMS results provides evidence that the structural rearrangement involves four distinct species. We have developed and applied a model based on a Gibbs-Helmholtz analysis to capture insight to the enthalpy, entropy, and heat capacity changes for each state. We find that, prior dissociation, the thermochemistry for the products of melting are consistent with an enhancement in interactions of the complex with the bulk solvent – predissociative states that exist over a broad temperature range (~315 to ~345 K). Beyond this temperature, the signal for the tetramer disappears because the protein precipitates. We interpret the loss of signal as an irreversible dissociation event.
Scheme 1.
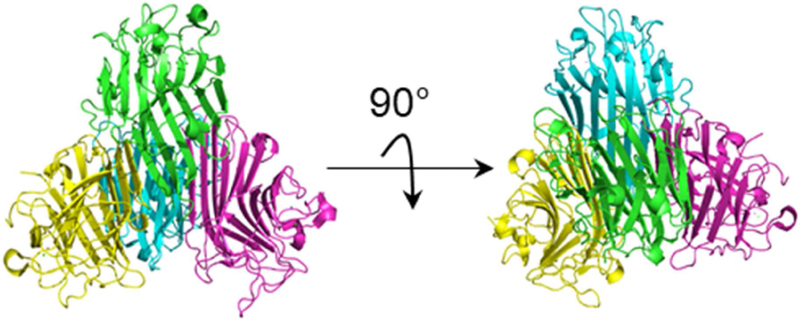
Structure of concanavalin A shown in two different views (PDB: 5cna). The different colors delineate individual monomer units.
2. Experimental
2.1. General
All reagents were purchased from Sigma Aldrich (St. Louis, MO). All solvents were of the highest purity. ConA stock solutions were prepared at 100 μM in 150 mM ammonium acetate adjusted to pH ~ 6.9. Prior to analysis, solutions were desalted using Amicon 10K MWCO filters. Working solutions were prepared to 10 μM.
Electrospray capillaries (1.5 mm OD × 0.78 mm ID, filamented) were pulled to ~1-5 μm inner diameter using a Sutter Instruments P97 Flaming/Brown micropipette puller. ESI was initiated by applying a 0.8 – 1.1 kV potential to a platinum wire inserted into the analyte solution. A Waters Synapt G2 HDMS instrument was used for all IMS-MS experiments. The factory ESI source was removed and interlocks overridden. Our prototype vt-nESI source was coupled to the instrument to allow for temperature control of the analyte solution (see Supplementary Materials for more details). The heater and temperature control circuit were designed in house and based on our previous design.21 Source conditions were optimized to minimize collisional activation.42,43 Typical instrument parameters are as follows: source block temperature, 25°C; sampling cone, 30 – 35 V; extraction cone, 1 – 1.5 V; backing pressure, 5 – 10 mbar; trap gas pressure, ~5.0 × 10⁻² mbar. Collision cross sections in N2 buffer gas were estimated using the protocol developed by Ruotolo et al. using ubiquitin, transthyretin, and myoglobin as calibrants.44
2.2. Data Analysis.
IMS-MS spectra were collected at different temperatures from 298 to 349 K (26 to 76 °C); beyond this temperature, ConA irreversibly disassembles and forms insoluble aggregates.40 All IMS-MS data were processed using UniDec45 and TwimExtract46 software packages. The peak centers and relative abundances for were determined by fitting a Gaussian function to each IMS peak at every temperature using the non-linear peak fitting tool in OriginPro (OriginLab, Northampton, MA). Relative abundances were used to compute equilibrium constants Keq, which were referenced to conformer B,
| (1) |
where Kj(T) is the equilibrium constant of conformer j at temperature T, determined by dividing its intensity Ij(T) at T by the intensity of B (IB(T)). Temperature-dependent equilibrium constants were used to directly calculate the Gibbs free energy ΔG(T) using,
| (2) |
where R is the gas constant. To account for changes in heat capacity, a Gibbs-Helmholtz analysis of ΔG vs temperature datasets was carried out. This was accomplished by a non-linear least-squares optimization of the values of ΔHr and ΔSr, the enthalpies and entropies determined at the reference temperature, Tr, (fixed at 298 K) and heat capacity (ΔCp) using Equation 3,47
| (3) |
Temperature-dependent enthalpies ΔH(T) and entropies ΔS(T) are calculated from equations 4 and 5, respectively.
| (4) |
| (5) |
Equation 3 was coded into Python 3.6 and made use of numpy,48 scipy,49 and matplotlib50 libraries. Uncertainties represent one standard deviation about the mean for three independent measurements. Theoretical collision cross sections were calculated from the crystal structure (PDB: 5cna) using IMPACT51 by averaging over 32 individual calculations.
3. Results and Discussion
3.1. Analysis of structural change by MS charge state shifts.
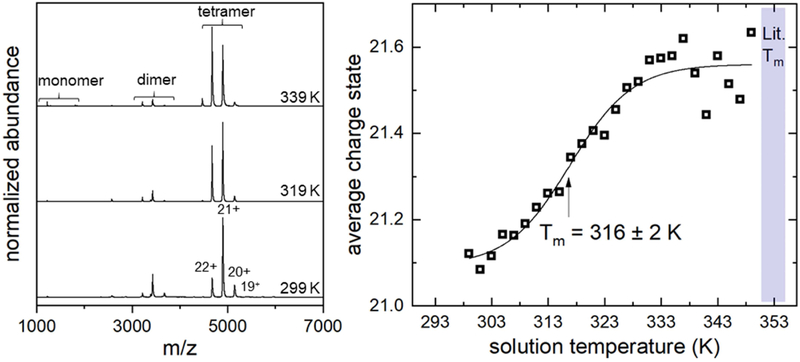
Figure 1 shows mass spectra for ConA collected at T = 299, 319, and 339 K. Analysis of the mass spectrum collected at 299 K shows peaks between m/z = 4500 and 5500 which are signatures of the intact tetramer; a smaller charge state series can be found between m/z = 3200 – 3700 that are consistent with the mass of the dimeric form. Analysis of all mass spectra indicate that the narrow charge state envelope for the tetramer remains the dominant species across all temperatures sampled.
Figure 1.
(left) mass spectral data recorded at representative solution temperatures; (right) average charge state as a function of solution temperature. The melting temperature of 316 ± 2 K indicates a structural change prior to dissociation. Blue shaded region designates reported Tm values for tetramer dissociation.
At low solution temperatures, the charge state envelope for the tetramers is centered about the 21+ ion. As the solution temperature is increased, the charge state distribution shifts to favor the 22+ species. The shift from low to high charge state is a signature of a structural change and is interpreted as a melting transition.24,25 Interestingly, the dimer and monomer species do not substantially increase in abundance even at high temperatures, indicating the tetramer remains the most stable species in solution. While we do not observe tetramer dissociation, close inspection of solutions exposed to ~350 K for prolonged time shows evidence for precipitation, consistent with irreversible dissociation and aggregate formation.
A plot of the average charge state as a function of solution temperature shows that the shift from low to high charge state is gradual (Figure 1, right panel). A fit of this sigmoidal transition yields a melting temperature Tm = 316 ± 2 K. This is far below the expected melting temperature for ConA, which has been reported to be Tm ~ 353 K.40 The subtle shift in charge with increasing temperature is evidence for a structural change that precedes tetramer dissociation. The mass spectrum recorded after cooling the T = 343 K solution is nearly identical to a mass spectrum collected for an unheated sample (see Supplementary Information). Because thermal dissociation of ConA leads to aggregation, the shift in charge must therefore be reporting on a reversible structural change involving the tetrameric form.
3.2. IMS analysis of structures involved in thermal denaturation.
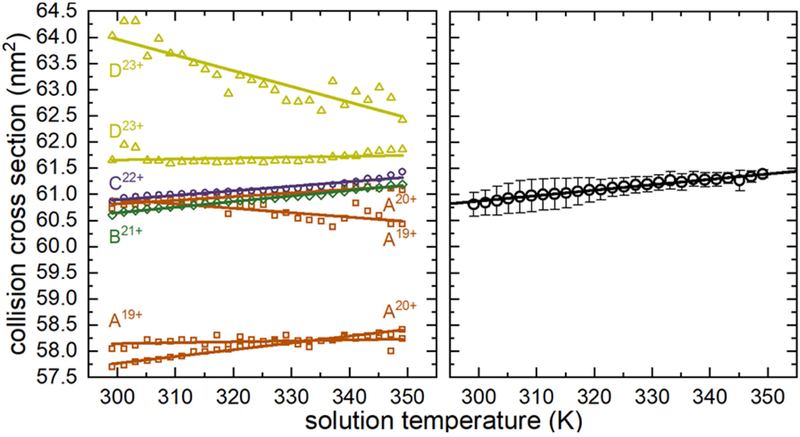
Insight about the structures involved in the melting transition can be gleaned by examining the IMS collision cross section distributions. Because only the solution temperature is varied, these spectra can be analyzed to obtain insight about the structural changes that occurred in solution as well as report on their relative abundances. Figure 2 shows the collision cross section distributions for each charge state at three representative solution temperatures. Analysis of the low temperature collision cross section distribution for 19+ ions shows two peaks centered at 57.8 and 60.8 nm2, respectively, which comprise <1% of the total ion population. The collision cross section distribution for the 20+ charge state, which contributes to ~10% of the total ion signal at low temperatures, is also comprised of two peaks - a small signal at Ω = 57.7 nm2 amid a major peak at Ω = 60.8 nm2. The dominant species present at low temperatures is the peak centered at Ω = 60.6 nm2 that populates the collision cross section distribution for the 21+ charge state. The 22+ species is also comprised of a single peak centered at Ω = 60.9 nm2 which makes up ~20% of the population at low temperatures. Finally, the collision cross section distributions for the low abundance 23+ charge state is made up of a sharp signal at Ω = 61.6 nm2 and a lower mobility shoulder at Ω = 64.2 nm2 – two peaks that are only formed in appreciable quantities at temperatures greater than ~ 320 K. Experimental collision cross sections for these ions are all near the calculated value Ωcalc = 60.8 nm2 from the atomic coordinates of the crystal structure, indicating that these signals are reporting on a distribution of structurally similar conformations.
Figure 2.
Collision cross section distributions for each charge state of ConA. Shaded regions denote each conformer: A – peach, B – green, C – purple, D – yellow. Dotted lines indicate the position of the peak center at 299 K.
As the solution temperature is increased, the populations of the peaks in the 19+ and 20+ collision cross section distributions decreases. These four signals respond with similar temperature dependencies, and as previously described,21 we cannot rule out the possibility that IMS peaks with similar collision cross sections that also respond alike to changes in temperature arise from a common solution phase conformer. Therefore, we group these signals together and assign them as conformer A. Conformer B is made up of the single IMS peak in the 21+ charge state which also decreases in abundance as temperature is increased. The two species which emerge at elevated temperatures are conformer C (the single feature in 22+) and the low abundance signals in the collision cross section distributions are 23+ assigned as conformer D.
Figure 3 shows a plot of the relative abundances at each temperature for these four conformations (i.e., melting curves). It is interesting to consider the loss of conformers A and B in more detail. Conformer A decreases from ~12% to ~5% of the total population from low to high temperatures and has a melting temperature of Tm = 310 ± 3 K. Conformer B, which is the dominant species at low solution temperatures, decreases from ~70% to ~40% of the total population at high temperatures, and has Tm = 318 ± 2 K. These mobility-derived melting curves have Tm values that are nearly 40 K lower than the value measured for the ensemble average determined from calorimetry measurements.40,41 This requires that two structurally similar species undergo distinct structural rearrangements far below the temperature required to dissociate the complex – else their melting curves would be identical.
Figure 3.
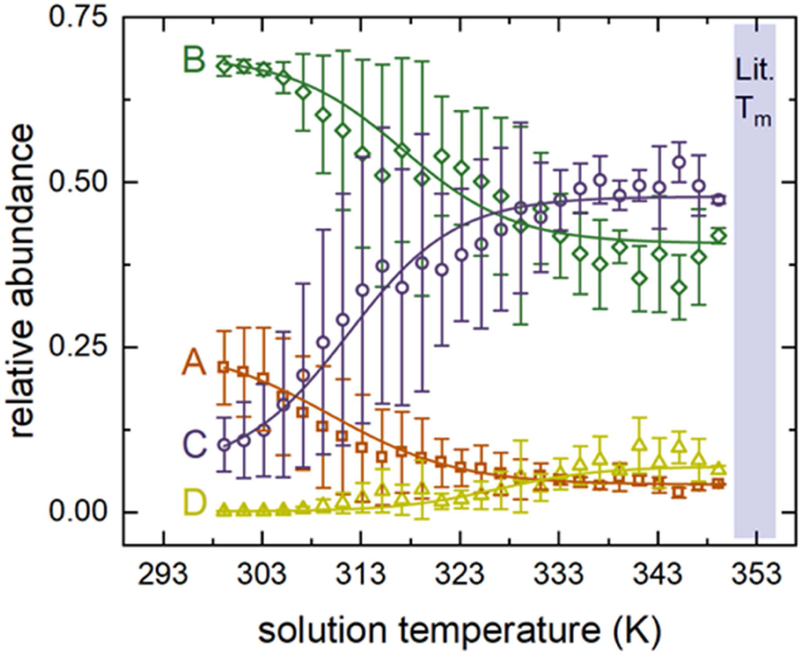
Abundance profile for each conformer as a function of solution temperature. Tm values for each conformer are: A – 310 ± 3 K; B – 318 ± 2 K; C – 315 ± 2 K; D – 327 ± 2 K. Blue shaded region designates reported Tm values for tetramer dissociation.
This analysis can be extended to the products of melting. Conformer C, which is the dominant product of melting, begins at ~13% of the total population at T = 299 K and increases to ~50% at T = 333 K with midpoint formation temperature Tf = 315 ± 1 K. The low abundance conformer D emerges with increases in solution temperature and has Tf = 327 ± 2 K. Differences in the temperature profiles and formation temperatures for these species provides further evidence for two distinct products of melting which retain enough stability to resist dissociation.
3.3. Thermal denaturation of ConA involves a gradual structural change.
Figure 4 shows that coupled to the changes in IMS peak population is a subtle shift in peak center. At low-solution temperatures, each dominant IMS peak is centered near 60 nm2, indicating the conformers have closely related topologies. As the solution temperature increases, the peak centers within each collision cross section distribution shift (also delineated by the dashed lines in Figure 2). For example, the peak centers for conformers B and C show a slight increase at elevated temperatures. As these are the major signals at every temperature, we anticipate they are reporting on the dominant solution-phase structures. Some conformers shift to lower collision cross sections with increases in temperature, as is observed for the feature at ~58.1 nm2 in 19+ and the shoulder at ~64.0 nm2 in the 23+ charge state. This may suggest the presence of several additional unique but low abundance conformations not captured by comparing temperature-dependent abundance profiles. However, these changes are linear with respect to temperature and therefore do not behave as typical cooperative melting transitions. We conservatively do not interpret these as discrete melting events, but instead consider the possibility that the changes may originate from differences in protonation state (i.e., protomers). Nonetheless we observe that on average, the abundant features in each collision cross section distribution shift to higher values. Figure 4 illustrates this by plotting the weighted average collision cross section at each solution temperature, which has an excellent correlation with temperature and provides a clue that the structural rearrangement involves an extremely subtle change in topology.
Figure 4.
Plots showing peak center as a function of solution temperature for each signal (left) and the weighted average (right) across each collision cross section distribution.
In the absence of saccharides, tetrameric ConA has essentially equivalent monomers arranged in a pseudo-tetrahedron. Any structural change within a subunit must also occur symmetrically across entire complex. We consider two possibilities that may give rise to such a subtle structural change with a clear temperature dependence: (1) regions on the surface of each subunit lose some elements of structure, causing them to unfold, and/or (2) the entire complex expands isotropically due to weakened intermolecular forces between subunits. Whatever the underlying motion may be, the tetrameric form must remain intact. Both cases result in a gradual thermal expansion of the tetrameric complex. Since IMS measurements are unable to distinguish between such topological subtleties with absolute certainty, we cannot rule out either case. However, we would expect the latter case to result in exposure of several titratable amino acid side chains (e.g., His-51, His-127) that are expected to capture protons during the process of ESI.52 These residues form key intramolecular interactions in the interface between subunits. Changes to the protonation states of these species will alter the hydrogen bonding patterns and increase the Coulomb repulsion between subunits. In this scenario, the intact tetramer would likely not survive the transfer to the gas-phase. Therefore, we consider the former case to be more likely.
3.4. Capturing the thermodynamics mediating the structural rearrangement.
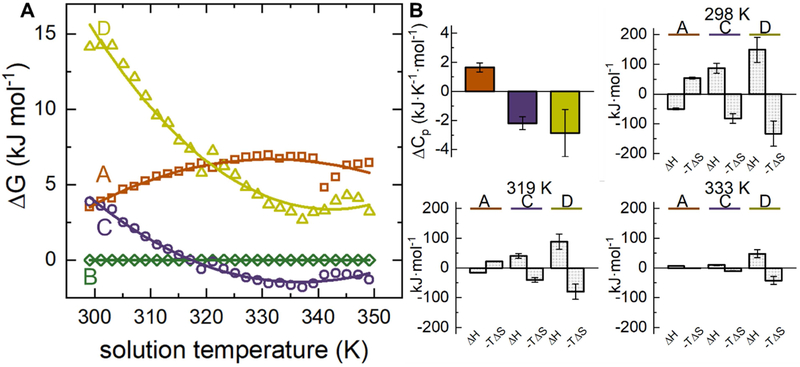
The ability to monitor the abundances of both native and non-native conformations with such high fidelity provides the rare opportunity to capture their thermodynamic stabilities. Figure 5A shows a plot of the calculated Gibbs free energy as a function of solution temperature for each conformer (using Eqs. 1 and 2). The curvature of these plots is a signature of a heat capacity change. Therefore, we fit these data to the non-linear form of the Gibbs-Helmholtz equation47 (Eq. 3) to determine the enthalpy and entropy at 298 K and associated change in ΔCp. The solid lines in Figure 5A show the model has excellent agreement with data; the derived values for ΔH°, ΔS°, and ΔCp (at 298 K) are listed in Table 1 and plotted in Figure 5B.
Figure 5.
(A) Gibbs-Helmholtz plot of calculated ΔG as a function of solution temperature and (B) heat capacities and thermodynamic values at 298 K, 319 K, and 333 K. ΔG values determined with respect to conformer B.
Table 1.
Thermochemistry of conformers A, C, and D at 298 K.a
| Conformer | ΔH° (kJ·mol−1) |
ΔS° (J·K−1 mol−1) |
−TΔS° (kJ·mol−1) |
ΔCp (kJ·K−1·mol−1) |
|---|---|---|---|---|
| A | −50.4 ± 3.1 | −179.8 ± 9.5 | 53.6 ± 2.8 | 1.6 ± 0.3 |
| C | 86.6 ± 17.0 | 275.1± 54.7 | −82.0 ± 16.3 | −2.2 ± 0.4 |
| D | 148.6 ± 42.6 | 446.3 ± 141.5 | −133.0 ± 42.2 | −2.9 ± 1.6 |
Values are for a 150 mM ammonium acetate solution at pH 6.9.
Fersht,53 Privalov,54 Sharp,55 and Sturtevant56 have argued that these thermochemical values provide insight about some molecular details involved with thermal denaturation. Folded structures are stabilized by intramolecular contacts (e.g., salt-bridges, hydrogen bonds, sidechain packing). This stabilization (a decrease in enthalpy) occurs at the expense of configurational freedom (ΔS). As the temperature is increased, many of the stabilizing intramolecular bonding interactions (in the folded state) are lost; this allows the protein to adopt new conformations and the new structures that are formed are expected to have a greater configurational entropy and a less favorable enthalpy. From this, one expects that the native state will have a higher ΔCp than the denatured forms. However, the thermodynamic contributions from the solvent must also be considered. As less ordered forms of the protein are favored at elevated temperatures, ordered water networks can assemble around exposed non-polar residues leading to an increase in ΔCp of the denatured states. The formation of these “icebergs” maximizes the number of favorable hydrogen bonds formed between the solvent molecules, consequently restricting their accessible configurations. As temperature is increased, these hydrogen bonding networks also become unstable and the loss of these structures also contribute to an increase in ΔCp in the denatured conformations. In contrast, interaction between water and exposed polar residues cause ΔCp to be small or negative, and decreases the overall order of the solvent, resulting in a favorable ΔS component (more conformational freedom) at the expense of ΔH (i.e., arising from fewer hydrogen bonding interactions). The effects of polar and non-polar solvation are additive and is the major contribution to heat capacity differences between the native and “denatured” forms. Because the hydrophobic effect is the driving force behind folding, heat-denatured forms are expected to have an enhancement in non-polar solvation as these residues emerge from buried regions in the folded polypeptide, i.e., the overall ΔCp is positive.53
Analysis of the ΔCp values in Figure 5B shows that the magnitudes are small, suggesting that the conformers share a common structural motif. The positive ΔCp for conformer A is a signature of non-polar amino acid solvation, whereas the negative ΔCp values for conformers C and D are indicative of solvation of hydrophilic residues by water. The negative ΔCp values for the product conformers was unexpected, as high-temperature unfolded states typically have more hydrophobic residues exposed to the surrounding solvent as compared to compact, folded forms. Deviation from this expected trend suggests the product conformers adopt flexible structures that contribute to an overall decrease in solvent-protein order.
The ΔCp terms cause the ΔH and ΔS to have a significant temperature dependence. Also shown in Figure 5B are the enthalpies and entropies at three representative temperatures calculated from Eq. 2 and Eq. 3. At 298 K, conformer A is the most energetically favorable species at the expense of an unfavorable entropic component. Conformers C and D are both formed unfavorably with respect to enthalpy and are instead stabilized by the increase in entropy. As temperature is increased, the enthalpic component for conformer A is driven to values that are increasingly more positive (i.e., unfavorable). By 333 K, the entropy becomes stabilizing amid an unfavorable enthalpic component; the abundance of this species decreases at increased temperatures, likely because the increase in entropy is not enough to compensate the destabilizing enthalpic component. Conformers C and D are stable at high temperatures. At 319 K, both are formed endothermically and are therefore stabilized by the entropic components. The 333 K thermochemistry shows the values for entropy have decreased but remains positive; these species are still formed endothermically.
Both high temperature products are entropically stabilized, have increased collision cross sections at high temperatures, and have negative ΔCp values. These factors suggest that formation of conformers C and D provide an increase in the disorder of the system. Most importantly, amid this structural change, the tetramer is still stable in solution. Therefore, any conformational changes responsible for forming these high temperature species is anticipated to arise from an increase in disorder at the surface exposed regions rather than a loss of structure in the major fold or a breakdown in the subunit interfaces responsible for stabilizing the tetramer.35 This would lead to an increase in the overall configurational entropy of the protein and enhance the solvent-protein interactions at regions that are already surface exposed. This would not significantly increase ΔCp since these regions are already interacting with solvent. We anticipate that the increase in disorder at the surface exposed loops and turns would provide more opportunities for intermolecular solvent-conformation interactions and would allow the hydrogen bonding network present in the bulk to extend closer to the protein complex. While we cannot eliminate the possibility that the entire complex expands isotropically, this would likely create cavities between subunits that can be occupied by solvent (like in the active site)37,38,36,39 which increases the order significantly.
3.5. Temperature-dependent enthalpies and entropies.
Capturing changes in the heat capacity provides the rare opportunity to determine the temperature-dependent enthalpies and entropies in a conformationally-resolved fashion. Figure 6 plots the enthalpies, entropies, and Gibbs free-energies for conformers A, C, and D calculated from Eq. (2), (3), and ΔG = ΔH – TΔS. Visual inspection of the low temperature region shows that conformer A is the only favored form. Analysis of the enthalpic and entropic components indicate that conformer A maintains stability by enthalpy amid an unfavorable entropic component. As temperature is increased, the dashed and dotted lines coalesce, indicating that the entropic penalty is minimized at the expense of energy. Thus, while the system becomes more accessible at increased temperatures, fewer strong interactions are available. This is likely the reason that this species is not made in appreciable quantities at high temperatures. Interestingly, the enthalpic and entropic terms for conformers C and D are not only different, they show a sign inversion with respect to those found for conformer A. In other words, at low temperatures, these conformers are the enthalpically disfavored, but entropically preferred forms of ConA. Analysis of the magnitudes of the entropy and enthalpy values shows their summation will result in similar free energies (i.e., ΔG ± 25 kJ mol−1) across the temperature range, in good agreement with the notion that folding and assembly result from a delicate balance of marginally-stabilizing interactions.53
Figure 6.
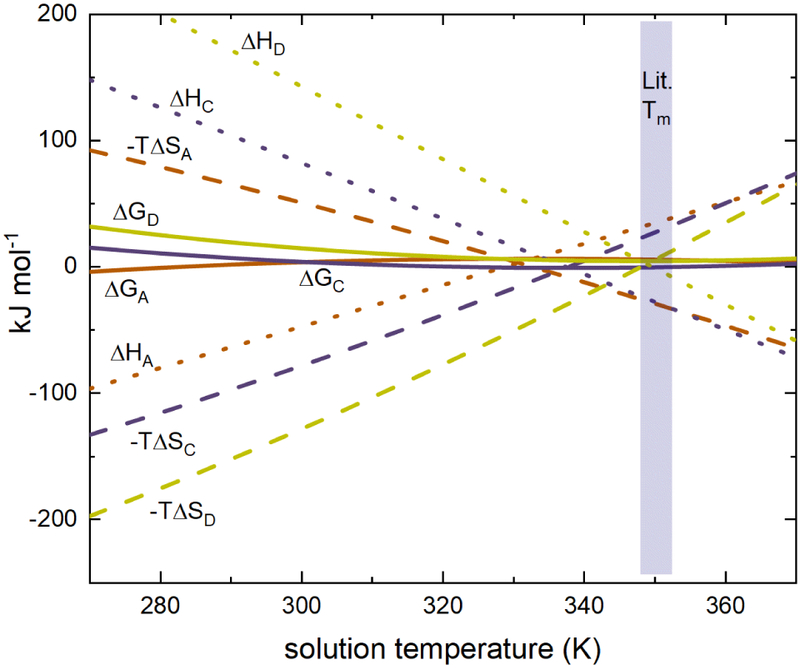
Calculated thermodynamic values from 270 – 375 K.
As the temperature is increased, the entropy and enthalpy values for each conformation converge towards zero but are still correlated such that their summation will always yield similar free energies. As an example, at T = 300 K, ΔHc = 82.2 ± 16.1 kJ·mol−1 and, −TΔSC = −78.1 ± 15.5 kJ·mol−1, resulting in a free energy of ΔGC = 4.1 ± 3.1 kJ·mol−1, and at T = 365 K, ΔHC = −60.6 ± 11.9 kJ·mol−1 and −TΔSC = 62.2 ± 12.4 kJ·mol−1, yielding ΔGC = 1.6 ± 0.5 kJ·mol−1. This trend is consistent across all temperatures sampled; convergence of the ΔH and −TΔS components such that only a narrow range of free energies is accessible is a signature of an increasingly rugged landscape, which facilitates the coexistence of several structures. Our calculations indicate that conformer A should be reestablished as the preferred state above T = 350 K. But, at this temperature, the system overcomes the barrier for tetramer dissociation creating a competing kinetic process that precludes our ability to probe equilibria.
4. Summary and Conclusions
vT-ESI-IMS-MS was used to study tetrameric ConA. The temperature-dependent MS data provided a clue for a reversible structural change that precedes tetramer dissociation. Analysis of the abundances of peaks in each collision cross section distribution provided evidence for four unique conformations that have discrete Tm values far below the melting temperature of 350 K reported for tetramer dissociation.40,41 Collision cross sections for all conformers were found to shift linearly with increasing temperature. We interpret this continuous change as evidence that the structural change corresponds to a uniform change throughout the complexes. The structural change is reversible, indicating the subtle rearrangement does not induce large changes to the overall topology. Plots of free energy versus temperature for each conformer were analyzed using the Gibbs-Helmholtz relation and temperature dependent thermochemistry was reported. Heat capacities for product states C and D were consistent with solvation of polar residues; the favorable entropic components suggest the structural change involves a loss of structure unfolding at solvent-exposed regions. Entropy stabilized these high-temperature forms up to the point of tetramer dissociation. While not directly observed, calculation of the thermochemistry at temperatures inaccessible to experiment (due to complex dissociation or aggregation) can be used to further understand the driving forces responsible for establishing structure.
Supplementary Material
Highlights.
Concanavalin A tetramers undergo a reversible structural change before dissociation
Four conformations were found by analyzing temperature-dependent ion mobility data
Gibbs-Helmholtz analysis was used determine the thermochemistry of each state
Acknowledgements
This work was supported in part from funds from the National Institutes of Health (5R01GM121751-02, and 1R01GM131100-01) and the Waters Corporation. TJE gratefully acknowledge support from the Indiana University College of Arts and Sciences Dissertation Research Award.
Footnotes
Publisher's Disclaimer: This is a PDF file of an unedited manuscript that has been accepted for publication. As a service to our customers we are providing this early version of the manuscript. The manuscript will undergo copyediting, typesetting, and review of the resulting proof before it is published in its final citable form. Please note that during the production process errors may be discovered which could affect the content, and all legal disclaimers that apply to the journal pertain.
Supplementary Materials
Details of the vT-ESI source, reversibility study, and table of temperature-dependent equilibrium constants.
The authors declare no competing financial interest.
References
- 1.Dill KA; MacCallum JL The protein-folding problem, 50 years on. Science, 2012, 338, 1042–1046. [DOI] [PubMed] [Google Scholar]
- 2.Service RF Google’s DeepMind aces protein folding. Science, 2018, doi: 10.1126/science.aaw2747. [DOI] [Google Scholar]
- 3.Buller AR; van Roye P; Cahn JKB; Scheele RA; Herger M; Arnold F Directed Evolution Mimics Allosteric Activation by Stepwise Tuning of the Conformational Ensemble. J. Am. Chem. Soc 2018, 140, 7256–7266. [DOI] [PMC free article] [PubMed] [Google Scholar]
- 4.Almhjell PJ; Boville CE; Arnold FH Engineering enzymes for noncanonical amino acid synthesis. Chem. Soc. Rev 2018, 47, 8980–8997. [DOI] [PMC free article] [PubMed] [Google Scholar]
- 5.Chevalier A; Silva D-A; Rocklin G,J; Hicks DR; Vergara R; Murapa P; Bernard SM; Zhang L; Lam K-H; Guorui B; Bahl CD; Miyashita S-I; Goreshnik I; Fuller JT; Koday MT; Jenkins CM; Colvin T; Carter L; Bohn A; Bryan CM; Fernandez-Velasco AD; Stewart L; Dong M; Huang X; Jin R; Wilson IA; Fuller DH; Baker D Massively parrel de novo protein design for targeted therapeutics. Nature, 2017, 550, 74–79. [DOI] [PMC free article] [PubMed] [Google Scholar]
- 6.Zibo C; Boyken s. E.; Jia M; Busch F; Flores-Solis D; Bick MJ; Lu P; VanAernum ZL; Sahasrabuddhe A; Langan RA; Bermeo S; Brunette TJ; Mulligan VK; Carter LP; DiMaio F; Sgourakis NG; Wysocki VH; Baker D Programmable design of orthogonal protein heterodimers. Nature, 2019, 565, 106–111. [DOI] [PMC free article] [PubMed] [Google Scholar]
- 7.Anfinsen CB Principles that govern the folding of protein chains. Science, 1973, 181, 223–230. [DOI] [PubMed] [Google Scholar]
- 8.Dill KA; Chan HS From Leventhal to pathways to funnels. Nat. Struct. Biol 1997, 4, 10–19. [DOI] [PubMed] [Google Scholar]
- 9.Fersht AR From the first protein structures to our current knowledge of protein folding: delights and skepticisms. Nat. Rev. Mol. Cell Biol 2008, 9, 650–654. [DOI] [PubMed] [Google Scholar]
- 10.Englander SW; Mayne L The nature of protein folding pathways. Proc. Natl. Acad. Sci. U. S. A 2014, 111, 15873–15880. [DOI] [PMC free article] [PubMed] [Google Scholar]
- 11.Truscott RJW; Schey KL; Friedrich MG Old proteins in man: A field in its infancy. Trends Biochem. Sci 2016, 41, 654–664. [DOI] [PMC free article] [PubMed] [Google Scholar]
- 12.Leuenberger P Ganscha s.; Kahraman A; Cappellitti V; Boersema PJ; von Mering C; Claassen M; Picotti P Cell-wide analysis of protein thermal unfolding reveals determinants of thermostability. Science, 2017, 355, eaai7825. [DOI] [PubMed] [Google Scholar]
- 13.Rocklin GJ; Chidyausiku TM; Goreshnik I; Ford A; Houliston S; Lemak A; Carter L; Ravichandran R; Mulligan VK; Chevalier A; Arrowsmith CH; Baker D Global analysis of protein folding using massively parallel design, synthesis, and testing. Science, 2017, 168–175. [DOI] [PMC free article] [PubMed] [Google Scholar]
- 14.Pace CN Determination and analysis of urea and guanidine hydrochloride denaturation curves. Methods Enzymol. 1986, 131, 266–280. [DOI] [PubMed] [Google Scholar]
- 15.Shi H; Clemmer DE Evidence for Two New Solution States of Ubiquitin by IMS-MS Analysis. J. Phys. Chem. B 2014, 118, 3498–3506. [DOI] [PMC free article] [PubMed] [Google Scholar]
- 16.Religa TL; Markson JS; Mayor U; Freund SMV; Fersht AR Solution structure of a protein denatured state and folding intermediate. Nature, 2005, 437, 1053–1056. [DOI] [PubMed] [Google Scholar]
- 17.Pace CN; Shaw KL Linear extrapolation method for analyzing solvent denaturation curves. Proteins, 2000, 41, 1–7. [DOI] [PubMed] [Google Scholar]
- 18.Anderson DE; Becktel WJ; Dahlquist FW pH-induced denaturation of proteins: a single salt bridge contributes 3–5 kcal/mol to the free energy of folding of T4 lysozyme. Biochemistry. 1990, 29, 2403–2408. [DOI] [PubMed] [Google Scholar]
- 19.Konermann L; Douglas DJ Acid-induced unfolding of cytochrome c at different methanol concentrations: electrospray ionization mass spectrometry specifically monitors changes in the tertiary structure. Biochemistry, 1997, 36, 12296–12302. [DOI] [PubMed] [Google Scholar]
- 20.Jackson SE; Fersht AR Folding of chymotrypsin inhibitor 2. 1. Evidence for a two-state transition. Biochemistry, 1991, 30, 10428–10435. [DOI] [PubMed] [Google Scholar]
- 21.El-Baba TJ; Woodall DW; Raab SA; Fuller DR; Laganowsky A; Russell DH; Clemmer DE Melting Proteins: Evidence for Multiple Stable Structures upon Thermal Denaturation of Native Ubiquitin from Ion Mobility Spectrometry-Mass Spectrometry Measurements. J. Am. Chem. Soc 2017, 139, 6306–6309. [DOI] [PubMed] [Google Scholar]
- 22.Eschweiler JD; Martini RM; Ruotolo BT Chemical probes and engineered constructs reveal a detailed unfolding mechanism for a solvent-free multidomain protein. J. Am. Chem. Soc 2016, 139, 534–540. [DOI] [PMC free article] [PubMed] [Google Scholar]
- 23.Chorev DS; Baker LA; Wu D; Beilsten-Edmands V; Rouse SL; Zeev-Ben-Mordehai T; Jiko C; Samsudin F; Gerle C; Khalid S; Stewart AG; Matthews SJ; Gruenewald K; Robinson CV Protein assemblies ejected directly from native membranes yield complexes for mass spectrometry. Science, 2018, 362, 829–834. [DOI] [PMC free article] [PubMed] [Google Scholar]
- 24.Mirza UA; Cohen SL; Chait BT Heat-induced conformational changes in proteins studied by electrospray ionization mass spectrometry. Anal. Chem 1993, 65, 1–6. [DOI] [PubMed] [Google Scholar]
- 25.Benesch JLP, Sobott F, Robinson CV Thermal Dissociation of Multimeric Protein Complexes by Using Nanoelectrospray Mass Spectrometry. Anal. Chem 2003, 75, 2208–2214. [DOI] [PubMed] [Google Scholar]
- 26.Sterling HJ; Williams ER Origin of supercharging in electrospray ionization of noncovalent complexes from aqueous solution. J. Am. Soc. Mass Spectrom 2009, 20, 1933–1943. [DOI] [PMC free article] [PubMed] [Google Scholar]
- 27.Wang G; Abzalimov RR; Kaltashov IA Direct monitoring of heat-stressed biopolymers with temperature-controlled electrospray ionization mass spectrometry. Anal. Chem 2011, 83, 2870–2876. [DOI] [PubMed] [Google Scholar]
- 28.Cong X; Liu Y; Liu W; Liang X; Russell DH Laganowsky A Determining Membrane Protein-Lipid Binding Thermodynamics Using Native Mass Spectrometry. J. Am. Chem. Soc 2016, 138, 4346–4349. [DOI] [PubMed] [Google Scholar]
- 29.Hommersom B; Porta T; Heeren RMA Ion mobility spectrometry reveals intermediate states in temperature-resolved DNA unfolding. Int. J. Mass Spectrom, 2017, 14, 52–55. [Google Scholar]
- 30.Li G; Zheng S; Chen Y; Hou Z; Huang G Reliable Tracking In-Solution Protein Unfolding via Ultrafast Thermal Unfolding/Ion Mobility-Mass Spectrometry. Anal. Chem 2018, 90, 7997–8001. [DOI] [PubMed] [Google Scholar]
- 31.Fuller DR; Conant CR; El-Baba TJ; Brown CJ; Woodall DW; Russell DH; Clemmer DE Conformationally regulated peptide bond cleavage in bradykinin. J. Am. Chem. Soc 2018, 140, 9357–9360. [DOI] [PMC free article] [PubMed] [Google Scholar]
- 32.Marchand A; Rosu F; Zenobi R; Gabelica V Thermal Denaturation of DNA G-Quadruplexes and Their Complexes with Ligands: Thermodynamic Analysis of the Multiple States Revealed by Mass Spectrometry. J. Am. Chem. Soc 2018, 140, 12553–12565. [DOI] [PubMed] [Google Scholar]
- 33.Conant CR; Fuller DR; El-Baba TJ; Zhang Z; Russell DH; Clemmer DE Substance P in solution: trans-to-cis configurational changes of penultimate prolines initiate non-enzymatic peptide bond cleavages. 2019, in press. [DOI] [PMC free article] [PubMed] [Google Scholar]
- 34.Clemmer DE; Hudgins RR; Jarrold MF Naked Protein Conformations: Cytochrome c in the Gas Phase. J. Am. Chem. Soc 1995, 117, 10141–10142. [Google Scholar]
- 35.Arrondo JLR; Young NM; Mantsch HH The solution structure of concanavalin A probed by FT-IR spectroscopy. Biochim. Biophys. Acta, 1988, 952, 261–268. [DOI] [PubMed] [Google Scholar]
- 36.Hardman KD; Ainsworth CF Structure of concanavalin A at 2.4-Ang resolution. Biochemistry, 1972, 11, 4910–4919. [DOI] [PubMed] [Google Scholar]
- 37.Naismith JH; Emmerich C; Habash J; Harrop SJ; Helliwell JR; Hunter WN; Raftery J; Kalb (Gilboa) AJ; Yariv J Refined structure of concanavalin A complexed with methyl [alpha]-D-mannopyranoside at 2.0 Å resolution and comparison with the saccharide-free structure. Acta Cryst. 1994, D50, 847–858. [DOI] [PubMed] [Google Scholar]
- 38.Becker JW; Rekee GN; Wang JL; Cunningham BA; Edelman GM The Covalent and Three-Dimensional Structure of Concanavalin A III. Structure of the Monomer and Its Interactions with Metals and Saccharides. J. Biol. Chem 1975, 250, 1513–1524. [PubMed] [Google Scholar]
- 39.Reeke G; Becker JW; Cunningham BA; Wang JL; Yahara I; Edelman GM Structure and function of concanavalin A. Adv. Exp. Med. Biol 1975, 55 (13), 13–33. [DOI] [PubMed] [Google Scholar]
- 40.Banerjee T; Kishore N A differential scanning calorimetric study on the irreversible thermal unfolding of concanavalin A. Thermochim. Acta, 2004, 411, 195–201. [Google Scholar]
- 41.Han L; Ruotolo BT Hofmeister Salts Recover a Misfolded Multiprotein Complex for Subsequent Structural Measurements in the Gas Phase. Angew. Chem. Int. Ed 2013, 52, 8329–8332. [DOI] [PMC free article] [PubMed] [Google Scholar]
- 42.Hernandez H; Robinson CV Determining the stoichiometry and interactions of macromolecular assemblies from mass spectrometry. Nat. Protoc 2007, 2, 715–726. [DOI] [PubMed] [Google Scholar]
- 43.Ruotolo BT; Benesch JLP; Sandercock AM; Hyung SJ; Robinson CV Ion mobility-mass spectrometry analysis of large protein complexes. Nat. Protoc, 2008, 7, 1139–1152. [DOI] [PubMed] [Google Scholar]
- 44.Bush MF; Hall Z; Giles K; Hoyes J; Robinson CV; Ruotolo BT Collision Cross Sections of Proteins and Their Complexes: A Calibration Framework and Database for Gas-Phase Structural Biology. Anal. Chem 2010, 82, 9557–9565. [DOI] [PubMed] [Google Scholar]
- 45.Marty MT; Baldwin AJ; Marklund EG; Hochberg GKA; Benesch JLP; Robinson CV Bayesian Deconvolution of Mass and Ion Mobility Spectra: From Binary Interactions to Polydisperse Ensembles. Anal. Chem 2015, 87, 4370–4376. [DOI] [PMC free article] [PubMed] [Google Scholar]
- 46.Haynes SE; Polasky DA; Dixit SM; Majmudar JD; Neeson K; Ruotolo BT; Martin BR Variable-Velocity Traveling-Wave Ion Mobility Separation Enhancing Peak Capacity for Data-Independent Acquisition Proteomics. Anal. Chem 2017, 89, 5669–5672. [DOI] [PMC free article] [PubMed] [Google Scholar]
- 47.LiCata VJ; Liu C-C Analysis of Free Energy Versus Temperature Curves in Protein Folding and Macromolecular Interaction. Methods Enzymol. 2011, 488, 219–238. [DOI] [PubMed] [Google Scholar]
- 48.van der Walt S; Colbert SC; Varoquaux G The NumPy array: a structure for efficient numerical computation. Comput. Sci. Eng 2011, 13, 22–30. [Google Scholar]
- 49.Millman KJ; Aivazis M Python for scientists and engineers. Comput. Sci. Eng 2011, 13, 9–12. [Google Scholar]
- 50.Hunter JD Matplotlib: A 2D graphics environment. Comput. Sci. Eng 2007, 9, 90–95. [Google Scholar]
- 51.Marklund EG; Degiacoomi MT; Robinson CV; Baldwin AJ; Benesch JLP Collisions Cross Sections for Structural Proteomics. Structure, 2015, 23, 791–799. [DOI] [PubMed] [Google Scholar]
- 52.Bleiholder C; Suhai S; Paizs B Revising the proton affinity scale of the naturally occurring alpha-amino acids. J. Am. Soc. Mass Spectrom 2006, 17, 1275–1281. [DOI] [PubMed] [Google Scholar]
- 53.Fersht AR Structure and Mechanism in Protein Science. W. H. Freeman and Company, New York, NY, 2003, pp 509–539. [Google Scholar]
- 54.Privalov PL; Makhatadze GI Contribution of hydration and non-covalent interactions to the heat capacity effect on protein unfolding. J. Mol. Biol 1992, 224, 715–723. [DOI] [PubMed] [Google Scholar]
- 55.Prabhu NV; Sharp K Heat capacity in Proteins. Annu. Rev. Phys. Chem 2005, 56, 521–548. [DOI] [PubMed] [Google Scholar]
- 56.Liu Y; Sturtevant JM The observed change in heat capacity accompanying the thermal unfolding of proteins depends on the composition of the solution and on the method employed to change the temperature of unfolding. Biochemistry, 1996, 35, 4059–3062. [DOI] [PubMed] [Google Scholar]
Associated Data
This section collects any data citations, data availability statements, or supplementary materials included in this article.


