Figure 3.
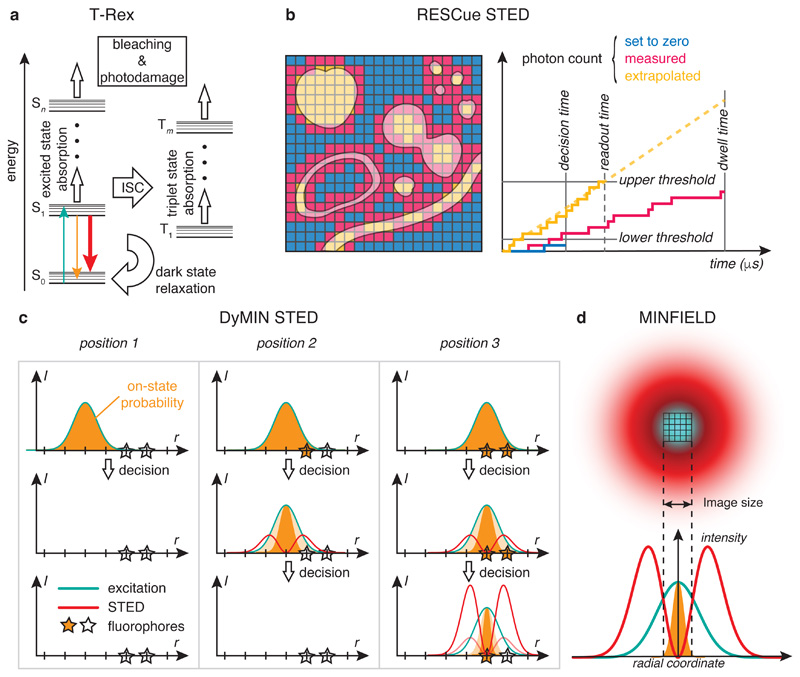
Strategies to reduce light exposure and photobleaching in STED nanoscopy. a Dark/triplet state relaxation (T-Rex). Energy schematic for the relevant molecular states in STED microscopy. Fluorophores normally cycle between the ground state S0 and the first excited state S1 (same colour code for transitions as in Fig. 1). Excited state absorption drives fluorophores to higher lying molecular states Sn. Fluorophores undergoing intersystem crossing (ISC) to the triplet manifold may also absorb excitation and/or STED light and are particularly prone to chemical reactions, including radical generation. Residence times in triplet states are long (μs) compared to lifetimes of singlet excited states (ns). Dark (or triplet) state relaxation allows fluorophores to relax back to the singlet manifold. b RESCue STED. Left: Sample structure (shaded areas) with colour code for light exposure at each scan position (pixel). Right: Three exemplary photon counts as a function of time at different pixels. Blue: lower threshold is not reached at the decision time. Excitation and STED beams are turned off. Yellow: enough photons are collected to extrapolate from the readout time to the full pixel dwell time with the desired signal-to-noise ratio. Lasers are turned off. Pink: the full pixel dwell time is used for collecting the signal. c DyMIN STED. Three exemplary light exposure sequences (top to bottom) at individual pixels. Position 1: No signal is collected in diffraction-limited mode. Lasers are turned off. Position 2: Signal is present in diffraction-limited mode. STED is turned on at the first power level. Since no more signal is present, a further increase in STED power would not yield additional information. Position 3: STED power is successively stepped up to the maximum value to separate fluorophores. Stars: fluorophores. Dark orange: normalized on-state probability defining resolution; light orange: resolution in previous intensity step; r, scan position; I, intensity. d In MINFIELD STED, the field of view is restricted to a region smaller than the extent of the doughnut beam, such that the region of interest is spared from exposure to the STED-light intensity maxima.

