Abstract
Understanding the mechanisms that modulate T helper lymphocyte functions is crucial to decipher normal and pathogenic immune responses in humans. To identify molecular determinants influencing the pathogenicity of T cells, we separated ex vivo-isolated primary human memory T lymphocytes based on their ability to produce high levels of inflammatory cytokines. We found that the inflammatory, cytokine-producing phenotype of memory T lymphocytes was defined by a specific core gene signature and was mechanistically regulated by the constitutive activation of the NF-κB pathway and by the expression of the transcriptional repressor BHLHE40. BHLHE40 attenuated the expression of anti-inflammatory factors, including miR-146a, a negative regulator of NF-κB activation, and ZC3H12D, an RNase of the Regnase-1 family able to degrade inflammatory transcripts. Our data reveal a molecular network regulating the pro-inflammatory phenotype of human memory T lymphocytes, with the potential to contribute to disease.
Keywords: T helper lymphocytes, transcription factors, microRNAs, cytokines, autoimmunity, inflammatory disease
Introduction
Although memory T lymphocytes are catalogued into discrete subsets characterized by the ability to produce specific cytokines, in vivo they constitute a continuum ranging from anti-inflammatory to highly pro-inflammatory phenotypes1. At population level, T cells are also heterogeneous in terms of their ability to express cytokines, giving rise to stable cytokine-producing and non-producing subpopulations2. Understanding mechanisms that play a key role in generating such population diversity and in tipping the balance towards a defined phenotype therefore remains crucial to decipher normal and pathogenic immune responses.
A mechanistic definition of the regulatory circuits underlying the ability of memory T cells to produce pro-inflammatory cytokines will contribute to understand the pathogenesis of immune-mediated diseases. For instance, although myelin-reactive CD4+ T cells are found at similar frequencies in the blood of healthy donors and patients with multiple sclerosis (MS), in MS patients they show a more pro-inflammatory profile3. Therefore, it is not the frequency but rather the phenotype of such autoreactive T cells that primarily discriminates between homeostasis and disease. However, the mechanisms underlying the induction of such strongly pro-inflammatory phenotype of T cells are incompletely understood.
GM-CSF (granulocyte-macrophage colony-stimulating factor) is elevated in T cells from patients with MS4, 5. GM-CSF expression is critical for the development and maintenance of chronic inflammatory disorders and autoimmune diseases, in which it stimulates innate and adaptive immune responses and amplifies tissue inflammation4, 6. It is abundant in the synovium of rheumatoid arthritis patients, whose treatment with antibodies against GM-CSF or its receptor showed clinical efficacy7, 8. Conversely, recurrence of disease was observed upon treatment of patients with GM-CSF9. Consistently, deletion of the Csf2 gene, encoding GM-CSF, protected mice from autoimmunity in models of experimental autoimmune encephalomyelitis (EAE), autoimmune myocarditis and collagen-induced arthritis10, 11, 12, 13.
These observations prompted us to use GM-CSF production as a proxy of the pro-inflammatory potential of primary human memory T lymphocytes. We separated ex vivo-isolated human CD4+ T cells based on their capacity to produce GM-CSF and other inflammatory cytokines and we determined the molecular networks controlling inflammatory cytokine expression in these cells. First, we identified a core gene signature associated with a general, cytokine-producing, pro-inflammatory phenotype of human memory T lymphocytes. Among these genes, we found that the high cytokine-producing phenotype was characterized by the preferential expression of the transcriptional repressor BHLHE40 and by increased NF-κB activation. BHLHE40 limited the expression of ZC3H12D, an RNase of the Regnase-1 family able to degrade inflammatory transcripts14, and of miR-146a, a negative modulator of NF-κB activation15, thereby contributing to the regulation of cytokine expression in T lymphocytes.
Results
The gene expression program of GM-CSF-producing human T lymphocytes
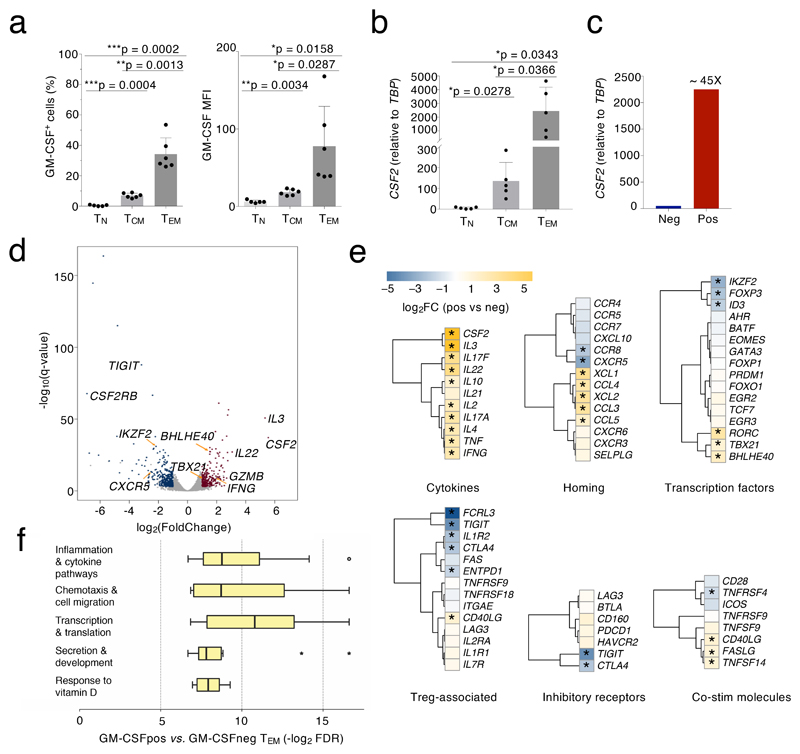
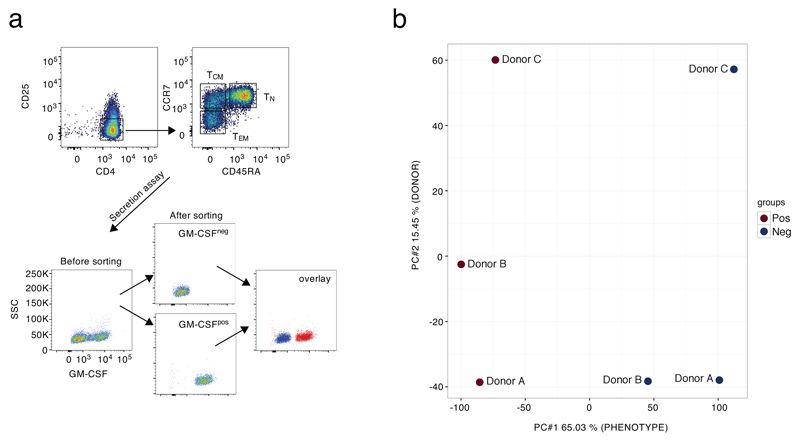
We first measured the expression of GM-CSF in naïve (TN), central memory (TCM) and effector memory (TEM) CD4+ T cells. After stimulation, GM-CSF protein and mRNA expression were highest in TEM, lowest in TN and intermediate in TCM cells (Fig. 1a,b). Since they expressed the highest levels of GM-CSF, TEM cells were further separated by cytokine-secretion assay in two fractions consisting of GM-CSF-expressing (GM-CSF+) and non-expressing (GM-CSF–) cells (Extended Data 1a and Fig. 1c). RNA-sequencing (RNA-seq) was then performed on GM-CSF+ and GM-CSF– cells obtained from 9 healthy donors (pooled in three groups) and 678 differentially expressed genes were identified (Fig. 1d and Suppl. Table 1). Principal component analysis (PCA) confirmed that the major differences between samples were attributed to the cell phenotype, with limited donor-to-donor variability (Extended Data 1b). Analysis of the differentially expressed genes confirmed the enrichment of CSF2 transcripts in the GM-CSF+ population, together with transcripts from the co-regulated IL3 gene (Fig. 1d). Genes encoding activation markers such as CD69, IL2RA, CD44 and FASLG were not differentially expressed, indicating that both the GM-CSF+ and GM-CSF– fractions were stimulated to a similar extent. Expression of co-stimulatory molecules such as CD28 or ICOS did not differ between the two subsets, and no components of the TCR complex were differentially expressed.
Figure 1. Transcriptomic analysis of GM-CSF+ and GM-CSF– cells.
a) Overall levels of GM-CSF expression were determined by intracellular staining in different human T cell subsets (TN, TCM and TEM) freshly isolated from peripheral blood. Both the percentage of positive cells (left) and the MFI (mean fluorescence intensity, right) are shown. Each dot represents one donor (n=6). Mean ± SD; paired t-test, two-tailed. b) Levels of CSF2 mRNA expression were determined in the different T cell subsets by qRT-PCR. Each dot represents one donor (n=5). Mean ± SD; paired t-test, two-tailed. c) TEM cells from n=5 donors were further separated in GM-CSF– and GM-CSF+ by secretion assay and pooled. Levels of CSF2 mRNA expression were determined by qRT-PCR. Data are representative of two independent experiments. Technical replicates are not shown. d) Cells from n=9 independent donors as in c) were separated and analyzed by RNA-seq (3 pools of 3 independent donors each). Volcano plot shows the differentially expressed genes for GM-CSF– vs. GM-CSF+ cells, using the likelihood ratio tests of EdgeR. Blue and red dots indicate genes up-regulated in GM-CSF– and up-regulated in GM-CSF+ cells, respectively (FDR ≤ 0.05 and absolute log2 FC ≥ 1). All other genes are indicated as gray dots. e) Expression of relevant immune-related genes, as determined by RNA-seq in d). The asterisk (*) indicates genes significantly differential expressed in all samples for each condition (absolute Log2FC≥1 FDR≤0.001 TPM≥1). f) FDR q-value distribution of significantly enriched gene sets in GM-CSF+ vs. GM-CSF– TEM cells clustering within specific biological themes. The transcriptional landscape underlying this panel is displayed in Extended Data 3. Each bar describes median, first and third quartiles and maximum and minimum values. Outliers (circles) and extremes (asterisks) are indicated.
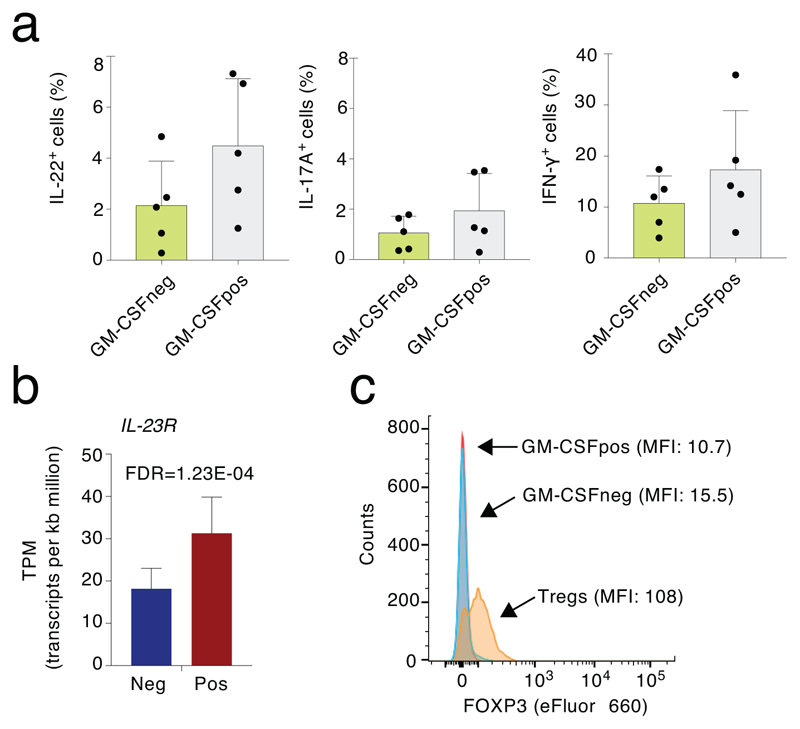
Several genes linked to a high cytokine-producing, pro-inflammatory phenotype were enriched in the GM-CSF+ fraction, including IL22, IFNG and TBX21 (Fig. 1d). When considering functional categories, most transcripts encoding for cytokines and chemokines were enriched in the GM-CSF+ fraction together with the transcripts encoding for the transcription factors (TFs) RORC, TBX21 and BHLHE40 (Fig. 1e). Genes encoding for TH1 markers such as CCR5 and CXCR3 were detectable at similar levels in both populations (Fig. 1e) and at a protein level GM-CSF was often co-expressed with other subset-defining cytokines such as IL-22, IL-17A and IFN-γ (Extended Data 2a). Overall, the GM-CSF+ population did not match a unique T cell subset, but it rather represented a pro-inflammatory population characterized by high cytokine-production. Concordant with this notion, genes encoding for chemokine receptors that are commonly used to define rare human T cell subsets such as CCR6 (TH17) or CCR10 (TH22) were undetectable. In agreement with the requirement of IL-23 for the acquisition of pathogenicity by TH cells and for their ability to express GM-CSF10, 16, the IL23R gene was higher expressed in GM-CSF+ than in GM-CSF– cells (Extended Data 2b).
While GM-CSF+ cells exhibited a high-cytokine producing phenotype, the GM-CSF– fraction was enriched for genes linked to the negative regulation of T cell activation, including IKZF2, FOXP3, TIGIT and CTLA4 (Fig. 1e). However, other genes associated with a regulatory or exhausted phenotype were not differentially expressed (e.g. PDCD1, HAVCR2, LAG3), not expressed at detectable levels (UTS2, CECAM4, NT5A, CD244) or expressed at higher levels in the GM-CSF+ subset (NKG7, ENC1) (Fig. 1e and Suppl. Table 1). This suggests that GM-CSF– cells may represent a subpopulation of TEM subjected to active repression by the preferential expression of inhibitory proteins. Indeed, the expression of some of these inhibitory receptors can be observed on both regulatory T (Treg) cells and activated conventional T cells (e.g. PD-1, LAG-3, TIGIT), although expression on Treg cells is usually higher17. Consistent with this possibility, FOXP3 expression was detectable in Treg cells but not in GM-CSF– cells (Extended Data 2c). Additional genes restraining inflammation and autoimmunity in mice such as BTN2A2 (butyrophilin-2A2, a member of the B7 family of co-stimulatory molecules) were expressed at higher levels in GM-CSF– cells.
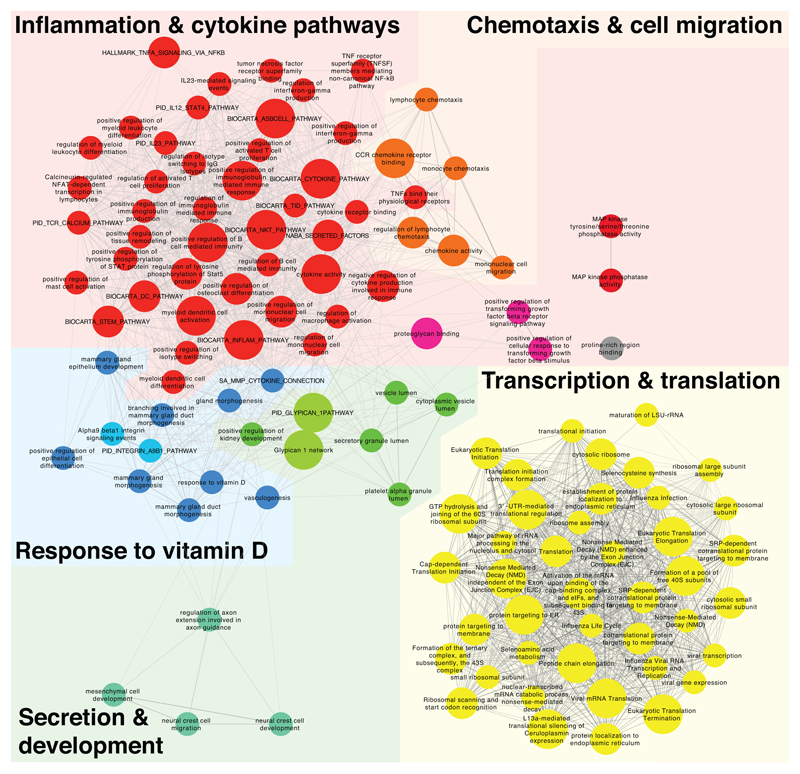
We next identified the biological processes associated with the genes differentially expressed in GM-CSF+ vs. GM-CSF– TEM cells (Fig. 1f and Extended Data 3). Out of 25,127 gene sets analyzed, 119 yielded significant enrichment in GM-CSF+ cells (q <0.01, nom. p-value of < 0.005), pointing to five major biological themes (Fig. 1f and Extended Data 3). Pathways pertaining to inflammation, cytokine production, chemotaxis and cell migration were significantly enriched in GM-CSF+ cells. A cluster including pathways related to transcription and translation suggests increased activity and protein synthesis of GM-CSF+, cytokine-secreting cells. In the remaining cluster, response to vitamin D, containing both the vitamin D receptor gene (VDR) and the 25-Hydroxyvitamin D3 1-alpha-hydroxylase-encoding gene (CYP27B1), was the most significantly enriched gene set (q = 0.0016). Notably, vitamin D deficiency is associated with the risk of developing autoimmune disorders18, 19, suggesting that T cells with high inflammatory cytokine-expressing potential have also intrinsic mechanisms to dampen their activity. Overall, these data suggest that the GM-CSF– T cells represent a population of TEM cells subjected to active repression mechanisms that restrain their inappropriate activation.
BHLHE40 expression correlates with a pro-inflammatory phenotype
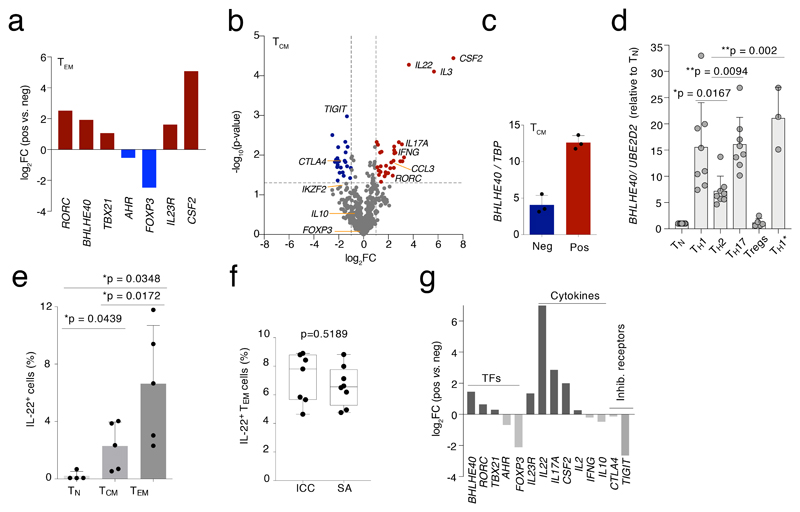
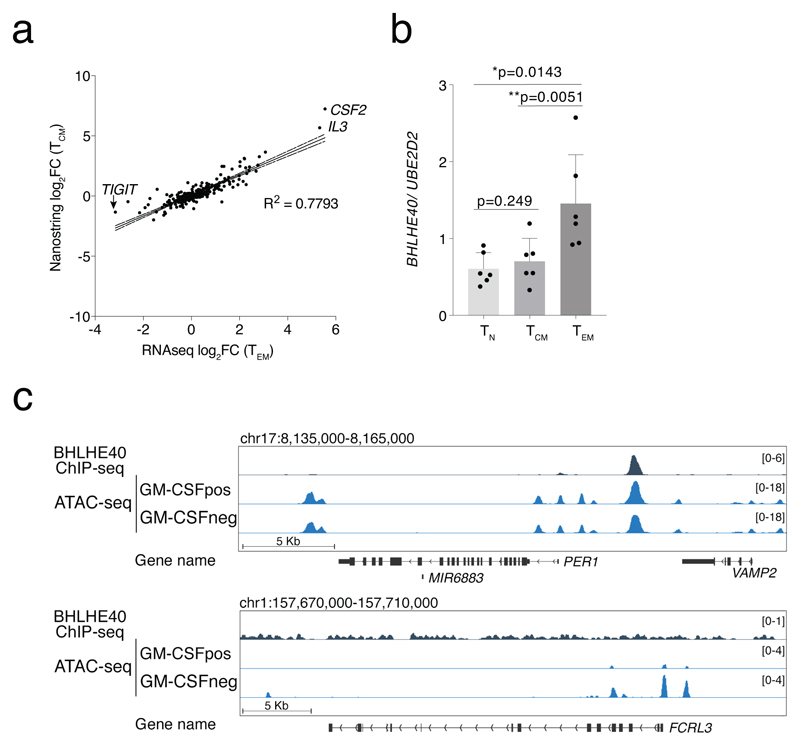
We used qRT-PCR to confirm the differential expression of several TFs and other relevant genes identified by RNA-seq in samples obtained from additional donors (Fig. 2a). RORC, BHLHE40 and TBX21 were the most differentially expressed TF genes in the GM-CSF+ population, while FOXP3 and to a lesser extent AHR were enriched in the GM-CSF– fraction. We then determined whether the identified signature genes were more generally associated with a pro-inflammatory cytokine-producing T cell phenotype and not with features related specifically to TEM cells. We therefore repeated the expression profiling of ~570 immune-related genes using GM-CSF+ and GM-CSF– TCM cells from six independent donors (pooled in 2 groups), analyzed by Nanostring digital counting (Suppl. Table 2). We found a high correlation (R2=0.7793, P<0.0001) between TEM and TCM cells in terms of genes that were differentially expressed in the GM-CSF+ and GM-CSF– subpopulations (Extended Data 4a). Genes encoding for activation markers and co-stimulatory molecules (e.g. IL2RA, CD28, CD40L) were not differentially expressed. The IL2 transcript, which is highly expressed by this memory subset, was also not differentially expressed. As with TEM cells, many cytokine genes, including IL3, IL22, IL17A and IFNG were preferentially expressed by GM-CSF+ cells, while TIGIT and CTLA4 were associated with the GM-CSF– fraction. However, some differentially expressed genes were specific of the TEM phenotype rather than representing general features of cytokine-secreting or non-secreting cells. This latter category included IL10 and FOXP3 (Fig. 2b). Importantly, the BHLHE40 gene was preferentially expressed also by TCM GM-CSF+ cells (Fig. 2c), suggesting a possible function for this transcriptional repressor in regulating the inflammatory cytokine-producing phenotype of T cells. Concordant with this possibility, we found that BHLHE40 was strongly expressed by TH1 and TH17 cells, and especially by the highly pro-inflammatory TH1/17 (also known as TH1*) lymphocyte subset (Fig. 2d)20. BHLHE40 was also expressed at significantly higher levels in TEM cells than TCM cells, correlating with higher effector cytokine production (Extended Data 4b).
Figure 2. A general gene signature linked to a high cytokine-producing phenotype.
a) Selected differentially expressed genes identified by RNA-seq were validated by qRT-PCR on an independent pool of n=3 donors. b) TCM cells from 3 pools of n=2 donors each were separated by GM-CSF secretion assay in GM-CSF+ and GM-CSF– and the expression of immune-relevant genes was determined by Nanostring profiling (t-test, two-tailed). c) Expression of BHLHE40 was determined by qRT-PCR in TCM cells separated by GM-CSF secretion assay. Each dot represents a pool of two individual donors (n=6). d) Expression of BHLHE40 in different effector T cell subsets. Each dot represents one donor (n= at least 3). Mean ± SD; one-way Anova. e) The overall percentage of IL-22-expressing cells was determined by intracellular staining in the different human T cell subsets. Each dot represents one donor (n=5). Mean ± SD; paired t-test, two-tailed. f) Comparison between the percentages of IL-22-expressing cells obtained by intracellular staining (ICC) and cytokine secretion assays (SA) of TEM cells. Each dot represents one donor (n=8). Median with 95% confidence interval, min to max; paired t-test, two-tailed. g) Expression of selected genes was determined by qRT-PCR in TEM cells separated by IL-22 secretion assay. To obtain a sufficient number of cells for RNA extraction and qRT-PCR, n=8 individual donors were pooled after IL-22 secretion assays. Technical replicates are not shown.
We further narrowed down our pro-inflammatory T cell gene signature by excluding genes that might be specifically associated to GM-CSF secretion. Gene expression analyses were repeated using TEM cells separated based on their ability to secrete IL-22. We selected this cytokine because similarly to GM-CSF, and differently for instance from IL-17, it is easily detectable in memory T cells freshly separated from peripheral blood, and it is not expressed at levels that are too high (like IFN-γ) that would thus easily generate false positive results. IL-22-producing cells are contained primarily in the TEM subset (Fig. 2e) and they are not a subset of the more frequent GM-CSF-producing ones, since TEM cells that were either double- (GM-CSF+ and IL-22+) or single-producers (either GM-CSF+ or IL-22+) were observed (Extended Data 2a). Despite the low fraction of IL-22-producing cells, we retrieved similar percentages by secretion assay and intracellular cytokine staining (Fig. 2f). At mRNA level, the IL-22+ population expressed the IL22 transcript >120-times higher compared to the IL-22– population (Fig. 2g). By analyzing the expression of selected genes in IL-22+ and IL-22– cells, we retrieved many genes already identified as associated with the GM-CSF+ phenotype, indicating that these genes can be considered as a general signature defining cytokine-producing memory T cells. This included the core signature genes IL22, CSF2, IL17A and IL23R. Most importantly, BHLHE40 was the predominant differentially expressed TF gene, followed by RORC and TBX21 (Fig. 2g). Overall, these data show a strong correlation between BHLHE40 expression and high inflammatory potential of human T lymphocytes.
Identification of BHLHE40 as a regulator of gene expression in human T lymphocytes
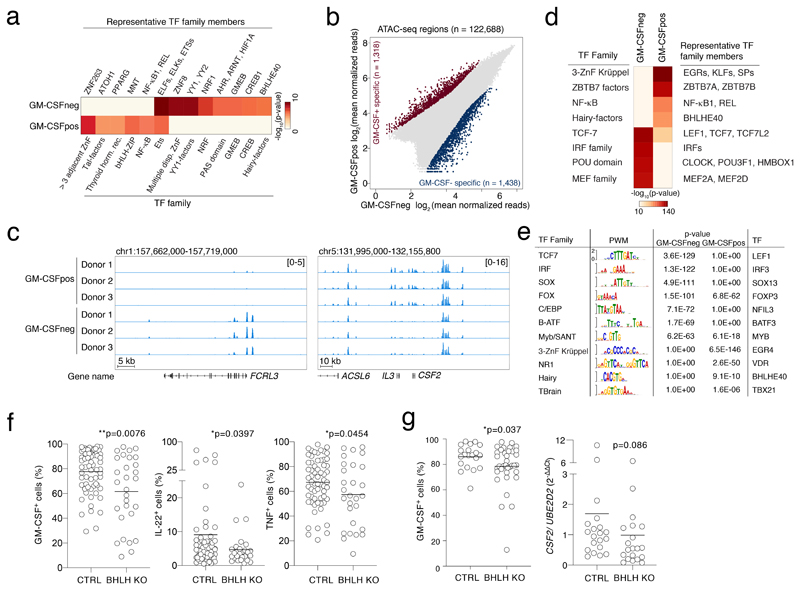
To identify TFs regulating the genes distinctive of the GM-CSF+ and the GM-CSF– populations, we identified over- or under-represented TF consensus DNA-binding motifs in the regions surrounding the transcription start sites (TSSs, from -450 bp to +50 bp) of the differentially expressed genes (Suppl. Table 3). NF-κB binding sites were enriched upstream of the genes more highly expressed in the GM-CSF+ population (Fig. 3a). Consistent with a repressive activity of BHLHE40, its transcript was highly expressed by GM-CSF+ and IL-22+ cells (Fig. 2), but its binding sites were instead enriched upstream of genes preferentially expressed in the GM-CSF– population. These data suggest that BHLHE40 expression in GM-CSF+ T cells may contribute to the repression of genes preferentially expressed in GM-CSF– cells.
Figure 3. Identification of TFs regulating the inflammatory cytokine-producing phenotype.
a) PSCAN analysis on the promoter regions (-450 to +50 bp relative to the TSS) of genes identified as differentially expressed by RNA-seq in GM-CSF+ or GM-CSF– cells. Selected factors are shown. The entire list of binding factors is provided in Suppl. Table 3. b) Scatterplot of ATAC-seq regions (n=3 independent donors). Blue and red dots indicate statistically significant accessible genomic regions (FDR < 0.01) that differ between GM-CSF+ and GM-CSF– T cells, with absolute log2 FC ≥ 1, as determined by DiffBind using DESeq2. All other peaks are indicated as grey dots. c) Snapshots of ATAC-seq tracks for representative and relevant genes in the different donors. d) TF motif analysis in ATAC-seq regions specific of GM-CSF+ and GM-CSF– T cells. e) TF binding site representation at accessible genomic sites identified by ATAC-seq in GM-CSF+ and GM-CSF– T cells. Significance was determined by a two-tailed Welch's t-test using Pscan. The right column shows TFs that are also differentially expressed in GM-CSF+ (SOX13, NFIL3, BATF3, VDR, BHLHE40, TBX21) and GM-CSF– cells (all other factors). f) Primary human memory T lymphocytes were transfected with ribonucleoparticles of Cas9 and gRNAs against exon 1/2 and exon 5 of BHLHE40. After single cell cloning and expansion, individual clones were tested for the presence of the deletion by PCR. Mean; Welch’s or unpaired (TNF) t-test, two-tailed. Each dot represents one clone (n=at least 28). g) Same as e) except that gRNAs against exon 1 and exon 2 of BHLHE40 were used. N=36 clones from two independent human donors were selected for GM-CSF intracellular staining and CSF2 expression. Mean; unpaired t-test with Welch’s or Mann-Whitney correction, two-tailed. Each dot represents one clone.
To obtain a broader view of the genomic regulatory landscape of GM-CSF+ and GM-CSF– T cells, we performed ATAC-seq experiments in primary TEM cells separated by GM-CSF secretion assay. We detected >100,000 peaks per sample, with 1,438 regions being specific for GM-CSF–cells and 1,318 for GM-CSF+ cells (FDR<0.01 and log2FC>1) (Fig. 3b). First, we confirmed the correlation between ATAC-seq peaks and differential expression of adjacent gene(s). For instance, the locus containing the CSF2 and IL3 genes showed differential ATAC-seq peaks that were specifically detected in the GM-CSF+ cells (Fig. 3c); the FCRL3 locus was instead selectively accessible in GM-CSF– cells (Fig. 3c and Extended Data 4c).
The analysis of the TF motifs underlying the ATAC-seq peaks confirmed the enrichment of NF-κB motifs in the comparison of GM-CSF+ vs. GM-CSF– specific peaks (Fig. 3d and Suppl. Table 4). GM-CSF+ peaks were also significantly enriched for BHLHE40 sites, suggesting that BHLHE40 may bind and induce repression of genomic regulatory elements in GM-CSF+ T cell. However, the magnitude of the over-representation was relatively lower, indicating that BHLHE40 sites selectively accessible in GM-CSF+ T cells were in limited number. ATAC-seq peaks specific of GM-CSF– T cells showed instead a strong over-representation of cognate motifs for Interferon Regulatory Factor (IRF) family members (Fig. 3d), including those in the proximity of some negative regulators of T cell activation such as TIGIT and FCRL3. Specifically, 887/1,438 (61.6%) ATAC-seq regions selective for GM-CSF– T cells contained high-affinity IRF sites (Suppl. Table 5). To identify TFs modulating the inflammatory phenotype of memory T lymphocytes, we integrated the motif analysis on ATAC-seq data with expression data for TF families matching over/under represented TF motifs. A few TF motifs significantly enriched in the GM-CSF+ or GM-CSF– ATAC data, matched TFs differentially expressed in the same population (Suppl. Table 4). Among these, we found that increased expression of BHLHE40, TBX21 and VDR in the GM-CSF+ cells was associated with increased accessibility of their binding sites, pointing towards a relevant role for these factors in favoring (TBX21) or restraining (VDR) the inflammatory phenotype of these cells (Fig. 3e). The GM-CSF– cells showed instead higher expression of FOXP3 and IRF3, which were associated with increased accessibility of their binding sites specifically in these cells.
BHLHE40 (SHARP-2, STRA13, DEC1) is a basic helix-loop-helix (bHLH) TF reported to regulate immune cell functions. In the mouse, Bhlhe40 expression was associated with a pathogenic T cell signature and it was shown to identify the cytokine-producing fraction of autoreactive T cells21. Bhlhe40 deletion increased resistance to EAE induction and diminished expression of GM-CSF, IFN-γ, IL-2 but also IL-4, while expression of IL-10 was increased21, 22, 23, 24, 25, 26. However, the initial description of the Bhlhe40-/- phenotype revealed development of autoimmune disease in aging animals, with the accumulation of spontaneously activated lymphocytes22, linked to reduced Treg cell numbers27.
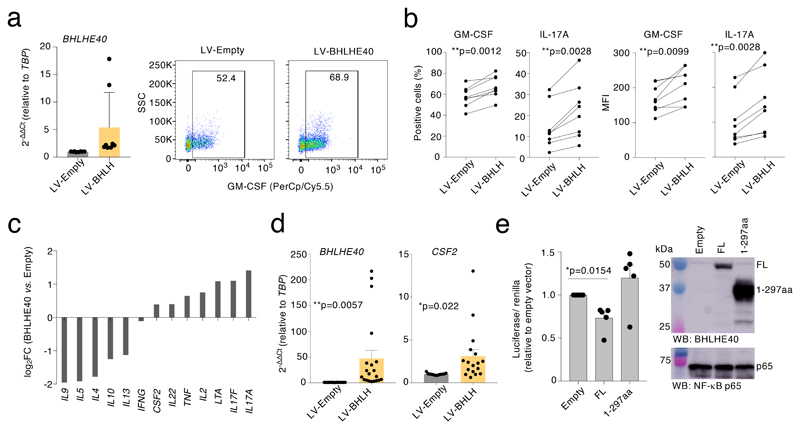
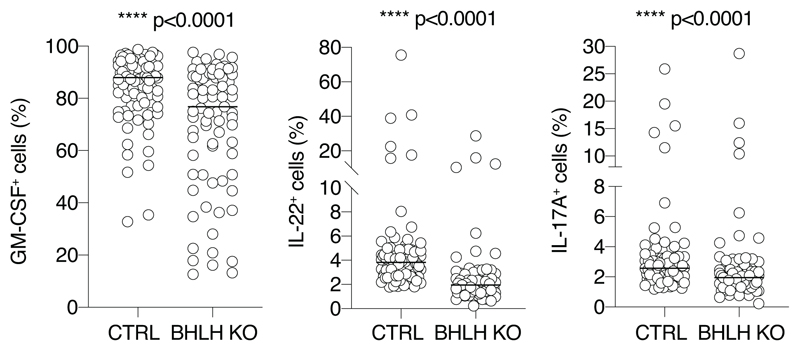
To assess the functional role of BHLHE40 in primary human T lymphocytes, we performed CRISPR-Cas9-mediated deletion of BHLHE40. After optimizing screening methods28 (Extended Data 5), we transfected primary memory human T lymphocytes with Cas9 ribonucleoparticles against BHLHE40, and performed single-cell cloning29, 30. We next measured GM-CSF expression by intracellular staining, comparing control clones to clones that showed deletions in the BHLHE40 locus between exon 1/2 and exon 5 (locations of the sgRNAs), as determined by PCR (hereafter, ‘BHLHE40-KO’ clones). In both BHLHE40-KO and control clones, GM-CSF expression became detectable in most cells due to the extensive proliferation and high IL-2 concentration required for cloning5. Despite this limitation and the high gene expression variability of human T cell clones, we measured a significant reduction in GM-CSF expression in BHLHE40-KO clones compared to controls (Fig. 3f). A significant reduction was also observed for other inflammatory cytokines (Extended Data 6). Reduced GM-CSF protein and mRNA expression was observed in additional clones generated with a smaller BHLHE40 deletion (Fig. 3g). Consistent with these results, lentivirus (LV)-mediated expression of BHLHE40 in primary lymphocytes (Fig. 4a) increased GM-CSF- and IL-17A expression (Fig. 4b). Analysis of cytokine mRNA expression by Nanostring profiling in primary memory T lymphocytes transduced to express BHLHE40, revealed a shift towards an inflammatory TH17 GM-CSF+ phenotype (Fig. 4c and Suppl. Table 6). CSF2 mRNA expression was also observed in Jurkat T cells stably expressing BHLHE40 (Fig. 4d). BHLHE40 can influence gene transcription either through direct DNA binding or by competing with other E-box-binding factors31, 32. We therefore assessed whether BHLHE40 impacted expression of a luciferase reporter gene with four BHLHE40 consensus binding sites upstream of a minimal promoter. BHLHE40 repressed reporter gene expression (Fig. 4e), while a C-terminal truncated version (BHLHE40 1-297aa) retaining DNA-binding activity and acting in a dominant-negative manner 31, 33, 34, was devoid of effects. These data confirm a role for BHLHE40 in regulating the pro-inflammatory phenotype of human memory T lymphocytes, most likely acting as a transcription repressor.
Figure 4. BHLHE40 affects inflammatory cytokine production in human memory T cells.
a) Freshly isolated memory T lymphocytes were activated with plate-bound anti-CD3 and anti-CD28 antibodies for 48 h prior to lentiviral transduction with either an empty vector or a BHLHE40 expression vector (LV-BHLH). Transduced cells were selected with puromycin, and further expanded for 10-12 days in the presence of IL-2. Expression of BHLHE40 was measured by qRT-PCR (left, mean± SD) and GM-CSF production by intracellular staining (right). Each dot represents one individual experiment (n=8). The FACS plot on the right is representative of n=8 independent experiments. b) Percentage (left) and mean fluorescence intensity (MFI, right) of GM-CSF- and IL-17A-expressing cells in samples as in a). Each dot pair represents one individual human donor (n=8). Paired t-test, two-tailed. c) Memory CD4+ T lymphocytes from three independent donors were transduced with either an empty lenti-vector or a BHLHE40 expression vector. After puromycin selection, cells were expanded in the presence of IL-2 for a few days, stimulated with PMA and ionomycin for three hours and gene expression analysis was performed with a Nanostring Sprint profiler. d) Jurkat T cells were transduced with lentiviral vectors and selected as in c), prior to measurement of BHLHE40 and CSF2 expression by qRT-PCR. Each dot represents one individual experiment (n=17). Mean ± SEM; unpaired t-test, two-tailed. e) HEK293 cells were transiently transfected with a luciferase reporter vector containing four consensus binding sites for BHLHE40. Cells were also co-transfected with either full-length (FL) human BHLHE40 or a truncated version (amino acids 1-297) lacking the C-terminal region. The graph on the left shows the results of n=5 independent experiments (mean ± SEM; paired t-test, two-tailed), while the immunoblot on the right shows expression of BHLHE40 in these samples (representative of n=at least 2 independent experiments).
Basal NF-κB activation in GM-CSF+ T lymphocytes
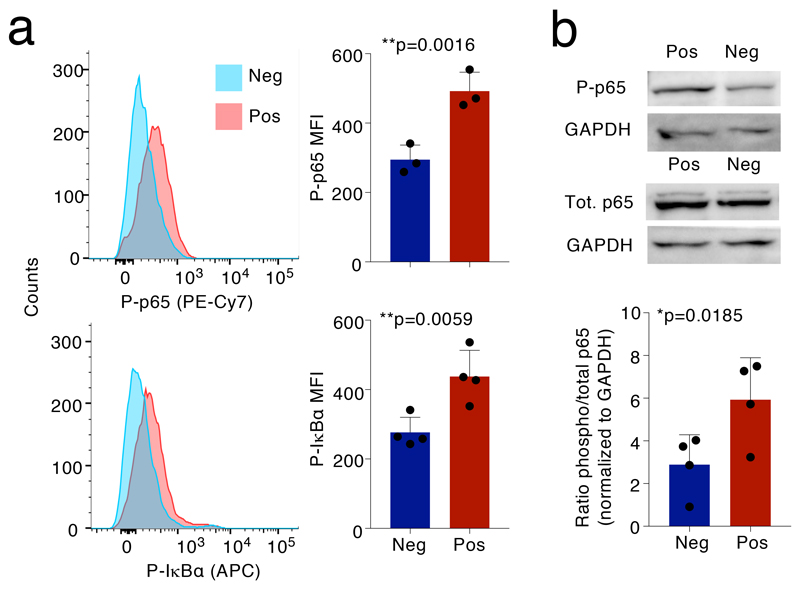
The NF-κB motif was over-represented in the promoter regions of genes differentially expressed in the GM-CSF+ population. The transcripts encoding NF-κB family members were instead expressed at comparable levels in both populations, which is consistent with post-transcriptional NF-κB activation. We therefore measured NF-κB activation in GM-CSF+ and GM-CSF– T cells using as readouts the phosphorylation of p65/RELA at Ser529 and of IκBα at Ser32/36. Phosphorylation of p65 was shown to be significantly increased in lymphocytes from MS patients (which also showed increased GM-CSF production)35. We found that phosphorylation of NF-κB p65 and IκBα were significantly higher in GM-CSF+ compared to GM-CSF– lymphocytes (Fig. 5a). A significant difference in NF-κB p65 phosphorylation was confirmed by immunoblot (Fig. 5b). Overall, the combination of enhanced BHLHE40 expression and increased NF-κB activation may regulate the pro-inflammatory phenotype of human T lymphocytes.
Figure 5. Phosphorylation of NF-κB p65 in GM-CSF+ and GM-CSF– T cells.
a) TEM cells were separated by GM-CSF secretion assay and sorting and left resting for 48h, followed by intracellular staining for phospho-p65 and phospho-IκBα. Left: one representative experiment; right: results of n=3 independent experiments. Each dot represents one donor (n=3). Mean ± SD; paired t-test, two-tailed. b) Cells were treated exactly as in a) except that phosphorylation of p65 was determined by immunoblot. Each dot represents one donor (n=4). Mean ± SD; paired t-test, two-tailed. The blot image is representative of n=4 independent experiments, quantified in the histogram below.
BHLHE40 expression and NF-κB activation converge on the regulation of miR-146a expression
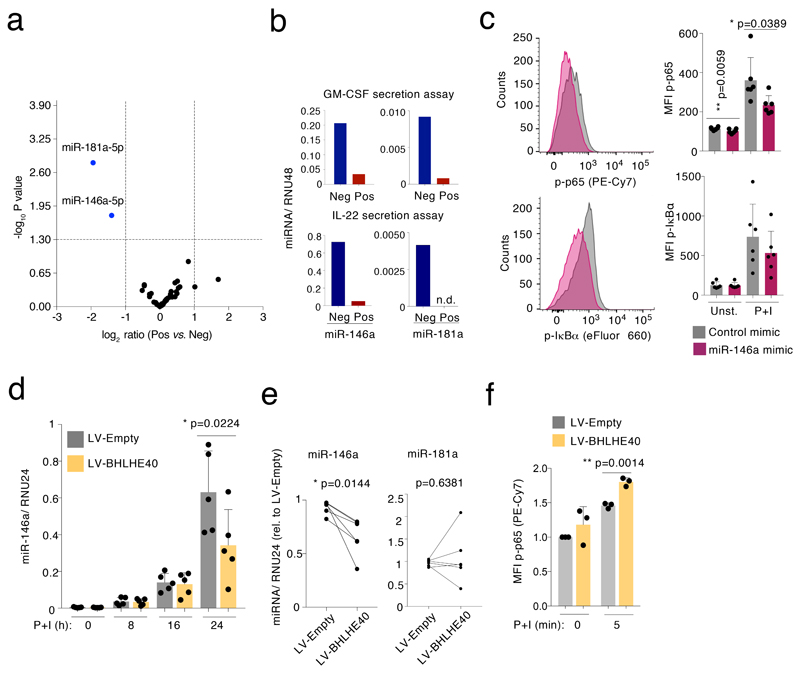
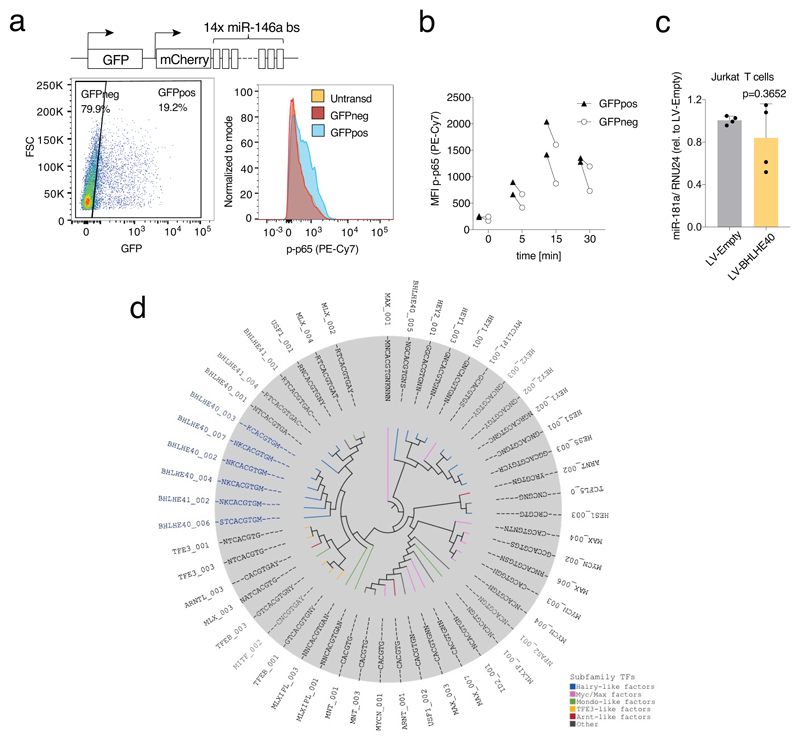
To understand the molecular mechanisms that regulate the pro-inflammatory T cell phenotype with elevated cytokine production, we analyzed global miRNA expression in GM-CSF+ and GM-CSF– TEM cells by Nanostring profiling. We found very little differences in miRNA expression when subdividing TEM cells based on their ability to secrete GM-CSF, with only two miRNAs, miR-181a and miR-146a, being enriched in the GM-CSF– population (Fig. 6a and Suppl. Table 7). Increased miR-146a and miR-181a expression was also observed in IL-22– TEM cells (Fig. 6b). The differential expression of these miRNAs in the cytokine-negative fraction suggested that they might contribute to maintain this population in a repressed, less inflammatory state. We focused on miR-146a, an established negative regulator of NF-κB activation15. To determine whether miR-146a influences NF-κB activation in primary human T lymphocytes, we transfected freshly isolated memory T cells with either a miR-146a mimic or a control oligonucleotide. After two days, cells were stimulated with PMA and ionomycin for 5 minutes, followed by intracellular staining for the phosphorylated forms of NF-κB p65 and IκBα. The miR-146a mimic significantly reduced NF-κB p65 phosphorylation, and a similar trend was also observed for IκBα (Fig. 6c). Concordant with these results, transduction of primary human T lymphocytes with a miRNA sponge to sequester miR-146a and reduce its activity, led to increased p65 phosphorylation (Extended Data 7a-b).
Figure 6. miR-146a expression is regulated by BHLHE40 and inhibits NF-κB p65 phosphorylation.
a) TEM cells from n=6 independent donors were separated by GM-CSF secretion assay and FACS sorting, followed by RNA extraction and global miRNA analysis using Nanostring profiling (t-test, two-tailed). b) TEM cells were separated by either GM-CSF (top) or IL-22 (bottom) secretion assays, and miRNA expression was measured by qRT-PCR. To obtain a sufficient number of cells for RNA extraction and qRT-PCR, n=3 donors were pooled after the GM-CSF secretion assays and n=8 independent donors were pooled after the IL-22 secretion assay. Technical replicates are not shown. n.d.: not detectable. c) Memory T lymphocytes were separated from peripheral blood and transiently transfected with miR-146a mimic or control oligonucleotides. After two days of culture, cells were stimulated for 5 min with PMA and ionomycin and phosphorylation of NF-κB p65 and IκBα was determined by intracellular staining (representative of n=6 experiments). Each dot represents one individual donor (n=6). Mean ± SD; paired t-test, two-tailed. d) Jurkat T cells were stably transduced with a lentivirus to express BHLHE40. Cells were then stimulated with PMA and ionomycin for the indicated times prior to RNA extraction and measurement of miR-146a induction. Each dot represents one individual experiment (n=5). Mean ± SD; paired t-test, two-tailed. e) Primary memory T lymphocytes were transduced with a BHLHE40-expressing lentivirus. After selection and expansion of the transduced cells, expression of miR-146a and miR-181a was measured by qRT-PCR. Each dot pair represents one individual human donor (n=5). Paired t-test, two-tailed. f) Primary memory T lymphocytes were stably transduced with the indicated lentiviral vectors. After selection, cells were stimulated for 5 min with PMA and ionomycin, and NF-κB p65 phosphorylation was measured by intracellular staining. Mean ± SD; paired t-test, two-tailed; each dot represents one independent experiment (n=3).
Since BHLHE40 was differentially expressed between cytokine-producing and non-producing cells, and it was also involved in the regulation of cytokine expression, we asked whether it could contribute to the observed differential expression of miR-146a. We stably expressed BHLHE40 in Jurkat T cells by lentiviral transduction, followed by stimulation to induce miR-146a expression36. BHLHE40 expression significantly reduced miR-146a induction compared to the control (Fig. 6d). Similar results were obtained in primary T lymphocytes (Fig. 6e). This was not the case for miR-181a, whose regulation in this context remains to be understood (Fig. 6e and Extended Data 7c). Consistent with these results, phosphorylation of NF-κB p65 in primary T cells overexpressing BHLHE40 was significantly, albeit modestly increased (Fig. 6f). Overall, miR-146a regulates NF-κB activation in primary human T lymphocytes, and its increased expression in cytokine-negative cells is likely to maintain NF-κB p65 phosphorylation at lower basal levels compared to cytokine-positive cells.
BHLHE40 binding sites reveal high genomic specificity
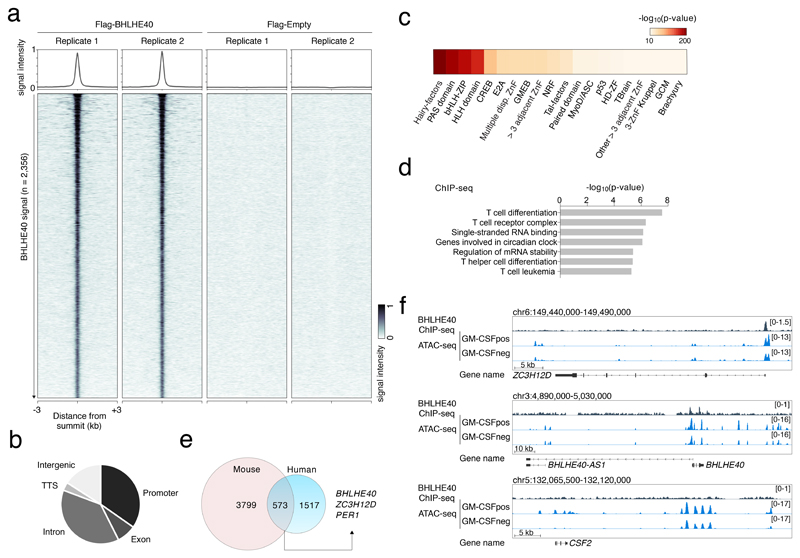
We set out to identify genes bound by BHLHE40. Since commercially available antibodies did not generate robust results in human T cells, we stably transduced Jurkat T cells to express Flag-tagged BHLHE40 and we carried out ChIP-seq using an anti-flag antibody (Fig. 7a). Many of the 2,356 ChIP-seq peaks were at promoter regions (Fig. 7b), highlighting the possibility of direct transcriptional regulation of the associated genes. A motif analysis recovered with the highest significance the E-box, namely the consensus sequence for bHLH (including Hairy-related) TFs (Fig. 7c); moreover, the most enriched E-box motif was the variant specifically recognized by BHLHE40 (Extended Data 7d and Suppl. Table 8). The high specificity of BHLHE40 recruitment to this variant motif appears to be linked to the presence of a highly-conserved K (T or G) base 5′ of the CACGTG core sequence and an M (C or A) base 3′ of it.
Figure 7. ChIP-seq of BHLHE40 identifies specific binding loci in the human genome.
a) Jurkat T cells were stably transduced to express Flag-tagged BHLHE40 or with a Flag empty vector. After crosslinking, chromatin was immunoprecipitated with an anti-Flag antibody and sequenced. Shown are the sequencing results of two independent transductions. Peak calling was performed independently for each biological replicate (n=2) using macs2 (FDR ≤ 0.05 and FE > 4), obtaining 2’356 consistent peaks showing an overlap of at least 50% of their length. b) Genomic distribution of the identified BHLHE40 ChIP-seq peaks in different genomic features. TTS: transcription termination site. c) Analysis of TF motifs enrichment. Local enrichment p-value with a two-tailed t distribution was calculated by PscanChIP using a window of 150bp centered on the summit of 2,356 peaks. d) GREAT analysis on the identified set of ChIP-seq peaks. The bar-plot show the -log10 of the p-values obtained by a binomial enrichment test. e) Overlap between our ChIP-seq dataset and the mouse Bhlhe40 ChIP-seq in TH1 cells from Ref.25. f) Snapshots of ChIP-seq and ATAC-seq tracks for representative genes. BHLHE40 transcription overlaps with an antisense transcript (BHLHE40-AS1).
The functional analysis of the genes associated with the genomic regions bound by BHLHE40 revealed categories relevant to the biology of this factor, including those related to T cell differentiation and circadian clock (Fig. 7d and Suppl. Table 8), with the latter category including the clock gene PER1. Concordant with previous work24, 25, we could not detect any binding of BHLHE40 in the proximity of most cytokine genes, including CSF2. A direct regulation of cytokine expression appears therefore unlikely. Similar to the CSF2 gene, the effect of BHLHE40 on miR-146a expression appears to be indirect, since no significant binding could be detected in the proximity of the miR-146a locus. Other significant functional categories included “regulation of mRNA stability” and “single-stranded RNA binding”. This result drew our attention to one of the genes containing a prominent BHLHE40 peak, namely that encoding for ZC3H12D, an RNase belonging to the same family of Regnase-1 (ZC3H12A), a negative regulator of inflammation which acts through the degradation of inflammatory gene transcripts37.
To investigate the relevance of BHLHE40 binding at ZC3H12D and other loci, we intersected the list of differentially expressed genes in GM-CSF+ vs. GM-CSF– cells with ChIP-seq data (Suppl. Table 8). 118 genes downregulated in the GM-CSF+ cells were bound by BHLHE40 (including ZC3H12D), suggesting direct repression. Conversely, only 51 upregulated genes were also bound by BHLHE40. By comparing our ChIP-seq data with published Bhlhe40 ChIP-seq data25 from mouse Th1 cells, we found that 573 genes were retrieved in both datasets (Fig. 7e). Regions identified as bound by BHLHE40 in both datasets included those associated with PER1, BHLHE40 and most importantly ZC3H12D, suggesting conservation of regulatory networks.
The overall pattern of accessibility at regions bound by BHLHE40 was not dramatically different in GM-CSF+ vs. GM-CSF– cells, as determined by ATAC-seq in primary human T lymphocytes. Specifically, only a small number of differentially accessible regions matched BHLHE40 ChIP-seq peak within a window of 150bp, while 1,880 BHLHE40 bound peaks were accessible in both GM-CSF+ and GM-CSF– cells. Interestingly, an ATAC-seq peak corresponding to BHLHE40 binding was observed in the ZC3H12D promoter region (Fig. 7f). These observations suggest that functional BHLHE40 sites are contained within regions that are accessible in both GM-CSF+ and GM-CSF– cells and can be thus considered as poised negative regulatory elements whose final output ultimately depends on BHLHE40 expression and binding.
ZC3H12D is negatively regulated by BHLHE40
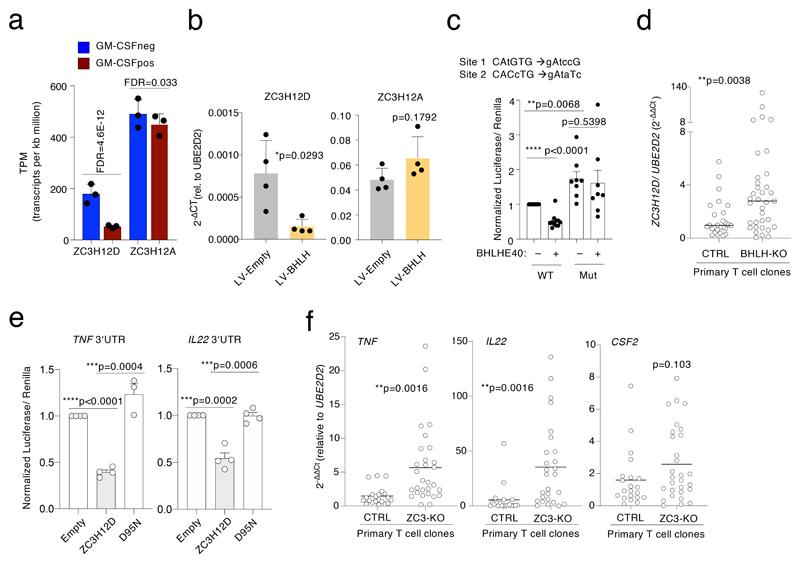
Next, we investigated the regulation of ZC3H12D by BHLHE40. Both ZC3H12A and ZC3H12D induce the degradation and turnover of mRNAs involved in inflammation14, 38. Deficiency of ZC3H12D in mice led to increased stability of cytokine mRNAs, increased levels of IL-17A and severe paralysis in EAE models, highlighting a role in modulating the pro-inflammatory phenotype of T lymphocytes39. Consistent with a negative regulation by BHLHE40, ZC3H12D (but not ZC3H12A) was differentially expressed in GM-CSF– cells (Fig. 8a); moreover, Jurkat T cells stably expressing BHLHE40 showed reduced expression of ZC3H12D but not of ZC3H12A (Fig. 8b). We next determined whether BHLHE40 had a direct effect on ZC3H12D transcription by luciferase reporter assays using a region of the ZC3H12D promoter (from -285 to +349 relative to the TSS) corresponding to both the ChIP-seq and the ATAC-seq peaks shown in Fig. 7f. BHLHE40 expression reduced the luciferase activity of plasmids containing the wild-type ZC3H12D promoter, but not that of a promoter containing mutated BHLHE40 binding sites (Fig. 8c). Luciferase expression from the mutated plasmid was also significantly higher than that from the wild-type construct in cells not over-expressing BHLHE40, possibly because of the inability of endogenous BHLHE40 to bind and repress.
Figure 8. Direct regulation of ZC3H12D by BHLHE40 and effect on inflammatory cytokine expression in human T lymphocytes.
a) Expression of ZC3H12D and ZC3H12A in GM-CSF+ and GM-CSF– TEM cells, as determined by RNA-seq. Mean ± SD. b) Jurkat T cells were transduced to stably express BLHLE40, and expression of ZC3H12D and ZC3H12A was determined by qRT-PCR. Mean ± SD; paired t-test, two-tailed; each dot represents one independent experiment (n=4). c) The -285 to +349 region surrounding the ZC3H12D TSS was cloned in a luciferase reporter vector, with or without the indicated mutations in two BHLHE40 binding sites. Luciferase activity was determined upon co-transfection of HEK293 cells of the reporter vector with either a BHLHE40 expressing vector or an empty control. Mean ± SEM; paired t-test, two-tailed; each dot represents one independent experiment (n=8). d) Primary BHLHE40-KO clones (generated from 3 independent human donors) and controls were stimulated for 3h with PMA and ionomycin prior to RNA extraction and analysis of ZC3H12D expression by qRT-PCR. Median; each dot represents one clone (n=at least 26). Mann-Whitney test. e) The 3’UTR of the TNF and IL22 genes was cloned downstream the luciferase gene in the pmirGLO vector. Luciferase activity was determined upon co-transfection of HEK293 cells of the reporter vector with a ZC3H12D expressing vector, either wild-type of mutated to abrogate RNase activity (D95N). Mean ± SEM; unpaired t-test, two-tailed; each dot represents one independent experiment (n=at least 3). f) Primary human memory T lymphocytes (from two independent donors) were transfected with ribonucleoparticles of Cas9 and 2 gRNAs against ZC3H12D. After single cell cloning and expansion, individual clones were tested for the presence of indels in the ZC3H12D locus by mismatch cleavage assay. The clones were stimulated with PMA and ionomycin for 3 h prior to RNA extraction and analysis of cytokine mRNA expression by qRT-PCR. Mean; unpaired t-test, two-tailed. Each dot represents one clone (n=at least 21).
Finally, using the knock-out clones described above, we found that BHLHE40 gene loss increased ZC3H12D expression (Fig. 8d). These data therefore suggest that BHLHE40 modulates the pro-inflammatory phenotype of primary human memory T lymphocytes, at least in part through the direct repression of anti-inflammatory genes such as ZC3H12D.
ZC3H12D is a negative regulator of cytokine expression
To further investigate to what extent ZC3H12D acts as an anti-inflammatory regulator, we first performed luciferase reporter assays to determine the impact of ZC3H12D on the 3′UTR of inflammatory cytokines mRNAs, cloned downstream a luciferase reporter gene. Expression of ZC3H12D, but not of a mutant version lacking RNase activity (D95N)14 significantly reduced luciferase expression in constructs containing the TNF and IL22 3′UTR (Fig. 8e). Next, we used CRISPR-Cas9 and single-cell cloning to delete ZC3H12D in primary human memory CD4+ T lymphocytes. We selected clones (from two independent donors) that showed a high percentage of indels at mismatch cleavage assay (Extended Data 5), and we measured cytokine mRNA expression. The expression of TNF and IL22 was strongly and significantly increased in absence of ZC3H12D (Fig. 8f). The expression of CSF2 was also increased, although cultured T cell clones acquire spontaneously the ability to produce very high amounts of this cytokine (Fig. 3f-g), making it more difficult to detect further changes.
Altogether, our data revealed that the highly inflammatory, cytokine-producing phenotype of primary human T lymphocytes is mechanistically regulated by a module comprising miR-146a, the RNase ZC3H12D and the TFs NF-κB and BHLHE40 (Extended Data 8).
Discussion
Here, we identified a regulatory module composed of the TFs BHLHE40 and NF-κB, the miRNA miR-146a and the RNAse ZC3H12D that contributes to balance the pro-inflammatory potential of human memory T lymphocytes.
In our experiments, the transcripts encoding BHLHE40, RORγt and T-BET were systematically and reproducibly part of a T lymphocyte pro-inflammatory signature. These factors are involved in autoimmune diseases, in some cases partially independently of the cytokines they primarily regulate. For example, loss of T-BET, the master TF of IFN-γ-producing TH1 cells, was shown to render mice more resistant to EAE, although loss of IFN-γ or its receptor left mice susceptible to autoimmunity40, 41. In general, lineage-determining TFs are often co-expressed either stably or transiently and work in a collaborative fashion, thus leading to a variety of outcomes and distinct T cell phenotypes42. For instance, murine invariant natural killer (iNKT) cells deficient for Bhlhe40 were significantly impaired in their ability to produce IFN-γ, but no direct effect of this TF was observed on the Ifng promoter. In this context, Bhlhe40 acted instead as a cofactor, physically interacting with and enhancing T-bet activity43. Interestingly, a subset of TH1-like T cells defined by BHLHE40 expression was recently found expanded in samples of colorectal cancer from patients with microsatellite-instability, who display favorable responses to treatment with immune checkpoint inhibitors44. These data underline how this TF may be indeed involved in ‘tipping the balance’ of T cell responses, from beneficial for cancer immune therapy to potentially pathogenic in autoimmunity.
Adding to the complexity in fully understanding the mechanisms underpinning TF functionality, several TFs pivotal for immune functions possess both activating and repressive functions on gene expression in T lymphocytes, with different mechanisms of action. For example, PU.1 regulates gene expression early during T cell development not only by recruiting partner TFs to its own binding site, but also by depleting them from distant binding sites that they would otherwise occupy in the absence of PU.145. Similarly, T-BET employs different strategies to repress transcription of genes belonging to lineage decisions different to that of TH1 cells46. While we still do not fully understand how BHLHE40 exerts its transcriptional effects, we can envision the possible cooperation as well as competition with other partners, depending on the relative concentration of each factor and binding affinity. These effects may also be direct as well as indirect, depending on the DNA binding site and its context. For example, even though Bhlhe40 was shown to regulate IL-10 expression in response to infection, and even to bind to the Il10 locus in the mouse, it remains unclear whether Bhlhe40 exerts its transcriptional effects on this locus directly25, 26. Indeed, Bhlhe40 binds the mouse Il10 locus in a likely regulatory region downstream of the 3′-end of the gene, and not at its promoter25. Similar secondary effects on gene expression may also include the control of miR-146a expression.
Given the complexity in fully understanding the mechanism of action of BHLHE40, it is likely that this TF may belong to a functional category of regulators of transcription that requires accessible chromatin, a specific DNA sequence, and also interaction with additional cofactors that drive selectivity and final functional outcome. Overall, our work identified a molecular module involved in regulating the highly cytokine-producing, pro-inflammatory and potentially pathogenic phenotype of primary human CD4+ memory T lymphocytes, pointing towards specific TFs and miRNAs that may be dysregulated during disease.
Methods
Primary human T cell isolation and culture
Blood from healthy donors was obtained from the Swiss Blood Donation Center of Basel and Lugano (Switzerland), with informed consent from the Swiss Red Cross and authorization number CE 3428 from the Comitato Etico Canton Ticino. CD4+ T cells were separated by gradient centrifugation (Ficoll-Paque Plus; GE Healthcare), followed by positive selection using magnetic microbeads (Miltenyi Biotec). T cell subsets were then sorted using a FACSaria (BD Bioscience) based on the expression of the following surface markers: naïve T cells: CD4+CD25–CD45RA+CCR7+; total memory T cells: CD4+CD25–CD45RA–CCR7+/–; TCM: CD4+CD25–CD45RA–CCR7+; TEM: CD4+CD25–CD45RA–CCR7–. Other T cell subsets were separated as follows: TH1: CD4+CD25–CD45RA–CXCR3+CCR4– CCR6–; TH2: CD4+CD25–CD45RA–CXCR3–CCR4+CCR6–; TH17: CD4+CD25–CD45RA–CXCR3–CCR4+CCR6+; TH1*: CD4+CD25–CD45RA–CXCR3+CCR4+CCR6+; Treg: CD4+CD25hiCD127lo. When needed, sorted T cell subsets were cultured in RPMI-1640 medium supplemented with 5% human serum, 1% non-essential amino acids, 1%, sodium pyruvate, 1% glutamine, penicillin, streptomycin and 50 μM β-mercaptoethanol (complete medium). T lymphocytes were stimulated in NUNC™ 96-well plates (Thermo Fisher) using plate-bound anti-CD3 (clone TR66, recombinant, made in house) and anti-CD28 (1 μg/ml). In cases of extended cultures, recombinant IL-2 (50 U/ml) was added starting from day 5.
Generation and culture of T cell knock-out clones
Oligonucleotides corresponding to crRNAs and tracrRNAs (Dharmacon, IDT) were mixed at a final concentration of 80 μM in 10 μl of Nuclease Free Duplex buffer (Dharmacon, IDT), followed by annealing by boiling and cool-down. The protein-RNA complex was prepared immediately before transfection by mixing 7.5 μg of recombinant TrueCut Cas9 Protein v2 (Thermofisher) with 1.5 μl of the crRNA/tracrRNA duplex mix in a total volume of 3 μl followed by incubation for 20 min at ~21°C. Alt-R Electroporation enhancer (Dharmacon, IDT) was added at a final concentration of 1.7 μM. Transfection was performed with the 10 μl Neon Transfection System kit; ~8×10⁵ T cells were resuspended in Neon electroporation Buffer R or Buffer T, respectively, and added to the electroporation solution. Cells were then electroporated with 1 pulse, 2200V, width 20ms. After transfection, individual Jurkat cells were cloned by limiting dilution into 384-well plates in RPMI-1640 medium supplemented with 20% FBS, 1% non-essential amino acids, 1%, sodium pyruvate, 1% glutamine, penicillin, streptomycin and 50 μM β-mercaptoethanol. Individual clones were picked and further expanded. Primary T cells were seeded in 384-well plates at 0.5-0.8 cells per well in complete medium in the presence of recombinant IL-2 (500 U/ml), 1 μg/ml of phytohaemagglutinin (PHA) and 2.5 ×10⁴ irradiated (45 Gy) allogeneic feeder cells (peripheral blood mononuclear cells) as previously described30. After 2 weeks, individual clones were transferred into round-bottom 96-well plates and further expanded.
Analysis of CRISPR/Cas9 deletions in T cell clones
Genomic DNA (gDNA) from individual clones (3-8 × 10⁴ cells) was isolated using the QIAamp DNA Micro Kit (Qiagen). To screen for the presence of deletions/ mutations, a T7 endonuclease cleavage assay was used28. PCR primers were designed to amplify a ~1000 bp region surrounding the area targeted by the sgRNAs (“Long PCR”, Extended Data 5). The PCR amplification was performed using the high fidelity KOD Hot Start DNA polymerase (Novagen). 8.5 μl of each PCR product were denatured and re-annealed, followed by addition of 5 units of T7 endonuclease (New England Biolabs). As an independent confirmation of the presence of deletions, we used primers complementary to the deleted region, therefore incapable of generating any PCR product in deleted clones (“Short-PCR”, Extended Data 5).
Secretion assay
Cytokine secretion assays (Miltenyi Biotec) were performed according to the manufacturer’s protocol. Freshly separated cells were stimulated in complete media with PMA (200 nM) and ionomycin (1 μg/ml) for 3h before labelling with the assay’s reagents and sorting.
Intracellular staining
Cells were stimulated for 5h with PMA (200 nM) and ionomycin (1 μg/ml). For the last 2.5h of stimulation, brefeldin A (10 μg/ml) was added to the cells. Cells were fixed with paraformaldehyde (PFA, 4%) and permeabilized with 0.5% BSA and saponine. The antibodies used are listed in Suppl. Table 9. For NF-κB p65 phosphorylation, cells were stimulated for 5-30 min with PMA and ionomycin, fixed with PFA and permeabilized with methanol. For intracellular FOXP3 staining, a FOXP3 Transcription Factor Staining Buffer Set (BD Bioscience) was used. All samples were acquired on a Fortessa flow cytometer (BD Bioscience) and data was analyzed with FlowJo Software.
RNA sequencing
TEM cells obtained from nine independent female donors were separated in GM-CSF+ and GM-CSF– fractions by cytokine secretion assay and immediately lysed in TRI reagent (MRC). The samples were divided into three pools of three donors each and RNA extraction was performed using the Direct-Zol RNA mini Prep kit (Zymo Research). mRNA-Seq library preparation from 400 ng of total RNA (RIN >8) was performed with the TruSeq RNA Sample Prep kit v2 (Illumina) according to the manufacturer's instructions, and single-end sequenced on an Illumina HiSeq2000 platform.
Chromatin immunoprecipitation and sequencing (ChIP-seq)
Jurkat T cells (60×106 cells) stably transduced with a flagged version of BHLHE40 or control vector were fixed with 1% formaldehyde. Cells were lysed with RIPA buffer and, after chromatin shearing by sonication, incubated overnight at 4°C with 100 μl of protein G Dynabeads (Invitrogen) previously coupled with 10 μg of anti-Flag M2 antibody (Sigma). After immunoprecipitation, beads were recovered using a magnet and washed as previously described47. DNA was eluted, cross-links reverted overnight at 65°C and purified with QiaQuick columns (Qiagen). 3 ng of ChIP-DNA (quantified with the QuantiFluor dsDNA System from Promega) were used to generate ChIP-Seq libraries as described47. The amplified DNA was quality checked on a Tapestation system (Agilent) and single-end sequenced on an Illumina NextSeq500 platform.
ATAC-seq
Freshly sorted primary TEM cells from three independent donors were separated into GM-CSF+ and GM-CSF– fractions by cytokine secretion assay. Two different protocols of cells lysis were used, which provided similar results and were therefore treated as technical replicates. Briefly, 5 × 10⁴ GM-CSF+ and GM-CSF– cells from each donor were pelleted by centrifugation and resuspended in 50 μl of either Lysis Buffer 1 (10mM Tris-HCl pH 7.4, 10mM MgCl2, 0.1% Igepal CA-630) or Lysis Buffer 2 (10mM Tris-HCl pH 7.4, 3mM MgCl2, 10mM NaCl, 0.1% Igepal CA-630). After incubation on ice for 3 min, nuclei were pelleted by centrifugation for 20 min at 500g, 4ºC, and resuspended in 50 μl of reaction buffer containing 1 μl of Tn5 transposase (made in house), 10 μl of 5× transposase buffer (50mM Tris-HCl, pH 8.4 and 25mM MgCl2), and 39 μl of milliQ water. The reaction was incubated at 37ºC for 60 min, followed by the addition of 10 μl of clean-up buffer (900mM NaCl, 300mM EDTA), 2μl of 10% SDS, 6μl of milliQ water and 2 μl of Proteinase K (20 μg/μl) (Thermofisher) and incubation for 30 min at 40 ºC. Tagmented DNA was isolated using 2× SPRI beads and amplified by PCR. Fragments smaller than 600 bp were isolated by negative size selection (using 0.65× SPRI beads) and then purified with 1.8× SPRI beads. Libraries were single-end sequenced on an Illumina NextSeq500 platform.
Bioinformatic analysis
i). RNA-seq data analysis
RNA-seq analysis was performed as previously described48, with minor changes. After quality filtering according to the Illumina pipeline, 50 bp single-end reads were aligned to the human genome (build GRCh38/hg38) using TopHat2 (version 2.1.0) with the option “--b2-very-sensitive”. Only uniquely mapped reads were retained. At the gene level, expression counts were estimated using HTSeq (version 0.6.1), summarized across all exons as annotated in the GENCODE v25, with option “union” and “no strand-specific assay”. Both coding and long noncoding RNA genes with a minimum of 1 read count in at least three samples were retained for downstream analyses. Differential expression analysis was performed using the EdgeR R-package (version 3.2.2) with Trimmed Mean of M (TMM) normalization, generalized linear model and likelihood ratio tests. Analyses were performed for each cell type separately and Differential Expressed Genes (DEGs) were identified in pairwise comparisons. Then, Transcript Per Million (TPM) values were used as expression unit. For each differential analysis DEGs were defined on the basis of the following parameters: absolute log2 fold-change (FC) ≥ 1, false discovery rate (FDR) < 0.001.
ii). ChIP-seq and ATAC-seq data analysis
Raw reads for each ChIP-seq and ATAC-seq dataset were processed using Trimmomatic (version 0.38)49 to trim off adapter sequences incorporated in the read and to remove low quality bases, using the following parameters “TRAILING:3 LEADING:3 ILLUMINACLIP:adapters.fasta:2:30:10; SLIDINGWINDOW:4:20 MINLEN:40” (for ATAC-seq datasets a MINLEN = 36 was used). A single ATAC-seq dataset for each condition was obtained by merging four replicates. Then, the resulting reads were mapped to the to human genome build GRCh38/hg38 using Bowtie2 v2.2.6 with the “--very-sensitive” preset of parameters. Reads that did not align to the nuclear genome or aligned to the mitochondrial genome were removed and duplicate reads were marked and removed using SAMtools. For ATAC-seq, read positions were corrected for transposon insertion offset as described50. Peak calling vs. the corresponding input genomic DNA was performed using MACS2 (version 2.1.0.20150731)51 with the “--nomodel”, “--extsize 200”, “--keep-dup all” and “--qvalue 0.05” flags and arguments (for ATAC-seq a extsize = 146 and “--nolambda” and no input was used). TF peaks with a fold enrichment (FE) relative to the input < 5 and those blacklisted by the ENCODE consortium analysis of artifactual signals in human cells (https://sites.google.com/site/anshulkundaje/projects/blacklists) were removed using bedtools52. To obtain a high-confidence peaks set, only intersections between biological replicates that overlapped by >50% were retained and shown as heatmap (generated using deepTools version 2.5.3)52.
The union of open chromatin regions was generated by merging peaks sets from each individual condition and a unique summit of reference was obtained by re-running MACS2 with a unique pooled bam file. Then, each region was extended by 73 bp in both directions from the peak summit to obtain a homogeneous peak width of 146 bp. Finally, differential binding analysis was performed using DiffBind (version 2.6.6)53 with settings to use DESeq2 method, full library size and without subtraction of control input read counts. Binding events with an FDR cutoff of 1e-02 and an absolute variation ≥ 1 (log2 scale) were defined as significantly different among experimental conditions.
To classify peaks based on their genomic location and assign them to the nearest Transcription Start Site (TSS), as annotated in the GENCODE v28 of the human genome, we used the annotatePeaks script from the HOMER package54. Each peak was classified as either TSS-proximal or TSS-distal, depending on its distance (> or < 2.5 kb, respectively) from annotated TSSs.
Peaks lists were subjected to the functional annotation enrichment analysis using Genomic Regions Enrichment of Annotations Tool (GREAT version 3.0.0)55 using the entire genome as background and default parameters.
iii). Motif analysis
In order to identify statistically over-represented motifs corresponding to known transcription factor binding sites, a collection of 2,314 position-specific weight matrices (PWMs) were obtained as described56, and a window of 500 bp (-450 and +50 bp relative to TSS) or a window of 300 bp (centered on the summit of ATAC-seq peaks) was used. Significantly over-represented PWMs between two sets were identified using a modified version of Pscan, in which a t-test was implemented in place of the original z-test57, with a P-value lower cutoff of 1e-5. The significant PWMs were grouped into families.
Over-represented sequence motifs in a window of 500 bp centered on the summit of BHLHE40 peaks were determined using PScan-ChIP58, using as background 10,000 random sequences obtained from the DNaseI hypersensitivity cluster of ENCODE group downloaded from the UCSC genome browser [http://genome.ucsc.edu/]. Moreover, the top significant 50 PWMs of bHLH transcription factor-family were clustered based on the sequencing similarities by STAMP web server59 and the relative phylogenetic tree visualization was performed using iTOL version 360.
iv). Genome browser tracks
We applied RPM normalization to all datasets and tracks for visualization in the Integrative Genomics Viewer (IGV) were generated using bedGraphToBigWig tool52, 61.
v). Computing the transcriptional landscape
Systematic delineation of coordinated changes in gene expression patterns within specific gene sets (GSs), i.e. pathways, was attained by applying a previously described data analysis and data visualization pipeline62. This includes the following principal elements: i. gene set-enrichment analyses (GSEA)63; ii. leading edge analyses to handle redundancies within GSs and reduce noise; iii. MCL clustering for simulating the stochastic flow within the networks; iv. calculation of network centralities; and v. layout algorithms specifically developed to be used in combination with the network-analysis and visualization suite Cytoscape64. RNAseq data were ranked according to the FDR and the GS collection was compiled according to Ref.65. Filtering for GS-size was set to larger than 10 and smaller than 500 (8095 out of 25127 GSs retained) and the connectivity threshold to connect two nodes in the network is 0.05. The network is based on the yFiles organic layout64 and settings for MCL clustering were connectivity as array source and 2.0 as granularity parameter. All other parameters were default.
Nanostring Sprint profiling
For gene expression analysis, T cells were stimulated for 3h with PMA and ionomycin. Purified RNA (50 ng) was hybridized to the nCounter Human Immunology v2 Panel codeset. Reads were normalized using positive controls and housekeeping genes. Ratios and p-values were calculated with the nSolver 3.0 software. For miRNA expression analysis, 100 ng of total RNA were used in the Human v3 miRNA Assay. Data was normalized to spiked-in positive controls and to the 25 most highly expressed miRNAs.
Quantitative RT-PCR
Total RNA was extracted using TRI reagent (MRC) and retrotranscribed either with the qScript cDNA SuperMix (Quanta Biosciences), or the TaqMan MicroRNA Reverse Transcription Kit (Applied Biosystems). For qPCRs, the PerfeCTa SYBR Green FastMix (Quanta Bioscience) was used together with the primers for the gene targets listed in Suppl. Table 9. Taqman qPCRs were performed with the TaqMan Universal PCR Master Mix (Applied Biosystems, probes listed in Suppl. Table 9). PCR reactions were run on the ABI 79000HT Fast Real-Time PCR System (Applied Biosystems).
Transfections and transductions
Primary T cells were transfected with a miR-146a mimic oligonucleotide or a control oligonucleotide using the 100 μl Neon Transfection System kit. Briefly, 2-3 × 10⁶ freshly isolated resting T cells were transfected with oligonucleotides at a final concentration of 2 μM (2200 V, 20 ms 1 pulse) and incubated for 48 h before performing subsequent analyses. HEK293 cells were cultured in 6-well plates (for luciferase reporter assays) or in T75 flasks (for production of lentiviruses). Cells were transfected with polyethylenimine (PEI) using standard protocols. Lentiviral particles were generated and purified from transfected HEK293 cells with sucrose gradient centrifugation using standard protocols. Activated primary T cells were transduced with 5-15 μl of lentiviral-containing medium in a 96-well plate with 1.5 × 10⁵ cells/well. After 48-72h, transduced cells were selected by the addition of puromycin (2 μg/mL) for 48h or sorted for GFP expression, depending on the selection marker.
Plasmids
Plasmids were generated using standard cloning techniques. BHLHE40 was subcloned from a BHLHE40 vector (ABM, LV089481) into either pScalps (Addgene number 99636) or pLVX-EF1α-IRES-ZsGreen1 (Clontech). For the truncated version of BHLHE40 lacking the C-terminal domain, site-directed mutagenesis (QuikChange II XL Site-Directed Mutagenesis Kit, Agilent Technologies) was performed to introduce a stop codon at amino acid 297. A Flag-HA-tagged version of BHLHE40 was generated by inserting an N-terminal tag. The luciferase reporter plasmid containing 4× BHLHE40 consensus binding-sites was generated by PCR amplification of synthetic oligonucleotides and cloning into the pGL3-Luciferase-promoter vector (Promega). The miR-146a sponge construct was designed based on the mature miR-146a sequence, with the addition of a central bulged mismatch. Partially overlapping forward and reverse primers were used as template for a concameric PCR as described66. The final PCR product was cloned downstream the mCherry reporter gene into a dual-reporter lentiviral vector. The luciferase reporter plasmid containing the -285 to +349 region surrounding the ZC3H12D TSS was generated by PCR amplification from gDNA and cloned upstream the luciferase gene. The corresponding plasmid containing mutations in two putative BHLHE40 binding sites was generated using the QuikChange II XL Site-Directed Mutagenesis Kit (Agilent Technologies). The luciferase reporter plasmids containing the full-length 3′UTR of the cytokines IL-22 and TNF were generated by PCR amplification from gDNA and cloning downstream the luciferase reporter gene in the pmirGLO vector. All vectors were verified by sequencing.
Reporter assays
HEK293 cells were cultured in 6-well-plates and transfected with PEI and a mix of plasmid containing the BHLHE40-expressing vector, the pGL3 luciferase reporter plasmid and a TK-Renilla plasmid with a ratio of 20:1:1. After 48 h cells were lysed using the passive lysis buffer (Dual-Luciferase® Reporter Assay System, Promega), and luciferase and renilla activities were measured according to the assay’s manual using a GloMax Discover (Promega).
Immunoblots
Cells were lysed in RIPA buffer (10 mM Tris-Cl (pH 8.0), 1 mM EDTA, 1% Triton X-100, 0.1% sodium deoxycholate, 0.1% SDS, 140 mM NaCl) supplemented with a cocktail of protease inhibitors (Sigma, P8340). Protein concentration was determined with a BCA assay (Thermo Fisher, Pierce BCA Protein Assay Kit) and 25-100 μg of protein extract were loaded on a 12% polyacrylamide gel. Blotting on a PVDF membrane was performed using a methanol-based transfer buffer (20 mM Tris, 150 mM glycine, 20% methanol). Membranes were blocked with 10% milk and incubated with primary antibodies at 4°C, followed by development with HRP-conjugated secondary antibodies. Quantification was performed with a GE Amersham Imager 680.
Statistical analysis
Statistical analysis was performed with Prism software (GraphPad).
Extended Data
Extended Data Fig. 1. Sorting scheme and principal component analysis.
a) Sorting scheme for GM-CSF secretion assay. TEM cells were separated by sorting and further divided by secretion assay and sorting. b) Principal component analysis of RNA-seq data. Cells from nine individual donors were separated by GM-CSF secretion assay and pooled in three pools of three donors each prior to RNA-seq. The PCA analysis showed robust results, with differences due to sample-to-sample variability accounting for only 15.45% (PC#2) of the variance, while the majority of the observed differences were due to the phenotype of the cells (65.03%, GM-CSFpos vs. neg, PC#1).
Extended Data Fig. 2. Expression of specific markers in T cell subsets.
a) Cytokine expression in different T cell subsets. Each indicated cytokine (IL-22, IL-17A and IFN-γ is expressed with or without concomitant co-expression of GM-CSF. Also, the IL-22pos cells are not simply a subset of the larger GM-CSFpos pool of cells. Mean ± SD. Each dot represents one donor (n=5). b) Expression of IL23R. Expression of the IL23R gene in GM-CSFpos and GM-CSFneg cells, as determined by RNA-seq (n=9). FDR=False discovery rate calculated for RNA-seq samples. c) FOXP3 expression. Comparison of FOXP3 expression in Treg cells (CD4+CD25highCD127low), GM-CSFpos and GM-CSFneg cells, as assessed by intracellular staining. Representative of n=2 experiments.
Extended Data Fig. 3. Differences in gene expression patterns between GM-CSF+ and GM-CSF– TEM cells.
Systematic delineation of coordinated changes in gene expression within specific gene sets, i.e. pathways, was achieved by applying the data analysis and data visualization pipeline described in the Methods. 119 gene sets yielded significant enrichment in GM-CSFpos vs. GM-CSFneg cells (false-discovery-rate (FDR)-q <0.01, nom. p-value of < 0.005 and TAGS >50) whereas none were found depleted. Defining the network’s organization is the degree of overlap in leading edge-genes (genes contributing to each gene set’s significant enrichment) two gene sets (nodes) linked by a connection (edge) share (threshold connectivity 0.05). Node-size corresponds to FDR-q value threshold passed by the gene set (small < 0.01, medium < 0.001, large < 0.0001). Node color denotes MCL-cluster membership that subsequently would be summarized within 5 biological themes i.e. color-coded network areas. Their FDR-q value distribution is displayed in Figure 1f.
Extended Data Fig. 4. RNA-seq, Nanostring, ATAC-seq and ChIP-seq analyses.
a) Comparison of RNA-seq and Nanostring data. Concordant results of gene expression profiling obtained by RNA-seq of TEM cells and Nanostring profiling of TCM cells. b) Expression of BHLHE40 in different T cell subsets. Expression of BHLHE40 was determined by qRT-PCR in different T cell subsets freshly sorted from peripheral blood. Each dot represents one donor (n=6). Mean ± SD; paired t-test, two-tailed. c) ATAC-seq and ChIP-seq analyses. Representative snapshots of ChIP-seq and ATAC-seq tracks for selected genomic loci.
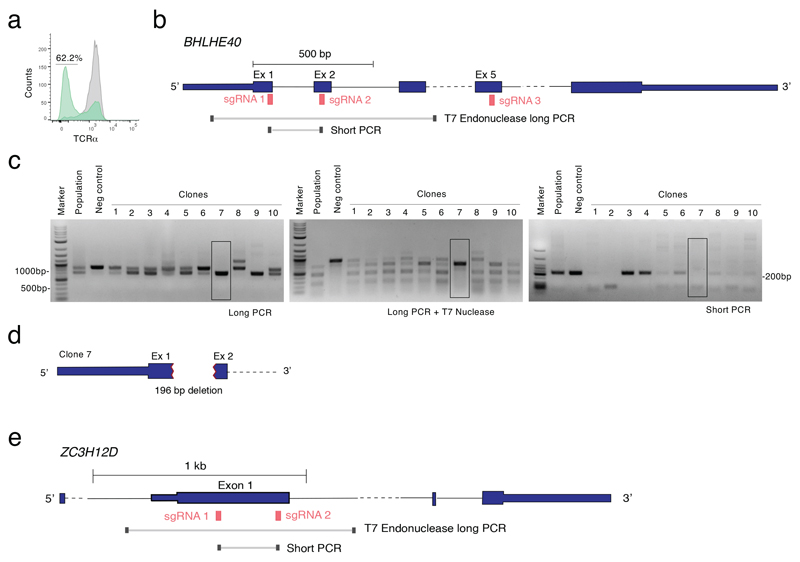
Extended Data Fig. 5. Optimization of CRISP-Cas9-mediated deletion and screening.
a) As a proof-of-principle and test of efficiency, Jurkat T cells were transfected using the Neon transfection system with ribonucleoparticles of Cas9 and one single guide RNA against the TCRα chain. After three days the cells were stained for surface TCR expression, showing a loss of expression in 62% of the cells (green). Grey: mock transfected control cells. Representative of at least n=3 independent experiments. b) Schematic representation of the BHLHE40 locus with indicated the location of guide RNAs and primers used for screening of the clones. c) Optimization of screening procedure by mismatch cleavage assay. After transfection with two guide RNAs against BHLHE40, Jurkat cells were single cell-cloned by seeding in a 384-well plate in 20% FBS. Genomic DNA was extracted from 10 clones and from the entire population (no cloning) and negative controls. The first ‘long’ PCR showed already the presence of indels in most clones (left panel) and even at the level of whole population. This was further confirmed by denaturing, reannealing and T7 endonuclease digestion (middle panel). The presence of a homozygous deletion was further confirmed using a ‘short’ PCR that cannot provide an amplification product if the region between the two guide RNAs is deleted. The highlighted Clone 7 (black box) is one of several clones in which the deletion was most likely identical on both alleles, leading to a shorter PCR product that cannot be digested by the T7 endonuclease because of the absence of mismatches. Representative of at least n=2 independent transfections and cloning procedures. d) The genomic DNA from Clone 7 was sequenced in the BHLHE40 locus region, revealing a deletion of 196 nucleotides involving part of exon 1 and exon 2, as well as the intron. e) Schematic representation of the ZC3H12D locus with indicated the location of guide RNAs and primers used for screening of the clones in Figure 8f.
Extended Data Fig. 6. Analysis of primary human T cell clones transfected with Cas9 ribonucleoparticles directed against the BHLHE40 gene.
Primary human memory T lymphocytes were transfected with ribonucleoparticles of Cas9 and gRNAs against exon 1/2 and exon 5 of BHLHE40. After single cell cloning and expansion, individual clones were tested for the presence of the deletion by PCR. Median; Mann-Whitney test. Each dot represents one clone (n=77 for KO and n=90 for control clones).
Extended Data Fig. 7. MiRNA analysis.
a) Transduction with a miR-146a sponge of primary human T lymphocytes leads to increased NF-kB p65 phosphorylation. Primary memory T lymphocytes were transduced with a lentivirus expressing a miR-146a sponge and GFP as an independent reporter of the efficiency of transduction (schematic representation on top); a few days after transduction cells were stimulated with PMA and ionomycin for 5 minutes and levels of p65 phosphorylation were determined by intracellular staining. Cells were gated as GFPneg (non-expressing the sponge) and GFPpos (expressing the sponge) and compared also to untransduced cells. Representative of n=2 experiments. b) Same as c) expect that the results (expressed as mean fluorescence intensity) of two independent experiments in which cells were stimulated for the indicated times are shown. c) Effect of BHLHE40 expression on miR-181a in Jurkat T cells. Jurkat T cells were transduced with a BHLHE40-expressing lentivirus. After selection and expansion of the transduced cells, expression of miR-181a was measured by qRT-PCR. Each dot represents one independent experiment (n=4). Mean ± SD; paired t-test, two-tailed. d) Phylogenetic analysis of the top 50 bHLH matrices recovered from the BHLHE40 ChIP-seq data.
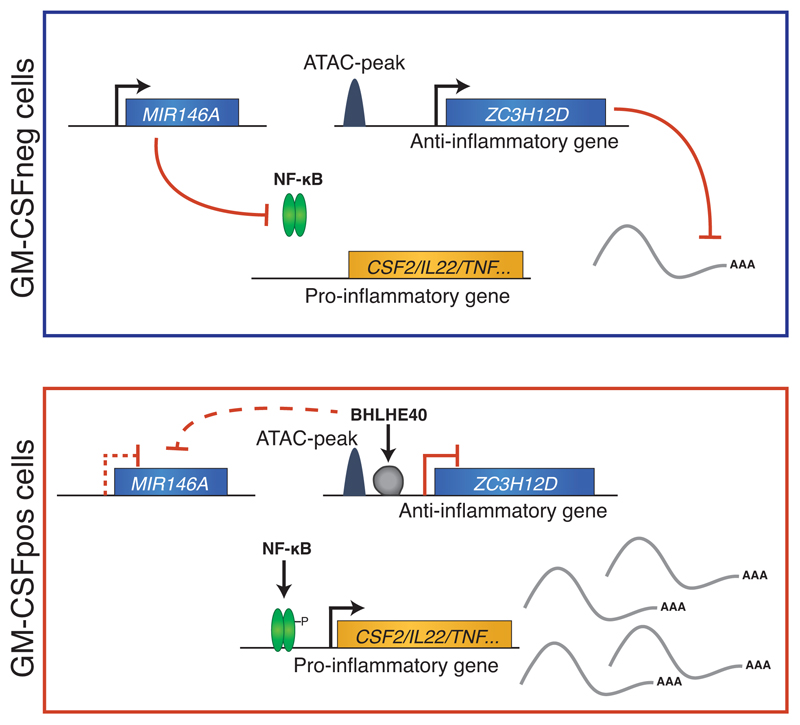
Extended Data Fig. 8. Schematic diagram describing the regulatory module identified in this study.
Using GM-CSF secretion as a proxy for an inflammatory phenotype of primary human memory TH lymphocytes, we identified a regulatory module that influences the activity of these pro-inflammatory and potentially pathogenic cells. In GM-CSF– cells, mechanisms are in place to actively repress the expression of inflammatory cytokines, including high levels of miR-146a expression (a negative regulator of NF-κB activation), and relatively higher expression of ZC3H12D, an RNase enzyme involved in the negative regulation of cytokine expression. Conversely, in GM-CSF+ cells, the expression of the transcriptional repressor BHLHE40 leads to the direct downregulation of ZC3H12D expression, and indirectly affects also miR-146a. This in turn allows full-blown NF-κB activation and expression of inflammatory cytokines.
Supplementary Material
Acknowledgements
The authors would like to thank D. Jarossay, S. Notarbartolo and F. Mele for invaluable technical support and input, M. Perez for help with Figure 1, L. Vincenzetti for pilot CRISPR-Cas9 experiments and E. Džafo for help with experiments involving Regnase-4. This work was supported by the Swiss National Science Foundation (grant number 156875 and 175569), the NCCR ‘RNA & Disease’, the Swiss MS Society, the Ceresio Foundation, the Vontobel Stiftung and the Kurt und Senta Herrmann Stiftung (all to S.M.). S. Montagner was supported by a Marie Heim-Vögtlin postdoctoral fellowship (number 164489).
Footnotes
Data availability. All Nanostring, RNA-seq, ChIP-seq and ATAC-seq datasets are available in GEO with accession number GSE122946. Source data are provided for Figure 4e and 5b. Other supporting raw data are available from the corresponding author upon request.
Author Contributions
S.E., N.B., C.L., S. Montagner, and M.C. designed and performed experiments and analyzed data; S.P., C.B. and G.N. performed and analyzed all the sequencing experiments; N.D. analyzed data; S.M. overviewed the project and analyzed data. S.M. and G.N. wrote the manuscript with input from all authors.
Competing interest
The authors declare no competing financial interests.
References
- 1.Newell EW, Sigal N, Bendall SC, Nolan GP, Davis MM. Cytometry by time-of-flight shows combinatorial cytokine expression and virus-specific cell niches within a continuum of CD8+ T cell phenotypes. Immunity. 2012;36:142–152. doi: 10.1016/j.immuni.2012.01.002. [DOI] [PMC free article] [PubMed] [Google Scholar]
- 2.Helmstetter C, et al. Individual T helper cells have a quantitative cytokine memory. Immunity. 2015;42:108–122. doi: 10.1016/j.immuni.2014.12.018. [DOI] [PMC free article] [PubMed] [Google Scholar]
- 3.Cao Y, et al. Functional inflammatory profiles distinguish myelin-reactive T cells from patients with multiple sclerosis. Sci Transl Med. 2015;7 doi: 10.1126/scitranslmed.aaa8038. 287ra274. [DOI] [PMC free article] [PubMed] [Google Scholar]
- 4.Galli E, et al. GM-CSF and CXCR4 define a T helper cell signature in multiple sclerosis. Nat Med. 2019;25:1290–1300. doi: 10.1038/s41591-019-0521-4. [DOI] [PMC free article] [PubMed] [Google Scholar]
- 5.Hartmann FJ, et al. Multiple sclerosis-associated IL2RA polymorphism controls GM-CSF production in human TH cells. Nature Commun. 2014;5 doi: 10.1038/ncomms6056. 5056. [DOI] [PubMed] [Google Scholar]
- 6.Hirota K, et al. Autoimmune Th17 Cells Induced Synovial Stromal and Innate Lymphoid Cell Secretion of the Cytokine GM-CSF to Initiate and Augment Autoimmune Arthritis. Immunity. 2018;48:1220–1232 e1225. doi: 10.1016/j.immuni.2018.04.009. [DOI] [PMC free article] [PubMed] [Google Scholar]
- 7.Behrens F, et al. MOR103, a human monoclonal antibody to granulocyte-macrophage colony-stimulating factor, in the treatment of patients with moderate rheumatoid arthritis: results of a phase Ib/IIa randomised, double-blind, placebo-controlled, dose-escalation trial. Ann Rheum Dis. 2015;74:1058–1064. doi: 10.1136/annrheumdis-2013-204816. [DOI] [PMC free article] [PubMed] [Google Scholar]
- 8.Burmester GR, et al. Efficacy and safety of mavrilimumab in subjects with rheumatoid arthritis. Ann Rheum Dis. 2013;72:1445–1452. doi: 10.1136/annrheumdis-2012-202450. [DOI] [PMC free article] [PubMed] [Google Scholar]
- 9.de Vries EG, et al. Flare-up of rheumatoid arthritis during GM-CSF treatment after chemotherapy. Lancet. 1991;338:517–518. doi: 10.1016/0140-6736(91)90594-f. [DOI] [PubMed] [Google Scholar]
- 10.Codarri L, et al. RORgammat drives production of the cytokine GM-CSF in helper T cells, which is essential for the effector phase of autoimmune neuroinflammation. Nat Immunol. 2011;12:560–567. doi: 10.1038/ni.2027. [DOI] [PubMed] [Google Scholar]
- 11.Sonderegger I, et al. GM-CSF mediates autoimmunity by enhancing IL-6-dependent Th17 cell development and survival. J Exp Med. 2008;205:2281–2294. doi: 10.1084/jem.20071119. [DOI] [PMC free article] [PubMed] [Google Scholar]
- 12.McQualter JL, et al. Granulocyte macrophage colony-stimulating factor: a new putative therapeutic target in multiple sclerosis. J Exp Med. 2001;194:873–882. doi: 10.1084/jem.194.7.873. [DOI] [PMC free article] [PubMed] [Google Scholar]
- 13.Campbell IK, et al. Protection from collagen-induced arthritis in granulocyte-macrophage colony-stimulating factor-deficient mice. J Immunol. 1998;161:3639–3644. [PubMed] [Google Scholar]
- 14.Wawro M, Kochan J, Krzanik S, Jura J, Kasza A. Intact NYN/PIN-Like Domain is Crucial for the Degradation of Inflammation-Related Transcripts by ZC3H12D. J Cell Biochem. 2017;118:487–498. doi: 10.1002/jcb.25665. [DOI] [PubMed] [Google Scholar]
- 15.Taganov KD, Boldin MP, Chang KJ, Baltimore D. NF-kappaB-dependent induction of microRNA miR-146, an inhibitor targeted to signaling proteins of innate immune responses. Proc Natl Acad Sci USA. 2006;103:12481–12486. doi: 10.1073/pnas.0605298103. [DOI] [PMC free article] [PubMed] [Google Scholar]
- 16.McGeachy MJ, et al. The interleukin 23 receptor is essential for the terminal differentiation of interleukin 17-producing effector T helper cells in vivo. Nat Immunol. 2009;10:314–324. doi: 10.1038/ni.1698. [DOI] [PMC free article] [PubMed] [Google Scholar]
- 17.Sakaguchi S, Miyara M, Costantino CM, Hafler DA. FOXP3+ regulatory T cells in the human immune system. Nat Rev Immunol. 2010;10:490–500. doi: 10.1038/nri2785. [DOI] [PubMed] [Google Scholar]
- 18.Ascherio A, Munger KL, Simon KC. Vitamin D and multiple sclerosis. Lancet Neurol. 2010;9:599–612. doi: 10.1016/S1474-4422(10)70086-7. [DOI] [PubMed] [Google Scholar]
- 19.Kongsbak M, Levring TB, Geisler C, von Essen MR. The vitamin d receptor and T cell function. Front Immunol. 2013;4:148. doi: 10.3389/fimmu.2013.00148. [DOI] [PMC free article] [PubMed] [Google Scholar]
- 20.Annunziato F, et al. Phenotypic and functional features of human Th17 cells. J Exp Med. 2007;204:1849–1861. doi: 10.1084/jem.20070663. [DOI] [PMC free article] [PubMed] [Google Scholar]
- 21.Lin CC, et al. IL-1-induced Bhlhe40 identifies pathogenic T helper cells in a model of autoimmune neuroinflammation. J Exp Med. 2016;213:251–271. doi: 10.1084/jem.20150568. [DOI] [PMC free article] [PubMed] [Google Scholar]
- 22.Sun H, Lu B, Li RQ, Flavell RA, Taneja R. Defective T cell activation and autoimmune disorder in Stra13-deficient mice. Nat Immunol. 2001;2:1040–1047. doi: 10.1038/ni721. [DOI] [PubMed] [Google Scholar]
- 23.Martinez-Llordella M, et al. CD28-inducible transcription factor DEC1 is required for efficient autoreactive CD4+ T cell response. J Exp Med. 2013;210:1603–1619. doi: 10.1084/jem.20122387. [DOI] [PMC free article] [PubMed] [Google Scholar]
- 24.Lin CC, et al. Bhlhe40 controls cytokine production by T cells and is essential for pathogenicity in autoimmune neuroinflammation. Nat Commun. 2014;5 doi: 10.1038/ncomms4551. 3551. [DOI] [PMC free article] [PubMed] [Google Scholar]
- 25.Huynh JP, et al. Bhlhe40 is an essential repressor of IL-10 during Mycobacterium tuberculosis infection. J Exp Med. 2018;215:1823–1838. doi: 10.1084/jem.20171704. [DOI] [PMC free article] [PubMed] [Google Scholar]
- 26.Yu F, et al. The transcription factor Bhlhe40 is a switch of inflammatory versus antiinflammatory Th1 cell fate determination. J Exp Med. 2018;215:1813–1821. doi: 10.1084/jem.20170155. [DOI] [PMC free article] [PubMed] [Google Scholar]
- 27.Miyazaki K, et al. The role of the basic helix-loop-helix transcription factor Dec1 in the regulatory T cells. J Immunol. 2010;185:7330–7339. doi: 10.4049/jimmunol.1001381. [DOI] [PubMed] [Google Scholar]
- 28.Ran FA, et al. Genome engineering using the CRISPR-Cas9 system. Nat Protoc. 2013;8:2281–2308. doi: 10.1038/nprot.2013.143. [DOI] [PMC free article] [PubMed] [Google Scholar]
- 29.Geiger R, Duhen T, Lanzavecchia A, Sallusto F. Human naive and memory CD4+ T cell repertoires specific for naturally processed antigens analyzed using libraries of amplified T cells. J Exp Med. 2009;206:1525–1534. doi: 10.1084/jem.20090504. [DOI] [PMC free article] [PubMed] [Google Scholar]
- 30.Mele F, et al. ERK phosphorylation and miR-181a expression modulate activation of human memory TH17 cells. Nat Commun. 2015;6 doi: 10.1038/ncomms7431. 6431. [DOI] [PubMed] [Google Scholar]
- 31.St-Pierre B, Flock G, Zacksenhaus E, Egan SE. Stra13 homodimers repress transcription through class B E-box elements. J Biol Chem. 2002;277:46544–46551. doi: 10.1074/jbc.M111652200. [DOI] [PubMed] [Google Scholar]
- 32.Sun H, Taneja R. Stra13 expression is associated with growth arrest and represses transcription through histone deacetylase (HDAC)-dependent and HDAC-independent mechanisms. Proc Natl Acad Sci USA. 2000;97:4058–4063. doi: 10.1073/pnas.070526297. [DOI] [PMC free article] [PubMed] [Google Scholar]
- 33.Ivanova AV, et al. STRA13 interacts with STAT3 and modulates transcription of STAT3-dependent targets. J Mol Biol. 2004;340:641–653. doi: 10.1016/j.jmb.2004.05.025. [DOI] [PubMed] [Google Scholar]
- 34.Li Y, et al. DEC1 negatively regulates the expression of DEC2 through binding to the E-box in the proximal promoter. J Biol Chem. 2003;278:16899–16907. doi: 10.1074/jbc.M300596200. [DOI] [PubMed] [Google Scholar]
- 35.Housley WJ, et al. Genetic variants associated with autoimmunity drive NFkappaB signaling and responses to inflammatory stimuli. Sci Transl Med. 2015;7 doi: 10.1126/scitranslmed.aaa9223. 291ra293. [DOI] [PMC free article] [PubMed] [Google Scholar]
- 36.Monticelli S, Aijo T, Trifari S. Approaches to Detect microRNA Expression in T Cell Subsets and T Cell Differentiation. Methods Mol Biol. 2017;1514:153–172. doi: 10.1007/978-1-4939-6548-9_13. [DOI] [PubMed] [Google Scholar]
- 37.Matsushita K, et al. Zc3h12a is an RNase essential for controlling immune responses by regulating mRNA decay. Nature. 2009;458:1185–1190. doi: 10.1038/nature07924. [DOI] [PubMed] [Google Scholar]
- 38.Liang J, et al. MCP-induced protein 1 deubiquitinates TRAF proteins and negatively regulates JNK and NF-kappaB signaling. J Exp Med. 2010;207:2959–2973. doi: 10.1084/jem.20092641. [DOI] [PMC free article] [PubMed] [Google Scholar]
- 39.Minagawa K, et al. Posttranscriptional modulation of cytokine production in T cells for the regulation of excessive inflammation by TFL. J Immunol. 2014;192:1512–1524. doi: 10.4049/jimmunol.1301619. [DOI] [PubMed] [Google Scholar]
- 40.Ferber IA, et al. Mice with a disrupted IFN-gamma gene are susceptible to the induction of experimental autoimmune encephalomyelitis (EAE) J Immunol. 1996;156:5–7. [PubMed] [Google Scholar]
- 41.Bettelli E, et al. Loss of T-bet, but not STAT1, prevents the development of experimental autoimmune encephalomyelitis. J Exp Med. 2004;200:79–87. doi: 10.1084/jem.20031819. [DOI] [PMC free article] [PubMed] [Google Scholar]
- 42.Oestreich KJ, Weinmann AS. Master regulators or lineage-specifying? Changing views on CD4+ T cell transcription factors. Nat Rev Immunol. 2012;12:799–804. doi: 10.1038/nri3321. [DOI] [PMC free article] [PubMed] [Google Scholar]
- 43.Kanda M, et al. Transcriptional regulator Bhlhe40 works as a cofactor of T-bet in the regulation of IFN-gamma production in iNKT cells. Proc Natl Acad Sci USA. 2016;113:E3394–3402. doi: 10.1073/pnas.1604178113. [DOI] [PMC free article] [PubMed] [Google Scholar]
- 44.Zhang L, et al. Lineage tracking reveals dynamic relationships of T cells in colorectal cancer. Nature. 2018;564:268–272. doi: 10.1038/s41586-018-0694-x. [DOI] [PubMed] [Google Scholar]
- 45.Hosokawa H, et al. Transcription Factor PU.1 Represses and Activates Gene Expression in Early T Cells by Redirecting Partner Transcription Factor Binding. Immunity. 2018;48:1119–1134 e1117. doi: 10.1016/j.immuni.2018.04.024. [DOI] [PMC free article] [PubMed] [Google Scholar]
- 46.Oestreich KJ, Weinmann AS. T-bet employs diverse regulatory mechanisms to repress transcription. Trends Immunol. 2012;33:78–83. doi: 10.1016/j.it.2011.10.005. [DOI] [PMC free article] [PubMed] [Google Scholar]
- 47.Curina A, et al. High constitutive activity of a broad panel of housekeeping and tissue-specific cis-regulatory elements depends on a subset of ETS proteins. Genes Dev. 2017;31:399–412. doi: 10.1101/gad.293134.116. [DOI] [PMC free article] [PubMed] [Google Scholar]
- 48.Balestrieri C, et al. Co-optation of Tandem DNA Repeats for the Maintenance of Mesenchymal Identity. Cell. 2018;173:1150–1164 e1114. doi: 10.1016/j.cell.2018.03.081. [DOI] [PubMed] [Google Scholar]
- 49.Bolger AM, Lohse M, Usadel B. Trimmomatic: a flexible trimmer for Illumina sequence data. Bioinformatics. 2014;30:2114–2120. doi: 10.1093/bioinformatics/btu170. [DOI] [PMC free article] [PubMed] [Google Scholar]
- 50.Buenrostro JD, Giresi PG, Zaba LC, Chang HY, Greenleaf WJ. Transposition of native chromatin for fast and sensitive epigenomic profiling of open chromatin, DNA-binding proteins and nucleosome position. Nat Methods. 2013;10:1213–1218. doi: 10.1038/nmeth.2688. [DOI] [PMC free article] [PubMed] [Google Scholar]
- 51.Zhang Y, et al. Model-based analysis of ChIP-Seq (MACS) Genome Biol. 2008;9 doi: 10.1186/gb-2008-9-9-r137. R137. [DOI] [PMC free article] [PubMed] [Google Scholar]
- 52.Quinlan AR, Hall IM. BEDTools: a flexible suite of utilities for comparing genomic features. Bioinformatics. 2010;26:841–842. doi: 10.1093/bioinformatics/btq033. [DOI] [PMC free article] [PubMed] [Google Scholar]
- 53.Ross-Innes CS, et al. Differential oestrogen receptor binding is associated with clinical outcome in breast cancer. Nature. 2012;481:389–393. doi: 10.1038/nature10730. [DOI] [PMC free article] [PubMed] [Google Scholar]
- 54.Heinz S, et al. Simple combinations of lineage-determining transcription factors prime cis-regulatory elements required for macrophage and B cell identities. Mol Cell. 2010;38:576–589. doi: 10.1016/j.molcel.2010.05.004. [DOI] [PMC free article] [PubMed] [Google Scholar]
- 55.McLean CY, et al. GREAT improves functional interpretation of cis-regulatory regions. Nat Biotechnol. 2010;28:495–501. doi: 10.1038/nbt.1630. [DOI] [PMC free article] [PubMed] [Google Scholar]
- 56.Diaferia GR, et al. Dissection of transcriptional and cis-regulatory control of differentiation in human pancreatic cancer. EMBO J. 2016;35:595–617. doi: 10.15252/embj.201592404. [DOI] [PMC free article] [PubMed] [Google Scholar]
- 57.Zambelli F, Pesole G, Pavesi G. Pscan: finding over-represented transcription factor binding site motifs in sequences from co-regulated or co-expressed genes. Nucleic Acids Res. 2009;37:W247–252. doi: 10.1093/nar/gkp464. [DOI] [PMC free article] [PubMed] [Google Scholar]
- 58.Zambelli F, Pesole G, Pavesi G. PscanChIP: Finding over-represented transcription factor-binding site motifs and their correlations in sequences from ChIP-Seq experiments. Nucleic Acids Res. 2013;41:W535–543. doi: 10.1093/nar/gkt448. [DOI] [PMC free article] [PubMed] [Google Scholar]
- 59.Mahony S, Benos PV. STAMP: a web tool for exploring DNA-binding motif similarities. Nucleic Acids Res. 2007;35:W253–258. doi: 10.1093/nar/gkm272. [DOI] [PMC free article] [PubMed] [Google Scholar]
- 60.Letunic I, Bork P. Interactive tree of life (iTOL) v3: an online tool for the display and annotation of phylogenetic and other trees. Nucleic Acids Res. 2016;44:W242–245. doi: 10.1093/nar/gkw290. [DOI] [PMC free article] [PubMed] [Google Scholar]
- 61.Li H, et al. The Sequence Alignment/Map format and SAMtools. Bioinformatics. 2009;25:2078–2079. doi: 10.1093/bioinformatics/btp352. [DOI] [PMC free article] [PubMed] [Google Scholar]
- 62.Delaleu N, Nguyen CQ, Tekle KM, Jonsson R, Peck AB. Transcriptional landscapes of emerging autoimmunity: transient aberrations in the targeted tissue's extracellular milieu precede immune responses in Sjogren's syndrome. Arthritis Res Ther. 2013;15 doi: 10.1186/ar4362. R174. [DOI] [PMC free article] [PubMed] [Google Scholar]
- 63.Subramanian A, et al. Gene set enrichment analysis: a knowledge-based approach for interpreting genome-wide expression profiles. Proc Natl Acad Sci USA. 2005;102:15545–15550. doi: 10.1073/pnas.0506580102. [DOI] [PMC free article] [PubMed] [Google Scholar]
- 64.Su G, Morris JH, Demchak B, Bader GD. Biological network exploration with Cytoscape 3. Curr Protoc Bioinformatics. 2014;47 doi: 10.1002/0471250953.bi0813s47. 8 13 11-24. [DOI] [PMC free article] [PubMed] [Google Scholar]
- 65.Merico D, Isserlin R, Stueker O, Emili A, Bader GD. Enrichment map: a network-based method for gene-set enrichment visualization and interpretation. PloS One. 2010;5:e13984. doi: 10.1371/journal.pone.0013984. [DOI] [PMC free article] [PubMed] [Google Scholar]
- 66.Lindner SE, et al. The miR-15 family reinforces the transition from proliferation to differentiation in pre-B cells. EMBO Rep. 2017;18:1604–1617. doi: 10.15252/embr.201643735. [DOI] [PMC free article] [PubMed] [Google Scholar]
Associated Data
This section collects any data citations, data availability statements, or supplementary materials included in this article.


