



Abstract
Background
Osteosarcoma (OS) is the most common primary malignant tumor of bone. The identification of novel biomarkers is necessary for the diagnosis and treatment of osteosarcoma.
Material/Methods
We obtained 11 paired fresh-frozen OS samples and normal controls from patients between September 2015 and February 2017. We used an integration strategy that analyzes next-generation sequencing data by bioinformatics methods based on the pathogenesis of osteosarcoma.
Results
One susceptibility lncRNA and 7 susceptibility genes regulated by the lncRNA for osteosarcoma were effectively identified, and real-time PCR and clinical index ALP data were used to test their effectiveness.
Conclusions
The results showed that the expression levels of the 7 genes were highly consistent in the training and test sample sets, especially between the expression value of the gene ALPL and the plasma detection value of its encoded protein ALP. In particular, both the expression of gene ALPL and the plasma detection values of protein ALP encoded by gene ALPL showed a high degree of consistency among different data types. The identified lncRNA and genes effectively classified the samples proved so that they could be used as potential biomarkers of osteosarcoma. Our strategy may also be helpful for the identification of biomarkers for other diseases.
MeSH Keywords: Biological Markers, High-Throughput Nucleotide Sequencing, Osteosarcoma
Background
Osteosarcoma (OS) is the most common primary malignant tumor of bone [1]. It is a spindle cell tumor characterized by the production of osteoid and immature bone [2,3]. Currently, the primary treatment of OS includes neoadjuvant and adjuvant poly-chemotherapy, and radical resection of the tumor between chemotherapy cycles. Although the multimodal treatment approach improves the prognosis of patients with OS, the 5-year survival rate of OS patients remains at 50–70% [4]. OS is associated with excessive proliferation and poor differentiation of osteoblasts [5]. The abnormality of bone development and osteogenesis is closely related to the occurrence and metastasis of OS [6]. ALP is not only related to bone development and differentiation, but also has a clear correlation with OS. ALP is often used in clinical auxiliary diagnosis and as a post-treatment monitoring indicator [7], but there are no related treatments associated with ALP. Therefore, it is urgent to find new diagnosis and therapy targets, especially targets related to bone differentiation and formation. Many reports have shown that the occurrence and development of OS are related to non-coding RNAs and their targeting genes [8,9].
lncRNAs are non-coding RNAs with a length of more than 200 nucleotides. Many lncRNAs are deregulated in cancer and are important regulators of malignancies [10]. Recent studies have provided pieces of evidence that lncRNAs play central roles in a wide range of cellular processes by interacting with key component proteins, including cell proliferation, cell cycle progression, apoptosis, and carcinogenesis [11–13]. Cellular or tissue-specific expression of lncRNAs is associated with a variety of biological behaviors of tumors. Recently, many studies have found potential targets related to OS through next-generation sequencing and provided a theoretical basis for further studies on the occurrence and development of OS [14–16].
In the present study, we used second-generation RNA-sequencing to obtain gene expression data from 11 paired tissues to identify differentially expressed lncRNAs and mRNAs between primary OS and normal controls. Different data sets were used to verify their classification efficiency and stability. Our aim was to identify potential biomarkers for the diagnosis and treatment of osteosarcoma and to assist clinical research or other researchers in osteosarcoma.
Material and Methods
Tumor samples
For the RNA-seq, 11 paired fresh-frozen OS samples and normal controls were obtained from patients between September 2015 and February 2017. There were 7 male and 4 female patients, with an age range of 6–27 years old. For the qRT-PCR, 5 more paired patient samples were included from 3 male and 2 female patients with an age range of 10–19 years old. All samples were stored at −80°C and were obtained from Harbin Medical University Cancer Hospital Orthopedics Department. The study design was approved by the Ethics Review Board of Harbin Medical University Cancer Hospital. All patients provided signed informed consent.
Osteosarcoma pathogenetic genes
The Cancer Gene Census (CGC) (https://cancer.sanger.ac.uk/census) is an expert-curated description within COSMIC of the genes driving human cancer, and is used as a standard in cancer genetics across basic research, medical reporting, and pharmaceutical development [17,18]. We selected OS-driving genes and genes that are associated with all cancers from CGC as OS pathogenetic genes.
RNA-sequencing
Total RNA from fresh-frozen tissues was extracted using the standard TRIzol-chloroform method. RNA concentrations were measured in Qubit® 2.0 Fluorometer (Life Technologies, CA, USA) using the Qubit® RNA Assay Kit. RNA degradation and contamination were checked with 1% agarose gel. RNA purity was assessed using a nanometer spectrophotometer (IMPLEN, CA, USA). The RNA Nano 6000 assay kit of Bioanalyzer 2100 (Agilent Technologies, CA, USA) was used to detect RNA integrity. A total of 3 ug of RNA/sample was prepared as input material. Phusion High-Fidelity DNA polymerase, Universal PCR primers, and Index Primer were used for PCR. The Agilent Bioanalyzer 2100 system was used to purify the product (AMPure XP system) and to assess the library quality. The TruSeq PE Cluster Kit v3-cbo-hs (Illumina) was used to Cluster index coded samples on the cBot Cluster generation system according to the manufacturer’s instructions. After clustering, the libraries were sequenced on the Illumina Hiseq 4000 platform to obtain 150 bp paired-end reads.
RNA-Seq data processing
Raw data in fastq format were first processed using Perl software. In this step, clean data (clean reads) were obtained by removing reads containing adapter, reads containing ploy-N, and low-quality reads from the raw data. All the downstream analyses were based on clean data with high quality. Then, the filtered reads were mapped to the hg38 genome reference genome (GRCh38) using HISAT2 (version 2.1.0) with default parameters. StringTie (1.3.3b) was used to calculate FPKMs of lncRNAs and coding genes in each sample. FPKM means fragments per kilo-base of exon per million fragments mapped, calculated based on the length of the fragments and reads count mapped to this fragment. Transcripts-level raw counts were calculated using the preDE.py script within StringTie.
Differential expression analysis of 2 groups was performed using the DESeq2 R package based on raw counts. DESeq2 provides statistical routines for determining differential expression in digital gene expression data using a model based on the negative binomial distribution. The resulting P values were adjusted using the Benjamini and Hochberg’s approach for controlling the false discovery rate. Transcripts with an adjusted P value <0.05 and absolute value of log2(Fold change) >1 found by DESeq2 were assigned as differentially expressed.
For the following statistical analysis, we filtered out low or negative noise data and normalized the expression profile data. Next, HISAT2 and StringTie were used to acquire FPKM of all transcripts [19], and then the limma package of R was used to screen differentially expressed transcripts [20], in which each transcript corresponds to a unique gene or lncRNA.
Functional annotation analysis
Differentially expressed genes that were enriched in functions significantly associated with OS were defined as genes susceptible to OS. The functional annotation analysis was performed using the hyper-geometric test:
where N symbolizes the number of all human genes in GO annotated database, M symbolizes the number of genes in particular functional term i, n symbolizes the number of differential genes needed to be enriched, and k symbolizes the number of differential genes in function i.
qRT-PCR
Total RNAs were extracted from fresh OS samples and adjacent normal control samples by using the standard TRIzol-chloroform method. The qualified total RNAs were reversely transcribed into the first-strand cDNAs by using the Golden 1st cDNA Synthesis Kit (with dsDNase) (HaiGene, D0401). qRT-PCR was conducted using an ABI 7500 RT-PCR amplifier (Applied Biosystems, USA) to determine the expression pattern of the mRNA of the 7 genes in each OS sample and paired adjacent normal control tissue. qRT-PCR was then performed using the 2×Hi SYBR Green qPCR Mix (HaiGene, A2201) in a total volume of 20 μl. The sequences of qRP-PCR primers are shown in Supplementary Table 1. β-actin was used as the reference gene. The relative gene expression levels are represented as ΔCt=Ct [21] – Ct (reference). The fold change of gene expression was calculated using the 2–ΔΔCt method. The experiments were repeated in triplicate.
Results
OS pathogenetic genes
Four OS-driving genes and 25 all-cancer-driving genes were obtained as OS pathogenetic genes from the Cancer Gene Census database (https://cancer.sanger.ac.uk/census/#cl_search) (Table 1).
Table 1.
OS pathogenetic genes.
| Gene type | Genes |
|---|---|
| OS-driving genes | EXT1, EXT2, RECQL4, WRN |
| All cancer-driving genes | AFF4, CDK6, EPS15, FCGR2B, FOXP1, HLF, JAK1, MLLT11, MLLT3, NCKIPSD, ZNF384, ZNF521, ABL1, AFF3, CREBBP, EP300, EWSR1, FLT3, IKZF1, IL7R, JAK2, KMT2A, PAX5, PML, TAF15 |
OS-driving genes correspond to 4 mutant genes in OS, and All Cancer-driving genes correspond to 25 mutant genes in all cancers.
OS susceptibility genes
To identify susceptibility genes for OS, 29 pathogenetic genes of OS and differentially expressed genes screened from RNA-sequencing data were enriched with GO functional terms in DAVID (p value=0.05). We chose 10 functional classes that have been confirmed to be associated with OS (Table 2). André Wirries proposed that Panobinostat mediated cell death as a novel therapeutic approach for OS [22], Po-Chun Chenn found that the CCN family proteins was related to bone tumors such as OS by affecting bone development [23], and Andrew E Horvai identified regulators of skeletal development as diagnostically useful markers of bone tumors [24].
Table 2.
Enriched GO terms related to OS.
| GO term | Genes | P value |
|---|---|---|
| GO: 0001501~skeletal system development | ALPL, EP300, FAM20C, PAX5, EXT1, FOXP1 | 0.0047 |
| GO: 0060348~bone development | ALPL, EP300, FAM20C, FOXP1 | 0.0076 |
| GO: 0001503~ossification | ALPL, FAM20C, CDK6, EXT1, EXT2 | 0.0086 |
| GO: 0007519~skeletal muscle tissue development | HLF, EP300, PAX5, FOXP1 | 0.0066 |
| GO: 0002573~myeloid leukocyte differentiation | FAM20C, TLR4, CDK6, FOXP1 | 0.0096 |
| GO: 0007417~central nervous system development | PAX5, TLR4, CDK6, WRN, ABL1, EXT1, FOXP1 | 0.0151 |
| GO: 0007275~multicellular organism development | ALPL,HLF,KMT2A,MYDGF,FAM20C,PML,PAX5,TLR4,IL7R, NCKIPSD, MLLT3, RECQL4, IKZF1, FLT3,CREBBP,AFF3, CDK6, ZNF521,WRN, FOXP1, EP300, JAK1, JAK2, EXT1, ABL1, EXT2 | 2.87E-06 |
| GO: 0010941~regulation of cell death | FLT3,MYDGF,MLLT11,CREBBP,PML, JAK2, WRN, ABL1,FOXP1 | 0.0055 |
| GO: 0043085~positive regulation of catalytic activity | ATP1B3, RGS3, FLT3, PML, JAK1, TLR4, JAK2, WRN, ABL1 | 0.0068 |
| GO: 0051345~positive regulation of hydrolase activity | ATP1B3, RGS3, PML, JAK1, JAK2, WRN | 0.05 |
Secondly, differentially expressed genes in these OS-related functional terms were assessed by Wilcoxon rank sum test [25] on 11 paired OS samples and normal samples based on the transcript profile. We found 7 genes (ALPL, FAM20C, CTPS1, RGS3, STT3A, MYDGF and ATP1B3) whose expression levels in disease samples were significantly different from those of normal samples. Ultimately, through co-expression analysis (Pearson correlation coefficient=0.95) of the 7 genes and differentially expressed lncRNAs screened from RNA-seq data, lncRNA SNHG3 was identified as the OS susceptibility lncRNA because it simultaneously regulated these genes, and the 7 genes were defined as OS susceptibility genes (Table 3).
Table 3.
OS susceptibility genes and lncRNA.
| Transcripts ID | lncRNA | Genes |
|---|---|---|
| ENST00000413987.1 | SNHG3 | ALPL, FAM20C, CTPS1, MYDGF |
| ENST00000437681.1 | SNHG3 | RGS3, STT3A, ATP1B3 |
Genes and lncRNAs play an important role in the development of disease. Studies have shown that the protein encoded by ALPL plays a critical role in bone mineralization, and the mutation of this gene is related to hypophosphatasia, which is characterized by hypercalcemia and bone defect [26,27]. The protein encoded by FAM20C is also involved in the process of bone mineralization [28,29]. Rui Deng et al. found that lncRNA SNHG1 promotes cell proliferation, migration, and invasion in OS [30], and SNHG1 and SNHG3 are widely expressed in bone marrow. Therefore, the identified OS susceptibility lncRNA and genes may serve as potential biomarkers for OS.
Classification efficiency of susceptibility genes and lncRNA
Eleven groups of paired samples were sorted by Support Vector Machines (SVM performs binary classification) classifier [31] with a feature of 7 OS susceptibility genes and 2 transcripts of lncRNA SNHG3, respectively. Area under the curve (AUC) values [32] were determined to evaluate the discriminatory power of susceptibility genes (Figure 1) and lncRNA (Figure 2) between the disease and normal groups.
Figure 1.

ROC Curves of 7 susceptibility genes. (A) ROC curves of ALPL, ATP1B3, FAM20C, and MYDGF. (B) ROC curves of RGS3, STT3A, and CTPS1.
Figure 2.

ROC Curves of the susceptibility lncRNA. (A) ROC curves of 2 transcripts of lncRNA (SNHG3). (B) ROC curve of the mean values of 2 transcripts
The AUC values of the 7 susceptibility genes and 2 lncRNA transcripts are all higher than or close to 90%, and they performed well in classifying samples. To further evaluate classification effectiveness, the AUC values of 4 OS-driving genes (EXT1, EXT2, RECQL4, and WRN) were also determined (Figure 3). The results showed that the taxonomic efficiency of the 7 susceptibility genes was roughly the same as that of the 4 known osteosarcomatous pathogenic genes.
Figure 3.
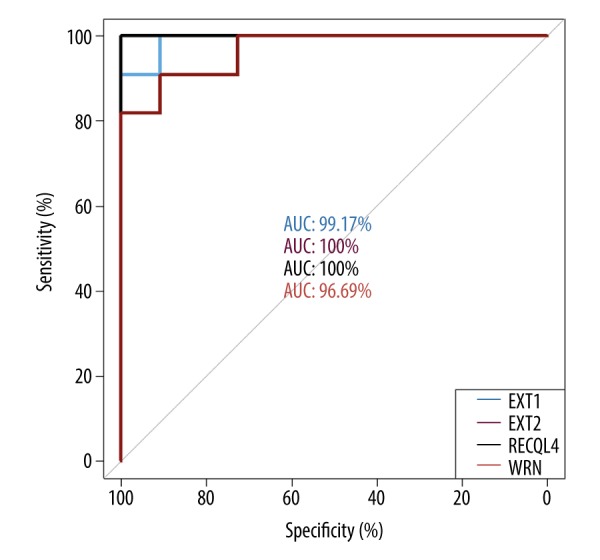
ROC Curves of 4 OS-driving genes.
Susceptibility genes validation
To further verify the reliability of the RNA-seq data, we determined the real-time PCR values of 7 susceptibility genes in 8 groups (selected from 11 groups) of paired samples, and used the Wilcoxon rank sum test to compare the real-time PCR and mRNA FPKM values of each susceptibility gene. We tested the hypothesis for each gene, as follows:
H0: The distribution of PCR and mRNA FPKM data is consistent.
H1: The distribution of PCR and mRNA FPKM data is inconsistent.
Because the p values of the 7 genes were all less than 0.05 in the Wilcoxon rank sum test (Table 4), the H0 hypothesis was accepted. Therefore, the distribution of real-time PCR and mRNA FPKM was consistent for each gene.
Table 4.
Sample consistency test for 7 susceptibility genes.
| Gene symbols | P value |
|---|---|
| ALPL | 0.5619 |
| FAM20C | 0.1439 |
| MYDGF | 0.1439 |
| RGS3 | 0.2979 |
| STT3A | 0.6685 |
| CTPS1 | 0.1928 |
| ATP1B3 | 0.2979 |
To test the validity of susceptible genes, the classification efficiency of 7 susceptibility genes was assessed based on 8 groups of samples with PCR/FPKM data, (Figure 4). The classification results on mRNA FPKM and PCR values were good, and mRNA FPKM values performed better than real-time PCR. Importantly, the AUC values of ALPL mRNA and ALPL PCR were 100% (Figure 4A).
Figure 4.

ROC curves of 7 susceptibility genes sequentially corresponding to the ROC curves of the following genes: ALPL (A), ATP1B3 (B), CTPS1 (C), FAM20C (D), MYDGF (E), RGS3 (F), and STT3A (G). The red line is the ROC curve of each gene for samples with RNA_seq data, and the black line is the ROC curve of each gene for samples with real-time PCR data.
ALP is an enzyme widely distributed in human liver, skeleton, kidney, and placenta, and is encoded by the gene ALPL. Clinical determination of ALP is mainly used in the diagnosis of skeletal and hepatobiliary diseases [33]. Here, the plasma alkaline phosphatase (ALP) data of 8 OS disease samples were obtained and Wilcoxon rank sum tests were performed. The significant p value between ALP values and real-time PCR values of 8 disease samples was 0. 25 and the p value between ALP values and mRNA FPKM values was 0.46, indicating that the expressions between different data types of samples were consistent.
In addition, 5 more paired samples without RNA-seq data were used to further verify our method as an independent set. The Wilcoxon rank sum test for 7 susceptibility genes between 5 paired new samples and 8 paired samples was conducted (Figure 5). The results showed that the PCR values of all 7 genes in 2 sample sets were consistent (p value=0.05).
Figure 5.
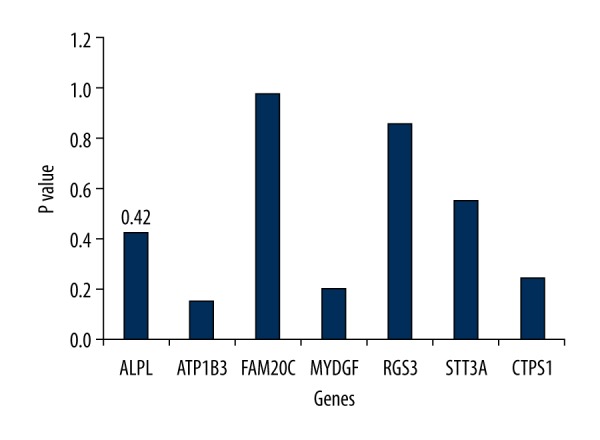
Sample consistency test of 2 sample sets.
ALP values of the 5 disease samples were also determined, the significant p value of the Wilcoxon test between ALP values and real-time PCR values of the 5 samples was 1, with excellent consistency. Considering the consistency of ALPL in 2 data types of 5 paired samples (ALP and real-time PCR) or in 3 data types of 8 paired samples (ALP, real-time PCR, and mRNA FPKM), and because ALPL is a well-known OS marker, we inferred that the relevant products of the other 6 susceptibility genes may also be used as potential clinical markers of OS.
Additionally, we used the 7 genes as characteristic attributes to classify the samples of expression profile GSE87624 (platforms: GPL11154 Illumina HiSeq 2000) obtained from the Gene Expression Omnibus (GEO) (https://www.ncbi.nlm.nih.gov/gds/), and the profile contained 44 tumor samples and 3 normal samples. The results showed that the genes ALPL (AUC=84.09%) and RGS3 (AUC=89.39%) were able to discriminate osteosarcoma samples from normal samples. This indicates once again that the genes we identified are of significance in guiding the diagnosis and treatment of osteosarcoma.
Discussion
OS is one of the most common malignant tumors of bone, which develops from the interstitial cell line. Although the diagnosis and treatment strategy of OS have been developed in recent years, the therapeutic effect of most patients is still not satisfactory [34]. Therefore, the identification of new OS biomarkers is of great significance for the treatment and prognosis of OS. Apart from disease genes, many studies have shown that lncRNAs also play an important role in the development of OS [30,35]. In this study, we sequenced 11 pairs of OS samples and screened potential susceptibility genes and lncRNAs of OS by bioinformatics methods and clinical indicators.
The known OS-driving genes and differentially expressed genes obtained from sequencing data were enriched in GO functional terms, 7 OS susceptibility genes (ALPL, FAM20C, CTPS1, RGS3, STT3A, MYDGF, and ATP1B3) were identified according to the enrichment results. Then, the susceptible lncRNA (SNHG3) of OS was identified by co-expression analysis of 7 susceptibility genes and differential lncRNAs. These susceptibility genes were not only enriched in functional classes related to the development of OS such as cell death, bone, and skeletal system development, but also presented a significant difference in the level of expression between control and disease samples. In particular, ALPL, FAM20C, and known OS-driving genes (such as EXT1 and EXT2) were enriched in the same functional terms associated with bone development, and several studies have also confirmed their association with OS. The lncRNA SNHG3 and the family lncRNA SNHG1 were also confirmed to be associated with OS [8,30].
The identified susceptible genes and lncRNA all have high and stable classification efficiency for normal and disease samples. Their classification efficiency to 11 groups of paired samples is approximate to that of 4 known driving genes of OS. Moreover, qRT-PCR was conducted on 8 selected pairs of samples, and 7 susceptibility genes were used to classify the samples by the SVM method. The AUC values of RNA-seq and real-time PCR data were all between 0.7 and 1, but the classification of the sequencing data was better. In particular, the AUC values of gene ALPL in 2 data types were all 100%, so we assessed the ALP values in the plasma of 8 disease samples, and confirmed the consistency of the samples in different data types by Wilcoxon rank sum test. In the light of high classification efficiency and consistency of samples, the identified susceptibility genes may be used as potential biomarkers of OS.
To verify the validity and reliability of the markers identified by our method, the real-time PCR and ALP values of 5 new groups of samples without RNA-seq data were also detected. Alkaline phosphatase (ALP) has been long known to be correlated with active bone metabolism, and high ALP levels are correlated with OS metastases [36,37]. The Wilcoxon rank sum test showed that the PCR values of 5 groups were consistent with those of 8 groups, and the values of ALP and PCR in the 5 disease samples were also consistent. The PCR expression values of the other 6 genes were also consistent between 5 and 8 groups of samples. Their effectiveness of classification is also further verified by other expression profiles.
We also identified other co-expression differential lncRNAs and genes, such as lncRNA LINC01372 and the genes regulated by it: EFR3A, PPP3CC, DUSP13, ASB16, CASZ1, GMPR, and DCAF6. Moreover, the mRNA FPKM values of these genes were highly consistent with the real-time PCR values, and the classification efficiency of these genes was also significant. It may be helpful to the treatment of OS if we analyzed them more deeply.
Conclusions
Our study identified 1 lncRNA and 7 genes as potential biomarkers of OS. Through the verification of multiple datasets and the consistency analysis of clinical data, we proved that these markers have excellent classification performance. Other studies have confirmed that the genes ALPL and FAM20C are closely associated with osteosarcoma. Therefore, other genes and SNHG3 may be novel targets for the treatment and diagnosis of osteosarcoma.
Supplementary Data
Supplementary Table 1.
The sequences of qRP-PCR primers.
| Gene name | Primer sequences |
|---|---|
| ALPL F | CGTGGAACATTCTGGATCTGAC |
| ALPL R | GGAGTGAGTGAGTGAGCAAGG |
| FAM20C F | CTGACTACGAGAGGCACAATG |
| FAM20C R | TGGCTGGAGAGATGAAGAAGG |
| CTPS1 F | CAGTCATCCCGTGGTCGTAG |
| CTPS1 R | TTCCAAGTAGTCTGCGTCTCC |
| MYDGF F | AATGAGCAATGGCAGATGAGTC |
| MYDGF R | TTCAAATGCGGCTTTAGAGTAGG |
| RGS3 F | GTCATTCAAGCCCACCTCAG |
| RGS3 R | CACAAGCCAACCAGAACTCC |
| STT3A F | TGTGTTGCTGTTGTATATTGTTACC |
| STT3A R | CTCTCTAGGGACCTGTTACTGG |
| ATP1B3 F | AGAAGAACAGAAGAACCTCACAG |
| ATP1B3 R | CACAATCTATCCTTGGCACTCC |
Footnotes
Source of support: This work was supported by Haiyan Funding (grant number: JJ2D 2017-08), the China Postdoctoral Science Foundation (grant number: 2017M611393), the National Natural Science Foundation of China [grant numbers: 61702141, 61272388, and 81627901], and the University Student Innovation and Entrepreneurship Training Program in Harbin Medical University [grant numbers: 201810226080 and 201810226082]
References
- 1.Mirabello L, Koster R, Moriarity BS, et al. A genome-wide scan identifies variants in NFIB associated with metastasis in patients with osteosarcoma. Cancer Discov. 2015;5(9):920–31. doi: 10.1158/2159-8290.CD-15-0125. [DOI] [PMC free article] [PubMed] [Google Scholar]
- 2.Shi K, Wang SL, Shen B, et al. Clinicopathological and prognostic values of fibronectin and integrin alphavbeta3 expression in primary osteosarcoma. World J Surg Oncol. 2019;17(1):23. doi: 10.1186/s12957-019-1566-z. [DOI] [PMC free article] [PubMed] [Google Scholar]
- 3.Nagamine E, Matsuda K, Ishii C, et al. Primary ischial osteosarcoma occupying the pelvic cavity in a Japanese black cow. J Vet Med Sci. 2014;76(6):891–94. doi: 10.1292/jvms.13-0491. [DOI] [PMC free article] [PubMed] [Google Scholar]
- 4.Yu W, Zhu J, Wang Y, et al. A review and outlook in the treatment of osteosarcoma and other deep tumors with photodynamic therapy: From basic to deep. Oncotarget. 2017;8:39833–48. doi: 10.18632/oncotarget.16243. [DOI] [PMC free article] [PubMed] [Google Scholar]
- 5.Hu F, Shang XF, Wang W, et al. High-level expression of periostin is significantly correlated with tumour angiogenesis and poor prognosis in osteosarcoma. Int J Exp Pathol. 2016;97:86–92. doi: 10.1111/iep.12171. [DOI] [PMC free article] [PubMed] [Google Scholar]
- 6.Basu-Roy U, Basilico C, Mansukhani A. Perspectives on cancer stem cells in osteosarcoma. Cancer Lett. 2013;338(1):158–67. doi: 10.1016/j.canlet.2012.05.028. [DOI] [PMC free article] [PubMed] [Google Scholar]
- 7.Kim SH, Shin KH, Moon SH, et al. Reassessment of alkaline phosphatase as serum tumor marker with high specificity in osteosarcoma. Cancer Med. 2017;6:1311–22. doi: 10.1002/cam4.1022. [DOI] [PMC free article] [PubMed] [Google Scholar]
- 8.Wang J, Cao L, Wu J, Wang Q. Long non-coding RNA SNHG1 regulates NOB1 expression by sponging miR-326 and promotes tumorigenesis in osteosarcoma. Int J Oncol. 2018;52(1):77–88. doi: 10.3892/ijo.2017.4187. [DOI] [PMC free article] [PubMed] [Google Scholar]
- 9.Liu K, Huang J, Ni J, et al. MALAT1 promotes osteosarcoma development by regulation of HMGB1 via miR-142-3p and miR-129-5p. Cell Cycle. 2017;16(6):578–87. doi: 10.1080/15384101.2017.1288324. [DOI] [PMC free article] [PubMed] [Google Scholar]
- 10.Chen D, Wang H, Zhang M, et al. Abnormally expressed long non-coding RNAs in prognosis of Osteosarcoma: A systematic review and meta-analysis. J Bone Oncol. 2018;13:76–90. doi: 10.1016/j.jbo.2018.09.005. [DOI] [PMC free article] [PubMed] [Google Scholar]
- 11.Li Y, Wang H, Zhou D, et al. Up-regulation of long noncoding RNA SRA promotes cell growth, inhibits cell apoptosis, and induces secretion of estradiol and progesterone in ovarian granular cells of mice. Med Sci Monit. 2018;24:2384–90. doi: 10.12659/MSM.907138. [DOI] [PMC free article] [PubMed] [Google Scholar]
- 12.Jin F, Wang N, Zhu Y, et al. Downregulation of long noncoding RNA Gas5 affects cell cycle and insulin secretion in mouse pancreatic β cells. Cell Physiol Biochem. 2017;43(5):2062–73. doi: 10.1159/000484191. [DOI] [PubMed] [Google Scholar]
- 13.Wang Y, Chen F, Zhao M, et al. The long noncoding RNA HULC promotes liver cancer by increasing the expression of the HMGA2 oncogene via sequestration of the microRNA-186. J Biol Chem. 2017;292(37):15395–407. doi: 10.1074/jbc.M117.783738. [DOI] [PMC free article] [PubMed] [Google Scholar]
- 14.Schaefer C, Mallela N, Seggewiss J, et al. Target discovery screens using pooled shRNA libraries and next-generation sequencing: A model workflow and analytical algorithm. PLoS One. 2018;13(1):e0191570. doi: 10.1371/journal.pone.0191570. [DOI] [PMC free article] [PubMed] [Google Scholar]
- 15.Yang Y, Zhang Y, Qu X, et al. Identifcation of differentially expressed genes in the development of osteosarcoma using RNA-seq. Oncotarget. 2016;7(52):87194–205. doi: 10.18632/oncotarget.13554. [DOI] [PMC free article] [PubMed] [Google Scholar]
- 16.Lopez C, Abuel-Haija M, Pena L, Coppola D. Novel germline PTEN mutation associated with cowden syndrome and osteosarcoma. Cancer Genomics Proteomics. 2018;15(2):115–20. doi: 10.21873/cgp.20069. [DOI] [PMC free article] [PubMed] [Google Scholar]
- 17.Sondka Z, Bamford S, Cole CG, et al. The COSMIC Cancer Gene Census: Describing genetic dysfunction across all human cancers. Nat Rev Cancer. 2018;18(1):696–705. doi: 10.1038/s41568-018-0060-1. [DOI] [PMC free article] [PubMed] [Google Scholar]
- 18.Tate JG, Bamford S, Jubb HC, et al. COSMIC: The Catalogue Of Somatic Mutations In Cancer. Nucleic Acids Res. 2019;47(D1):D941–47. doi: 10.1093/nar/gky1015. [DOI] [PMC free article] [PubMed] [Google Scholar]
- 19.Mesnage R, Biserni M, Wozniak E, et al. Comparison of transcriptome responses to glyphosate, isoxaflutole, quizalofop-p-ethyl and mesotrione in the HepaRG cell line. Toxicol Rep. 2018;5:819–26. doi: 10.1016/j.toxrep.2018.08.005. [DOI] [PMC free article] [PubMed] [Google Scholar]
- 20.Ritchie ME, Phipson B, Wu D, et al. limma powers differential expression analyses for RNA-sequencing and microarray studies. Nucleic Acids Res. 2015;43(7):e7. doi: 10.1093/nar/gkv007. [DOI] [PMC free article] [PubMed] [Google Scholar]
- 21.Gene Ontology Consortium. Gene Ontology Consortium: Going forward. Nucleic Acids Res. 2015;43:D1049–56. doi: 10.1093/nar/gku1179. [DOI] [PMC free article] [PubMed] [Google Scholar]
- 22.Wirries A, Jabari S, Jansen EP, et al. Panobinostat mediated cell death: a novel therapeutic approach for osteosarcoma. Oncotarget. 2018;9:32997–310. doi: 10.18632/oncotarget.26038. [DOI] [PMC free article] [PubMed] [Google Scholar]
- 23.Chen PC, Cheng HC, Yang SF, et al. The CCN family proteins: Modulators of bone development and novel targets in bone-associated tumors. Biomed Res Int. 2014;2014:437096. doi: 10.1155/2014/437096. [DOI] [PMC free article] [PubMed] [Google Scholar]
- 24.Horvai AE, Roy R, Borys D, O’Donnell RJ. Regulators of skeletal development: A cluster analysis of 206 bone tumors reveals diagnostically useful markers. Mod Pathol. 2012;25(11):1452–61. doi: 10.1038/modpathol.2012.110. [DOI] [PubMed] [Google Scholar]
- 25.Can E, Vieira A, Battini M, et al. Consistency over time of animal-based welfare indicators as a further step for developing a welfare assessment monitoring scheme: The case of the Animal Welfare Indicators protocol for dairy goats. J Dairy Sci. 2017;100(11):9194–204. doi: 10.3168/jds.2017-12825. [DOI] [PubMed] [Google Scholar]
- 26.McKee MD, Yadav MC, Foster BL, et al. Compounded PHOSPHO1/ALPL deficiencies reduce dentin mineralization. J Dent Res. 2013;92(8):721–27. doi: 10.1177/0022034513490958. [DOI] [PMC free article] [PubMed] [Google Scholar]
- 27.Gasque KC, Foster BL, Kuss P, et al. Improvement of the skeletal and dental hypophosphatasia phenotype in Alpl−/− mice by administration of soluble (non-targeted) chimeric alkaline phosphatase. Bone. 2015;72:137–47. doi: 10.1016/j.bone.2014.11.017. [DOI] [PMC free article] [PubMed] [Google Scholar]
- 28.Liu C, Wang X, Zhang H, et al. Immortalized mouse floxed Fam20c dental papillar mesenchymal and osteoblast cell lines retain their primary characteristics. J Cell Physiol. 2015;230(11):2581–87. doi: 10.1002/jcp.25008. [DOI] [PMC free article] [PubMed] [Google Scholar]
- 29.Ishikawa HO, Xu A, Ogura E, et al. The Raine syndrome protein FAM20C is a Golgi kinase that phosphorylates bio-mineralization proteins. PLoS One. 2012;7(8):e42988. doi: 10.1371/journal.pone.0042988. [DOI] [PMC free article] [PubMed] [Google Scholar]
- 30.Deng R, Zhang J, Chen J. lncRNA SNHG1 negatively regulates miRNA1013p to enhance the expression of ROCK1 and promote cell proliferation, migration and invasion in osteosarcoma. Int J Mol Med. 2019;43(3):1157–66. doi: 10.3892/ijmm.2018.4039. [DOI] [PMC free article] [PubMed] [Google Scholar]
- 31.Huang MW, Chen CW, Lin WC, et al. SVM and SVM ensembles in breast cancer prediction. PLoS One. 2017;12(1):e0161501. doi: 10.1371/journal.pone.0161501. [DOI] [PMC free article] [PubMed] [Google Scholar]
- 32.Yan L, Tian L, Liu S. Combining large number of weak biomarkers based on AUC. Stat Med. 2015;34(29):3811–30. doi: 10.1002/sim.6600. [DOI] [PMC free article] [PubMed] [Google Scholar]
- 33.Sarvari BK, Sankara Mahadev D, Rupa S, Mastan SA. Detection of bone metastases in breast cancer (BC) patients by serum tartrate-resistant acid phosphatase 5b (TRACP 5b), a bone resorption marker and serum alkaline phosphatase (ALP), a bone formation marker, in lieu of whole body skeletal scintigraphy with technetium99m MDP. Indian J Clin Biochem. 2015;30(1):66–71. doi: 10.1007/s12291-013-0399-8. [DOI] [PMC free article] [PubMed] [Google Scholar]
- 34.Li Z, Dou P, Liu T, He S. Application of long noncoding RNAs in osteosarcoma: Biomarkers and therapeutic targets. Cell Physiol Biochem. 2017;42(4):1407–19. doi: 10.1159/000479205. [DOI] [PubMed] [Google Scholar]
- 35.Sun K, Zhao J. A risk assessment model for the prognosis of osteosarcoma utilizing differentially expressed lncRNAs. Mol Med Rep. 2019;19(2):1128–38. doi: 10.3892/mmr.2018.9768. [DOI] [PMC free article] [PubMed] [Google Scholar]
- 36.Agustina H, Asyifa I, Aziz A, Hernowo BS. The role of osteocalcin and alkaline phosphatase immunohistochemistry in osteosarcoma diagnosis. Patholog Res Int. 2018;2018:6346409. doi: 10.1155/2018/6346409. [DOI] [PMC free article] [PubMed] [Google Scholar]
- 37.Yu S, Fourman MS, Mahjoub A, et al. Lung cells support osteosarcoma cell migration and survival. BMC Cancer. 2017;17(1):78. doi: 10.1186/s12885-017-3047-5. [DOI] [PMC free article] [PubMed] [Google Scholar]
Associated Data
This section collects any data citations, data availability statements, or supplementary materials included in this article.
Supplementary Materials
Supplementary Table 1.
The sequences of qRP-PCR primers.
| Gene name | Primer sequences |
|---|---|
| ALPL F | CGTGGAACATTCTGGATCTGAC |
| ALPL R | GGAGTGAGTGAGTGAGCAAGG |
| FAM20C F | CTGACTACGAGAGGCACAATG |
| FAM20C R | TGGCTGGAGAGATGAAGAAGG |
| CTPS1 F | CAGTCATCCCGTGGTCGTAG |
| CTPS1 R | TTCCAAGTAGTCTGCGTCTCC |
| MYDGF F | AATGAGCAATGGCAGATGAGTC |
| MYDGF R | TTCAAATGCGGCTTTAGAGTAGG |
| RGS3 F | GTCATTCAAGCCCACCTCAG |
| RGS3 R | CACAAGCCAACCAGAACTCC |
| STT3A F | TGTGTTGCTGTTGTATATTGTTACC |
| STT3A R | CTCTCTAGGGACCTGTTACTGG |
| ATP1B3 F | AGAAGAACAGAAGAACCTCACAG |
| ATP1B3 R | CACAATCTATCCTTGGCACTCC |