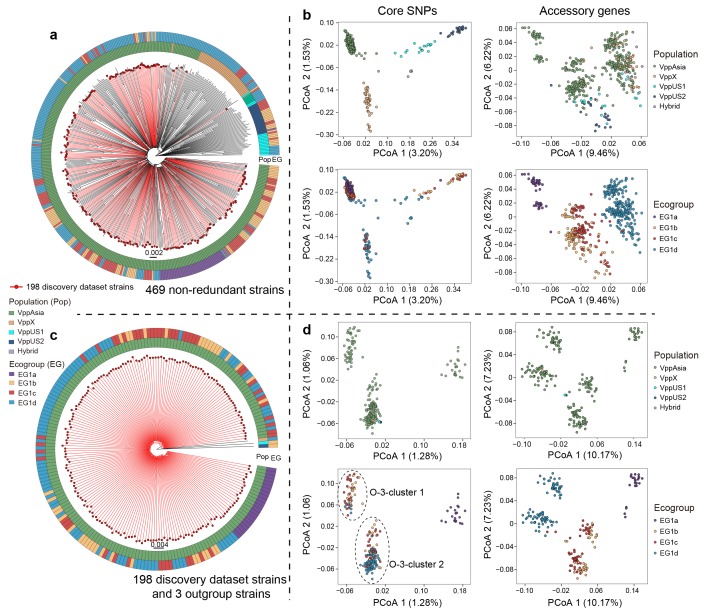
Figure 1. Neighbor-joining (NJ) trees and principle coordination analysis (PCoA) of 469 non-redundant dataset and 198 strain discovery dataset.
(a, c) NJ trees of strains from two datasets. Red branches indicate strains in the discovery dataset. The colored circles indicate populations (inner) and ecogroups (outer) according to the legend on the left. (b, d) PCoA analysis of strains from two datasets based on core SNPs and accessory genes. Colors of points indicate the populations and ecogroups according to the legend on the right. Two distinct genotype clusters separated by O-3 variants were highlighted with dashed ellipses.


