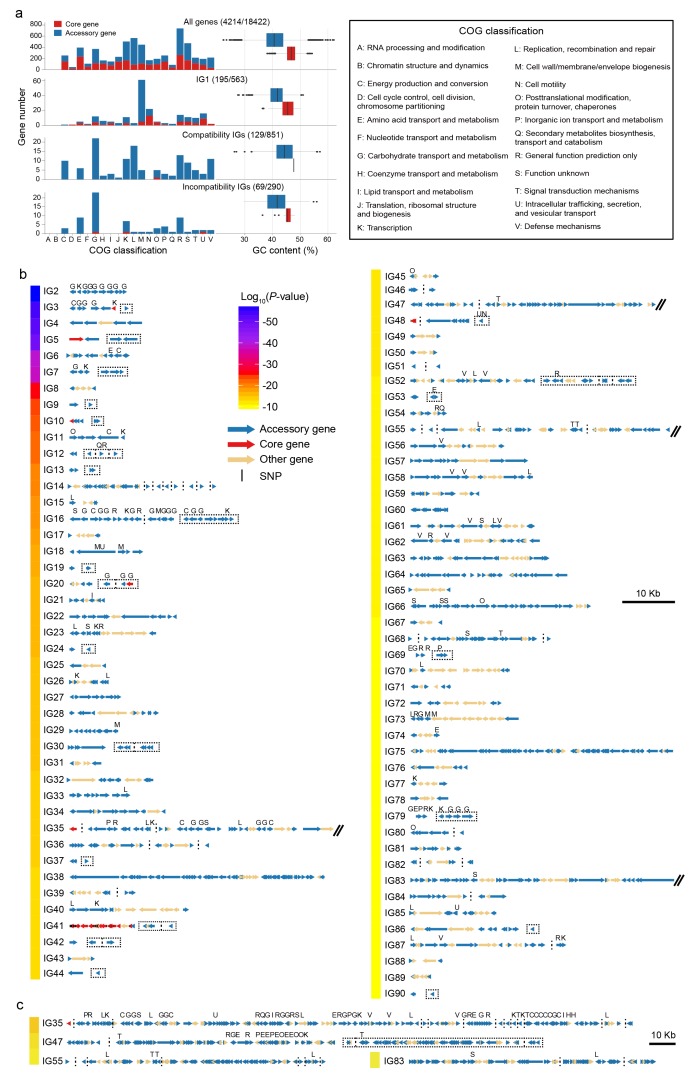
Figure 5. Characteristics of detected interaction groups.
(a) COG classification and GC content of all analyzed genes (top panel) and of different types of coadaptated genes (lower panels). Red for core genes and blue for accessory genes. The first number in brackets is the number of genes with COG annotation and the second is the total number of genes in the category. (b) Gene maps of different IGs. The colors of the bar on the left indicates average linkage strength of the loci in each IG. Arrows indicate genes. Acessory genes are shown in blue and genes with no coadaptation signal are shown in orange. Red genes indicated core genes containing coadapted SNPs which are indicated with black vertical lines. Vertical dotted lines were used to split compatible genes with physical distance larger than 3 kb, or genes located in different contigs, chromosomes and strains. Dotted rectangles indicate incompatible genes. IGs with genome block length larger than 60 kb are broken by double slash and shown in (c) after zooming out. COG classification labels are shown above the genes.


