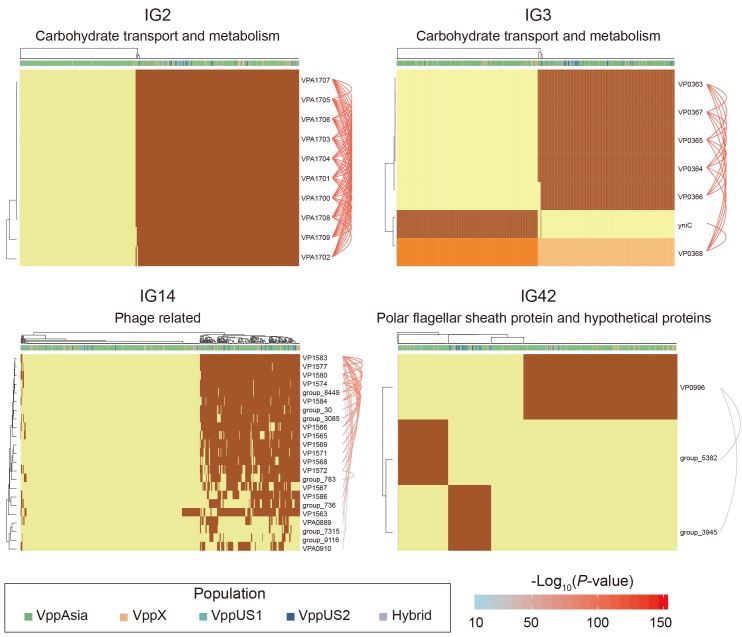
Figure 6. Four representative interaction groups.
Hierarchical clustering of 469 non-redundant strains (columns) based on coadaptation loci (rows) of 4 representative IGs. Colors of the heatmap indicate the status of genetic variants, with light orange/orange for two alleles of a SNP, light yellow/brown for absence and presence of the accessory genes. Bar colors below the upper tree indicate the populations of strains according to the legend. A summary of the function of the involved genes is shown on the top of each heatmap. Arcs on the right indicate the causal links after ARACNE filtering, colors and the width of the arcs scale with the P values.

