

Abstract
Objective:
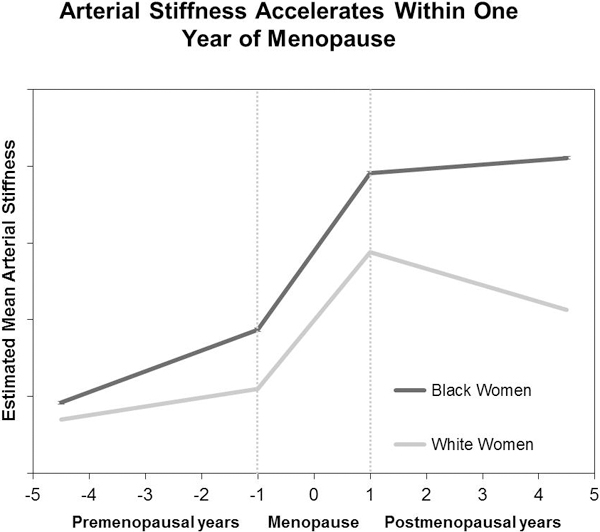
Menopause may augment age-dependent increases in arterial stiffness, with Black women having greater progression in midlife compared with White women. We sought to determine whether and when women experience changes in arterial stiffness relative to the final menstrual period (FMP), and whether these changes differ between Black and White midlife women.
Approach and Results:
We evaluated 339 participants from the SWAN Heart Ancillary study. Women had up to two carotid-femoral pulse-wave velocity (cfPWV) exams over a mean±SD of 2.3±0.5 years of follow-up. Annual % changes in cfPWV were estimated in three time segments relative to FMP and compared using piecewise linear mixed-effects models. At baseline, women were 51.1±2.8 years and 36% Black. Annual % change (95% CI) in cfPWV varied by time segments: 0.9% (−0.6%, 2.3%) for >1 year before FMP, 7.5% (4.1%, 11.1%) within one year of FMP, and −1.0% (−2.8%, 0.8%) for >1 year after FMP. Annual % change in cfPWV within one year of FMP was significantly greater than the other two time segments, p<0.05 for both comparisons. Adjusting for concurrent CVD risk factors explained part of the change estimates, but did not eliminate the difference. Black women had greater increase in cfPWV compared with White women in the first segment, p for interaction=0.04.
Conclusions:
The interval within one year of FMP is a critical period for women when vascular functional alterations occur. These findings underscore the importance of more intensive lifestyle modifications in women transitioning through menopause.
Keywords: central arterial stiffness, carotid-femoral pulse wave velocity, subclinical cardiovascular disease, menopause, menopause transition, race
Subject codes: Aging, Epidemiology, Race and Ethnicity, Risk Factors, Women, Ultrasound, Atherosclerosis, Vascular Disease
Graphical Abstract
INTRODUCTION
The risk of cardiovascular disease (CVD) increases with age in both sexes, with noticed risk acceleration in postmenopausal years in women.1 This observation suggests that the menopause transition might augment the age-dependent increase in CVD risk. In fact, women are subjected to increases in carotid intima-media thickness and adventitial diameter starting from late perimenopause,2, 3 a stage that typically starts 1–3 years before the final menstrual period (FMP), and extending to 12 months after FMP.4 These structural vascular changes in the late peri- and post-menopause are accompanied by declining endothelial function as measured by brachial artery flow-mediated dilation.5 The Study of Women’s Health across the Nation (SWAN) recently showed that women who transitioned through menopause had a significantly greater increase in central arterial stiffness compared with women who remained premenopausal or were postmenopausal at baseline.6 These findings suggest that women undergo structural and functional vascular changes as they traverse menopause, which may impact their risk of CVD later in life.
The menopause transition, specifically, the few years before and after FMP constitute a critical period in women’s lives when dynamic metabolic and physiologic changes begin to accumulate.7 This period is characterized by adverse structural changes in the carotids,2, 3 and increases in lipids,8 waist circumference,9 and metabolic syndrome.10 Additionally, dynamic hormonal changes in estradiol and follicle-stimulating hormone (FSH) occur within one year of FMP.11 Whether concurrent changes in central arterial stiffness, a measure of vascular aging and an independent predictor of CVD risk in the general population,12 occur in this period remains to be determined.
Racial differences have been reported in arterial stiffness progression in women at midlife, with Black women having greater progression compared with White women.13 SWAN is a multi-ethnic longitudinal cohort study that concurrently measured central arterial stiffness, CVD risk factors, and endogenous sex hormones as women traversed menopause. This study provides a unique opportunity to characterize vascular functional changes in the years around the FMP while adjusting for other risk factors that are modified during the menopause transition. Therefore, the aims of this study were to determine whether women experience changes in central arterial stiffness, as measured by carotid-femoral pulse-wave velocity (cfPWV), relative to the FMP and whether the magnitude of these changes differ between Black and White women.
MATERIALS AND METHODS
The authors declare that all supporting data are available within the article and in the online-only Data Supplement.
Study participants.
SWAN is an ongoing multi-ethnic, multi-site longitudinal study of the physical, biological, and psychosocial changes of the menopause transition. Detailed methods are presented elsewhere.14 In brief, 3,302 women were recruited between 1996 and 1997 from seven research sites within the US (Detroit, MI; Boston, MA; Chicago, IL; Oakland, CA; Los Angeles, CA; Newark, NJ; and Pittsburgh, PA). To be eligible for SWAN, women had to be 42–52 years old at enrollment, have an intact uterus and at least one ovary with menstrual bleeding within the past three months, not be pregnant or breast-feeding, and not have used hormones therapy within the past three months. Women self-identified as a member of 1 of 5 ethnic groups depending on the research site: White (all sites), Black (Boston, Chicago, Detroit, Pittsburgh), Chinese/Chinese American (Oakland), Hispanic (Newark) or Japanese/Japanese American (Los Angeles). The institutional review board at each participating site approved the study protocol, and all participants signed informed consent prior to participation.
Central arterial stiffness was measured as part of the SWAN Heart study, an ancillary study to SWAN designed to evaluate subclinical atherosclerosis measures in women at mid-life. Between 2001 and 2003, women from the SWAN Pittsburgh and Chicago sites were recruited to SWAN Heart (N=608) if they had no self-reported clinical CVD. By design, Pittsburgh and Chicago sites recruited only White and Black women. After a mean±SD of 2.3±0.5 years of SWAN Heart baseline visit, women were invited for a follow-up visit.
For the current analysis, we excluded women who reported CVD during the SWAN Heart follow-up period (n=11) or did not have arterial stiffness measurements (n=56). We additionally excluded 202 women for whom FMP date was not observed, see below. The final analytic sample included 339 women who contributed 537 observations with each woman having one or two measurment time points. Compared with the excluded participants, women in analytic sample were less likely to be hormone users (3% vs 24%) at baseline; otherwise, they shared similar baseline clinical characteristics.
Study outcome: central arterial stiffness.
Central arterial stiffness was assessed by cfPWV at both SWAN Heart baseline and follow-up visits using a protocol previously described.15 In brief, arterial flow waves were simultaneously and non-invasively recorded at the right carotid and femoral arteries of supine participants, using unidirectional transcutaneous Doppler flow probes (model 810-a, 10 MHz, Parks Medical Electronics, Aloha, OR). Data were scored using software developed by the Laboratory of Cardiovascular Science, Gerontology Research Center, National Institute on Aging, which averages 20 seconds worth of waveforms and determines time from the R-wave on the electrocardiogram to the foot of the averaged waveforms. Transit time of the pulse wave was calculated as the delay between the averaged carotid and femoral waveforms. Three runs were performed for each participant, and the average was used in the analysis. Distance traveled by the pulse waveform was estimated by measurement over the participant’s torso. Distance from the carotid to aortic site (at the suprasternal notch) was subtracted from the sum of the aortic to umbilicus and umbilicus to femoral sites to adjust for opposite direction of blood flow in that arterial branch. cfPWV was calculated as distance/transit time (cm/seconds) with higher cfPWV indicating a stiffer artery. Reproducibility study of cfPWV measurement was done in the same laboratory that conducted cfPWV measurements for SWAN participants, with an overall laboratory intraclass correlation of 0.77.15
Main independent variable: time since FMP.
As part of each SWAN annual visit, date of the most recent menstrual period was determined, and FMP was assigned retrospectively as the date of the participant’s last menstrual period before 12 consecutive months of amenorrhea. As a sensitivity analysis, we added 128 women to our analytic sample for whom the FMP date could not be observed due to hormone therapy or hysterectomy and/or bilateral oophorectomy and therefore, were multiply imputed as described in the Online Supplement. For observations in our analytic sample, time in years since FMP for cfPWV exam was calculated as the date on which cfPWV exam was performed minus FMP date.
Blood assays.
A fasting blood sample was obtained and analyzed with standardized protocols at both the baseline and follow-up visits of the SWAN Heart ancillary study. Lipids, glucose, and insulin were measured at the Medical Research Laboratories (Lexington, KY). Homeostasis model assessment (HOMA), an index of insulin resistance derived from glucose and insulin measures, was calculated as (fasting insulin (mU/Liter)*fasting glucose (mmoles/Liter))/22.5.16 Endogenous sex hormones were measured at the University of Michigan Endocrine Laboratory. Since estradiol and FSH show dynamic changes throughout the menstrual cycle, cycle-day of blood draw (within 2–5 days of the menstrual cycle or not) was considered when adjusting for these hormones. A detailed description of blood assays measurement is presented in the Online Supplement.17
Study covariates.
At visits that coincide with the cfPWV exam dates, participants completed self and interviewer-administered questionnaires that included assessment of sociodemographic and life-style factors and medical history. Age, race, whether woman had financial strain, current smoking status, and ever used hormone therapy were self-reported. Physical activity was assessed via Modified Baecke Scores of Habitual Physical Activity, with higher scores indicating more physical activity.18 Menopause status was determined based on reported frequency and regularity of menstrual bleeding as follows: (1) premenopause: monthly bleeding with no perceived change in cycle interval, (2) early perimenopause: monthly bleeding with a perceived change in cycle interval, but at least one menstrual period within the past 3 months, (3) late perimenopause: 3 consecutive months of amenorrhea, and natural menopause: 12 consecutive months of amenorrhea [(4) early natural menopause: less than two years since became menopause, (5) late natural menopause: two or more years past menopause]. Medications including cholesterol, blood pressure, and diabetes medications were self-reported and interviewer-verified from medication container label. If a woman reported taking any of these medications, she was labeled as “current medication user”. Participants had their physical measurements obtained at each study visit using standardized protocols.
Age at FMP, race, and study site were time-independent variables. For financial strain, we used values that coincided with the first cfPWV scan date. Time-varying physical activity scores that coincided or were closest in time with each participant’s cfPWV scan date were used. For all other covariates, we used time-varying values that coincided in time with each participant’s cfPWV scan date.
Statistical analysis.
Clinical characteristics at baseline were compared between women with observed and imputed FMP. cfPWV was log-transformed due to skewed distribution. A nonparametric LOESS smoothing curve was used to fit cfPWV as a function of time since FMP.19 From this curve, inflection points associated with increase/decrease in cfPWV were determined.20 Since the observed inflection points were one year before and one year after the FMP, the cfPWV trajectory was divided into three time segments: segment 1: > one year before FMP, segment 2: within one year before and after FMP, and segment 3: > one year after FMP. Piecewise linear mixed-effects models were used to estimate and compare annual changes of cfPWV among time segments. Annual percent change of cfPWV in each time segment was calculated as: annual % change of cfPWV= (eestimated annual change in log-cfPWV −1)*100.21 A random intercept for each woman was included to account for baseline heterogeneity. To visualize the cfPWV trajectory, we calculated annual means of cfPWV over time since FMP as well as cfPWV estimates from the piecewise linear model. This figure was truncated at 5 years before and after FMP due to small sample size.
Study covariates were chosen based on a priori knowledge of risk factors of arterial stiffness, and by univariate analysis. The first model adjusted for age at FMP and sociodemographic factors including race, study site, and financial strain. The second model further adjusted for hormone therapy and lifestyle factors including current smoking and physical activity. The third model additionally adjusted for CVD risk factors including systolic blood pressure (SBP), waist circumference, LDL-C, and HOMA to determine if they explain any observed changes in cfPWV around FMP. Finally, we built a parsimonious model (final model) by removing variables from the third model using backward stepwise selection methods with a p-value threshold of >0.2; financial strain, physical activity, and HOMA were removed and their removal did not change the effect estimates (beta) in time segments by more than 10%.
To test whether annual changes in arterial stiffness vary between Black and White women, we included an interaction term of race with each of the three time-segments separately to avoid collinearity. Race-specific annual percent changes in cfPWV were calculated separately for each time segment using the corresponding final model.
In subsequent analyses, we tested separately whether estradiol or FSH can attenuate changes in arterial stiffness relative to time since FMP in the final model controlling for cycle-day of blood draw. Additionally, we reran the final model adjusting separately for CRP, heart rate, and medications to test whether they can explain changes in arterial stiffness relative to time since FMP. As sensitivity analyses, we reran the final model combining women with imputed and observed FMP and on women for whom cfPWV was measured at both SWAN Heart visits.
RESULTS
Study population.
On average, the baseline cfPWV was measured, (mean±SD) 1.0±3.2 years before the FMP and the follow-up cfPWV was 1.1±3.1 years after the FMP. Of the 339 women in our study, 198 (58%) had cfPWV measured at baseline and follow-up visits, 115 (34%) at baseline visit only, and 26 (8%) at follow-up visit only. Number of women/observations within time segments 1, 2, and 3 were 149 (44%) /189 (35%), 86 (25%) /144 (27%), and 104 (31%) /204 (38%), respectively. Characteristics of all women at baseline are shown in Table 1. The largest difference between women with observed and imputed FMP was ever use of hormone therapy (Online Table I). The unadjusted association between each study covariate and cfPWV is presented in Online Table II.
Table 1.
Characteristics of Study Participant at Baseline (N=339)
| Variables* | Values |
|---|---|
| Age (years) | 51.10 ± 2.80 |
| Race, N (%) | |
| White | 216 (64) |
| Black | 123 (36) |
| Financial strain, N (%) | |
| Hard to pay for basics | 107 (34) |
| No financial strain | 222 (66) |
| Current Smoker, N (%) | 64 (19) |
| Physical activity score † | 7.94 ± 1.78 |
| BMI (kg/m2) | 29.40 ± 6.59 |
| Waist circumference (cm) | 89.55 ± 14.85 |
| Systolic blood pressure (mmHg) | 119.94 ± 16.63 |
| Diastolic blood pressure (mmHg) | 76.01 ± 9.58 |
| Heart rate (beats per minute) | 71.40 ± 8.93 |
| Total Cholesterol (mg/dl) | 201.75 ± 38.75 |
| High-density lipoprotein cholesterol (mg/dl) | 57.40 ± 14.22 |
| Low-density lipoprotein cholesterol (mg/dl) | 121.62 ± 34.04 |
| Triglycerides (mg/dl), median (Q1, Q3) | 97.0 (75.0, 135.0) |
| Glucose (mg/dL), median (Q1, Q3) | 88.0 (83.0, 96.0) |
| Insulin (µIU/mL), median (Q1, Q3) | 9.1 (6.9, 13.5) |
| HOMA, median (Q1, Q3) | 2.0 (1.4, 3.1) |
| Current medication user ‡, N (%) | 66 (20) |
| Menopausal Status, N (%) | |
| Premenopause | 28 (9) |
| Early perimenopause | 161 (52) |
| Late perimenopause | 36 (11) |
| Early natural menopause | 25 (8) |
| Late natural menopause | 53 (17) |
| Age at FMP (years) | 52.02 ± 2.84 |
| Estradiol (pg/mL), median (Q1, Q3) | 28.4 (15.5, 83.6) |
| FSH (mIU/mL), median (Q1, Q3) | 36.8 (16.6, 83.9) |
| Ever used hormone therapy, N (%) | 48 (14) |
| cfPWV (cm/second), median (Q1, Q3) | 774.7 (677.8, 905.2) |
Mean ± standard deviation is presented unless specified.
Modified Baecke Scores of Habitual Physical Activity, with higher scores indicating more physical activity.
Taking medications for cholesterol, blood pressure, or diabetes.
BMI = body mass index; cfPWV = carotid-femoral pulse-wave velocity; CVD = cardiovascular disease; FMP = final menstrual period; FSH = Follicle stimulating hormone; HOMA = homeostasis model assessment.
Changes in cfPWV around menopause, Table 2 and Figure 1.
Table 2.
Annual Percent Change in Carotid-femoral Pulse Wave Velocity in Time Segments Relative to FMP
| Model* | Annual % Change † in cfPWV (95% CI) | P-Value for Pairwise Difference in Annual Change | ||||
|---|---|---|---|---|---|---|
| Segment 1 >1 Year Before FMP |
Segment 2 Within 1 Year of FMP |
Segment 3 >1 Year After FMP |
Segment 1 vs. 2 |
Segment 1 vs. 3 |
Segment 2 vs. 3 |
|
| Unadjusted | −0.20 (−1.54, 1.16) | 6.51 (3.10, 10.04) ‡ | −1.31 (−3.11, 0.52) | 0.002 | 0.313 | 0.001 |
| Model 1 | 0.95 (−0.47, 2.39) | 7.72 (4.30, 11.24) ‡ | −0.64 (−2.43, 1.18) | 0.002 | 0.146 | 0.001 |
| Model 2 | 0.87 (−0.55, 2.30) | 7.54 (4.13, 11.07) ‡ | −1.03 (−2.81, 0.79) | 0.002 | 0.082 | 0.0003 |
| Model 3 | 0.90 (−0.53, 2.34) | 5.94 (2.38, 9.62) ‡ | −1.01 (−2.98, 1.00) | 0.024 | 0.102 | 0.006 |
| Final model | 0.88 (−0.50, 2.29) | 5.74 (2.37, 9.21) ‡ | −0.81 (−2.66, 1.08) | 0.023 | 0.127 | 0.006 |
Model 1: age at FMP, race, study site and financial strain.
Model 2: model 1 + hormone therapy, smoking status, and physical activity.
Model 3: model 2 + systolic blood pressure, waist circumference, low-density lipoprotein cholesterol, and homeostatic model assessment.
Final model: model 3 but without financial strain, physical activity, and homeostatic model assessment.
Annual % change was calculated as: eestimated annual change in log-cfPWV −1)*100.
P-value < 0.05.
cfPWV = carotid-femoral pulse-wave velocity; FMP = final menstrual period.
Figure 1.
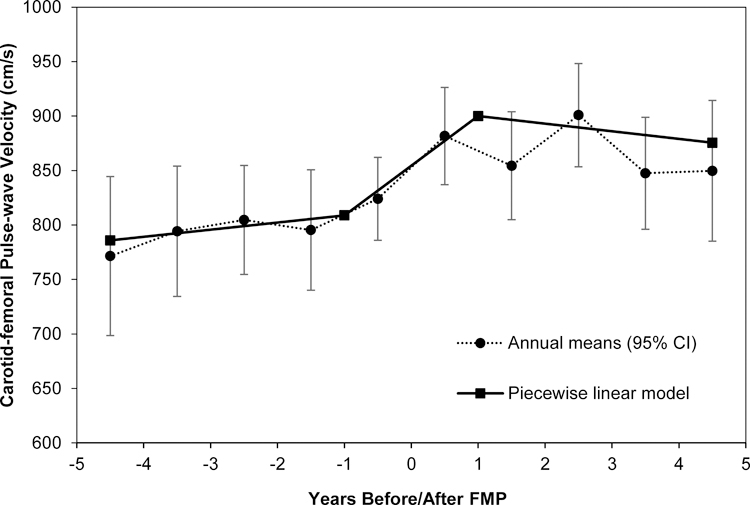
Means of cfPWV in Years around FMP
Figure showing annual mean values compared with estimated values from piecewise linear model of cfPWV over time since FMP for women from the Study of Women’s Health Across the Nation (SWAN) Heart. Model adjusted for age at FMP, race, study site, hormone therapy, smoking status, systolic blood pressure, waist circumference, and low-density lipoprotein cholesterol (final model). Error bars represent 95% CI.
FMP = final menstrual period.
In segment 2, cfPWV increased 6.5% per year and that estimated increase was significantly different from 0% (i.e. “no change”) adjusting for study covariates. There was no significant change in cfPWV in segments 1 and 3. The increase in cfPWV in segment 2 was significantly greater than the changes in segments 1 and 3. However, adjusting for midlife CVD risk factors including SBP, waist circumference, and LDL-C explained part of the estimated annual change in segment 2 (from 7.5% in model 2 to 5.9% in model 3). Based on model fit statistics, SBP and waist circumference, but not LDL-C, explained most of the variability. The estimated annual changes in cfPWV in segments 1 and 3 were not statistically different from one another.
Race interaction.
Race modified the rate of change in cfPWV only in segment 1 (Figure 2); Black and White women showed 2.0% and 0.6% annual increase in cfPWV (p-value for racial difference is 0.04), respectively. Interestingly, only Black women had a statistically significant increase in cfPWV within segment 1.
Figure 2.
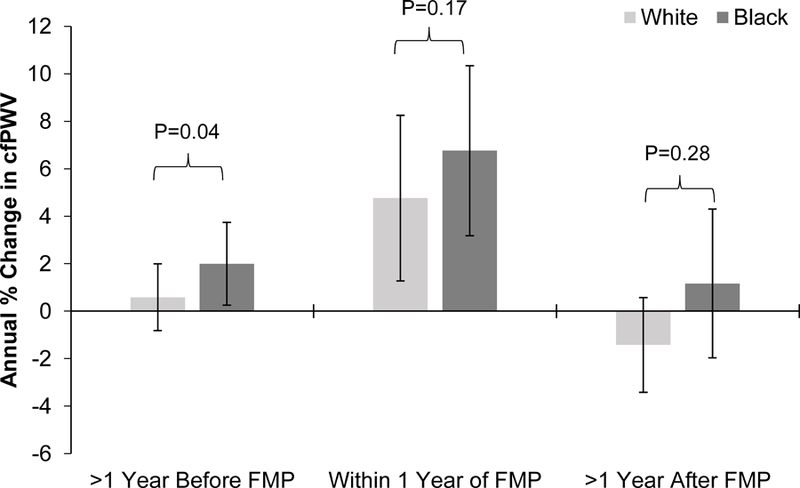
Effect Modification of Race on Annual Percent Change in cfPWV by Time Segments Relative to FMP
Interaction between race with each time segment was tested separately and annual percent change for each segment was estimated from corresponding model. Models adjusted for the other 2 time segments, age at FMP, study site, hormone therapy, smoking status, systolic blood pressure, waist circumference, and low-density lipoprotein cholesterol (final model). Error bars represent 95% CI.
cfPWV = carotid-femoral pulse-wave velocity; FMP = final menstrual period.
Additional analyses (data not shown).
Adjusting for estradiol, FSH, medications, or heart rate did not attenuate changes in cfPWV relative to the FMP. Adjusting for CRP among women with available CRP measurement (n=259) did not influence the overall conclusions.
Sensitivity analyses.
Rerunning the final model to women with imputed and observed FMP and to women who had two cfPWV measurements resulted in similar findings, (Online Table III).
DISCUSSION
The present study characterized functional vascular changes, specifically, central arterial stiffness, in relation to FMP and showed racial differences using a well-characterized cohort of women while adjusting for mid-life covariates. We demonstrated significant increases in central arterial stiffness in the one year period surrounding the FMP in women transitioning through menopause. This increase was independent of aging, mid-life CVD risk factors, estradiol, and FSH. Additionally, we showed that Black women may experience greater adverse changes in arterial stiffness starting early in the transition than White women.
Previous cross-sectional analyses suggest that postmenopausal women have faster PWV measures compared with premenopausal women.22 However, controlling for age in such analyses is critical as aging may greatly confound these associations.23 To disentangle the relative contributions of chronologic and reproductive aging to vascular stiffness, longitudinal repeated-measure studies that follow a cohort of women through the menopause transition are required.24 Using such design, previous results from SWAN have shown that women who transitioned through menopause during the study follow-up period had greater increase in central arterial stiffness compared with women who remained premenopausal or were postmenopausal at baseline.6 In the current analysis, we used time-oriented analysis to describe when critical vascular changes occur in relation to the FMP.
A similar, and slightly smaller, estimate of change in central arterial stiffness within one year of the FMP was observed after adding women with imputed FMP to women with observed FMP. However, women with imputed FMP were healthier as they were less likely to smoke and had lower blood pressure compared with women with observed FMP, suggesting that analyses including women with imputed FMP may better reflect the population represented by SWAN Heart.
The aorta regulates the pulsatile blood flow from the heart into steady flow of blood supply to peripheral organs.25 Aging and other CVD risk factors including hypertension, hyperlipidemia, and central adiposity can increase arterial stiffness through loss of vascular elasticity and increased collagen deposition.26, 27 Consequently, arterial stiffness can result in left ventricular dysfunction,28 low coronary perfusion,29 and/or end-organ damage.30, 31 Interestingly, the increase in arterial stiffness within 1 year of FMP remained significantly greater than the increase before 1 year before FMP, however this difference was attenuated after adjusting for CVD risk factors. Although the annual percent increase in cfPWV within 1 year of FMP itself remained significantly different from 0% after adjusting for mid-life CVD risk factors, our results suggest that mid-life CVD risk factors may explain part of the difference in arterial stiffness progression across the menopause transition.
Estradiol and FSH dynamically change during the menopause transition.11 Furthermore, estrogen receptor α and ß are detected on vessel walls in human vasculature, and estradiol is thought to preserve arterial stiffness through vasodilation and vascular-matrix formation.32 Therefore, one would expect that estradiol or FSH may explain functional changes in central arteries observed during the menopause transition. In the current study, these hormones did not explain changes or differences in arterial stiffness as women transitioned through menopause. Apart from traditional CVD risk factors, it seems that other mechanisms including inflammation and adipocytokine secretion may contribute to the changes in central arteries during the menopause transition. Several studies suggest that systemic inflammation is involved in the pathogenesis of arterial stiffness,33 and that the menopause transition is associated with a rise in chronic low-grade inflammation,34 which may result in accelerating arterial stiffness.35 However, adjustment for CRP among women with available CRP measurement did not explain our findings. Additionally, women transitioning through menopause experience increased waist circumference and visceral adiposity.9, 36 These ectopic fat depots are thought to alter serum levels of adipocytokines with increase in leptin and decrease in adiponectin, which may have deleterious health effects on mid-life women.37 Consequently, greater levels of leptin and lower levels of adiponectin in women transitioning through menopause may contribute to worsening arterial stiffness.38 However, adipocytokine data were not available for most SWAN Heart participants.
Results from the current analysis are in line with previous studies, highlighting the time around menopause as a period when critical changes in the vasculature and CVD risk factors accumulate.2, 3, 8–10, 36 These changes may increase the likelihood of CVD later in life.39 Our findings emphasize that women should be made aware that their cardiovascular health is expected to be adversely affected during the menopause transition. Therefore, frequent monitoring of CVD risk factors early in the menopause transition may be prudent as women can be counseled to stress lifestyle changes.40 Interestingly, healthy lifestyle during the midlife is prospectively associated with less carotid atherosclerosis.41 Future research should examine whether modifying arterial stiffness in women transitioning through menopause is associated with favorable cardiovascular outcomes later in life.
Racial differences in arterial stiffness.
Arterial stiffness is generally greater in Black than in White women.42 This racial difference is also evident in midlife women, with Black women showing greater progression of arterial stiffness compared with their White counterparts.13 In the current study, Black and White women did not have uniform trajectories of arterial stiffness around the FMP, such that arterial stiffness increased in Black women starting in the years preceding the one year before the FMP, while a similar increase earlier in the transition was not evident in White women. The reported effect modification of race are supported by previous studies showing racial differences among midlife women in subclinical vascular measures.13, 43, 44 Given that Blacks have greater prevalence and earlier onset of CVD risk factors and higher CVD mortality compared with Whites, these results underscore the importance of aggressive and frequent monitoring of risk factors early in the menopause transition among Black women.45, 46
Study limitations.
About 42% of women in this study had a single measurement of arterial stiffness. However, the statistical analysis method we used is appropriate for handling unbalanced data with 1–2 time points of data per subject and yielding unbiased estimates of change.47 To further support this approach, similar estimates of change and overall conclusions were found from analysis of women with two time points of data. Another limitation is that the follow up was relatively short (mean of 2.3 years). Nevertheless, about 40% of study participants had traversed menopause between the baseline and follow-up visits.
Conclusions.
The one year before and after FMP is a critical period in women’s lives when vascular functional alterations occur. In our study, arterial stiffness significantly increased within one year of the FMP independent of aging, CVD risk factors, estradiol, and FSH. Our results are consistent with previous findings showing significant vascular structural changes and CVD risk factors worsening around the time of FMP. Collectively, our findings underscore the importance of frequent and timely monitoring of CVD risk factors and stressing more intensive lifestyle modifications in women transitioning through menopause.
Supplementary Material
Highlights.
The menopause transition can augment age-dependent increase in arterial stiffness in mid-life women.
Modifying CVD risk factors including blood pressure, central adiposity, and lipid profile may mitigate arterial stiffness progression in women transitioning through menopause.
Our findings underscore the importance of frequent and timely monitoring of CVD risk factors and stressing more intensive lifestyle modifications in women transitioning through menopause.
Acknowledgements:
Clinical Centers: University of Michigan, Ann Arbor – Siobán Harlow, PI 2011 – present, MaryFran Sowers, PI 1994–2011; Massachusetts General Hospital, Boston, MA – Joel Finkelstein, PI 1999 – present; Robert Neer, PI 1994 – 1999; Rush University, Rush University Medical Center, Chicago, IL – Howard Kravitz, PI 2009 – present; Lynda Powell, PI 1994 – 2009; University of California, Davis/Kaiser – Ellen Gold, PI; University of California, Los Angeles – Gail Greendale, PI; Albert Einstein College of Medicine, Bronx, NY – Carol Derby, PI 2011 – present, Rachel Wildman, PI 2010 – 2011; Nanette Santoro, PI 2004 – 2010; University of Medicine and Dentistry – New Jersey Medical School, Newark – Gerson Weiss, PI 1994 – 2004; and the University of Pittsburgh, Pittsburgh, PA – Karen Matthews, PI.
NIH Program Office: National Institute on Aging, Bethesda, MD – Winifred Rossi 2012 - present; Sherry Sherman 1994 – 2012; Marcia Ory 1994 – 2001; National Institute of Nursing Research, Bethesda, MD – Program Officers.
Central Laboratory: University of Michigan, Ann Arbor – Daniel McConnell (Central Ligand Assay Satellite Services).
Coordinating Center: University of Pittsburgh, Pittsburgh, PA – Maria Mori Brooks, PI 2012 - present; Kim Sutton-Tyrrell, PI 2001 – 2012; New England Research Institutes, Watertown, MA - Sonja McKinlay, PI 1995 – 2001.
Steering Committee: Susan Johnson, Current Chair
Chris Gallagher, Former Chair
We thank the study staff at each site and all the women who participated in SWAN.
Sources of Funding:
The Study of Women’s Health Across the Nation (SWAN) has grant support from the National Institutes of Health (NIH), DHHS, through the National Institute on Aging (NIA), the National Institute of Nursing Research (NINR) and the NIH Office of Research on Women’s Health (ORWH) (Grants U01NR004061; U01AG012505, U01AG012535, U01AG012531, U01AG012539, U01AG012546, U01AG012553, U01AG012554, U01AG012495). The content of this manuscript is solely the responsibility of the authors and does not necessarily represent the official views of the NIA, NINR, ORWH or the NIH.
SWAN Heart was supported by grants from the NHLBI (HL065581, HL065591).
Abbreviations list:
- BMI
body mass index
- cfPWV
carotid femoral pulse-wave velocity
- CVD
cardiovascular disease
- FMP
final menstrual period
- FSH
follicle-stimulating hormone
- HOMA
homeostasis model assessment
- LDL-C
low-density lipoprotein cholesterol
- LLD
lower limit of detection
- SBP
systolic blood pressure
- SWAN
Study of Women’s Health Across the Nation
Footnotes
Disclosures:
Saad Samargandy: Nothing to disclose
Karen A. Matthews: Nothing to disclose
Maria M. Brooks: Serves as a DSMB member for Cerus Corporation
Emma Barinas-Mitchell: Nothing to disclose
Jared W. Magnani: Nothing to disclose
Imke Janssen: Nothing to disclose
Steven M. Hollenberg: Nothing to disclose
Samar R. El Khoudary: Nothing to disclose
REFERENCES
- 1.Benjamin EJ, Virani SS, Callaway CW, et al. Heart disease and stroke statistics-2018 update: A report from the american heart association. Circulation 2018;137:e67–e492 [DOI] [PubMed] [Google Scholar]
- 2.El Khoudary SR, Wildman RP, Matthews K, Thurston RC, Bromberger JT, Sutton-Tyrrell K. Progression rates of carotid intima-media thickness and adventitial diameter during the menopausal transition. Menopause 2013;20:8–14 [DOI] [PMC free article] [PubMed] [Google Scholar]
- 3.Wildman RP, Colvin AB, Powell LH, Matthews KA, Everson-Rose SA, Hollenberg S, Johnston JM, Sutton-Tyrrell K. Associations of endogenous sex hormones with the vasculature in menopausal women: The study of women’s health across the nation (swan). Menopause 2008;15:414–421 [DOI] [PMC free article] [PubMed] [Google Scholar]
- 4.Harlow SD, Gass M, Hall JE, Lobo R, Maki P, Rebar RW, Sherman S, Sluss PM, de Villiers TJ. Executive summary of the stages of reproductive aging workshop +10: Addressing the unfinished agenda of staging reproductive aging. Climacteric 2012;15:105–114 [DOI] [PMC free article] [PubMed] [Google Scholar]
- 5.Moreau KL, Hildreth KL, Meditz AL, Deane KD, Kohrt WM. Endothelial function is impaired across the stages of the menopause transition in healthy women. J. Clin. Endocrinol. Metab 2012;97:4692–4700 [DOI] [PMC free article] [PubMed] [Google Scholar]
- 6.Khan ZA, Janssen I, Mazzarelli JK, Powell LH, Dumasius A, Everson-Rose SA, Barinas-Mitchell E, Matthews K, El Khoudary SR, Weinstock PJ, Hollenberg SM. Serial studies in subclinical atherosclerosis during menopausal transition (from the study of women’s health across the nation). Am. J. Cardiol 2018;122:1161–1168 [DOI] [PMC free article] [PubMed] [Google Scholar]
- 7.El Khoudary SR, Thurston RC. Cardiovascular implications of the menopause transition: Endogenous sex hormones and vasomotor symptoms. Obstet. Gynecol. Clin. North Am 2018;45:641–661 [DOI] [PubMed] [Google Scholar]
- 8.Matthews KA, Crawford SL, Chae CU, Everson-Rose SA, Sowers MF, Sternfeld B, Sutton-Tyrrell K. Are changes in cardiovascular disease risk factors in midlife women due to chronological aging or to the menopausal transition? J. Am. Coll. Cardiol 2009;54:2366–2373 [DOI] [PMC free article] [PubMed] [Google Scholar]
- 9.Sowers M, Zheng H, Tomey K, Karvonen-Gutierrez C, Jannausch M, Li X, Yosef M, Symons J. Changes in body composition in women over six years at midlife: Ovarian and chronological aging. J. Clin. Endocrinol. Metab 2007;92:895–901 [DOI] [PMC free article] [PubMed] [Google Scholar]
- 10.Janssen I, Powell LH, Crawford S, Lasley B, Sutton-Tyrrell K. Menopause and the metabolic syndrome: The study of women’s health across the nation. Arch. Intern. Med 2008;168:1568–1575 [DOI] [PMC free article] [PubMed] [Google Scholar]
- 11.Randolph JF, Zheng H, Sowers MR, Crandall C, Crawford S, Gold EB, Vuga M. Change in follicle-stimulating hormone and estradiol across the menopausal transition: Effect of age at the final menstrual period. The Journal of Clinical Endocrinology & Metabolism 2011;96:746–754 [DOI] [PMC free article] [PubMed] [Google Scholar]
- 12.Vlachopoulos C, Aznaouridis K, Stefanadis C. Prediction of cardiovascular events and all-cause mortality with arterial stiffness: A systematic review and meta-analysis. J. Am. Coll. Cardiol 2010;55:1318–1327 [DOI] [PubMed] [Google Scholar]
- 13.Birru MS, Matthews KA, Thurston RC, Brooks MM, Ibrahim S, Barinas-Mitchell E, Janssen I, Sutton-Tyrrell K. African american ethnicity and cardiovascular risk factors are related to aortic pulse wave velocity progression. Am. J. Hypertens 2011;24:809. [DOI] [PMC free article] [PubMed] [Google Scholar]
- 14.Sowers MFR, Crawford SL, Sternfeld B, Morganstein D, Gold EB, Greendale GA, Evans DA, Neer R, Matthews KA, Sherman S. Swan: A multicenter, multiethnic, community-based cohort study of women and the menopausal transition 2000
- 15.Sutton-Tyrrell K, Mackey RH, Holubkov R, Vaitkevicius PV, Spurgeon HA, Lakatta EG. Measurement variation of aortic pulse wave velocity in the elderly. Am. J. Hypertens 2001;14:463–468 [DOI] [PubMed] [Google Scholar]
- 16.Matthews D, Hosker J, Rudenski A, Naylor B, Treacher D, Turner R. Homeostasis model assessment: Insulin resistance and β-cell function from fasting plasma glucose and insulin concentrations in man. Diabetologia 1985;28:412–419 [DOI] [PubMed] [Google Scholar]
- 17.Friedewald WT, Levy RI, Fredrickson DS. Estimation of the concentration of low-density lipoprotein cholesterol in plasma, without use of the preparative ultracentrifuge. Clin. Chem 1972;18:499–502 [PubMed] [Google Scholar]
- 18.Sternfeld B, Ainsworth BE, Quesenberry CP. Physical activity patterns in a diverse population of women. Prev. Med 1999;28:313–323 [DOI] [PubMed] [Google Scholar]
- 19.Cleveland WS, Devlin SJ. Locally weighted regression: An approach to regression analysis by local fitting. Journal of the American statistical association 1988;83:596–610 [Google Scholar]
- 20.Greendale GA, Sowers M, Han W, Huang MH, Finkelstein JS, Crandall CJ, Lee JS, Karlamangla AS. Bone mineral density loss in relation to the final menstrual period in a multiethnic cohort: Results from the study of women’s health across the nation (swan). J. Bone Miner. Res 2012;27:111–118 [DOI] [PMC free article] [PubMed] [Google Scholar]
- 21.Benoit K Linear regression models with logarithmic transformations. London School of Economics, London 2011;22:23–36 [Google Scholar]
- 22.Zaydun G, Tomiyama H, Hashimoto H, Arai T, Koji Y, Yambe M, Motobe K, Hori S, Yamashina A. Menopause is an independent factor augmenting the age-related increase in arterial stiffness in the early postmenopausal phase. Atherosclerosis 2006;184:137–142 [DOI] [PubMed] [Google Scholar]
- 23.O’Neill SM, Liu J, O’Rourke MF, Khoo SK. The menopausal transition does not appear to accelerate age-related increases in arterial stiffness. Climacteric 2013;16:62–69 [DOI] [PubMed] [Google Scholar]
- 24.Thurston RC, Karvonen-Gutierrez CA, Derby CA, El Khoudary SR, Kravitz HM, Manson JE. Menopause versus chronologic aging: Their roles in women’s health. Menopause 2018;25:849–854 [DOI] [PubMed] [Google Scholar]
- 25.Laurent S, Cockcroft J, Van Bortel L, Boutouyrie P, Giannattasio C, Hayoz D, Pannier B, Vlachopoulos C, Wilkinson I, Struijker-Boudier H. Expert consensus document on arterial stiffness: Methodological issues and clinical applications. Eur. Heart J 2006;27:2588–2605 [DOI] [PubMed] [Google Scholar]
- 26.Taquet A, Bonithon-Kopp C, Simon A, Levenson J, Scarabin Y, Malmejac A, Ducimetiere P, Guize L. Relations of cardiovascular risk factors to aortic pulse wave velocity in asymptomatic middle-aged women. Eur. J. Epidemiol 1993;9:298–306 [DOI] [PubMed] [Google Scholar]
- 27.Lee HJ, Hwang SY, Hong HC, Ryu JY, Seo JA, Kim SG, Kim NH, Choi DS, Baik SH, Choi KM, Yoo HJ. Waist-to-hip ratio is better at predicting subclinical atherosclerosis than body mass index and waist circumference in postmenopausal women. Maturitas 2015;80:323–328 [DOI] [PubMed] [Google Scholar]
- 28.Russo C, Jin Z, Palmieri V, Homma S, Rundek T, Elkind MS, Sacco RL, Di Tullio MR. Arterial stiffness and wave reflection: Sex differences and relationship with left ventricular diastolic function. Hypertension 2012;60:362–368 [DOI] [PMC free article] [PubMed] [Google Scholar]
- 29.Ikonomidis I, Lekakis J, Papadopoulos C, Triantafyllidi H, Paraskevaidis I, Georgoula G, Tzortzis S, Revela I, Kremastinos DT. Incremental value of pulse wave velocity in the determination of coronary microcirculatory dysfunction in never-treated patients with essential hypertension. Am. J. Hypertens 2008;21:806–813 [DOI] [PubMed] [Google Scholar]
- 30.Laurent S, Katsahian S, Fassot C, Tropeano AI, Gautier I, Laloux B, Boutouyrie P. Aortic stiffness is an independent predictor of fatal stroke in essential hypertension. Stroke 2003;34:1203–1206 [DOI] [PubMed] [Google Scholar]
- 31.Ohya Y, Iseki K, Iseki C, Miyagi T, Kinjo K, Takishita S. Increased pulse wave velocity is associated with low creatinine clearance and proteinuria in a screened cohort. Am. J. Kidney Dis 2006;47:790–797 [DOI] [PubMed] [Google Scholar]
- 32.Mendelsohn ME, Karas RH. The protective effects of estrogen on the cardiovascular system. N. Engl. J. Med 1999;340:1801–1811 [DOI] [PubMed] [Google Scholar]
- 33.Yasmin, McEniery CM, Wallace S, Mackenzie IS, Cockcroft JR, Wilkinson IB. C-reactive protein is associated with arterial stiffness in apparently healthy individuals. Arterioscler. Thromb. Vasc. Biol 2004;24:969–974 [DOI] [PubMed] [Google Scholar]
- 34.Vural P, Akgul C, Canbaz M. Effects of hormone replacement therapy on plasma pro-inflammatory and anti-inflammatory cytokines and some bone turnover markers in postmenopausal women. Pharmacol. Res 2006;54:298–302 [DOI] [PubMed] [Google Scholar]
- 35.Woodard GA, Mehta VG, Mackey RH, Tepper P, Kelsey SF, Newman AB, Sutton-Tyrrell K. C-reactive protein is associated with aortic stiffness in a cohort of african american and white women transitioning through menopause. Menopause 2011;18:1291–1297 [DOI] [PMC free article] [PubMed] [Google Scholar]
- 36.Lovejoy JC, Champagne CM, de Jonge L, Xie H, Smith SR. Increased visceral fat and decreased energy expenditure during the menopausal transition. Int. J. Obes. (Lond.) 2008;32:949–958 [DOI] [PMC free article] [PubMed] [Google Scholar]
- 37.Lee CG, Carr MC, Murdoch SJ, Mitchell E, Woods NF, Wener MH, Chandler WL, Boyko EJ, Brunzell JD. Adipokines, inflammation, and visceral adiposity across the menopausal transition: A prospective study. J. Clin. Endocrinol. Metab 2009;94:1104–1110 [DOI] [PMC free article] [PubMed] [Google Scholar]
- 38.Zachariah JP, Hwang S, Hamburg NM, Benjamin EJ, Larson MG, Levy D, Vita JA, Sullivan LM, Mitchell GF, Vasan RS. Circulating adipokines and vascular function: Cross-sectional associations in a community-based cohort. Hypertension 2016;67:294–300 [DOI] [PMC free article] [PubMed] [Google Scholar]
- 39.Matthews KA, El Khoudary SR, Brooks MM, Derby CA, Harlow SD, Barinas-Mitchell EJ, Thurston RC. Lipid changes around the final menstrual period predict carotid subclinical disease in postmenopausal women. Stroke 2017;48:70–76 [DOI] [PMC free article] [PubMed] [Google Scholar]
- 40.Brown HL, Warner JJ, Gianos E, Gulati M, Hill AJ, Hollier LM, Rosen SE, Rosser ML, Wenger NK, American Heart A, the American College of O, Gynecologists. Promoting risk identification and reduction of cardiovascular disease in women through collaboration with obstetricians and gynecologists: A presidential advisory from the american heart association and the american college of obstetricians and gynecologists. Circulation 2018 [DOI] [PubMed]
- 41.Wang D, Jackson EA, Karvonen-Gutierrez CA, Elliott MR, Harlow SD, Hood MM, Derby CA, Sternfeld B, Janssen I, Crawford SL, Huang MH, El Khoudary SR, Chae CU, Baylin A. Healthy lifestyle during the midlife is prospectively associated with less subclinical carotid atherosclerosis: The study of women’s health across the nation. Journal of the American Heart Association 2018;7:e010405. [DOI] [PMC free article] [PubMed] [Google Scholar]
- 42.Din-Dzietham R, Couper D, Evans G, Arnett DK, Jones DW. Arterial stiffness is greater in african americans than in whites: Evidence from the forsyth county, north carolina, aric cohort. Am. J. Hypertens 2004;17:304–313 [DOI] [PubMed] [Google Scholar]
- 43.Peterson LM, Matthews KA, Derby CA, Bromberger JT, Thurston RC. The relationship between cumulative unfair treatment and intima media thickness and adventitial diameter: The moderating role of race in the study of women’s health across the nation. Health Psychol 2016;35:313–321 [DOI] [PMC free article] [PubMed] [Google Scholar]
- 44.Woodard GA, Narla VV, Ye R, Cauley JA, Thompson T, Matthews KA, Sutton-Tyrrell K. Racial differences in the association between carotid plaque and aortic and coronary artery calcification among women transitioning through menopause. Menopause (New York, N.Y.) 2012;19:157–163 [DOI] [PMC free article] [PubMed] [Google Scholar]
- 45.Howard G, Safford MM, Moy CS, Howard VJ, Kleindorfer DO, Unverzagt FW, Soliman EZ, Flaherty ML, McClure LA, Lackland DT, Wadley VG, Pulley L, Cushman M. Racial differences in the incidence of cardiovascular risk factors in older black and white adults. J. Am. Geriatr. Soc 2017;65:83–90 [DOI] [PMC free article] [PubMed] [Google Scholar]
- 46.Carnethon MR, Pu J, Howard G, et al. Cardiovascular health in african americans: A scientific statement from the american heart association. Circulation 2017;136:e393–e423 [DOI] [PubMed] [Google Scholar]
- 47.Singer JD, Willett JB. Applied longitudinal data analysis: Modeling change and event occurrence New York;Oxford;: Oxford University Press; 2003. [Google Scholar]
Associated Data
This section collects any data citations, data availability statements, or supplementary materials included in this article.