Abstract
Introduction:
Migraine is a severe kind of headache with the chance hereditary of 50%. Molecular studies can promote understanding of migraine pathophysiology. One of which is bioinformatics approach that could provide additional information related to the identified biomarkers.
Methods:
In this research, migraine genes are studies in terms of interaction pattern to introduce important individuals. Through STRING database Plug-in in Cytoscape, candidate genes for migraine were retrieved and analyzed by related applications. Based on centrality and action types (expression, activation, and inhibition) genes were screened.
Results:
Numbers of 33 central genes including seven hub-bottlenecks were identified which 70% of central genes were involved in expression action with each other. Activation was dominate action relative to inhibition between the central genes.
Conclusion:
The finding indicates that insulin is the most important gene relative to migraine. It seems regulation of metabolism play critical role in control of migraine.
Keywords: Migraine disorders, Protein interaction maps, Genes
Highlights
Gene activation is the dominant actor in the interactome of migraine.
Insulin has been found as the most significant related gene in migraine.
Migraine could be a metabolism-dependent disorder.
Plain Language Summary
Migraine pain disturbs the patient’s lifestyle. There is a lot of information about migraine, however, its management still needs much research. In this study, the molecular aspects of migraine are evaluated to find its controllable biological factors. Targeting these factors may be useful in migraine treatment. The findings of this study showed that metabolism control, especially insulin regulation, plays a critical role in migraine.
1. Introduction
Migraine is a complex episodic headache and is known as the sixth cause of reducing the quality of life condition according to the WHO report. Also, its incidence is higher in women (Goadsby et al., 2017). This type of headache is usually associated with some other problems, like nausea, vomiting, sensitivity to light, and sound that could lead to aura (Pellacani et al., 2016). High-frequency headache, medication overuse, obesity and several risk factors are important in migraine progression (Moriarty & Mallick-Searle, 2016). Understanding the mechanisms of this condition is still under investigation. The diagnosis of migraine is mostly based on clinical assessments (Shin, Shin, & Kim, 2017).
Pathophysiological studies of migraine suggest that it is associated with vascular system inflammation (Mastia et al., 2016). Molecular studies have identified some molecular agents in this regard such as different neuropeptides and cytokines such as C-Reactive Protein (CRP), Interleukin-1 (IL-1), IL-6, and Tumor Necrosis Factor-α (TNF-α) (Mastia et al., 2016). High throughput studies could be beneficial to introduce a large number of potential biomarkers in different kinds of diseases. There are some genomic, proteomic, and metabolomic analyses related to deciphering the risk of migraine. These approaches introduce potential biomarkers for migraine that can be useful for diagnosis and treatments (Gerring, Powell, Montgomery, & Nyholt, 2018; Mastithe et al., 2016; Shin et al., 2017; Tafuri et al., 2015).
Bioinformatics can also offer more in this regard. By analyzing genes in a whole interacting pattern, the role of each one could be better characterized. In fact, any changes in the phenotype is related to alteration in interaction of these molecules and in this way, a specific biological answer could be found. This biological response could cause abnormal behavior, which can be considered as a disease state (Tavirani et al., 2018).
In light of this phenomenon and via network analysis, many genes related to a specific disorder could be screened and analyzed to recognize critical genes which can be nominated as diagnostic agents or drug targets (Rezaei-Tavirani, Tavirani, & Rostami, 2018). In this study, genes corresponding to migraine are interacted, analyzed, and screened to find vital ones to address possible therapeutic biomarkers for this brain disorder.
2. Methods
2.1. Protein-protein interaction network analysis
The associated genes to migraine were obtained via disease query of STRING database and were interacted as Protein-Protein Interaction (PPI) network by Cytoscape version 3.6.0. The genes were connected by default condition via undirected edges. The main connected components of the PPI network were analyzed and visualized by the network analyzer plugin of Cytoscape.
The network was layout by degree values. The high-value degree nodes (degrees above Mean+SD) were recognized as hub-nodes. The nodes characterized by the high value of betweenness centrality (the top 5% of nodes) were highlighted as bottlenecks. The common nodes between hubs and bottlenecks were introduced as hub-bottlenecks. The central nodes, including hubs, bottlenecks, and hub-bottlenecks, were organized as a sub-network and analyzed to determine node properties.
2.2. Action network analysis
The action maps of the 33 central nodes were evaluated via CluePedia v1.5.0. The expression, activation, and inhibition relationships between the nodes were investigated to find the significant role of a node in controlling the other central nodes. The connections were considered as directional edges.
3. Results
A total of 600 genes associated with migraine were requested from disease query of STRING, but only 451 genes were found. Of them, 383 genes were included in PPI, and the other 68 genes were isolated.
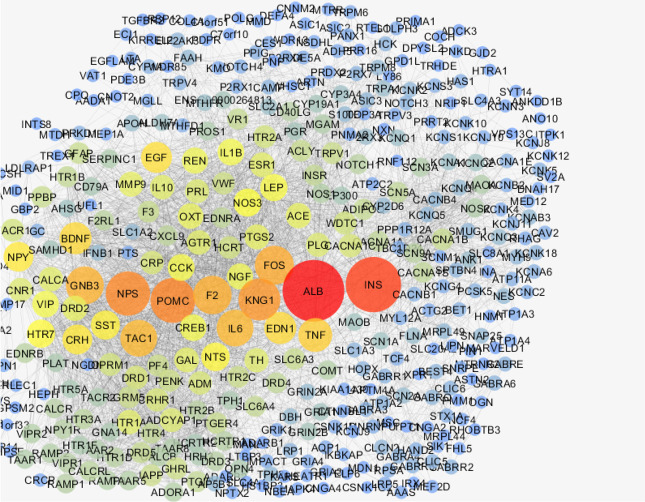
The network was analyzed, and degree of distribution (Figure 1) was fitted by y=axb were a, b, correlation, and R-squared were equal to 64.948, −0.904, 0.855, and 0.742, respectively. The results indicate a scale-free network. The network was visualized based on degree values (Figure 2). A total of 20 hubs and 20 bottlenecks were determined as well as 7 hub-bottlenecks (common between hubs and bottlenecks), so the total number was 33 genes (Table 1).
Figure 1.
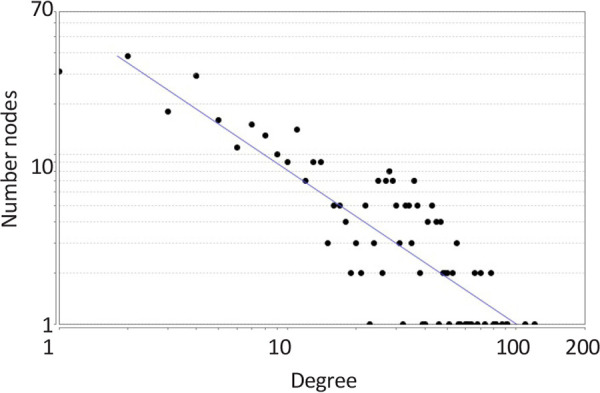
Degree distribution of migraine PPI network
Figure 2.
PPI network of migraine, nodes are layout by degree values
Table 1.
The hubs (red), bottlenecks (green), and hub-bottlenecks (red-green) of migraine (BC refers to betweenness centrality).
| R | Name | Description | Degree | BC |
|---|---|---|---|---|
| 1 | ALB | Albumin | 121 | 0.131298 |
| 2 | INS | Insulin | 110 | 0.125716 |
| 3 | POMC | Proopiomelanocortin | 92 | 0.018258 |
| 4 | NPS | Neuropeptide S | 91 | 0.02901 |
| 5 | KNG1 | Kininogen 1 | 87 | 0.019268 |
| 6 | FOS | FBJ murine osteosarcoma viral oncogene homolog | 82 | 0.019946 |
| 7 | F2 | Coagulation factor II (thrombin) | 81 | 0.018713 |
| 8 | GNB3 | Guanine nucleotide binding protein (G protein), beta polypeptide 3 | 80 | 0.042513 |
| 9 | IL6 | Interleukin 6 (interferon, beta 2) | 78 | 0.020569 |
| 10 | TAC1 | Tachykinin, precursor 1 | 78 | 0.016064 |
| 11 | TNF | Tumor necrosis factor | 73 | 0.020693 |
| 12 | BDNF | Brain-derived neurotrophic factor | 70 | 0.024804 |
| 13 | EDN1 | Endothelin 1 | 70 | 0.018413 |
| 14 | EGF | Epidermal growth factor | 68 | 0.021209 |
| 15 | CRH | Corticotropin-releasing hormone | 66 | 0.006211 |
| 16 | NPY | Neuropeptide Y | 66 | 0.006144 |
| 17 | SST | Somatostatin | 64 | 0.010855 |
| 18 | NTS | Neurotensin | 62 | 0.02408 |
| 19 | HTR7 | 5-Hydroxytryptamine (serotonin) receptor 7, adenylate cyclase-coupled | 61 | 0.011028 |
| 20 | NOS3 | Nitric oxide synthase 3 (endothelial cell) | 60 | 0.019226 |
| 21 | CREB1 | cAMP responsive element binding protein 1 | 55 | 0.024585 |
| 22 | MMP9 | Matrix metallopeptidase 9 (Gelatinase B, 92kDa gelatinase, 92kDa type IV collagenase) | 49 | 0.027458 |
| 23 | TH | Tyrosine hydroxylase | 46 | 0.028666 |
| 24 | PRL | Prolactin | 45 | 0.02854 |
| 25 | CACNA1C | Calcium channel, voltage-dependent, L type, alpha 1C subunit | 43 | 0.038877 |
| 26 | WDTC1 | WD and tetratricopeptide repeats 1 | 41 | 0.026239 |
| 27 | ACLY | ATP citrate lyase | 36 | 0.052981 |
| 28 | CACNA1B | Calcium channel, voltage-dependent, N type, alpha 1B subunit | 36 | 0.028122 |
| 29 | CACNA1A | Calcium channel, voltage-dependent, P/Q type, alpha 1A subunit | 33 | 0.027352 |
| 30 | NOTCH1 | Notch 1 | 30 | 0.023984 |
| 31 | ALDH7A1 | Aldehyde dehydrogenase 7 family, member A1 | 19 | 0.025062 |
| 32 | CLCN2 | Chloride channel, voltage-sensitive 2 | 13 | 0.027591 |
| 33 | GABRQ | γ-Aminobutyric Acid (GABA) A receptor, theta | 13 | 0.023171 |
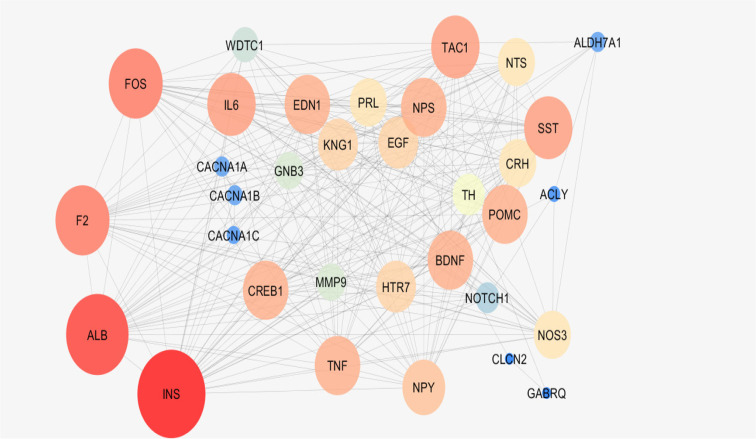
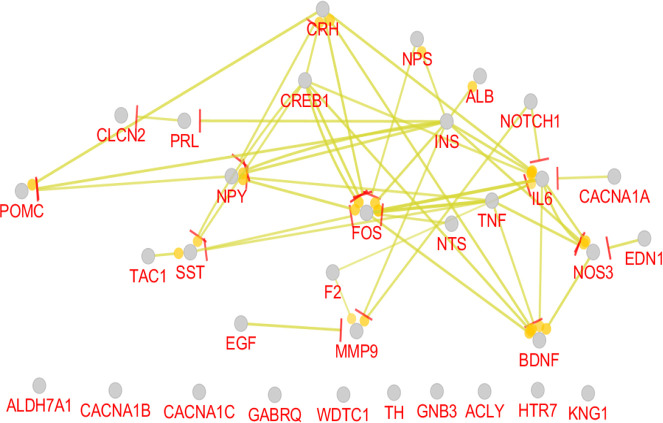
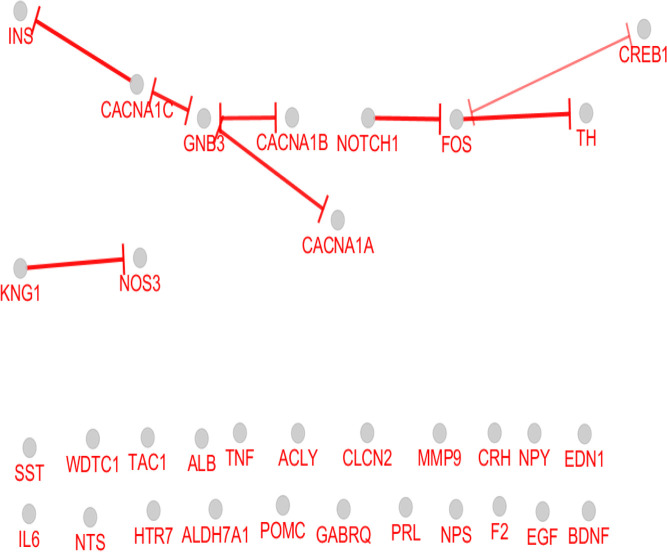
As it is depicted in Table 1, there are 7 hub-bottlenecks, including ALB, INS, NPS, GNB3, BDNF, EGF, and NTS. Since the hubs, bottlenecks, and hub-bottlenecks play different roles in the network, a sub-network, including 33 genes, was constructed (Figure 3). The central parameters, including the degree and betweenness of sub-network nodes, were determined and shown in Table 2. As it is shown in Figures 4, 5 and 6, the action patterns of expression, activation, and inhibition connections for 33 central nodes are presented. Directional edges connect nodes and refer to action mode. In some cases, the former node acts on the other connected node (nodes) while there are cases which a node affects the other nodes and in turn be affected by the concerned node.
Figure 3.
A sub-network of migraine PPI network.The nodes are layout based on degree value
Table 2.
Centralities of nodes of sub-network.
| R | Name | Description | Degree | BC | R1 |
|---|---|---|---|---|---|
| 1 | INS | Insulin | 29 | 0.128 | 2 |
| 2 | ALB | Albumin | 27 | 0.061 | 1 |
| 3 | FOS | FBJ murine osteosarcoma viral oncogene homolog | 24 | 0.016 | 6 |
| 4 | F2 | Coagulation factor II (thrombin) | 24 | 0.018 | 7 |
| 5 | TAC1 | Tachykinin, precursor 1 | 22 | 0.010 | 10 |
| 6 | IL6 | Interleukin 6 (interferon, beta 2) | 22 | 0.021 | 9 |
| 7 | SST | Somatostatin | 22 | 0.010 | 17 |
| 8 | TNF | Tumor necrosis factor | 21 | 0.010 | 11 |
| 9 | NPS | Neuropeptide S | 21 | 0.007 | 4 |
| 10 | EDN1 | Endothelin 1 | 21 | 0.022 | 13 |
| 11 | BDNF | Brain-derived neurotrophic factor | 21 | 0.020 | 12 |
| 12 | POMC | Proopiomelanocortin | 21 | 0.007 | 3 |
| 13 | CREB1 | cAMP responsive element binding protein 1 | 21 | 0.020 | 21 |
| 14 | NPY | Neuropeptide Y | 20 | 0.006 | 16 |
| 15 | KNG1 | Kininogen 1 | 19 | 0.007 | 5 |
| 16 | HTR7 | 5-Hydroxytryptamine (serotonin) receptor 7, adenylate cyclase-coupled | 19 | 0.010 | 19 |
| 17 | EGF | Epidermal growth factor | 19 | 0.008 | 14 |
| 18 | PRL | Prolactin | 18 | 0.062 | 24 |
| 19 | NTS | Neurotensin | 18 | 0.007 | 18 |
| 20 | NOS3 | Nitric oxide synthase 3 (endothelial cell) | 18 | 0.020 | 20 |
| 21 | CRH | Corticotropin releasing hormone | 18 | 0.004 | 15 |
| 22 | TH | Tyrosine hydroxylase | 16 | 0.060 | 23 |
| 23 | MMP9 | Matrix metallopeptidase 9 (gelatinase B, 92kDa gelatinase, 92kDa type IV collagenase) | 14 | 0.002 | 29 |
| 24 | GNB3 | Guanine nucleotide binding protein (G protein), beta polypeptide 3 | 14 | 0.019 | 8 |
| 25 | WDTC1 | WD and tetratricopeptide repeats 1 | 13 | 0.005 | 26 |
| 26 | NOTCH1 | Notch 1 | 11 | 0.005 | 30 |
| 27 | CACNA1B | Calcium channel, voltage-dependent, N type, alpha 1B subunit | 6 | 0.003 | 28 |
| 28 | CACNA1A | Calcium channel, voltage-dependent, P/Q type, alpha 1A subunit | 6 | 0.002 | 29 |
| 29 | ALDH7A1 | Aldehyde dehydrogenase 7 family, member A1 | 6 | 0.002 | 31 |
| 30 | CACNA1C | Calcium channel, voltage-dependent, L type, alpha 1C subunit | 5 | 0.001 | 25 |
| 31 | ACLY | ATP citrate lyase | 4 | 0.001 | 27 |
| 32 | CLCN2 | Chloride channel, voltage-sensitive 2 | 2 | 0.001 | 32 |
| 33 | GABRQ | γ-Aminobutyric cid (GABA) A receptor, theta | 2 | 0.001 | 33 |
BC refers to betweenness centrality, R1 indicates to row position in Table 1, the colored nodes are the hub-bottlenecks of migraine PPI network.
Figure 4.
Expression pattern of 33 nodes of migraine PPI network. The round tips and the vertical bar tips refer to up-regulation and down-regulation, respectively.
Figure 5.
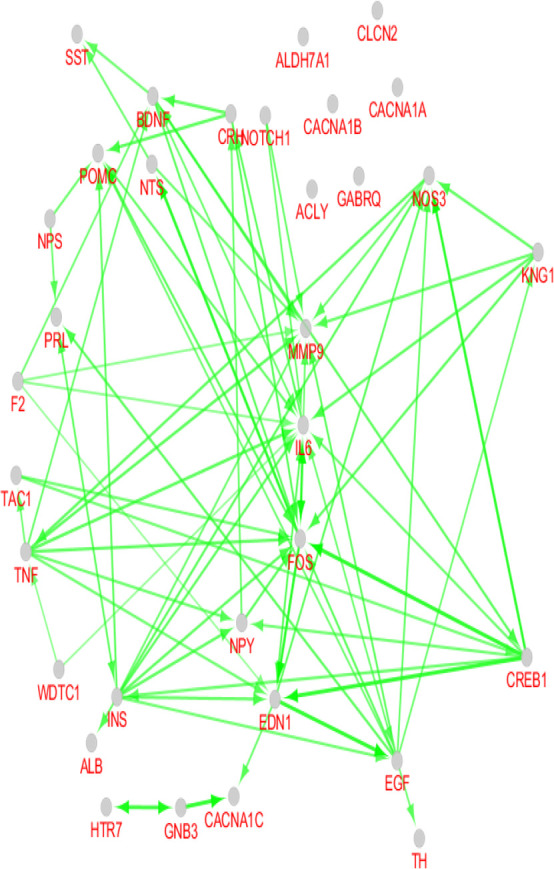
Activation action of 33 nodes of migraine PPI network arrow direction refers to activation direction
Figure 6.
Inhibition relationships between 33 nodes of migraine PPI network vertical bar tips refer to inhibition direction
4. Discussion
Based on the findings, 451 genes are associated with migraine accessible in STRING database, indicating many investigations on the genetics of migraine. As it is shown in Figures 1 and 2, there is a scale-free network related to migraine. In scale-free networks, a few nodes can be considered as critical nodes. PPI network analysis is a suitable method to screen many genes and select the important ones. As it is shown in Table 1, there are 20, 20, and 7 hubs, bottlenecks, and hub-bottlenecks, respectively in the migraine network. Hubs and bottlenecks are major players in networks and consequently in diseases.
On the other hand, hub-bottlenecks are critical elements of the network, with high impact in onset, and development of diseases. It seems that the seven introduced hub-bottlenecks are the crucial genes that are involved in migraine. As it is presented in Table 1, the hub-bottlenecks account for 21% of total hubs and bottlenecks. It may be the number of potent hubs or bottlenecks that are ignored as crucial genes due to exclusion from hub-bottlenecks. Bottleneck nodes play a critical role in controlling the network (Rezaei-Tavirani, Rezaei-Tavirani, Ahmadi, Naderi, & Abdi, 2017). To avoid this disadvantage, these 33 critical genes interacted and centrality parameters of interacted nodes were analyzed (Figure 3 and Table 2). The elements of Table 2 were considered for more analysis; however, only 24 top genes, including hub-bottlenecks of Table 1, are selected. Expression, activation, and inhibition are three important actions of genes which indicate the impact of genes on the molecular mechanism of diseases.
As it is shown in Figure 4, 23 genes (70% of 33 central genes) are involved in expression action network. A total number of 6 hub-bottlenecks (85% of critical genes) are included in the network. Of 7 critical genes, only GNB3 was isolated and did not play a role in the network. The most important regulatory gene in this network is INS. It has 6 up-regulating and 4 down-regulating connections with the elements of the network. INS as a robust regulatory gene regulates 8 genes (two genes are up and down-regulated by INS).
The second important gene is CREB1, which controls the expression of 5 genes in the network. Surprisingly, ALB, which is the first and second node in Tables 1 and 2, has no regulatory effect in the expression action network. This gene is up-regulated by the only connection that is connected to INS. FOS, the other highly related gene, is linked to 10 nodes. As it is discussed, INS and CREB1 have merely regulatory connections, but FOS is regulated mostly by the other genes. TNF regulates 7 genes, while no gene regulates it.
As it is shown in Figures 5 and 6, the most contributing genes in the network are activator genes. Among 33 genes, 27 ones, including all critical genes are involved in activation action network while 11 genes (33% of central genes) construct inhibition action network and among them, only 9 genes are inhibitor genes. INS and GNB3, and 30% of critical genes play inhibition role in action network. Like the expression map, the activation and inhibition networks show no significant role for ALB. It seems that albumin as an important career in the body is related to many genes but have no significant gene regulatory effects, which matches with its role in body.
The most activation arrows target FOS, IL6, and MMP9. Complex relationships between nodes of activation action network versus inhibition network refer to increase in biochemical activities of migraine. Inhibition action network is constructed by three separate parts which are organized as KNG1-NOS3, calcium channel-1 subunits-GNB3-INS, and NOTCH1-FOS-TH-CREB1.
Several studies support insulin sensitivity alteration in migraine, that results in increasing glucose concentration (Cavestro et al., 2007; Rainero et al., 2005). MU Jang et al. reported a significant correlation between a high level of neuropeptides and pain in migraine patients (Jang, Park, Kho, Chung, & Chung, 2011). Based on the report of MTA Tanure et al. BDNF level of migraine patients increases significantly while the TNF level does not change (Tanure, Gomez, Hurtado, Teixeira, & Domingues, 2010).
It is reported that TNF level changes in migraine patients without aura while it is normal in patients with chronic type tension headache (Covelli et al., 1990). Nitric oxide can be considered as a pain stimulus in migraine due to its role in vasodilation, but investigation indicates no significant correlation between nitric oxide synthase change and migraine (Griffiths, Nyholt, Curtain, Goadsby, & Brimage, 1997). NOS3 appears as the last hub-gene and is not a hub-bottleneck in our analysis. NOS3, as the most regulated gene in three action networks, did not show significant regulatory effects and was inhibited by KNG1. Increased activity of matrix metalloproteinases in migraine patients is confirmed, which MMP9 action as an initiator for this cascade.
Investigations show that matrix metalloproteinases can kill neurons via interfering with TNF receptors or creating neurotoxic chemokines. It is possible that matrix metalloproteinase inhibitors affect IL6 receptors (Lakhan & Avramut, 2012). Activated transcription factor CREB can activate c-FOS (that is known as a neuronal activation marker) and positively regulate BDNF expression. Over-expression of BDNF is confirmed in migraine patients (Guo, Deng, Bo, & Yang, 2017; Tanure et al., 2010). As it is shown in Figure 5, activation actions of CREB1-FOS and FOS-BDNF are related to a complex relationship between the mentioned three genes.
As depicted in Figures 4, 5 and 6, there is a tight relationship between CREB1 and FOS regarding expression, activation, and inhibition actions. Reciprocal inhibition action between FOS and CREB1 is seen in Figure 6, which is a contradictory finding. There are various studies about CREB1-FOS regulation relationship. Lubelski et al. reported that complete inhibition of CREB1 binding to DNA only decreased by 20% of FOS activity (Lubelski, Ponzio, & Gainer, 2012). Mutation in the GNB3 gene was accompanied by essential hypertension and obesity. GNB3 also plays a role in processes which are correlated to chronic migraine (Serafini et al., 2012). GNB3 is not involved in expression action network but appears as an indirect inhibitor of insulin in inhibition action map (Figure 6). The findings indicate that a wide range of central genes is involved in migraine, but insulin is a key agent which significantly affects migraine patients. We suggest that July, August 2019, insulin be evaluated in more details as a candidate for migraine biomarker.
Migraine is a disorder, which mostly resulted from hyperactivation of several critical genes. It seems that regulation of metabolism may be an effective treatment of migraine. Finally, more experimental data are required to validate these findings.
Ethical Considerations
Compliance with ethical guidelines
The data are available as free access format from the GEO database.
Funding
This research has been part of the project NO. 1396.46459 funded by the Student Research Committee, Shahid Beheshti University of Medical Sciences, Tehran, Iran.
Authors’ contributions
All authors contributed in preparing this article.
Conflict of interest
The authors declare no conflict of interest.
References
- Cavestro C., Rosatello A., Micca G., Ravotto M., Pia Marino M., Asteggiano G., et al. (2007). Insulin metabolism is altered in migraineurs: a new pathogenic mechanism for migraine? Headache: The Journal of Head and Face Pain, 47(10), 1436–42. [DOI: 10.1111/j.1526-4610.2007.00719.x] [PMID] [DOI] [PubMed] [Google Scholar]
- Covelli V., Munno I., Pellegrino N. M., Di A. V., Jirillo E., Buscaino G. A. (1990). Exaggerated spontaneous release of tumor necrosis factor-alpha/cachectin in patients with migraine without aura. Acta Neurologica, 12(4), 257–63. [PMID] [PubMed] [Google Scholar]
- Gerring Z. F., Powell J. E., Montgomery G. W., Nyholt D. R. (2018). Genome-wide analysis of blood gene expression in migraine implicates immune-inflammatory pathways. Cephalalgia, 38(2), 292–303. [DOI: 10.1177/0333102416686769] [PMID] [DOI] [PubMed] [Google Scholar]
- Goadsby P. J., Holland P. R., Martins-Oliveira M., Hoffmann J., Schankin C., Akerman S. (2017). Pathophysiology of migraine: A disorder of sensory processing. Physiological Reviews, 97(2), 553–622. [DOI: 10.1152/physrev.00034.2015] [PMID] [PMCID] [DOI] [PMC free article] [PubMed] [Google Scholar]
- Griffiths L. R., Nyholt D. R., Curtain R. P., Goadsby P. J., Brimage P. J. (1997). Migraine association and linkage studies of an endothelial Nitric Oxide Synthase (NOS3) gene polymorphism. Neurology, 49(2), 614–7. [DOI: 10.1212/WNL.49.2.614] [PMID] [DOI] [PubMed] [Google Scholar]
- Guo J. Q., Deng H. H., Bo X., Yang X. S. (2017). Involvement of BDNF/TrkB and ERK/CREB axes in nitroglycerin-induced rat migraine and effects of estrogen on these signals in the migraine. Biology Open, 6(1), 8–16. [DOI: 10.1242/bio.021022] [PMID] [PMCID] [DOI] [PMC free article] [PubMed] [Google Scholar]
- Jang M. U., Park J. W., Kho H. S., Chung S. C., Chung J. W. (2011). Plasma and saliva levels of nerve growth factor and neuropeptides in chronic migraine patients. Oral Diseases, 17(2), 187–93. [DOI: 10.1111/j.1601-0825.2010.01717.x] [PMID] [DOI] [PubMed] [Google Scholar]
- Lakhan S. E., Avramut M. (2012). Matrix metalloproteinases in neuropathic pain and migraine: Friends, enemies, and therapeutic targets. Pain Research and Treatment, 2012(952906), 1–10. [DOI: 10.1155/2012/952906] [PMID] [PMCID] [DOI] [PMC free article] [PubMed] [Google Scholar]
- Lubelski D., Ponzio T. A., Gainer H. (2012). Effects of A-CREB, a dominant negative inhibitor of CREB, on the expression of c-fos and other immediate early genes in the rat SON during hyperosmotic stimulation in vivo. Brain Research, 1429, 18–28. [DOI: 10.1016/j.brainres.2011.10.033] [PMID] [PMCID] [DOI] [PMC free article] [PubMed] [Google Scholar]
- Mastia S. M., Ansaria M., Taviranib M. R., Nejadib N., Zali H., Rafieec M. H. (2016). Effects of migriheal® on plasma proteome of patients with migraine headaches. Journal of Reports in Pharmaceutical Sciences, 5(1), 53–60. [Google Scholar]
- Moriarty M., Mallick-Searle T. (2016). Diagnosis and treatment for chronic migraine. The Nurse Practitioner, 41(6), 18–32. [DOI: 10.1097/01.NPR.0000483078.55590.b3] [PMID] [PMCID] [DOI] [PMC free article] [PubMed] [Google Scholar]
- Pellacani S., Sicca F., Di Lorenzo C., Grieco G. S., Valvo G., Cereda C., et al. (2016). The revolution in migraine genetics: From aching channels disorders to a next-generation medicine. Frontiers in Cellular Neuroscience, 10, 156 [DOI: 10.3389/fncel.2016.00156] [PMID] [PMCID] [DOI] [PMC free article] [PubMed] [Google Scholar]
- Rainero I., Limone P., Ferrero M., Valfrè W., Pelissetto C., Rubino E., et al. (2005). Insulin sensitivity is impaired in patients with migraine. Cephalalgia, 25(8), 593–7. [DOI: 10.1111/j.1468-2982.2005.00928.x] [PMID] [DOI] [PubMed] [Google Scholar]
- Rezaei-Tavirani M., Rezaei-Tavirani S., Ahmadi N., Naderi N., Abdi S. (2017). Pancreatic adenocarcinoma protein-protein interaction network analysis. Gastroenterology and Hepatology from Bed to Bench, 10(Suppl1), S85–92. [PMID] [PMCID] [PMC free article] [PubMed] [Google Scholar]
- Rezaei-Tavirani M., Rezaei-Tavirani S. R., Rostami F. T. (2018). Biochemical pathway analysis of gastric atrophy. Gastroenterology and Hepatology from Bed to Bench, 11(2), 118–24. [PMID] [PMCID] [PMC free article] [PubMed] [Google Scholar]
- Serafini G., Pompili M., Innamorati M., Gentile G., Borro M., Lamis D. A., et al. (2012). Gene variants with suicidal risk in a sample of subjects with chronic migraine and affective temperamental dysregulation. European Review for Medical and Pharmacological Sciences, 16(10), 1389–98. [PMID] [PubMed] [Google Scholar]
- Shin D. J., Shin D. H., Kim H. (2017). Metabolic signatures for migraine using NMR-based metabolomics. Neurology, 88(16 Suppl.), P2–151. [Google Scholar]
- Tafuri E., Santovito D., de Nardis V., Marcantonio P., Paganelli C., Affaitati G., et al. (2015). MicroRNA profiling in migraine without aura: Pilot study. Annals of Medicine, 47(6), 468–73. [DOI: 10.3109/07853890.2015.1071871] [PMID] [DOI] [PubMed] [Google Scholar]
- Tanure M. T. A., Gomez R. S., Hurtado R. C. L., Teixeira A. L., Domingues R. B. (2010). Increased serum levels of brain-derived neurotropic factor during migraine attacks: a pilot study. The Journal of Headache and Pain, 11(5), 427–30. [DOI: 10.1007/s10194-010-0233-0] [PMID] [PMCID] [DOI] [PMC free article] [PubMed] [Google Scholar]
- Tavirani M. R., Bashash D., Rostami F. T., Tavirani S. R., Nikzamir A., Tavirani M. R., et al. (2018). Celiac disease microarray analysis based on system biology approach. Gastroenterology and Hepatology from Bed to Bench, 11(3), 216–24. [PMID] [PMCID] [PMC free article] [PubMed] [Google Scholar]


