

Abstract
Conventional polymerase chain reaction (PCR) in respiratory samples does not differentiate between Pneumocystis pneumonia (PCP) and Pneumocystis jirovecii (Pj) colonization. We used Pj real-time quantitative PCR (qPCR) with the objective to discriminate PCP from Pj colonization in immunocompromised patients. All positive Pj qPCR [targeting the major surface glycoprotein (MSG) gene] obtained in respiratory samples from immunocompromised patients presenting pneumonia at the Grenoble University Hospital, France, were collected between August 2009 and April 2011. Diagnoses were retrospectively determined by a multidisciplinary group of experts blinded to the Pj qPCR results. Thirty-one bronchoalveolar lavages and four broncho aspirations positive for the Pj qPCR were obtained from 35 immunocompromised patients. Diagnoses of definite, probable, and possible PCP, and pneumonia from another etiology were retrospectively made for 7, 4, 5, and 19 patients, respectively. Copy numbers were significantly higher in the “definite group” (median 465,000 copies/ml) than in the “probable group” (median 38,600 copies/ml), the “possible group” (median 1,032 copies/ml), and the “other diagnosis group” (median 390 copies/ml). With the value of 3,160 copies/ml, the sensitivity and specificity of qPCR for the diagnosis of PCP were 100 % and 70 %, respectively. With the value of 31,600 copies/ml, the sensitivity and specificity were 80 % and 100 %, respectively. The positive predictive value was 100 % for results with more than 31,600 copies/ml and the negative predictive value was 100 % for results with fewer than 3,160 copies/ml. qPCR targeting the MSG gene can be helpful to discriminate PCP from Pj colonization in immunocompromised patients, using two cut-off values, with a gray zone between them.
Keywords: Immunocompromised Patient, Gray Zone, Respiratory Sample, Allergic Bronchopulmonary Aspergillosis, Pneumocystis Jirovecii
Introduction
The incidence of Pneumocystis pneumonia (PCP) in human immunodeficiency virus (HIV)-infected patients has decreased since the introduction of chemoprophylaxis and antiretroviral therapy [1]; meanwhile, the incidence of PCP in non-HIV immunocompromised patients is increasing [2]. The standard laboratory method to diagnose PCP remains the microscopic identification of Pneumocystis jirovecii (Pj) by staining methods in respiratory samples. However, studies highlighted the low burden of Pj in non-HIV immunocompromised patients [3] and the lack of sensitivity of microscopic methods [4]. This justifies the increasing use of polymerase chain reaction (PCR) methods for diagnosis [5, 6]. The detection of Pj in individuals presenting without pneumonia or with pneumonia from another etiology has been defined as colonization or “carriage” [7]. Conventional Pj PCR is qualitative and very sensitive, but does not differentiate between active PCP and Pj colonization.
The aim of this study was to use Pj real-time quantitative PCR (qPCR) in order to differentiate PCP and Pj colonization in immunocompromised patients.
Patients and methods
Patients and clinical samples
All positive Pj qPCR obtained in respiratory samples from immunosuppressed patients presenting with pneumonia at the Grenoble University Hospital, France, were collected between August 2009 and April 2011. We retrospectively studied the clinical histories of the concerned patients.
Clinical data
The collected clinical data included: age, sex, underlying diseases, immunosuppression therapy during the previous months, PCP prophylaxis, clinical symptoms, routine laboratory data, anti-pneumocystis treatment, stay in a critical care unit, mechanical ventilation, hypoxemia (PaO2 < 70 mmHg in room air or requirement for supplemental oxygen), use of other anti-infectious agents, and outcome.
Staining methods
The bronchoalveolar lavage (BAL) and broncho aspirations samples were stained and examined by a qualified microscopist at the Laboratory of Parasitology-Mycology, with 400 μl of fluid analyzed by Fast Giemsa and 800 μl observed after Gomori–Grocott staining.
Real-time qPCR
A DNA extract solution from each sample was tested with a Pj qPCR targeting the major surface glycoprotein (MSG) gene of Pj as previously described [4, 8]. The results were expressed as the number of MSG copies/ml of BAL fluid.
Diagnosis of Pj pneumonia and Pj colonization
A group of six experts, including three infectious diseases specialists, one internist, one hematologist, and one mycologist, classified the clinical histories of these patients in one of the following categories: definite, probable, and possible PCP, or other diagnosis (case definitions in Table 1). The experts were blinded to the Pj PCR results.
Table 1.
Diagnosis definitions used by the experts
| Definite PCP | - clinical signs of progressive pneumonia |
| - ground glass opacities in chest computed tomography | |
| - microscopical identification of Pj with Musto or RAL staining methods | |
| Probable PCP | - clinical signs of progressive pneumonia |
| - ground glass opacities in chest computed tomography | |
| - complete resolution of symptoms after a full course of anti-PCP treatment | |
| - absence of microscopical identification of Pj with staining methods | |
| Possible PCP | - clinical signs of progressive pneumonia and: |
| - either compatible radiological signs | |
| - or complete resolution of symptoms after anti-PCP treatment | |
| - absence of microscopical identification of Pj with staining methods | |
| Other diagnosis | none of the above criteria |
The “definite PCP” and “probable PCP” groups were then re-assigned to the “final diagnosis of PCP” group, and the “possible PCP” and “other diagnosis” groups were re-assigned to the “non-PCP” group in order to construct a receiver operating characteristic (ROC) curve
Statistical analysis
Statistical analyses were performed with the StatView software (for Windows, SAS Institute Inc., Cary, NC, USA). Categorical variables were compared using the Fisher’s exact test. Continuous variables were compared using the Kruskal–Wallis test. A receiver operating characteristic (ROC) curve for copy numbers was constructed and used to define cut-off values in order to discriminate the definite and probable PCP groups from the colonized group (possible PCP group and other diagnosis). A p-value < 0.05 was considered statistically significant. The Youden’s index (Se + Sp − 1) was calculated for each cut-off value, as well as the number of correctly classified patients, in order to determine an optimal cut-off value.
Results
Thirty-one BAL samples and four broncho aspirations with positive Pj qPCR were obtained from 35 immunocompromised patients. Broncho aspirations were used when BAL could not be performed. All of these patients had clinical presentations such as fever, cough, sputum, or dyspnea, and suspected pneumonia.
Seven patients met all the criteria for definite PCP, four patients for probable PCP, and five for possible PCP; another diagnosis was finally made for 19 patients. Prophylaxis therapy was used in one of the 35 patients (2 %). All definite, possible, and probable patients had received anti-PCP treatment. Microscopic examination was positive in 8 of 32 samples of BAL fluid samples (one patient’s retained diagnosis was allergic bronchopulmonary aspergillosis).
Clinical features
The clinical features for each group are described in Table 2. There was no statistical difference between the four groups.
Table 2.
Clinical features
| Characteristics | Definite PCPa (n = 7) | Probable PCP (n = 4) | Possible PCP (n = 5) | Other diagnosisd (n = 19) | p-Value |
|---|---|---|---|---|---|
| Age, years | 66 (47–69) | 66 (52–75) | 65 (60–67) | 49 (42–66) | 0.34 |
| Male sex | 3 (43 %) | 1 (25 %) | 2 (40 %) | 9 (47 %) | 0.874 |
| Underlying disease | |||||
| Hematological malignancy | 4 (57 %) | 4 (100 %) | 4 (80 %) | 13 (68 %) | 0.46 |
| Solid malignancy | 1 (14 %) | 0 (0 %) | 0 (0 %) | 1 (5 %) | 0.68 |
| Organ transplantation | 0 (0 %) | 0 (0 %) | 0 (0 %) | 4 (21 %) | 0.28 |
| HIVb infection | 2 (29 %) | 0 (0 %) | 0 (0 %) | 1 (5 %) | 0.2 |
| Inflammatory disease | 0 (0 %) | 0 (0 %) | 1 (20 %) | 0 (0 %) | 0.1 |
| Corticosteroids | 2 (29 %) | 1 (25 %) | 2 (40 %) | 4 (21 %) | 0.85 |
| Anti-tumor chemotherapy | 2 (29 %) | 2 (50 %) | 2 (40 %) | 11 (58 %) | 0.59 |
| Immunosuppressive agents other than corticosteroids or chemotherapy | 1 (14 %) | 1 (25 %) | 2 (40 %) | 3 (16 %) | 0.64 |
| PCP prophylaxis | 0 (0 %) | 0 (0 %) | 0 (0 %) | 1 (5 %) | 0.83 |
| Hypoxia | 7 (100 %) | 3 (75 %) | 5 (100 %) | 11 (58 %) | 0.19 |
| Stay in ICUc | 2 (29 %) | 2 (50 %) | 0 (0 %) | 5 (26 %) | 0.39 |
| Anti-PCP treatment | 7 (100 %) | 4 (100 %) | 5 (100 %) | 12 (63 %) | 0.06 |
| Mechanical ventilation | 2 (29 %) | 0 (0 %) | 0 (0 %) | 5 (26 %) | 0.38 |
| Laboratory findings | |||||
| Leucocytes, /mm3 | 2,100 (1,700–9,825) | 7,150 (6,600–8 750) | 9,100 (750–10 025) | 3,700 (2,325–5,900) | 0.4 |
| Neutrophils, /mm3 | 1,400 (1,125–5,650) | 5,850 (5,200–7,250) | 4,650 (1,800–8,150) | 2,600 (2,200–5,525) | 0.28 |
| Lymphocytes, /mm3 | 400 (225–600) | 950 (450–1,300) | 400 (350–2,150) | 500 (225–800) | 0.77 |
| C-reactive protein, mg/dl | 11.8 (2.6–17.9) | 10.5 (4.95–14.1) | 10.7 (4.5–20) | 9.3 (3.9–6.2) | 0.99 |
| Creatinine, mg/dl | 0.8 (0.61–1) | 0.84 (0.74–1.37) | 0.71 (0.6–1.3) | 0.97 (0.63–1.1) | 0.91 |
| Death | 0 (0 %) | 0 (0 %) | 0 (0 %) | 3 (16 %) | 0.43 |
Data are presented as n (%) or median (interquartile range)
a Pneumocystis pneumonia
bHuman immunodeficiency virus
cIntensive care unit
dThe “other diagnoses” group included bacterial pneumonia (n = 2), atypical pneumonia (n = 2), influenza virus pneumonia (n = 1), acute respiratory distress syndrome (ARDS) due to sepsis (n = 1), candidemia (n = 1), bronchiolitis obliterans organizing pneumonia (n = 1), drug-induced pneumonia (n = 1), bronchial hamartoma (n = 1), multifactorial pulmonary fibrosis (n = 1), allergic bronchopulmonary aspergillosis (n = 1), pulmonary lymphoma (n = 2), and undetermined (n = 5)
Real-time qPCR
qPCR copy numbers were significantly higher in the definite group (median 465,000 copies/ml, range 99,900–750,290,000) than in the probable group (median 38,600 copies/ml, range 7,750–148,982) and the possible group (median 1,032 copies/ml, range 731–13,000) or the other diagnosis group (median 390 copies/ml, range 145–2,833) (Fig. 1). The difference was significant between the four groups (p < 0.0001).
Fig. 1.
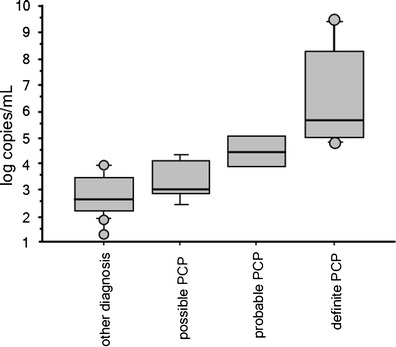
Box and whisker plots of Pneumocystis jirovecii copy numbers according to patient group. The boxes contain 50 % of the sample data, with the median value indicated by a horizontal bar
ROC curve analysis gave an area under the curve of 0.97 (Fig. 2), confirming the ability of qPCR to discriminate PCP from colonization. The sensitivity and specificity of qPCR on BAL fluids for discrimination between PCP and colonization were estimated with different qPCR cut-off values. Two cut-off values were determined to give 100 % positive and negative predictive values, with a gray zone between them. The estimated cut-off values were 31,600 and 3,160 copies/ml, respectively. The sensitivity and specificity of qPCR for the diagnosis of PCP are specified in Fig. 2 for each cut-off value. The Youden’s index and the rate of correctly classified patients for each cut-off value provided an optimal cut-off value of 36,100 copies/ml for the diagnosis of PCP (Fig. 3).
Fig. 2.
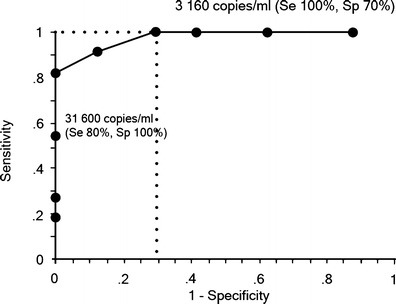
Receiver operator characteristic (ROC) curve of P. jirovecii copy numbers for the diagnosis of Pneumocystis pneumonia (PCP). The arrows indicate cut-off values of 3,160 copies/ml, and 31,600 copies/ml
Fig. 3.
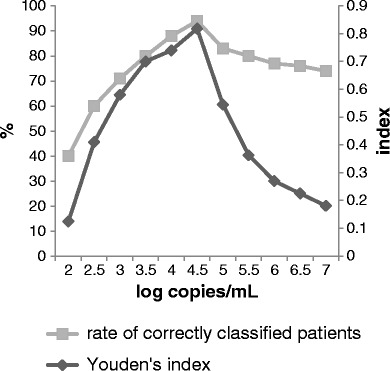
Rate of correctly classified patients and Youden’s index for each cut-off value
Discussion
The diagnostic performance of the microscopic visualization of Pj is dependent on the quality and type of sample, the number of organisms, and the experience of the microscopist [9]. The higher sensitivity of PCR for Pj detection has been demonstrated previously [4]. The main risk of using conventional PCR for the diagnosis of PCP is a positive result for colonized patients having pneumonia from another etiology [7, 10–17].
In this study, we observed that the qPCR results in the probable PCP group were significantly higher than those in the possible PCP group and in the group with another etiology, and were significantly lower than those in the definite PCP group. These results suggest that qPCR can help discriminate PCP from colonization and are in concordance with the hypothesis that the burden of Pj is lower in colonized people than in patients with PCP [18]. This is particularly interesting for non-HIV-infected immunocompromised patients, who often present with PCP with a low burden of Pj organisms and may not be diagnosed using microscopic examination [3].
qPCR values between 3,160 and 31,600 copies/ml fall within a gray zone, in which curative or prophylactic treatment should be discussed individually. It included nine out of the 35 (25 %) patients. Nevertheless, the Youden’s index and the rate of correctly classified patients allowed determining the optimal cut-off value of 31,600 copies/ml, maximizing the accuracy for the diagnosis of PCP.
A recent study concluded that early diagnosis and treatment are crucial for the survival of PCP patients without HIV infection [19], suggesting that a rapid and accurate PCP diagnosis method such as qPCR should be used in these patients with a low burden of Pj. In our study, the cut-off value of 3,160 copies/ml would have avoided 13 of 17 (76 %) treatments prescribed to patients whose final diagnosis was not PCP. This cut-off would allow physicians to stop probabilistic treatment, and, therefore, limit adverse effects, cost of treatment, and development of resistances [7, 20].
A meta-analysis showed that PCR has good diagnosis accuracy and may be a useful tool for the diagnosis of PCP in immunocompromised patients [21]. Previous studies determined various cut-offs of qPCR targeting different genes to discriminate PCP from colonization: for MSG gene, Larsen et al. proved that a cut-off value of 50 copies/tube for qPCR in oral-wash samples increased the specificity for diagnosis of PCP to 100 % [18]. Flori et al.’s study established that a cut-off of 103 copies of DNA per capillary of BAL (PCR targeting the MSG gene) increased the specificity from 84.9 to 98.6 % with 100 % sensitivity [4]. Other studies highlighted the usefulness of qPCR in discriminating colonization from PCP: Alanio et al. proposed two cut-off values (120 and 1,900 trophic forms equivalents/ml) with a qPCR targeting the mitochondrial large subunit ribosomal RNA gene [22]; for Matsumura et al., the value of 1,300 copies/ml distinguished PCP from colonization with a sensitivity of 100 % and a specificity of 80 %, using qPCR targeting the DHPS (dihydropteroate synthase) gene [23].
We need to consider limitations when interpreting our results: this is a single-center study, the number of patients is relatively small, and we combined the data from the BAL and the broncho aspiration samples to evaluate the qPCR. Without a test capable of confirming or excluding the diagnosis of PCP, the classification of patients is uncertain. However, one quality of our study is that patients were classified by a multidisciplinary group of experts, ruling by consensus in view of all the clinical and complementary data. The fact that the experts did not know the qPCR results avoids classification bias. In spite of the small number of patients, the observed differences between the groups are statistically significant, which suggests that these differences are important. In our study, we used qPCR targeting the MSG gene, which is appropriate in discuss PCP diagnosis: the sensitivity is excellent, and it has been proved that qPCR analysis and the MSG target have the highest specificity compared with other PCR assays [24].
We can note that the rate of anti-pneumocystis prophylaxis was very low in our population. There is no current recommendation for anti-PCP prophylaxis or empirical therapy for non-HIV immunocompromised patients. It is known that colonization can sometimes lead to the development of PCP [7]. We propose to treat patients with a high probability of PCP and Pj burdens in the gray zone, and to monitor patients with low burdens and low probability of PCP with biological markers such as β-D-glucan, while prescribing a prophylactic treatment [23, 25, 26]. The proportion of patients having a hematological malignancy was very high in our population. We hypothesize that cut-off values may differ with the underlying diseases and may vary from one center to another.
In conclusion, our study shows that our qPCR targeting the MSG gene in respiratory samples can help discriminate PCP from pneumonia with Pj colonization in immunocompromised patients, using two cut-off values of 3,160 and 31,600 copies/ml, with a gray zone between them. Cut-off values should be determined for each laboratory and each population of patients.
Acknowledgments
Conflict of interest
The authors declare they have no conflict of interest.
Contributor Information
M. Maillet, Phone: +33-4-76765291, FAX: +33-4-76765569, Email: mmaillet@chu-grenoble.fr
P. Pavese, Phone: +33-4-76765291, FAX: +33-4-76765569, Email: ppavese@chu-grenoble.fr
References
- 1.Kelley CF, Checkley W, Mannino DM, Franco-Paredes C, Del Rio C, Holguin F. Trends in hospitalizations for AIDS-associated Pneumocystis jirovecii pneumonia in the United States (1986 to 2005) Chest. 2009;136:190–197. doi: 10.1378/chest.08-2859. [DOI] [PubMed] [Google Scholar]
- 2.Mansharamani NG, Garland R, Delaney D, Koziel H. Management and outcome patterns for adult Pneumocystis carinii pneumonia, 1985 to 1995: comparison of HIV-associated cases to other immunocompromised states. Chest. 2000;118:704–711. doi: 10.1378/chest.118.3.704. [DOI] [PubMed] [Google Scholar]
- 3.Thomas CF, Jr, Limper AH. Pneumocystis pneumonia. N Engl J Med. 2004;350:2487–2498. doi: 10.1056/NEJMra032588. [DOI] [PubMed] [Google Scholar]
- 4.Flori P, Bellete B, Durand F, et al. Comparison between real-time PCR, conventional PCR and different staining techniques for diagnosing Pneumocystis jiroveci pneumonia from bronchoalveolar lavage specimens. J Med Microbiol. 2004;53:603–607. doi: 10.1099/jmm.0.45528-0. [DOI] [PubMed] [Google Scholar]
- 5.Botterel F, Cabaret O, Foulet F, Cordonnier C, Costa JM, Bretagne S. Clinical significance of quantifying Pneumocystis jirovecii DNA by using real-time PCR in bronchoalveolar lavage fluid from immunocompromised patients. J Clin Microbiol. 2012;50(2):227–231. doi: 10.1128/JCM.06036-11. [DOI] [PMC free article] [PubMed] [Google Scholar]
- 6.Durand-Joly I, Chabé M, Soula F, Delhaes L, Camus D, Dei-Cas E. Molecular diagnosis of Pneumocystis pneumonia. FEMS Immunol Med Microbiol. 2005;45:405–410. doi: 10.1016/j.femsim.2005.06.006. [DOI] [PubMed] [Google Scholar]
- 7.Morris A, Norris KA. Colonization by Pneumocystis jirovecii and its role in disease. Clin Microbiol Rev. 2012;25(2):297–317. doi: 10.1128/CMR.00013-12. [DOI] [PMC free article] [PubMed] [Google Scholar]
- 8.Chumpitazi BFF, Flori P, Kern JB, et al. Characteristics and clinical relevance of the quantitative touch-down major surface glycoprotein polymerase chain reaction in the diagnosis of Pneumocystis pneumonia. Med Mycol Oct. 2011;49:704–713. doi: 10.3109/13693786.2011.566894. [DOI] [PubMed] [Google Scholar]
- 9.Carmona EM, Limper AH. Update on the diagnosis and treatment of Pneumocystis pneumonia. Ther Adv Respir Dis. 2011;5:41–59. doi: 10.1177/1753465810380102. [DOI] [PMC free article] [PubMed] [Google Scholar]
- 10.Morris A, Wei K, Afshar K, Huang L. Epidemiology and clinical significance of Pneumocystis colonization. J Infect Dis. 2008;197:10–17. doi: 10.1086/523814. [DOI] [PubMed] [Google Scholar]
- 11.Ponce CA, Gallo M, Bustamante R, Vargas SL. Pneumocystis colonization is highly prevalent in the autopsied lungs of the general population. Clin Infect Dis. 2010;50:347–353. doi: 10.1086/649868. [DOI] [PubMed] [Google Scholar]
- 12.Spencer L, Ukwu M, Alexander T, et al. Epidemiology of Pneumocystis colonization in families. Clin Infect Dis. 2008;46:1237–1240. doi: 10.1086/533449. [DOI] [PMC free article] [PubMed] [Google Scholar]
- 13.Dei-Cas E. Pneumocystis infections: the iceberg? Med Mycol. 2000;38(Suppl 1):23–32. doi: 10.1080/mmy.38.s1.23.32. [DOI] [PubMed] [Google Scholar]
- 14.Calderon EJ, Dei-Cas E. Pneumocystis infection: unraveling the colonization-to-disease shift. Expert Rev Anti Infect Ther. 2010;8(3):259–262. doi: 10.1586/eri.10.11. [DOI] [PubMed] [Google Scholar]
- 15.Mekinian A, Durand-Joly I, Hatron PY, et al. Pneumocystis jirovecii colonization in patients with systemic autoimmune diseases: prevalence, risk factors of colonization and outcome. Rheumatology (Oxford) 2011;50:569–577. doi: 10.1093/rheumatology/keq314. [DOI] [PubMed] [Google Scholar]
- 16.Medrano FJ, Montes-Cano M, Conde M, et al. Pneumocystis jirovecii in general population. Emerg Infect Dis Feb. 2005;11(2):245–250. doi: 10.3201/eid1102.040487. [DOI] [PMC free article] [PubMed] [Google Scholar]
- 17.Maskell NA, Waine DJ, Lindley A, et al. Asymptomatic carriage of Pneumocystis jiroveci in subjects undergoing bronchoscopy: a prospective study. Thorax. 2003;58:594–597. doi: 10.1136/thorax.58.7.594. [DOI] [PMC free article] [PubMed] [Google Scholar]
- 18.Larsen HH, Masur H, Kovacs JA, et al. Development and evaluation of a quantitative, touch-down, real-time PCR assay for diagnosing Pneumocystis carinii pneumonia. J Clin Microbiol. 2002;40(2):490–494. doi: 10.1128/JCM.40.2.490-494.2002. [DOI] [PMC free article] [PubMed] [Google Scholar]
- 19.Asai N, Motojima S, Ohkuni Y, et al. Early diagnosis and treatment are crucial for the survival of Pneumocystis pneumonia patients without human immunodeficiency virus infection. J Infect Chemother. 2012;18(6):898–905. doi: 10.1007/s10156-012-0441-4. [DOI] [PubMed] [Google Scholar]
- 20.Thomas CF, Jr, Limper AH. Current insights into the biology and pathogenesis of Pneumocystis pneumonia. Nature. 2007;5(4):298–308. doi: 10.1038/nrmicro1621. [DOI] [PubMed] [Google Scholar]
- 21.Summah H, Zhu YG, Falagas ME, Vouloumanou EK, Qu JM. Use of real-time polymerase chain reaction for the diagnosis of Pneumocystis pneumonia in immunocompromised patients: a meta-analysis. Chin Med J (Engl) 2013;126(10):1965–1973. [PubMed] [Google Scholar]
- 22.Alanio A, Desoubeaux G, Sarfati C, et al. Real-time PCR assay-based strategy for differentiation between active Pneumocystis jirovecii pneumonia and colonization in immunocompromised patients. Clin Microbiol Infect. 2011;17:1531–1537. doi: 10.1111/j.1469-0691.2010.03400.x. [DOI] [PubMed] [Google Scholar]
- 23.Matsumura Y, Ito Y, Iinuma Y, et al. Quantitative real-time PCR and the (1→3)-β-D-glucan assay for differentiation between Pneumocystis jirovecii pneumonia and colonization. Clin Microbiol Infect. 2012;18(6):591–597. doi: 10.1111/j.1469-0691.2011.03605.x. [DOI] [PubMed] [Google Scholar]
- 24.Lu Y, Ling G, Qiang C, et al. PCR diagnosis of Pneumocystis pneumonia: a bivariate meta-analysis. J Clin Microbiol. 2011;49(12):4361–4363. doi: 10.1128/JCM.06066-11. [DOI] [PMC free article] [PubMed] [Google Scholar]
- 25.Persat F, Ranque S, Derouin F, Michel-Nguyen A, Picot S, Sulahian A. Contribution of the (1→3)-β-D-glucan assay for diagnosis of invasive fungal infections. J Clin Microbiol. 2008;46:1009–1013. doi: 10.1128/JCM.02091-07. [DOI] [PMC free article] [PubMed] [Google Scholar]
- 26.Onishi A, Sugiyama D, Kogata Y, et al. Diagnostic accuracy of serum 1,3-β-D-glucan for Pneumocystis jiroveci pneumonia, invasive candidiasis, and invasive aspergillosis: systematic review and meta-analysis. J Clin Microbiol. 2012;50(1):7–15. doi: 10.1128/JCM.05267-11. [DOI] [PMC free article] [PubMed] [Google Scholar]