

Abstract
Background
Little is known about COVID-19 outside Hubei. The aim of this paper was to describe the clinical characteristics and imaging manifestations of hospitalized patients with confirmed COVID-19 infection in Wenzhou, Zhejiang, China.
Methods
In this retrospective cohort study, 149 RT-PCR confirmed positive patients were consecutively enrolled from January 17th to February 10th, 2020 in three tertiary hospitals of Wenzhou. Outcomes were followed up until Feb 15th, 2020.
Findings
A total of 85 patients had Hubei travel/residence history, while another 49 had contact with people from Hubei and 15 had no traceable exposure history to Hubei. Fever, cough and expectoration were the most common symptoms, 14 patients had decreased oxygen saturation, 33 had leukopenia, 53 had lymphopenia, and 82 had elevated C-reactive protein. On chest computed tomography (CT), lung segments 6 and 10 were mostly involved. A total of 287 segments presented ground glass opacity, 637 presented mixed opacity and 170 presented consolidation. Lesions were more localized in the peripheral lung with a patchy form. No significant difference was found between patients with or without Hubei exposure history. Seventeen patients had normal CT on admission of these, 12 had negative findings even10 days later.
Interpretation
Most patients presented with a mild infection in our study. The imaging pattern of multifocal peripheral ground glass or mixed opacity with predominance in the lower lung is highly suspicious of COVID-19 in the first week of disease onset. Nevetheless, some patients can present with a normal chest finding despite testing positive for COVID-19. Funding: We did not receive any fundings.
Keywords: COVID-19, Infection, Outside Hubei, CT, Lung
Introduction
The recent outbreak of the novel coronavirus (COVID-19) has led to a major concern of the potential for not only an epidemic but a pandemic. Although most of the cases are still occurring in Hubei province, China, there are some other epicenters developing in China. COVID-19 appears to be highly contagious. It is classified as a type of RNA virus, belonging to the family of coronaviruses, which primarily leads to a respiratory system infection. One of the primary findings for COVID-19 is pneumonia.1, 2, 3 Although the exact origin of COVID-19 remains unknown, the first reported cases were all linked to the Huanan (Southern China) Seafood Wholesale Market where wild animals (such as bats) were sold illegally.2, 3, 4 Evidence has also been found that it can be transmitted from human to human through respiratory droplets, contact and even via fecal-oral transmission.3, 4, 5, 6
Although control measures have been applied to prevent further spread in China, including isolation of people suspected to have the disease, the need for better diagnosis and treatment of patients with pneumonia is no longer limited to Wuhan, especially with the huge turnover during the spring festival period. The infection of COVID-19 is spreading fast with increasing numbers of infected patients nationwide and worldwide.
Wenzhou is a city located in Zhejiang province with a population of 9.25 million. Wenzhou people are usually merchants by profession and frequently travel from city to city or work and live in other cities for business purposes. Currently, approximately 180,000 Wenzhou residents live in Wuhan and 33,000 Wenzhou people have been detected returning from Wuhan and its surrounding areas according to the Wenzhou city government new released on Jan 29, 2020. As consequence, Wenzhou is reported as the city with the most confirmed cases of COVID-19 outside Hubei province in China. By Feb 15th 2020, according to the government announcement, there are 66,580 confirmed cases reported in China, 1162 cases reported from Zhejiang province and 499 cases reported from Wenzhou city.7
Serious cases of COVID-19 can develop severe pneumonia, ARDS and multiple organ failures leading to death, while non severe cases present ordinary symptoms of respiratory system infection.1, 2, 3, 4, 5, 6 The mortality and rate of severe cases up to Feb 15th 2020 in Hubei province and Wenzhou city were 2.6% vs 0% (1457/54,406 vs 0/499) and 15.2% vs 5.2% (8276/54,406 vs 26/499), showing a significant regional difference.6 However, little is known about COVID-19 outside Wuhan, although Chang et al.8 reported 13 cases in Beijing and Guan et al.9 reported 1099 cases in all of China. In Guan et al's study, the statistical analysis was done at the level of the whole cohort, no regional analysis was performed9.
Furthermore, from the point of view of etiology, the virulence of a pathogen can sometimes sharply increase during the host shift,10 , 11 in the case of COVID-19 from possible wild animals sold in the seafood market to humans. In contrast, virulence will decrease through long term host-parasite interactions.12 But it should be mentioned that virulence is often an indirect effect of the pathogen, such as an inappropriate immune response12). And also the prognosis of the patients depends on a wide range of factors. Even so, we still sought to analyze the difference of clinical characteristics and imaging manifestations between the patients of Wenzhou city with or without Hubei residence travel history, that is, between different generations of patients transmitting the virus.
Hence, the aim of this case series was to describe the clinical characteristics and imaging manifestations with confirmed COVID-19 infection admitted to hospitals in Wenzhou, and analyze the difference between patients with or without Hubei province residence/travel history.
Methods
Study participants and design
This retrospective multi-center cohort study was approved by the Institutional Review Board of each participating site. The written informed consent was waived. The patients were consecutively enrolled from January 17th to February 10th, 2020 in three tertiary hospitals of Wenzhou city, including the Wenzhou central hospital in the urban area, and two county level hospitals, specifically Ruian people's hospital and Yueqing people‘s hospital. All the patients were hospitalized and had laboratory confirmed COVID-19 infection. The clinical outcomes were monitored up to Feb 15th, 2020, the final date of follow-up.
Data collection
All the clinical data on epidemiology (including recent exposure history), signs and symptoms, underlying comorbidities and laboratory results were retrospectively extracted from electronic medical records and checked by both on-site and off-site doctors. The real-time reverse transcriptase polymerase chain-reaction (RT-PCR) test was performed using nasal and pharyngeal swab specimens or induced sputum at Wenzhou municipal Center for Disease Prevention and Control (CDC). The date of disease onset was defined as the day when the symptom was noticed.
Pneumonia was diagnosed based on the IDSA/ATS guidelines.13 In brief, patients with at least one of the clinical symptoms of cough, sputum, fever, dyspnea, and pleuritic chest pain, plus at least one finding of coarse crackles on auscultation or elevated inflammatory biomarkers, in addition to a new pulmonary infiltration on chest CT, were diagnosed as having pneumonia. The worldwide accepted pneumonia severity scoring systems, including Pneumonia Severity Index (PSI)14 and the CURB-65,15 were used to assess pneumonia severity.
Imaging analysis and quantification
All patients underwent chest CT examinations. Images were reconstructed with a slice thickness of 1–1.5 mm using a lung kernel as part of the reconstruction process. All imaging features were reviewed and evaluated by two experienced radiologists (7, 17 years of experience in thoracic CT). Decisions were reached by consensus. The CT features including ground glass opacity (GGO) and mixed GGO, consolidation were evaluated. Lesion size was described as grade 1 (diameter, <1 cm), grade 2 (diameter, 1–3 cm), grade 3 (diameter, 3 cm to 50% of the segment), or grade 4 (over 50% of the segment) according to the previously described methods.16 Each segment was reviewed and scored. Then a total pulmonary infiltration score was calculated, that is to say, the sum of scores of all the 18 pulmonary segments was used. The number of affected lung lobes and segments were also counted. The location of the lesion was considered as peripheral if it was in the outer one-third of the lung; otherwise, it was considered as central. Other radiological patterns were also evaluated.
Statistical analysis
The Kolmogorov-Smirnov test was used to evaluate distribution type. Normally distributed data were expressed as mean ± standard deviation. Non-normally distributed data and ordinal data were expressed as median (inter-quartile range). Independent sample t-test and Mann–Whitney U test were used to compare the differences of clinical and radiological data between patients with different exposure history. The Friedman test was used to compare scores of various segments of left and right lobe, with the post hoc analysis done using the Dunn–Bonferroni test. A p-value less than 0.05 was considered as statistically significant.
Results
A total of 149 patients, including 40 patients from Wenzhou central hospital, 64 patients from Ruian people's hospital and 45 patients from Yueqing people‘s hospital were recruited. The demographic and clinical characteristics are shown in Table 1 . The average age was 45.11 ± 13.35 years old, and 81 patients (54.4%) were males. A total of 85 patients had Hubei travel/residence history, 49 patients had contact with people from Hubei province and 15 patients had no traceable exposure history to Hubei. Of the 149 patients, 52 (34.9%) had underlying chronic diseases, including cerebrovascular diseases, digestive diseases, etc. (Table 1). No medical staff were patients in this cohort.
Table 1.
Demographics, baseline characteristics of overall 149 patients.
| General data | Overall (N = 149) |
|---|---|
| Age | 45.11 ± 13.35 |
| Sex | Male/Female(81/68) |
| Height (cm) | 167 (11.75) |
| Weight (kg) | 65.92 (18.75) |
| BMI | 23.75 (4.54) |
| Exposure history | |
| Stay in Wuhan | 80(53.69%) |
| stay in Hubei Province except Wuhan | 5(3.36%) |
| Contact with people from Hubei Province | 49(32.89%) |
| No relation with Hubei Province | 15(10.06%) |
| Chronic disease | |
| cardio-cerebrovascular disease | 28(18.79%) |
| digestive system diseases | 8 (5.37%) |
| endocrine diseases | 9(6.04%) |
| malignant tumor | 2(1.34%) |
| neural system diseases | 0(0%) |
| respiratory system diseases | 1(0.67%) |
| others | 4(2.68%) |
| Temperature (°C) | 37.86±0.87 |
| pH | 7.11 (0.04) |
| increased | 21 (14.09%) |
| decreased | 4 (2.68%) |
| PaO2 (kpa, range80-100) | 96.05 (25.58) |
| decreased | 23 (15.44%), 56.25 ± 6.58 |
| SaO% (range≥95%) | 97.43% (2%) |
| decreased | 14 (9.4%) |
| Heart rate (beats per minute) | 88.63 ± 14.27 |
| Systolic pressure (mmHg) | 129.98 ± 15.44 |
| Diastolic pressure (mmHg) | 81.69 ± 10.16 |
BMI: body mass index; PH: hydrogen ion concentration.
Signs and symptoms at admission, treatment and clinic outcome are summarized in Table 2 . The median interval between symptom onset and hospitalization was 6.8 (5.0) days. On admission, fever (114/149, 76.5%), cough (87/149, 58.4%) and expectoration (48/149, 32.2%) were the most common symptoms, whereas vomiting (2/149 1.3%) and dyspnea (2/149 1.3%) were rare. A total of 14(9.4%) patients had decreased oxygen saturation. On admission, 33 (24.2%) and 53 (35.6%) patients had leukopenia and lymphopenia, respectively. Platelets were below the normal range in 20 (13.4%) patients. Overall, 82 (55.0%) patients demonstrated elevated levels of C-reactive protein while elevated levels of alanine aminotransferase, aspartate aminotransferase, creatine kinase and D-dimer were less common (Table 3 ).
Table 2.
Signs and symptoms at admission, treatment and clinic outcome of overall 149 patients.
| General data | Overall (N = 149) |
|---|---|
| Onset-inpatient interval (day) | 6.83 (5) |
| Signs and symptoms at admission | |
| fever | 114(76.51%) |
| cough | 87(58.39%) |
| expectoration | 48(32.21%) |
| dyspnea | 2(1.34%) |
| muscle pain | 5(3.36%) |
| headache | 13(8.72%) |
| sore throat | 21(14.09%) |
| snotty | 5(3.36%) |
| chest pain | 5(3.36%) |
| chest tightness | 16(10.74%) |
| chill | 21(14.09%) |
| diarrhea | 11(7.38%) |
| nausea and vomiting | 2(1.34%) |
| CURB-65 score | 0/1 (134/15) |
| PSI grading | I/II/III/IV/V (82/54/10/3/0) |
| Treatment | N = 149 |
| Oxygen therapy | 134 (89.93%) |
| NIV | 2 (1.34%) |
| IMV | 0 (0.0%) |
| ICU | 0 (0.0%) |
| Antibiotic treatment | 34 (22.82%) |
| Antifungal treatment | 0 (0.0%) |
| Antiviral treatment | 140 (93.96%) |
| Interferon administration | 144 (96.64%) |
| Glucocorticoids | 5 (3.36%) |
| Immunoglobulin therapy | 19 (12.75%) |
| Clinical outcome | |
| Remained in hospital | 76 (51.01%) |
| Discharged | 73 (48.99%) |
| Died | 0 (0.0%) |
ICU: intensive care unit; NIV: noninvasive ventilation; IMV: invasive mechanical ventilation; ECOM: extracorporeal membrane oxygenator.
Table 3.
Laboratory test of 149 patients.
| Blood routine | N = 149 |
|---|---|
| leucocyte (× 10⁹per L) (range 3.5–9.5) | 4.56 (2.48) |
| increased | 2 (1.34%), 10.54 ± 1.36 |
| decreased | 33 (24.16%), 3 ± 0.42 |
| neutrophil (× 10⁹per L) (range 1.8–6.3) | 2.60 (2.03) |
| increase | 6 (4.03%), 7.56 ± 0.94 |
| decreased | 34 (22.82%), 1.5 ± 0.28 |
| lymphocyte (× 10⁹ per L) (range 1.1–3.2) | 1.21 (0.68) |
| decreased | 53 (35.57%), 0.85 ± 0.21 |
| platelet (× 10⁹ per L) (range 125–350) | 174.5 (78.25) |
| increased | 8 (5.37%), 389.33 ± 23.11 |
| decreased | 20 (13.42%), 107 ± 12.73 |
| Blood coagulation | |
| active partial thrombin time (s, range 22–36) | 33.29 ± 4.98 |
| increased | 40 (26.85%), 37±0.99 |
| Prothrombin time (s, range 10–13.5) | 12.20 ± 1.53 |
| increased | 17 (11.41%), 13.65 ± 0.07 |
| decreased | 4 (2.68%), 9.75 ± 0.07 |
| D-dimer (mg/L; normal range <0.55) | 0.22 (0.28) |
| increased | 21 (14.09%), 0.57 ± 0.01 |
| Blood biochemistry | |
| albumin (g/L, range 35–57) | 41.65 (5.48) |
| increased | 3 (2.01%), 62.97 ± 1.67 |
| decreased | 9 (6.04%), 30.83 ± 4.97 |
| ALT (IU/L, range 0–64) | 20 (20.5) |
| increased | 18 (12.08%), 97.00 ± 42.52 |
| decreased | 2 (1.34%), 8.00 ± 1.41 |
| AST (IU/L, range 8–40) | 23 (15.75) |
| increased | 27 (18.12%), 63.04 ± 25.60 |
| total bilirubin (μmol/L, range 4.7–24) | 9.9 (5.95) |
| increased | 4 (2.68%), 26.5 ± 1.70 |
| decreased | 7 (4.70%), 2.75 ± 1.06 |
| urea nitrogen (mmol/L, range2.6–7.5) | 3.8 (1.4) |
| decreased | 17 (11.41%), 1.80 ± 0.28 |
| creatinine (μmol/L, range 41–73) | 66.07 ± 14.79 |
| increased | 43 (28.86%), 74.33 ± 0.52 |
| decreased | 1 (0.67%), 36 |
| CK (mmol/L, range 40–200) | 76.5 (53.5) |
| increased | 12 (8.05%), 217.00 ± 18.39 |
| decreased | 19 (12.75%), 25.50 ± 0.71 |
| LDH (U/L, range12–250) | 210 (94.5) |
| increased | 45 (30.20%), 322.64 ± 68.25 |
| Glucose (mmol/L, range3.9–6.1) | 5.83 (1.97) |
| increased | 59 (39.60%), 6.17 ± 0.04 |
| decreased | 1 (0.67%), 2.93 |
| Infection-associated | |
| C-reactive protein (mg/L, 0.0–6.0) | 7.25 (23) |
| increased | 82 (55.03%), 6.36 ± 0.09 |
ALT: alanine aminotransferase; AST: aspartate transaminase; LDH: lactate dehydrogenase; CK: creatine kinase.
No complications such as acute respiratory distress syndrome, acute respiratory system injury, acute kidney injury or septic shock occurred in our cohort. Concerning the pneumonia severity score, for Curb-65, 134 patients had a zero score, 15 patients had a score of 1. For PSI, 82 patients were graded class I, 54 patients class II, 10 patients class III, 3 patients class IV, and no patients were graded with class V. All these scoring measures reflected the mild severity of our patients. Most of our patients had oxygen therapy (134/149,89.93%), antiviral treatment (140/149,93.96%) and interferon administration (144/149,96.64%). Two patients used noninvasive mechanical ventilation, none of our patients used invasive mechanical ventilator, ECMO, or were sent to the ICU. Up until Feb 15th 2020, 76 patients remained in the hospital, 73 were discharged and no patient died.
The radiological data on admission is summarized in Table 4 . The median interval between symptom onset and CT examination was 7.61 (7) days. On admission, by median, each patient had 3 (4) involved pulmonary lobes and 6 (10.5) involved segments. Segment 6 and 10 were the most involved (p < 0.001). A total of 287 (12.1%) segments presented GGO, 637 (26.8%) segments presented mixed opacity and 170 (7.2%) segments presented consolidation. The lesions were more localized in the periphery rather than the center of the lung (853,35.9% vs 51, 2.15%). There were more patchy lesions than oval lesions (935,39.35% vs 157, 6.6%). Other imaging patterns such as centrilobular nodules, tree-in-bud sign, cystic change, lymphadenopathy and pleural effusion were rare.
Table 4.
Radiological data of all patients.
| Onset-CT interval (day) | 7.61 (7) |
| Lobes involved | 3 (4) |
| Segments involved | 6 (10.5) |
| Pulmonary infiltration (segment level) | N = 132×18=2376 |
| Density | |
| GGO/mixed/consolidation | 287/637/170 (12.08%/26.81%/7.15%) |
| Location | |
| Peripheral/central/both | 853/51/193 (35.9%/2.15%/8.12%) |
| Form | |
| Patchy/oval | 935/157 (39.35%/6.6%) |
| Radiological score | 12.5 (24.5) |
| Other Radiological pattern | N = 144 |
| Air bronchogram | N/Y(68/81) |
| Centrilobular nodules | N/Y(146/3) |
| tree-in-bud | N/Y(148/1) |
| Reticular pattern | N/Y(70/79) |
| Subpleural linear opacity | N/Y(118/31) |
| Bronchial dilatation | N/Y(123/26) |
| Cystic change | N/Y(137/12) |
| lymphadenopathy | N/Y(142/7) |
| Pleural effusion | N/Y(139/10) |
N: without manifestation; Y: with manifestation.
Comparison between patients with different exposure history was also performed. No significant difference of demographic, clinical characteristics, laboratory test or imaging manifestations was found between these two groups (all p > 0.05) (Supplementary Tables 1–4).
Interestingly, 17 out of 149 (11.4%) of our patients had normal chest CT findings on admission. Among these 17 patients, chest CT of 12 patients kept being negative, with the latest follow-up CT 10.3 days later. In contrast, the chest CT of the other 5 patients became positive over an average of 7 days. The symptoms of these 12 patients included fever (8 patients), cough (3 patients), expectoration (1 patient), headache (1 patient), sore throat (2 patients), snotty (1 patient), diarrhea (1 patient). Two patients presented leukopenia, 1 patient presented lymphopenia.
Discussion
To our knowledge, this report is the largest multi-center case series data of hospitalized patients from one city with COVID-19. By February 10th 2020, 149 patients were recruited from 3 tertiary hospitals in Wenzhou, which is the city with the most confirmed cases of COVID-19 outside Hubei province in China.
The main findings for this cohort is that patients had milder infection, especially relative to published data from Wuhan.2 , 4 , 6 , 9 In our study, the signs, symptoms and laboratory test characteristics of COVID-19 were generally consistent with these previous publications. But none of our patients was sent to the ICU or had shock, while only two had used non-invasive mechanical ventilation. In contrast, the rate of ICU, shock and mechanical ventilation of studies from Wuhan is much higher, being 23–31.7%, 4–16.7% and 17–46.3%, respectively.2 , 4 , 6 , 9 The announced mortality (2.6% vs 0%) and rate of severe cases (15.2% vs 5.2%) of Hubei vs. Wenzhou remains much higher showing a significant regional difference. Our results appear to be similar to those 13 patients from Beijing8 where all of them recovered.
The potential explanation of this difference is the lack of medical care resources in Hubei during the outbreak. Hospitals in Wuhan tend to hospitalize severe patients, resulting in the high rate of severe cases and mortality in the publications. According to the statistical paper by Zhou et al., the most conservative estimate of 54,000 infections in Wuhan, and the current 8000 plus beds available in the local hospitals don't have enough space for patients with milder infections.17 Therefore, we presume in a region such as Wenzhou, where there are enough medical facilities and not so many patients that they can provide early medical care to all affected patients, therefore, making it appear that the prognosis of COVID-19 is improved.
Another concern from the point of view of etiology, for a pandemic disease, in general, pathogens tend to reduce their virulence in order to maximize their between-host transmission,9 and hosts have been selected to reduce the harm caused by their pathogen,10, 11, 12 otherwise the lack of adaptation in novel host-pathogen associations may suspend the transmission seen in some emerging diseases.18 Albeit, no significant difference of demographic, clinical characteristics, laboratory test or imaging manifestations has been found between patients with or without Hubei travel or resident history (all p > 0.05), although the severity of our cohort is less than that of Wuhan. Further comparison studies could be carried out between patients with a long- term time gap of disease onset in the same geographic location.
Our study provided a meticulous evaluation of pulmonary infiltration of COVID-19 on CT. The imaging pattern of multifocal peripheral GGO, mixed GGO or consolidation with predominance in the lower lung (S6,10), with more extensive mixed opacity than GGO and consolidation is highly suspicious of 2019-nCoV infection when considering an interval between symptom onset and CT examination of 7.61 (7) days. The description of imaging features has been limited in the clinical literature. Our findings are compatible with other small sample size (51 and 21 cases) radiological publications.19 , 20 Since the form of lesion could be oval sometimes instead of patchy, physicians and radiologists should keep in mind the diversity of imaging presentations of COVID-19. Human coronaviruses are considered as important pathogens that cause respiratory infection. There were two other previous coronavirus outbreaks, including (severe acute respiratory syndrome coronavirus) SARS-CoV and Middle East respiratory syndrome (MERS)-CoV. All these three coronavirus infections have similar common radiographic manifestations at presentation, including unilateral or bilateral GGO or consolidation, while COVID-19 shows more extensive GGO than consolidation, which is consistent with the clinical scenario.21, 22, 23, 24, 25, 26
All reported patients in Wuhan showed pulmonary infiltration in chest computed tomography (CT).2 , 4 , 6 However, Guan et al.9 reported 230 out of 1099 (20.1%) cases and Chuang et al.20 reported 3 out of 21 (14.3%) having normal CT scans for patients diagnosed with symptoms plus RT-PCR positive findings. In our study, 17 out of 149 (11.4%) of our patients had normal chest CT on admission and 12 remained negative 10 days later. This finding suggests that a normal chest CT scan cannot exclude the diagnosis of COVID-19. Therefore, clinicians et radiologists should still suspect patients with typical symptoms, such as fever, cough, lymphopenia, and exposure history, and give them an RT-PCR test.
As far as treating patients is concerned, antiviral treatment has been used for COVID-19.2 , 4 , 6 , 9 Nevertheless, until now, no specific treatment has been recommended except for supportive care. Randomized controlled trial are being rapidly initiated to assess the efficacy and safety of antiviral drugs.
This study has several limitations. First, the incubation period, which is the time between the infection and symptom onset, was not analyzed in our study, since the time of infection cannot be determined for the patients with resident history in Hubei. Second, it is reported that some patients with positive chest CT findings may have negative RT-PCR results. In that case, it is suggested that the RT-PCR tests be repeated especially for the patients with high clinical suspicion of COVID-19.27 Hence, only the positive cases confirmed by the CDC were included in our study. The pre-transfer data was not available. Third, a part of our patients still remain in the hospital, so technically the final clinic outcome is not complete.
In conclusion, most patients from Wenzhou city, Zhejiang province presented mild infection in our study. The imaging pattern of multifocal peripheral GGO, mixed GGO or consolidation with predominance in the lower lung, more extensive mixed opacity than GGO and consolidation is highly suspicious of COVID-19 infection during the outbreak in the first week of disease onset. Some patients with COVID-19 can present with normal chest findings, suggesting that a normal chest CT scan cannot exclude the diagnosis of COVID-19 (Fig. 1 ).
Fig. 1.
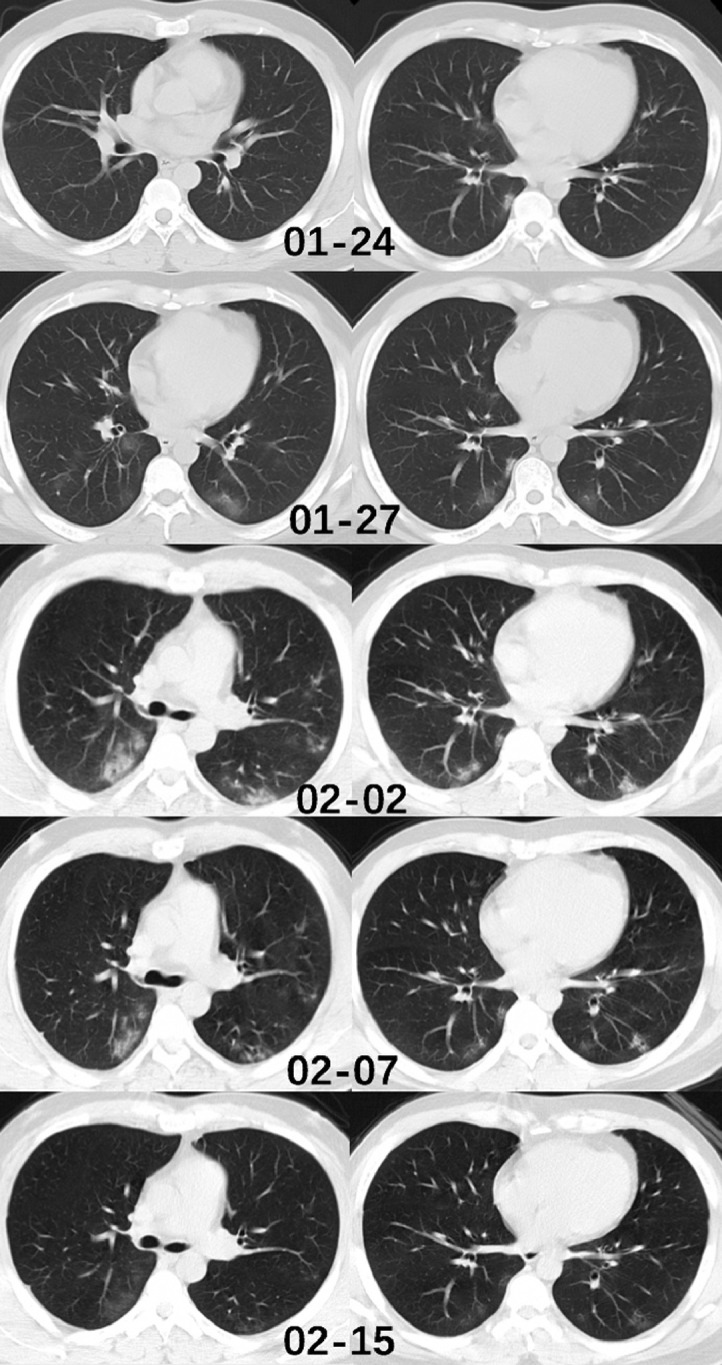
Chest CT of a male patient, 37 years old. This individual came back from Wuhan to Wenzhou on January 19th. He presented with cough and expectoration. He underwent a chest CT examination on January 24th, which showed subtle peripheral ground glass opacity in the middle lobe, and right inferior lobe. He was hospitalized on the same day. The RT-PCR test was done and was found to be positive. The CT images of January 27th and February 2nd showed a significant increase of lesion number and density, especially in the both lower lobes. Two RT-PCR tests were performed on February 4th and 7th and both results were negative. The CT images of February 7th showed a decrease in density of the pulmonary lesions. On the CT examination of February 15th, the lesions were absorbed and the patient was discharged. During the hospitalization, the patient had arbidol as antiviral treatment and nasal spray of interferon, no oxygen therapy was performed since the oxygen saturation of the patient remained normal. The patient had no fever during the entire disease course.
Declaration of Competing Interest
The authors of this study declare that they each have no conflict of interest.
Acknowledgement
We thank Prof. E Mark Haacke for his great help in the revision of this manuscript.
Footnotes
Supplementary material associated with this article can be found, in the online version, at doi:10.1016/j.jinf.2020.02.016.
Appendix. Supplementary materials
References
- 1.Zhu N., Zhang D., Wang W. A novel coronavirus from patients with pneumonia in China, 2019 [published online ahead of print, 2020 Jan 24] N Engl J Med. 2020 doi: 10.1056/NEJMoa2001017. [DOI] [PMC free article] [PubMed] [Google Scholar]
- 2.Huang C., Wang Y., Li X. Clinical features of patients infected with 2019 novel coronavirus in Wuhan, China [published online ahead of print, 2020 Jan 24] Lancet. 2020 doi: 10.1016/S0140-6736(20)30183-5. S0140-6736(20)30183-5. [DOI] [PMC free article] [PubMed] [Google Scholar]
- 3.Li Q., Guan X., Wu P. Early transmission dynamics in Wuhan, China, of novel coronavirus-infected pneumonia [published online ahead of print, 2020 Jan 29] N Engl J Med. 2020 doi: 10.1056/NEJMoa2001316. [DOI] [PMC free article] [PubMed] [Google Scholar]
- 4.N. Chen, M. Zhou, X. Dong et al., Epidemiological and clinical characteristics of 99 cases of 2019 novel coronavirus pneumonia in Wuhan, China: a descriptive study. [published online ahead of print, 2020 Jan 29]. Lancet. [DOI] [PMC free article] [PubMed]
- 5.Chan J.F., Yuan S., Kok K.H. A familial cluster of pneumonia associated with the 2019 novel coronavirus indicating person-to-person transmission: a study of a family cluster [published online ahead of print, 2020 Jan 24] Lancet. 2020 doi: 10.1016/S0140-6736(20)30154-9. S0140-6736(20)30154-9. [DOI] [PMC free article] [PubMed] [Google Scholar]
- 6.Wang D., Hu B., Hu C. Clinical characteristics of 138 hospitalized patients with 2019 novel coronavirus-infected pneumonia in Wuhan, China [published online ahead of print, 2020 Feb 7] JAMA. 2020 doi: 10.1001/jama.2020.1585. [DOI] [PMC free article] [PubMed] [Google Scholar]
- 7.National health commission of the People's Republic of China. http://www.nhc.gov.cn/xcs/yqtb/202002/4a611bc7fa20411f8ba1c8084426c0d4.shtml [DOI] [PMC free article] [PubMed]
- 8.Chang D., Lin M., Wei L. Epidemiologic and clinical characteristics of novel coronavirus infections involving 13 patients outside Wuhan, China [published online ahead of print, 2020 Feb 7] JAMA. 2020 doi: 10.1001/jama.2020.1623. [DOI] [PMC free article] [PubMed] [Google Scholar]
- 9.Wei-jie Guan, Zheng-yi Ni, Yu Hu, et al. Clinical characteristics of 2019 novel coronavirus infection in China. medRxiv2020.02.06.20020974.
- 10.Jones K.E., Patel N.G., Levy M.A., Storeygard A., Balk D. Global trends in emerging infectiousdiseases. Nature. 2008;451:990–993. doi: 10.1038/nature06536. [DOI] [PMC free article] [PubMed] [Google Scholar]
- 11.Woolhouse M.E., Haydon D.T., Antia R. Emerging pathogens: the epidemiology and evolution of species jumps. Trends Ecol Evol. 2005;20:238–244. doi: 10.1016/j.tree.2005.02.009. [DOI] [PMC free article] [PubMed] [Google Scholar]
- 12.Alizon S., Hurford A., Mideo N., Van Baalen M. Virulence evolution and the trade-off hypothesis:history, current state of affairs and the future. J Evol Biol. 2009;22:245–259. doi: 10.1111/j.1420-9101.2008.01658.x. [DOI] [PubMed] [Google Scholar]
- 13.Mandell L.A., Wunderink R.G., Anzueto A., Bartlett J.G., Campbell G.D., Dean N.C. Infectious diseases society of America/American Thoracic Society consensus guidelines on the management of community-acquired pneumonia in adults. Clin Infect Dis. 2007;44(Suppl.2):S27e72. doi: 10.1086/511159. [DOI] [PMC free article] [PubMed] [Google Scholar]
- 14.Fine M.J., Auble T.E., Yealy D.M., Hanusa B.H., Weissfeld L.A., Singer D.E. A prediction rule to identify low-risk patients with community-acquired pneumonia. N Engl J Med. 1997;336:243e50. doi: 10.1056/NEJM199701233360402. [DOI] [PubMed] [Google Scholar]
- 15.Lim W.S., van der Eerden M.M., Laing R., Boersma W.G., Karalus N., Town G.I. Defining community-acquired pneumonia severity on presentation to hospital: an international derivation and validation study. Thorax. 2003;58:377e82. doi: 10.1136/thorax.58.5.377. [DOI] [PMC free article] [PubMed] [Google Scholar]
- 16.Wong K.T., Antonio G.E., Hui D.S. Thin-section ct of severe acute respiratory syndrome: evaluation of 73 patients exposed to or with the disease. Radiology. 2003;228(2):395–400. doi: 10.1148/radiol.2283030541. [DOI] [PubMed] [Google Scholar]
- 17.Yongdao Zhou, Jianghu Dong. Statistical inference for coronavirus infected patients in Wuhan. medRxiv2020.02.10.20021774;
- 18.Blumberg S., Lloyd-Smith J.O. Inference of R(0) and transmission heterogeneity from the size distribution of stuttering chains. PLoS Comput Biol. 2013;9 doi: 10.1371/journal.pcbi.1002993. [DOI] [PMC free article] [PubMed] [Google Scholar]
- 19.Song F., Shi N., Shan F. Emerging Coronavirus 2019-nCoV Pneumonia [published online ahead of print, 2020 Feb 6] Radiology. 2020 [Google Scholar]
- 20.Chung M., Bernheim A., Mei X. CT imaging features of 2019 novel coronavirus (2019-nCoV) Radiology. 2020 doi: 10.1148/radiol.2020200230. [published online ahead of print, 2020 Feb 4] [DOI] [PMC free article] [PubMed] [Google Scholar]
- 21.Müller N.L., Ooi G.C., Khong P.L., Nicolaou S. Severe acute respiratory syndrome: radiographic and CT findings. AJR Am J Roentgenol. 2003;181(1):3–8. doi: 10.2214/ajr.181.1.1810003. [DOI] [PubMed] [Google Scholar]
- 22.Müller N.L., Ooi G.C., Khong P.L., Zhou L.J., Tsang K.W., Nicolaou S. High-resolution CT findings of severe acute respiratory syndrome at presentation and after admission. AJR Am J Roentgenol. 2004;182(1):39–44. doi: 10.2214/ajr.182.1.1820039. [DOI] [PubMed] [Google Scholar]
- 23.Chan M.S., Chan I.Y., Fung K.H., Poon E., Yam L.Y., Lau K.Y. High-resolution CT findings in patients with severe acute respiratory syndrome: a pattern-based approach. AJR Am J Roentgenol. 2004;182(1):49–56. doi: 10.2214/ajr.182.1.1820049. [DOI] [PubMed] [Google Scholar]
- 24.Wong K.T., Antonio G.E., Hui D.S. Thin-section CT of severe acute respiratory syndrome: evaluation of 73 patients exposed to or with the disease. Radiology. 2003;228(2):395–400. doi: 10.1148/radiol.2283030541. [DOI] [PubMed] [Google Scholar]
- 25.Ajlan A.M., Ahyad R.A., Jamjoom L.G., Alharthy A., Madani T.A. Middle East respiratory syndrome coronavirus (MERS-CoV) infection: chest CT findings. AJR Am J Roentgenol. 2014;203(4):782–787. doi: 10.2214/AJR.14.13021. [DOI] [PubMed] [Google Scholar]
- 26.Das K.M., Lee E.Y., Langer R.D., Larsson S.G. Middle east respiratory syndrome coronavirus: what does a radiologist need to know? AJR Am J Roentgenol. 2016;206(6):1193–1201. doi: 10.2214/AJR.15.15363. [DOI] [PubMed] [Google Scholar]
- 27.Xie X., Zhong Z., Zhao W., Zheng C., Wang F., Liu J. Chest CT for typical 2019-nCoV pneumonia: relationship to negative RT-PCR testing. Radiology. 2020 doi: 10.1148/radiol.2020200343. [DOI] [PMC free article] [PubMed] [Google Scholar]
Associated Data
This section collects any data citations, data availability statements, or supplementary materials included in this article.