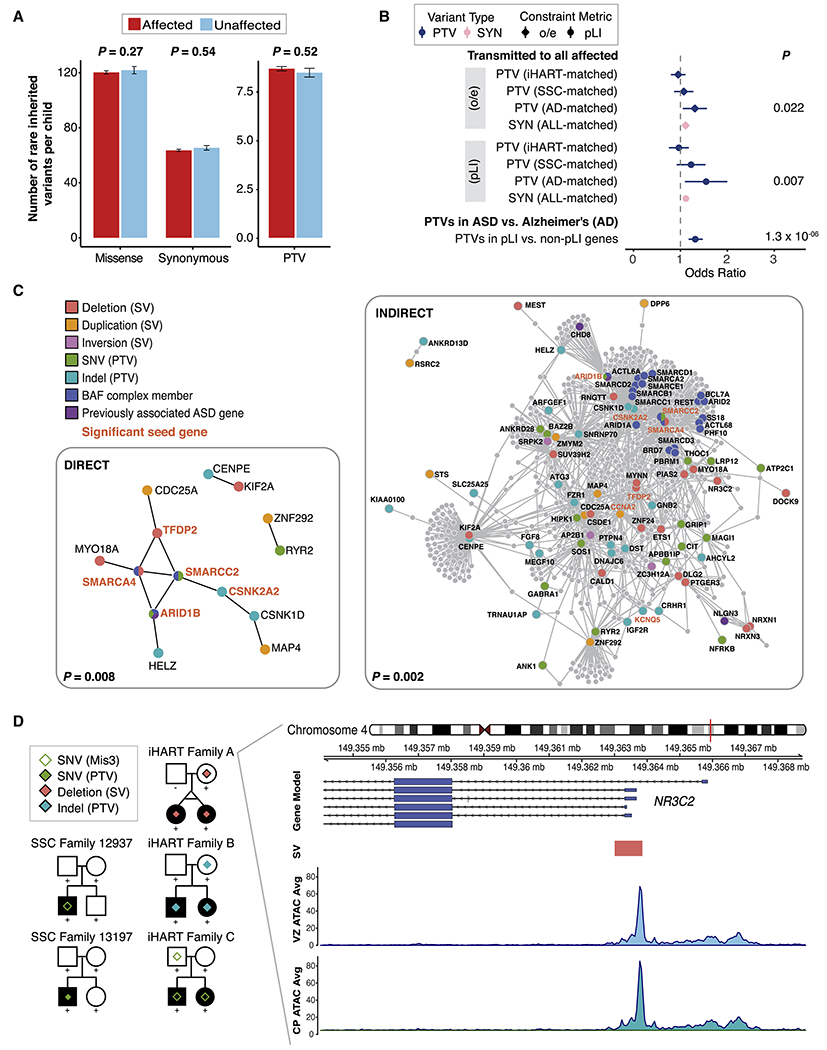
Figure 2. Inherited ASD-risk genes.

(A) The number of rare inherited coding variants per fully phase-able child is displayed for 960 affected (red) and 217 unaffected (blue) children by variant consequence. Mean ± SE rates are shown. (B) Odds ratios from simulations of high-risk inherited PTV or SYN variants. Results are shown for constrained genes (gnomAD pLI score or gnomAD o/e score) and the cohort used for calculation of the null PTV or SYN rate is displayed (cohort-matched class rate). The odds ratio resulting from a Fisher’s exact test comparing the rate of PTVs in constrained vs. non-constrained genes in the iHART and SSC cohorts to that observed in the Alzheimer’s Disease cohort is also shown. Significant p-values are displayed. Whiskers represent 95% confidence intervals. (C) Direct and indirect PPI networks formed by constrained genes harboring PTVs or SVs (promoter or exon disrupting) transmitted to all affected and no unaffected children in a family. Proteins are colored according to the variant category of the variant identified in the high-risk inherited analysis, and previously known ASD-risk genes (Sanders et al., 2015) are shown in purple. Significant seed genes are bold and orange. P-values from 1,000 permutations. (D) Pedigrees for five ASD families with coding or regulatory NR3C2 variants. Square=male, circle=female, filled shape=individual with ASD, ‘+’=sequenced individual. Both SSC families harbor de novo variants in the proband (a PTV in SSC13197 and a probably damaging missense (Mis3, a “probably damaging” prediction by PolyPhen-2 (Adzhubei et al., 2010)) in SSC12937). iHART families A-C harbor rare inherited variants transmitted to both affected children; including a ~850bp deletion in family A, a PTV in family B, and a Mis3 variant in family C. The NR3C2 promoter-disrupting deletion (orange rectangle, chr4:149363005-149363852) overlaps a functional non-coding regulatory region in developing human brain (chr4:149362706-149367485) (de la Torre-Ubieta et al., 2018). The average ATAC-seq peak read depth from the cortical plate (CP) and ventricular zone (VZ) of developing human brain samples (n=3) are shown below the NR3C2 deletion.
