

Abstract
Autism spectrum disorder (ASD) involves substantial genetic contributions. These contributions are profoundly heterogeneous but may converge on common pathways that are not yet well understood1–3. Here, through post-mortem genome-wide transcriptome analysis of the largest cohort of samples analysed so far, to our knowledge4–7, we interrogate the noncoding transcriptome, alternative splicing, and upstream molecular regulators to broaden our understanding of molecular convergence in ASD. Our analysis reveals ASD-associated dysregulation of primate-specific long noncoding RNAs (lncRNAs), downregulation of the alternative splicing of activity-dependent neuron-specific exons, and attenuation of normal differences in gene expression between the frontal and temporal lobes. Our data suggest that SOX5, a transcription factor involved in neuron fate specification, contributes to this reduction in regional differences. We further demonstrate that a genetically defined subtype of ASD, chromosome 15q11.2–13.1 duplication syndrome (dup15q), shares the core transcriptomic signature observed in idiopathic ASD. Co-expression network analysis reveals that individuals with ASD show age-related changes in the trajectory of microglial and synaptic function over the first two decades, and suggests that genetic risk for ASD may influence changes in regional cortical gene expression. Our findings illustrate how diverse genetic perturbations can lead to phenotypic convergence at multiple biological levels in a complex neuropsychiatric disorder.
We performed rRNA-depleted RNA sequencing (RNA-seq) of 251 post-mortem samples of frontal and temporal cortex and cerebellum from 48 individuals with ASD and 49 control subjects (Methods and Extended Data Fig. 1a–h). We first validated differential gene expression (DGE) between samples of cortex from control individuals and those with ASD (ASD cortex) by comparing gene expression with that of different individuals from those previously profiled by microarray8, and found strong concordance (R2 = 0.60; Fig. 1a, Extended Data Fig. 1i). This constitutes an independent technical and biological replication of shared molecular alterations in ASD cortex.
Figure 1 |. Transcriptome-wide differential gene expression and alternative splicing in ASD.
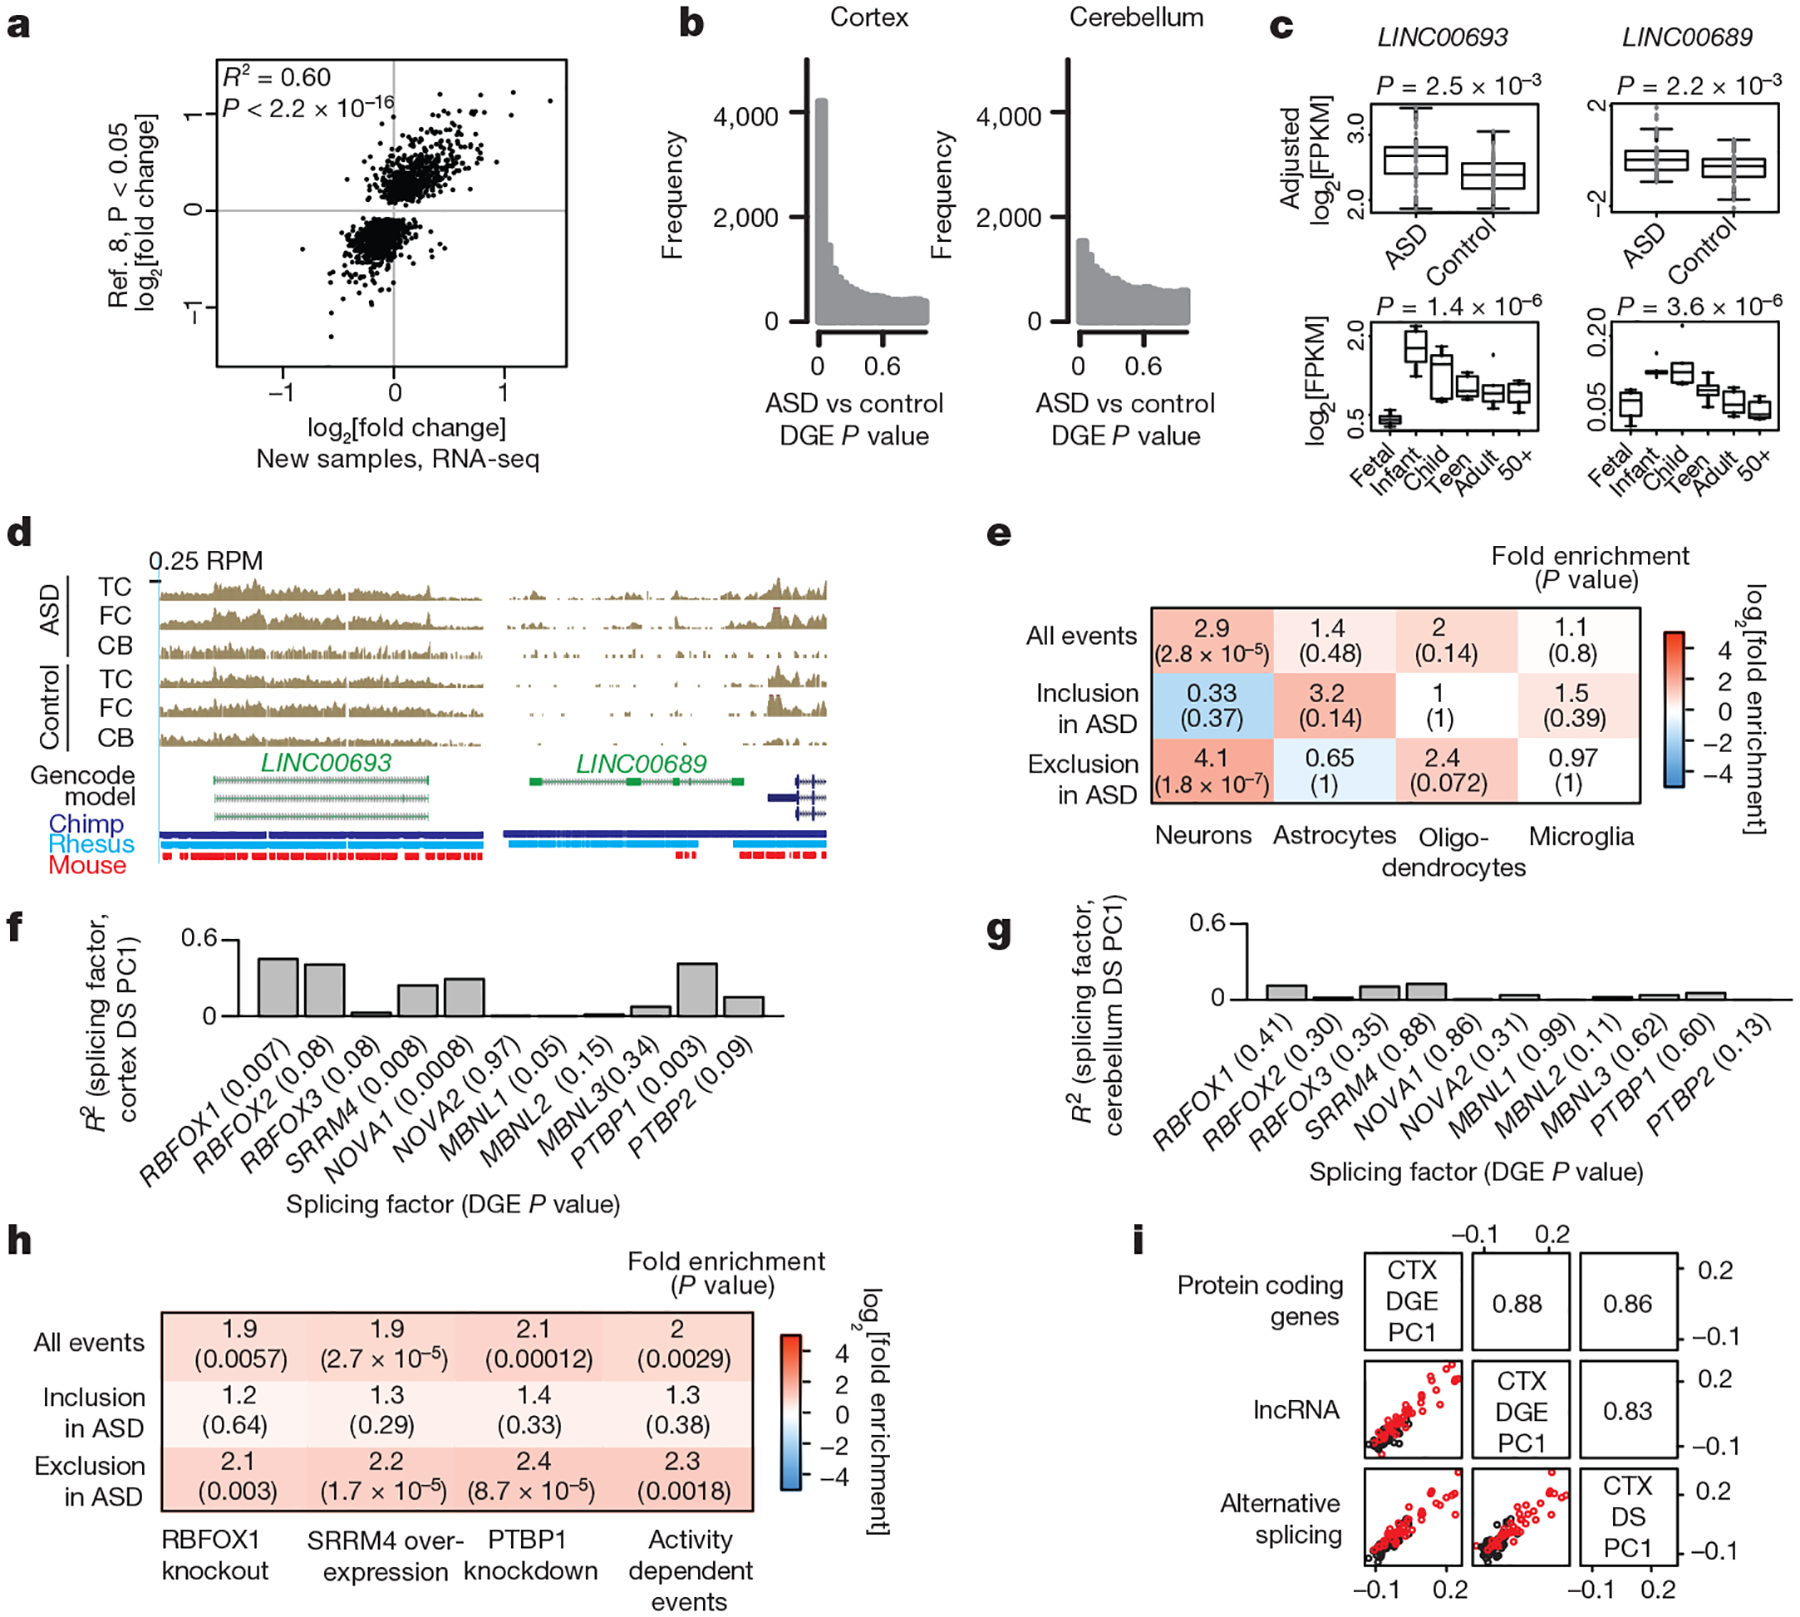
a, Replication of DGE between ASD and control cortex from previously analysed samples (16 ASD and 16 control on microarray8) with new age- and sex-matched cortex samples (15 ASD and 17 control). b, P value distribution of the linear mixed effect (LME) model DGE results for cortex and cerebellum. c, LINC00693 and LINC00689 are upregulated in ASD and downregulated during cortical development (developmental expression data from ref. 12). Two-sided ASD–control P values are computed by the LME model, developmental P values are computed by analysis of variance (ANOVA). FPKM, fragments per kilobase million mapped reads. d, UCSC genome browser track displaying reads per million (RPM) in ASD and control samples along with sequence conservation for LINC00693 and LINC00689. e, Cell-type enrichment analysis of differential alternative splicing events from cortex using exons with ΔPSI (per cent spliced in) > 50% in each cell type compared to the others17. f, g, Correlation between the first principal component (PC1) of the cortex differential splicing (DS) set and gene expression of neuronal splicing factors in cortex (f) and cerebellum (g) (DGE P value in parentheses). h, Enrichment among ASD differential splicing events and events regulated by splicing factors and neuronal activity (see Methods). i, Correlations between the PC1 across the ASD versus control analyses for different transcriptome subcategories. Bottom left: scatterplots of the principal components for ASD (red) and control (black) individuals. Top right: pairwise correlation values between principal components.
We next combined covariate-matched samples from individuals with idiopathic ASD to evaluate changes across the entire transcriptome. Compared to control cortex, 584 genes showed increased expression and 558 showed decreased expression in ASD cortex (Fig. 1b; Benjamini–Hochberg FDR < 0.05, linear mixed effects model; see Methods). This DGE signal was consistent across methods, unrelated to major confounders, and found in more than two-thirds of ASD samples (Extended Data Fig. 1j–m). We performed a classification analysis to confirm that gene expression in ASD could separate samples by disease status (Extended Data Fig. 2a) and confirmed the technical quality of our data with qRT–PCR (Extended Data Fig. 2b, c). We next evaluated enrichment of the gene sets for pathways and cell types (Extended Data Fig. 2d, e), and found that the downregulated set was enriched in genes expressed in neurons and involved in neuronal pathways, including PVALB and SYT2, which are highly expressed in interneurons; by contrast, the upregulated gene set was enriched in genes expressed in microglia and astrocytes8.
Although there was no significant DGE in the cerebellum (FDR < 0.05, P distributions in Fig. 1b), similar to observations in a smaller cohort8, there was a replication signal in the cerebellum and overall concordance between ASD-related fold changes in the cortex and cerebellum (Extended Data Fig. 2f–h). The lack of significant DGE in the cerebellum is explained by the fact that changes in expression were consistently stronger in the cortex than in the cerebellum (Extended Data Fig. 2h), which suggests that the cortex is more selectively vulnerable to these transcriptomic alterations. We also compared our results to an RNA-seq study of protein coding genes in the occipital cortex of individuals with ASD and control subjects4. Despite significant technical differences that reduce power to detect DGE, and profiling of different brain regions in that study, there was a weak but significant correlation in fold changes, which was due mostly to upregulated genes in both studies (P = 0.038, Extended Data Fig. 2i, j).
We next explored lncRNAs, most of which have little functional annotation, and identified 60 lncRNAs in the DGE set (FDR < 0.05, Extended Data Fig. 2k). Multiple lines of evidence, including developmental regulation in RNA-seq datasets and epigenetic annotations, support the functionality of most of these lncRNAs (Supplementary Table 2). Moreover, 20 of these lncRNAs have been shown to interact with microRNA (miRNA)–protein complexes, and 9 with the fragile X mental retardation protein (FMRP), whose mRNA targets are enriched in ASD risk genes9,10. As a group, these lncRNAs are enriched in the brain relative to other tissues (Extended Data Fig. 2l, m) and most that have been evaluated across species exhibit primate-specific expression patterns in the brain11, which we confirm for several transcripts (Supplementary Information, Extended Data Fig. 3a–h). We highlight two primate-specific lncRNAs, LINC00693 and LINC00689. Both interact with miRNA processing complexes and are typically downregulated during development12, but are upregulated in ASD cortex (Fig. 1c, d, Extended Data Fig. 2n). These data show that dysregulation of lncRNAs, many of which are brain-enriched, primate-specific, and predicted to affect protein expression through miRNA or FMRP interactions, is an integral component of the transcriptomic signature of ASD.
Previous studies have evaluated alternative splicing in ASD and its relation to specific splicing regulators in small sets of selected samples across individuals8,13,14. Given the increased sequencing depth, reduced 5′–3′ sequencing bias, and larger cohort represented here, we were able to perform a comprehensive analysis of differential alternative splicing (Extended Data Fig. 4a). We found a significant differential splicing signal over background in the cortex (1,127 differential splicing events in 833 genes; Methods), but not in the cerebellum (P distributions in Extended Data Fig. 4b, c). We confirmed that confounders do not account for the differential splicing signal, reproduced the global differential splicing signal with an alternative pipeline15, and performed technical validation with RT–PCR (Extended Data Figs 4d–g, 5a), confirming the differential splicing analysis. Notably, the differential splicing molecular signature is not driven by DGE (Extended Data Fig. 4h), consistent with the observation that splicing alterations are related to common disease risk independently of gene expression changes16.
Cell-type specific enrichment and pathway analysis of alternative splicing demonstrated that most differential splicing events involve exclusion of neuron-specific exons17 (Fig. 1e, Extended Data Fig. 4i). Therefore, we next investigated whether the shared splicing signature in ASD could be explained by perturbations in splicing factors known to be important in nervous system function8,14 (Extended Data Fig. 4j), and found high correlations between splicing factor expression and differential splicing in the cortex (Fig. 1f) but not the cerebellum (Fig. 1g). The absence of neuronal splicing factor DGE or correlation with splicing changes in the cerebellum is consistent with the absence of a differential splicing signal in the cerebellum and suggests that these splicing factors contribute to cortex-biased differential splicing. Previous experimental perturbation of three splicing factors, Rbfox1 (ref. 18), SRRM4 (ref. 19), and PTBP1 (ref. 20), shows strong overlap with the differential splicing changes found in ASD cortex, further supporting these predicted relationships (Fig. 1h, Extended Data Fig. 5b). Given that differential splicing events in ASD cortex overlap significantly with those that are targets of neuronal splicing factors, we hypothesized that some of these events may be involved in activity-dependent gene regulation. Indeed, differential splicing events were significantly enriched in those previously shown to be regulated by neuronal activity21 (Fig. 1h). This overlap supports a model of ASD pathophysiology based on changes in the balance of excitation and inhibition and in neuronal activity22 and suggests that alterations in transcript structure are likely to be an important component.
When we compared the first principal component across samples for protein coding DGE, lncRNA DGE and differential splicing, we found remarkably high correlations (R2 > 0.8), indicating that molecular convergence is likely to be a unitary phenomenon across multiple levels of transcriptome regulation in ASD (Fig. 1i).
Previous analysis suggested that the typical pattern of transcriptional differences between the frontal and temporal cortices may be attenuated in ASD8. We confirmed this in our larger cohort and identified 523 genes that differed significantly in expression between the frontal cortex and the temporal cortex in control subjects, but not those with ASD (Fig. 2a); we refer to these genes as the ‘attenuated cortical patterning’ (ACP) set (Extended Data Fig. 6a). We demonstrated the robustness of attenuation in cortical patterning in ASD by confirming that the ACP set was not more variable than other genes, that attenuation of cortical patterning was robust to removal of previously analysed samples8, and that the effect could also be observed using a different classification approach (Extended Data Fig. 6b–h).
Figure 2 |. Attenuation of cortical patterning in ASD.
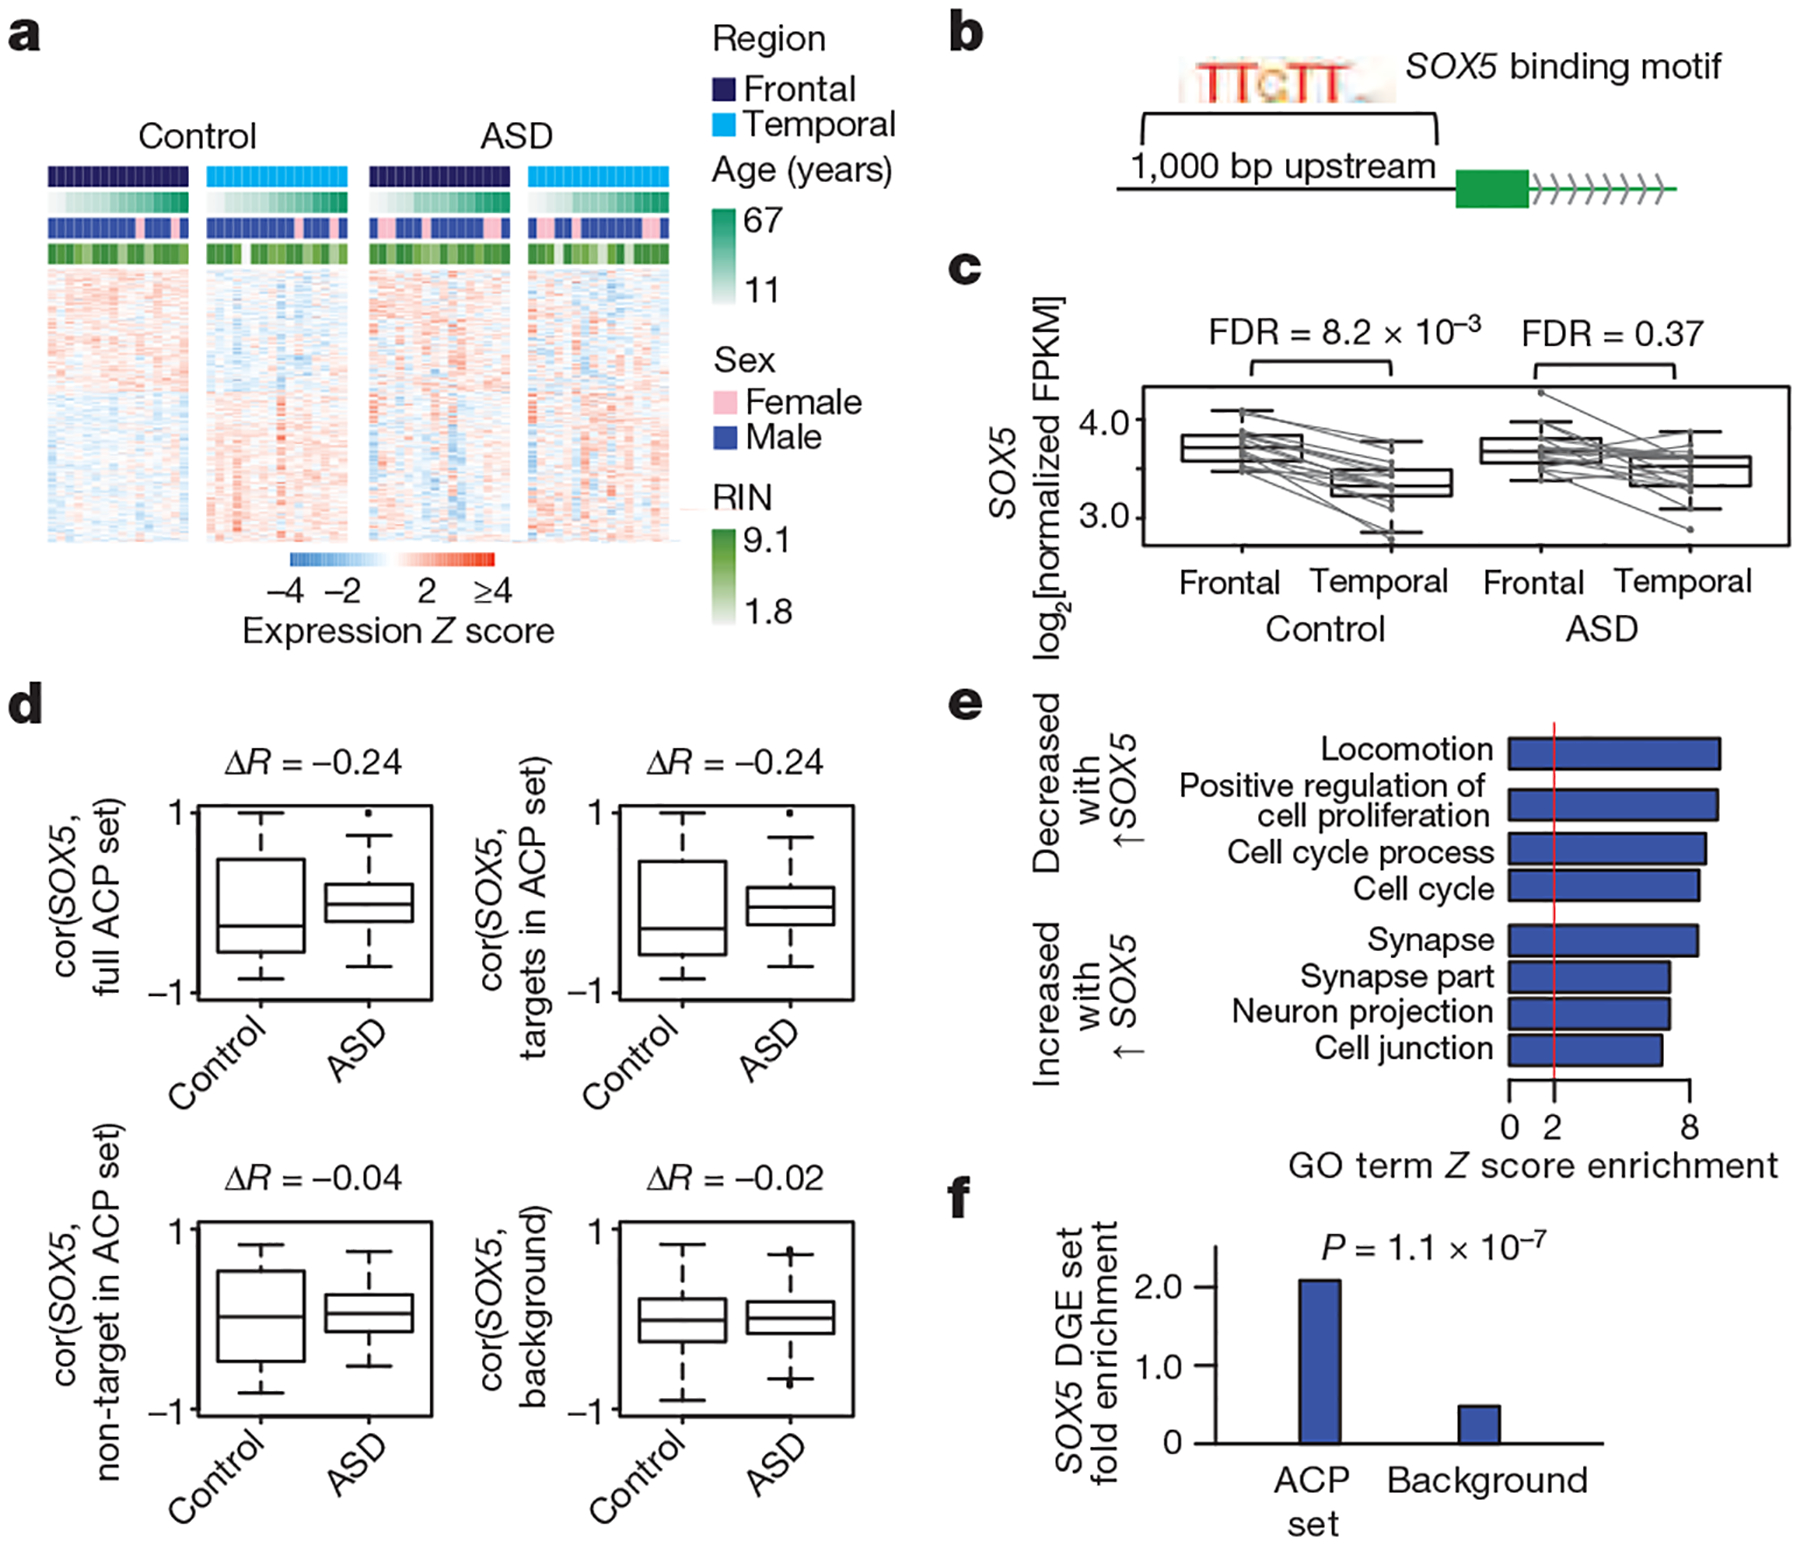
a, Heat map of genes exhibiting DGE between frontal and temporal cortex at FDR < 0.05. In control cortex and ASD cortex, 551 genes and 51 genes, respectively, show DGE in in frontal versus temporal cortex. The ACP set is defined as the 523 genes that show DGE between regions in control but not ASD samples. RIN, RNA integrity number. b, Schematic of transcription factor motif enrichment upstream of genes in the ACP set. c, SOX5 exhibits attenuated cortical patterning in ASD (lines: frontal–temporal pairs from the same individual). d, Correlation between SOX5 expression and predicted targets in control and ASD samples for all ACP genes (top left), SOX5 targets from the ACP set (top right), SOX5 non-targets from the ACP set (bottom left), and background (all other genes, bottom right). Plots show the distribution of Pearson correlation values between SOX5 and other genes in ASD and control samples. ΔR, change in median R value between distributions. e, Gene Ontology (GO) term enrichment for genes upregulated and downregulated after SOX5 overexpression in neural progenitor cells. f, Enrichment analysis of the SOX5 differential gene expression (DGE) set in the ACP set and all other genes (background). P represents significance in enrichment over background by two-sided Fisher’s exact test.
Pathway and cell-type analysis showed that the ACP set is enriched in Wnt signalling, calcium binding, and neuronal genes (Extended Data Fig. 6i, j, Supplementary Information). We next explored potential regulators of cortical patterning by transcription factor binding site enrichment (Extended Data Fig. 6k). Among the transcription factors identified, SOX5 was of particular interest because of its known role in mammalian corticogenesis23,24, its sole membership in the ACP set, and its correlation with predicted targets in the brains of control subjects, which is lost in ASD (Fig. 2b–d). We confirmed that a significant proportion of ACP genes are regulated by SOX5 by overexpressing it in human neural progenitors. SOX5 induced synaptic genes and repressed cell proliferation (Fig. 2e), and predicted SOX5 targets exhibited net down-regulation, consistent with the repressive function of SOX5 (Fig. 2f, Extended Data Fig. 6l, m). These findings support the prediction that attenuated patterning of the transcription factor SOX5 between cortical regions contributes to direct alterations in patterning of SOX5 targets.
We also evaluated DGE and differential splicing in nine individuals with dup15q (which is among the most common and penetrant forms of ASD) and independent controls (Extended Data Fig. 7a, b). Significant upregulation in the 15q11.1–13.2 region (cis) was evident in duplication carriers, but not in idiopathic ASD (Fig. 3a). Remarkably, genome-wide (trans) DGE and differential splicing patterns were highly concordant between dup15q and ASD (Fig. 3b, c, Extended Data Fig. 7c–e). Moreover, alterations in dup15q cortex were of greater magnitude and more homogeneous than those observed in idiopathic ASD cortex (Fig. 3d, Extended Data Fig. 7f, g). Analysis of DGE in the cerebellum confirmed a weaker signal than in the cortex and demonstrated that cis changes in dup15q cerebellum (Extended Data Fig. 7h–j) were more concordant with the cortex than trans changes (Extended Data Fig. 7k, l), further supporting the observation that the cortex is selectively vulnerable to transcriptomic alteration in ASD. Together, the DGE and differential splicing analyses in dup15q provide further biological validation of the ASD transcriptomic signature and demonstrate that a genetically defined form of ASD exhibits similar changes to idiopathic ASD.
Figure 3 |. Duplication 15q syndrome recapitulates transcriptomic changes in idiopathic ASD.
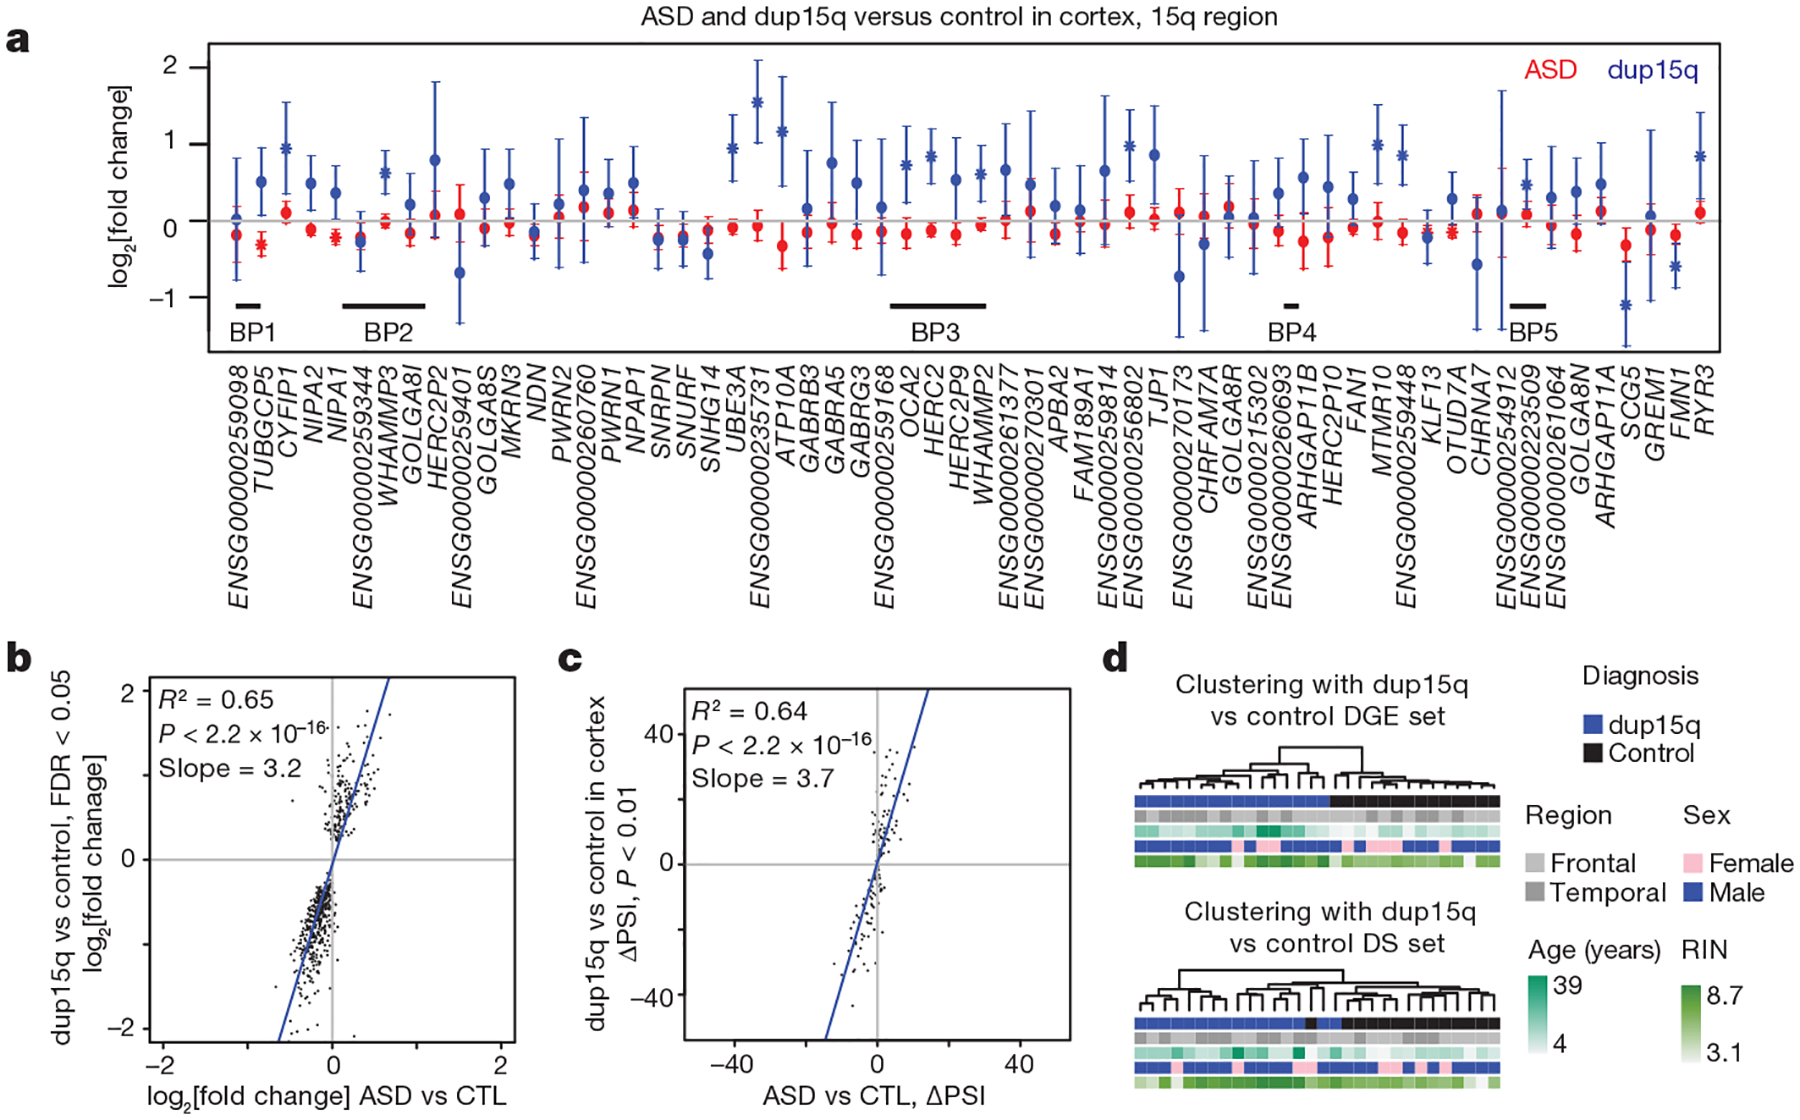
a, DGE changes across the 15q11–13.2 region for ASD and dup15q compared to control. Error bars show 95% confidence intervals for the fold changes. * FDR < 0.05 across this region. BP, breakpoint. b, Comparison of DGE effect sizes in dup15q versus control and ASD versus control. c, Comparison of differential alternative splicing effect sizes in dup15q versus control and ASD versus control. d, Average linkage hierarchical clustering of dup15q samples and controls using the DGE and differential alternative splicing (DS) gene sets.
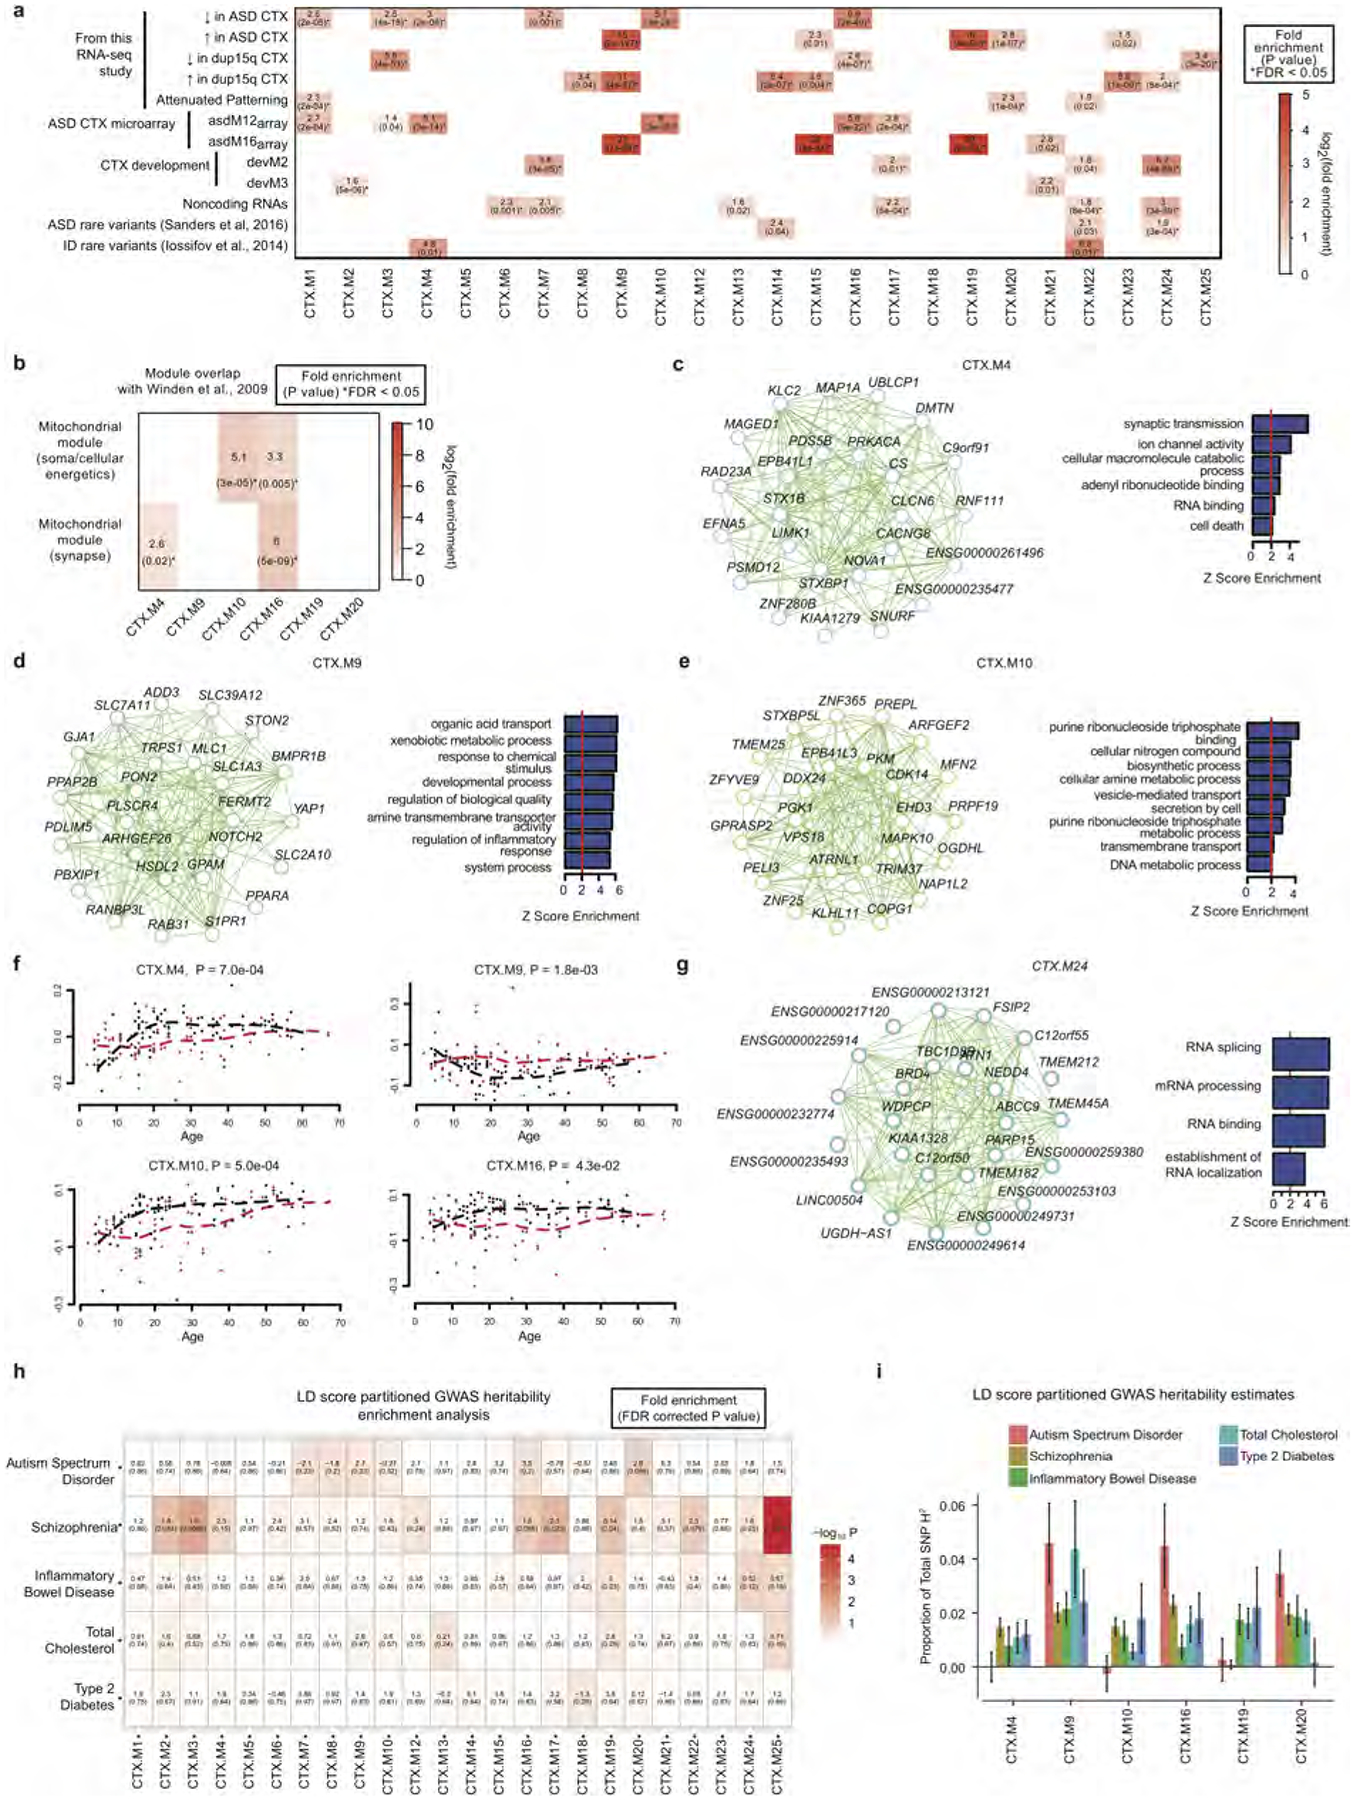
We next applied weighted gene co-expression network analysis (WGCNA; Methods) and evaluated the biological functions and ASD association of the 24 co-expression modules identified (Extended Data Fig. 8a–d). Of the six modules associated with ASD, three were upregulated and three were downregulated, and each showed significant cell-type enrichment (Fig. 4a, b). This analysis corroborates and extends previous work by identifying sub-modules of those previously identified, thus demonstrating greater biological specificity (Extended Data Figs 8e, 9a). It also confirms that downregulated modules are enriched in synaptic function and neuronal genes, that upregulated modules are enriched in genes associated with inflammatory pathways and glial function4,8, and that microglial and synaptic modules exhibit significant anticorrelation (Fig. 4c). Furthermore, the downregulated modules CTX.M10 and CTX.M16 are enriched in genes previously related to neuronal firing rate, consistent with the overlap of dysregulated splicing with events regulated by neuronal activity (Extended Data Fig. 9b and Fig. 1h). One glial and one neuronal module are highlighted in Fig. 4d, e (the remainder in Extended Data Fig. 9c–e). Remarkably, the upregulated module CTX.M20 was not found in previous analyses, overlaps significantly with the ACP set (FDR < 0.05, Extended Data Fig. 9a), and contains genes implicated in development and regulation of cell differentiation (Fig. 4f).
Figure 4 |. Co-expression network analysis.
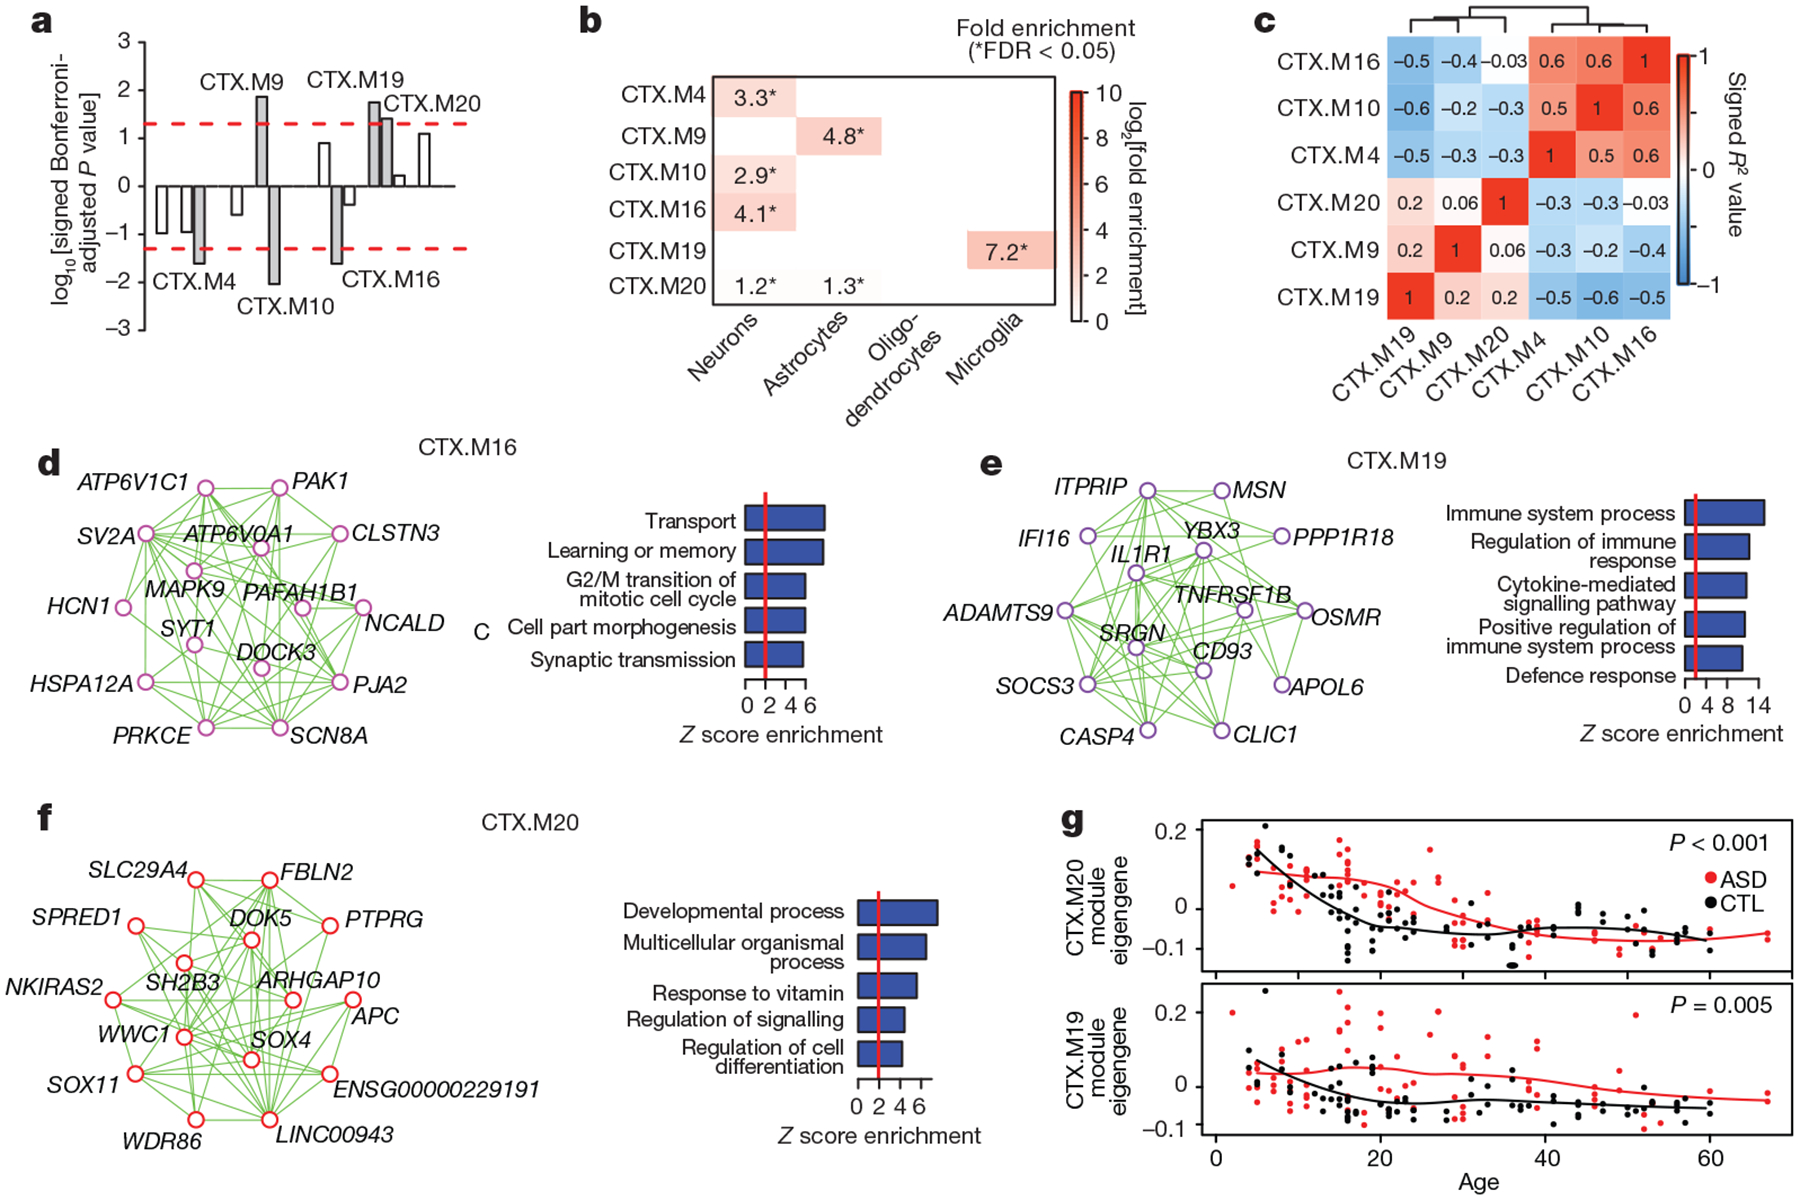
a, Signed association of module eigengenes with diagnosis (Bonferroni-corrected P value from an LME model, see Extended Data Fig. 8c and Methods). Positive values indicate modules with an increased expression in ASD samples. Grey bars with labels signify six ASD-associated modules. b, Cell-type enrichment for the ASD-associated modules. c, Heat map of correlations between ASD-associated module eigengenes sorted by average linkage hierarchical clustering. d–f, Module plots displaying the top 15 hub genes and top 50 connections along with the GO term enrichment of each module. g, Plot of CTX.M20 and CTX.M19 module eigengenes across age. P values are for the difference between temporal trajectories for ASD and control by permutation test (see Methods).
We also leveraged our large sample and younger age-matched ASD and control samples to detect differences in developmental trajectories in ASD compared to control subjects. We identified a remarkable difference in CTX.M19 and CTX.M20 during the first two decades of life (Fig. 4g, additional age trajectories in Extended Data Fig. 9f) that is most consistent with an evolving process during early brain development that stabilizes starting in late childhood and early adolescence. We also found preservation of most cortex modules in the cerebellum, but with weaker associations to ASD (Extended Data Fig. 10a–h, Supplementary Table 4), consistent with the DGE analysis showing that ASD-related changes are substantially smaller in the cerebellum.
To determine the role of genetic factors in transcriptomic dysregulation, we evaluated enrichment in genes affected by ASD-associated rare mutations and common variants (Extended Data Fig. 9a). One module, CTX.M24, exhibited significant enrichment for rare mutations found in ASD, while rare de novo mutations associated with intellectual disability were most strongly enriched in CTX.M22 (FDR < 0.05, Extended Data Fig. 9a). Remarkably, CTX.M24 was significantly enriched for lncRNAs, genes expressed highly during fetal cortical development, and genes harbouring protein-disrupting mutations found in ASD, suggesting that lncRNAs will be important targets for investigation in ASD10,25 (FDR < 0.05, Extended Data Fig. 9a, g). By contrast, enrichment for ASD-associated common variation was observed in CTX. M20 (FDR < 0.1, Extended Data Fig. 9h–1, Methods). As CTX.M20 is enriched for the ACP gene set, this suggests a potential link between polygenic risk and regional attenuation of gene expression in ASD. Several other ASD-associated modules showed a weaker common variant signal for ASD, including CTX.M16, which also shows a signal for schizophrenia polygenic risk. However, other phenotypes with larger, better-powered genome-wide association studies (GWAS) also demonstrate enrichment (Extended Data Fig. 9h–i). It will be necessary to perform this analysis with larger ASD GWAS in the future to fully understand the extent and specificity of the contribution of common variation to the transcriptome alterations in ASD.
These data contribute to a consistent emerging picture of the molecular pathology of ASD4,7,8,10,25–27. Parsimony suggests that the highly overlapping expression pattern shared by individuals with dup15q and the majority of those with idiopathic ASD represents an evolving adaptive or maladaptive response to a primary insult rather than a secondary environmental hit. Although we observe no significant association of the ASD-associated transcriptome signature with either clinical or technical confounders, some of the changes are likely to represent consequences or compensatory responses, rather than causal factors. In this regard, it is notable that the observed transcriptome changes are consistent with an ongoing process that is triggered largely by genetic and prenatal factors3,9,10,23, but that evolves during the first decade of brain development.
We interpret these data to suggest that aberrant microglia–neuron interactions reflect an early alteration in developmental trajectory that becomes more evident in late childhood. This corresponds to the period of synapse elimination and stabilization after birth in humans28,29, which may have significant implications for intervention. Our analyses also reveal primate-specific lncRNAs that are probably relevant to understanding human higher cognition11,30. Co-expression of lncRNAs with genes harbouring ASD-associated protein coding mutations suggests that these noncoding RNAs are involved in similar biological functions and are potential candidate ASD risk loci. As future investigations pursue the full range of causal genetic variation that contributes to ASD risk, these data will be valuable for interpreting genetic and epigenetic studies of ASD and the relationship between ASD and other neuropsychiatric disorders.
METHODS
Brain tissue.
Human brain tissue for ASD and control individuals was acquired from the Autism Tissue Program (ATP) brain bank at the Harvard Brain and Tissue Bank (which has since been incorporated into the Autism BrainNet) and the University of Maryland Brain and Tissue Bank, a Brain and Tissue Repository of the NIH NeuroBioBank. Sample acquisition protocols were followed for each brain bank, and samples were de-identified before acquisition. Brain sample and donor metadata are available in Supplementary Table 1 and further information about samples can be found in the Supplementary Information. No statistical methods were used to predetermine sample size. The sample dissections, RNA extractions, and RNA sequencing experiments were randomized (Supplementary Information). The investigators were blinded to diagnosis until the analysis but unblinded during the analysis.
RNA library preparation, sequencing, mapping and quantification.
A detailed protocol, including parameters given to programs for each step, is provided in the Supplementary Information. Briefly, starting with total RNA, rRNA was depleted (RiboZero Gold, Illumina) and libraries were prepared using the TruSeq v2 kit (Illumina) to construct unstranded libraries with a mean fragment size of 150 bp. Libraries underwent 50-bp paired end sequencing on an Illumina HiSeq 2000 or 2500 machine. Paired end reads were mapped to hg19 using Gencode v18 annotations31 via Tophat2 (ref. 32). Gene expression levels were quantified using union exon models with HTSeq33. This approach counts only reads on exons or reads spanning exon–exon junctions, and is globally similar to including reads on the introns (whole gene model) or computing probabilistic estimates of expression levels (Extended Data Fig. 1e–g).
Differential gene expression.
DGE analysis was performed with expression levels normalized for gene length, library size, and G+C content (referred to as ‘normalized FPKM’). Cortex samples (frontal and temporal) were analysed separately from cerebellum samples. An LME model framework was used to assess differential expression in log2[normalized FPKM] values for each gene for cortical regions because multiple brain regions were available from the same individuals. The individual donor identifier was treated as a random effect, and age, sex, brain region and diagnoses were treated as fixed effects. In the cerebellum DGE analysis, a linear model was used and brain region was not included as a covariate, because only one brain region was available in each individual and a handful of technical replicates could be removed for DGE analysis. We also used technical covariates accounting for RNA quality and batch effects as fixed effects in this model (Supplementary Information). Significant results are reported at Benjamini–Hochberg FDR < 0.05 (ref. 34), and full results are available in Supplementary Table 2.
Throughout the study, we assessed replication between datasets by evaluating the concordance between independent sample sets by comparing the squared correlation (R2) of fold changes of genes in each sample set at a defined statistical cut-off. We set the statistical cut-off in one sample set (the y axis in the scatterplots) and computed the R2 with fold changes in these genes in the comparator sample set (the x axis in the scatterplots). For details of the regularized regression analyses and cortical patterning analyses, see Supplementary Information.
Differential alternative splicing.
Alternative splicing was quantified using the per cent spliced in (PSI) metric using Multivariate Analysis of Transcript Splicing (MATS, v3.08)35. For each event, MATS reports counts supporting the inclusion (I) or splicing (S) of an event. To reduce spurious events due to low counts, we required at least 80% of samples to have I + S ≥ 10. For these events, the PSI is calculated as PSI = I/(I + S) (Extended Data Fig. 4a). Statistical analysis for differential alternative splicing was performed using the linear mixed effects model as described above for DGE; significant results are reported at Benjamini–Hochberg FDR < 0.5 (ref. 34). Full differential alternative splicing results are available in Supplementary Table 3.
Quantitative real-time PCR validation.
In order to ensure that our RNA-seq data were high quality and our DGE models were accurate, we evaluated gene expression changes in a representative subset of four ASD and four control samples (Extended Data Fig. 2b). One microgram of total RNA was reverse-transcribed using Invitrogen Superscript IV reverse-transcriptase and oligo-dT primers (Invitrogen). Real-time PCR was performed on a Lightcycler 480 thermocycler in 10 μl volume containing SYBR Green Master Mix (Roche) and gene-specific primers at a concentration of 0.5 mM each. The results shown in Extended Data Fig. 2c represent at least two independent cDNA synthesis experiments for each gene. GAPDH levels were used as an internal control.
For differential alternative splicing analysis, we validated selected events with semiquantitative RT–PCR using the same samples used for DGE validation. Total RNA (600 ng) was reverse-transcribed using Invitrogen Superscript IV reverse transcriptase and gene/exon-specific primers. cDNA (50 ng) was amplified by 25 cycles using PCR. PCR products were resolved on 3% high-resolution Metaphor agarose gels (Lonza) and counterstained with SYBR Gold for visualization (Extended Data Fig. 5a, Supplementary Fig. 1). Gels were quantified using ImageJ (NIH).
Notably, this sample size is underpowered to evaluate significant changes in many genes or splicing events; however, the goal was to validate the accuracy of our data and analyses across genes, so we show the correlation of fold changes between ASD and control across genes or events. Genes and events were selected on the basis of being top hits or of particular biological interest. Sample details and primers are reported in Supplementary Tables 2 and 3.
Duplication 15q syndrome samples and analyses.
For dup15q samples, the type of duplication and copy number in the breakpoint 2–3 region were available from previous work36. To expand this to the regions between each of the recurrent breakpoint in these samples, eight out of nine dup15q brains were genotyped (one was not genotyped owing to limited tissue availability). The number of copies between each of the breakpoints is reported in Extended Data Fig. 7a. DGE and differential alternative splicing analysis for this set was performed with independent control samples from the main analysis, though the results were similar to those obtained using the larger set of controls used in the main analysis (Extended Data Fig. 7d, e).
Co-expression network analysis.
The R package weighted gene co-expression network analysis (WGCNA) was used to construct co-expression networks using normalized data after adjustment to remove variability from technical covariates37,38 (Supplementary Information). We used the biweight midcorrelation to assess correlations between log2[adjusted FPKM] and parameters for network analysis are described in Supplementary Information. Notably, we used a modified version of WGCNA that involves bootstrapping the underlying dataset 100 times and constructing 100 networks. The consensus of these networks (median edge strength across all bootstrapped networks) was then used as the final network39, ensuring that a subset of samples does not drive the network structure.
For module-trait analyses, the first principal component of each module (the module eigengene37) was related to ASD diagnosis, age, sex, and brain region with an LME model as above. These associations were also supported by enrichment analyses with ASD DGE genes in Extended Data Fig. 9a. Given that modules are relatively uncorrelated to each other, significant eigengene-trait results are reported at Bonferroni-corrected P < 0.05.
Module temporal trajectories were computed with the LOESS function in R. For both ASD and control samples, the function was used to create quartic splines on module eigengenes (degree = 2, span = 2/3). The trend difference statistic was taken as the largest difference between these fitted curves between the ages of 5 and 25 years. P values were computed using 5,000 permutations. Specifically, ASD and control labels were randomly permuted 5,000 times and splines were fit to the permuted groups; therefore, significant P values reject the null hypothesis of no relationship between age trends and disease status. Detailed statistics for module membership are available in Supplementary Table 2 and additional characterization of modules is available in Supplementary Table 4.
Enrichment analysis of gene sets and common variation.
Gene set enrichment analyses were performed with a two-sided Fisher’s exact test (cell type and splicing factor enrichments) or with logistic regression (Extended Data Fig. 9a, Supplementary Information). Results were corrected for multiple comparisons by the Benjamini–Hochberg method34 when a large number of comparisons were performed.
GO term enrichment analysis was performed using GO Elite40 with 10,000 permutations, and results are presented as enrichment Z scores. We present only the top molecular function and biological process terms for display purposes. Notably, for splicing analysis, we evaluated GO term enrichment by using the genes containing differential splicing alterations to identify functional enrichment. It is possible that longer genes, which contain more exons, also contain more detected splicing events. This could bias pathway and cell type enrichment to more neuronal and synaptic genes, which are, on average, longer than other genes in the genome. However, the correlation between the number of detected events in genes and gene length is minimal (R2 = 0.004), and the correlation is even smaller for events at P < 0.01 (R2 = 0.00012) demonstrating that longer genes are not more likely to contain differential splicing events.
Common variant enrichment was evaluated by analysis of genome-wide association study (GWAS) signal with stratified linkage disequilibrium (LD) score regression to partition disease heritability within functional categories represented by gene co-expression modules41. This method uses GWAS summary statistics and LD explicitly modelled from an ancestry-matched 1,000 genomes reference panel to calculate the proportion of genome-wide single nucleotide polymorphism (SNP)-based heritability that can be attributed to SNPs within explicitly defined functional categories. To improve accuracy, these categories were added to a ‘full baseline model’ that includes 53 functional categories capturing a broad set of genomic annotations, as previously described42. Enrichment is calculated as the proportion of SNP heritability accounted for by each module divided by the proportion of total SNPs within the module. Significance is assessed using a block jack-knife procedure42, which accounts for module size and gene length, followed by FDR correction of P values.
Data availability statement.
Human brain RNA-seq data have been deposited in Synapse (https://www.synapse.org/#!Synapse:syn4587609) under accession number syn4587609. Data for the SOX5 overexpression are available from the Gene Expression Omnibus (accession number GSE89057). All other data are available from the corresponding author upon reasonable request.
Code availability.
Code underlying the DGE, differential alternative splicing, cortical patterning, and co-expression network analyses is available at https://github.com/dhglab/Genome-wide-changes-in-lncRNA-alternative-splicing-and-cortical-patterning-in-autism.
Extended Data
Extended Data Figure 1 |. Methodology, quality control, and differential expression replication analysis.
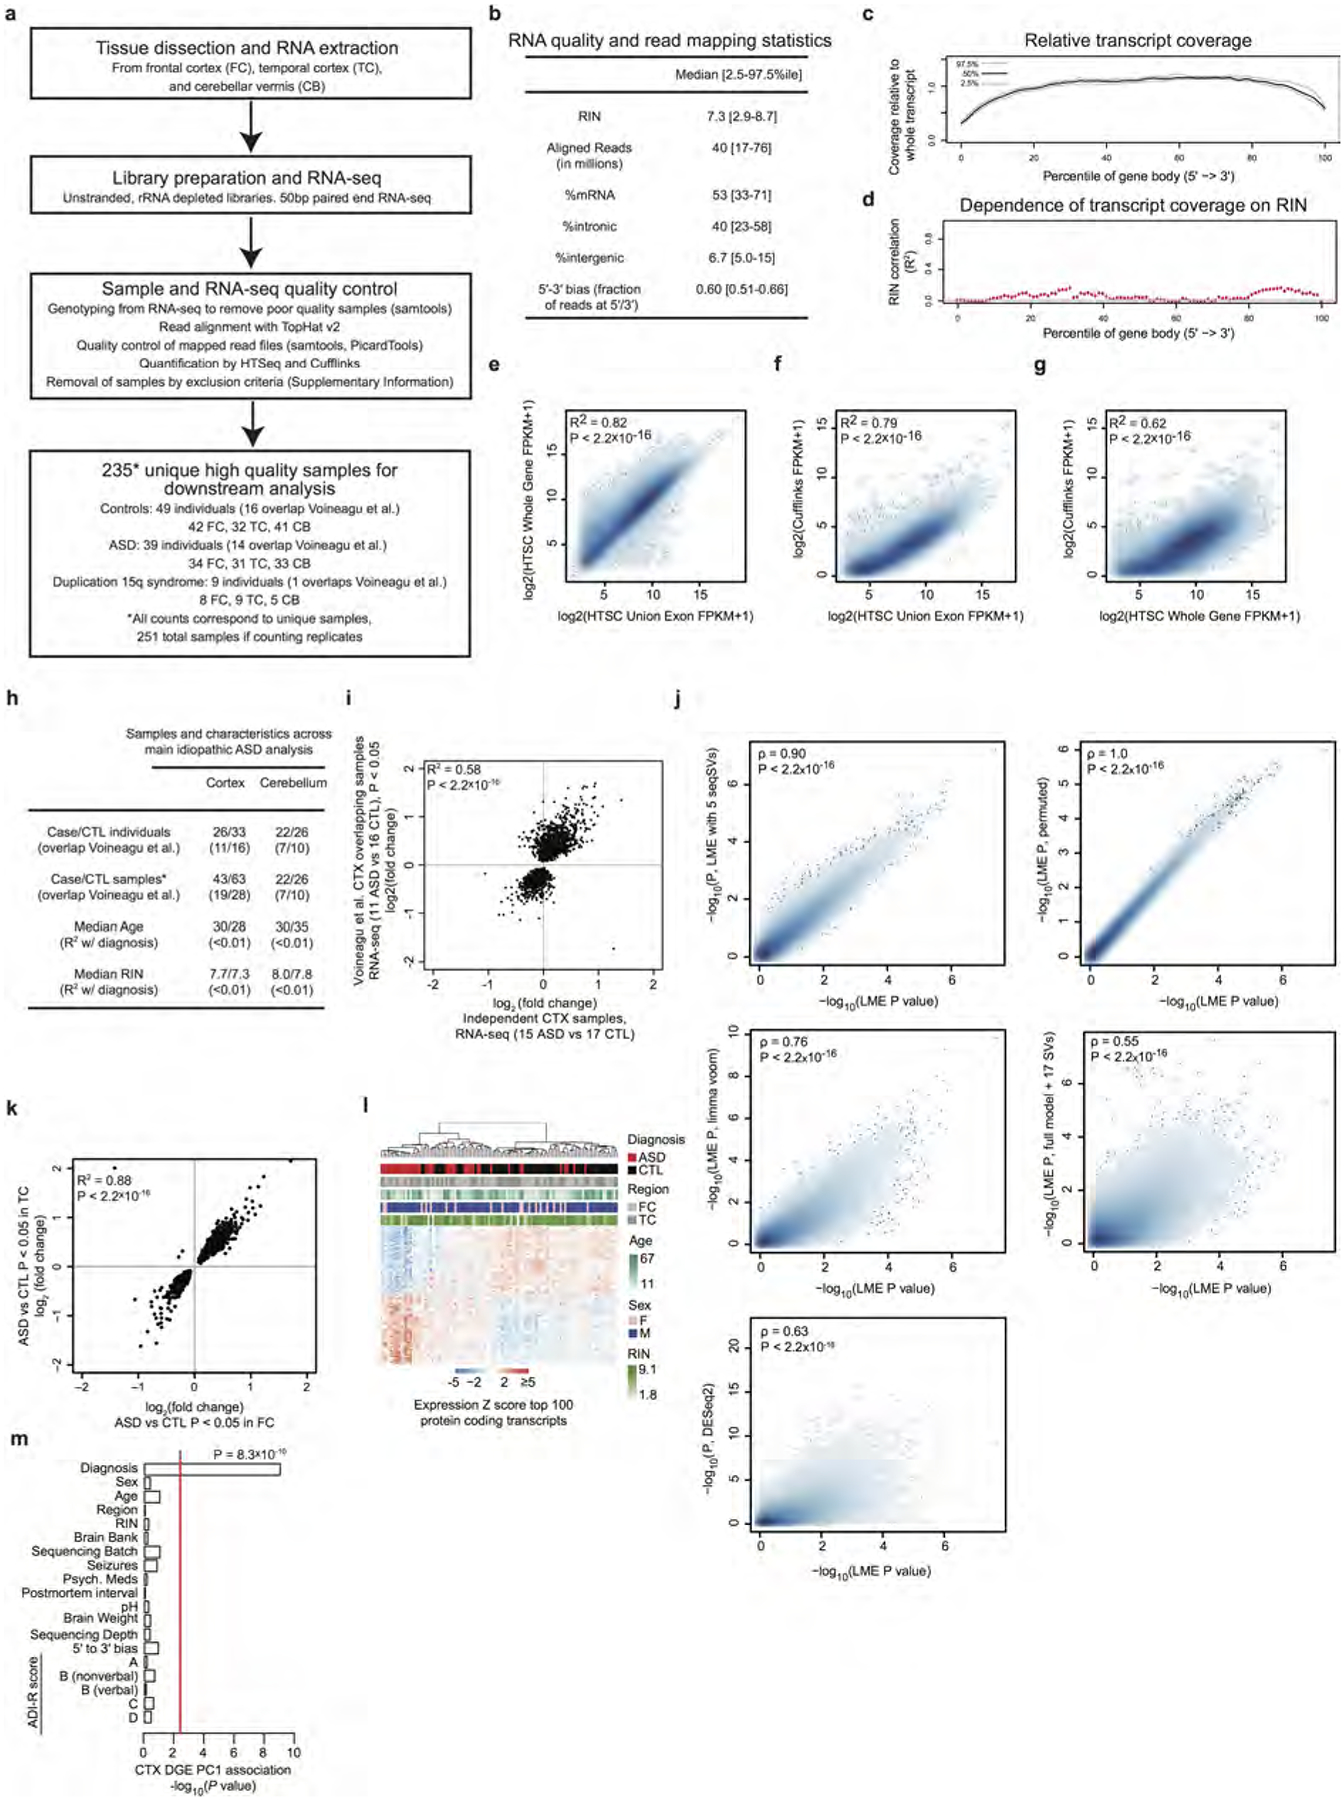
a, RNA-seq workflow (see Supplementary Information for details). b, RNA-seq quality and alignment statistics from this study, including RNA integrity number (RIN), sequencing depth (aligned reads), proportion of reads mapping to different genomic regions, and bias in coverage from the 5′ to the 3′ ends of transcripts.c, RNA-seq read coverage relative to normalized gene length across transcript length across samples. d, Dependence between coverage and RIN across gene body. e–g, Correlation of transcript model quantifications comparing the union exon model (used throughout this study), the whole gene model (which includes introns), and the Cufflinks approach43 to estimating FPKM. h, Summary table describing the characteristics of the matched covariate data used in the DGE and differential alternative splicing (DS) analysis of ASD in cortex and cerebellum. This includes the number of samples overlapping with our previous work8, the age and RIN distributions, and the dependence between diagnosis and age and RIN (summarized from Supplementary Table 1). i, Independent replication of ASD versus control DGE fold changes between previously evaluated and new ASD samples in cortex by RNA-seq using samples from ref. 8 (similar to Fig. 1a, but with RNA-seq in all samples). j, Correlation of P value rankings with Spearman’s correlation across different DGE methods for DGE analysis in cortex, comparing the ‘full model’ (LME P value) described in the Supplementary Information with other methods. Methods include removal of three additional principal components of sequencing surrogate variables(SVs) (LME with 5 SVs, top left), application of a permutation analysis for DGE P value computation (LME P, permuted, top right), application of variance-weighted linear regression for DGE44 (limma voom, middle left), application of surrogate variable analysis for DGE45 (full model + 17 SVs, middle right), and application of DESeq2 with the full model46, which uses a negative binomial distribution (bottom left). k. Comparison of fold changes between frontal cortex (FC) and temporal cortex (TC) for all samples, demonstrating similar changes in both regions. l, Average linkage hierarchical clustering of samples in ASD cortex using the top 100 upregulated and top 100 downregulated protein coding genes, demonstrating that confounders do not drive clustering of about two-thirds of samples. m, The first principal component of the cortex DGE set is primarily associated with diagnosis, and not with other factors. The red line marks a Bonferroni-corrected P = 0.05.
Extended Data Figure 2 |. Transcriptome-wide DGE analysis.
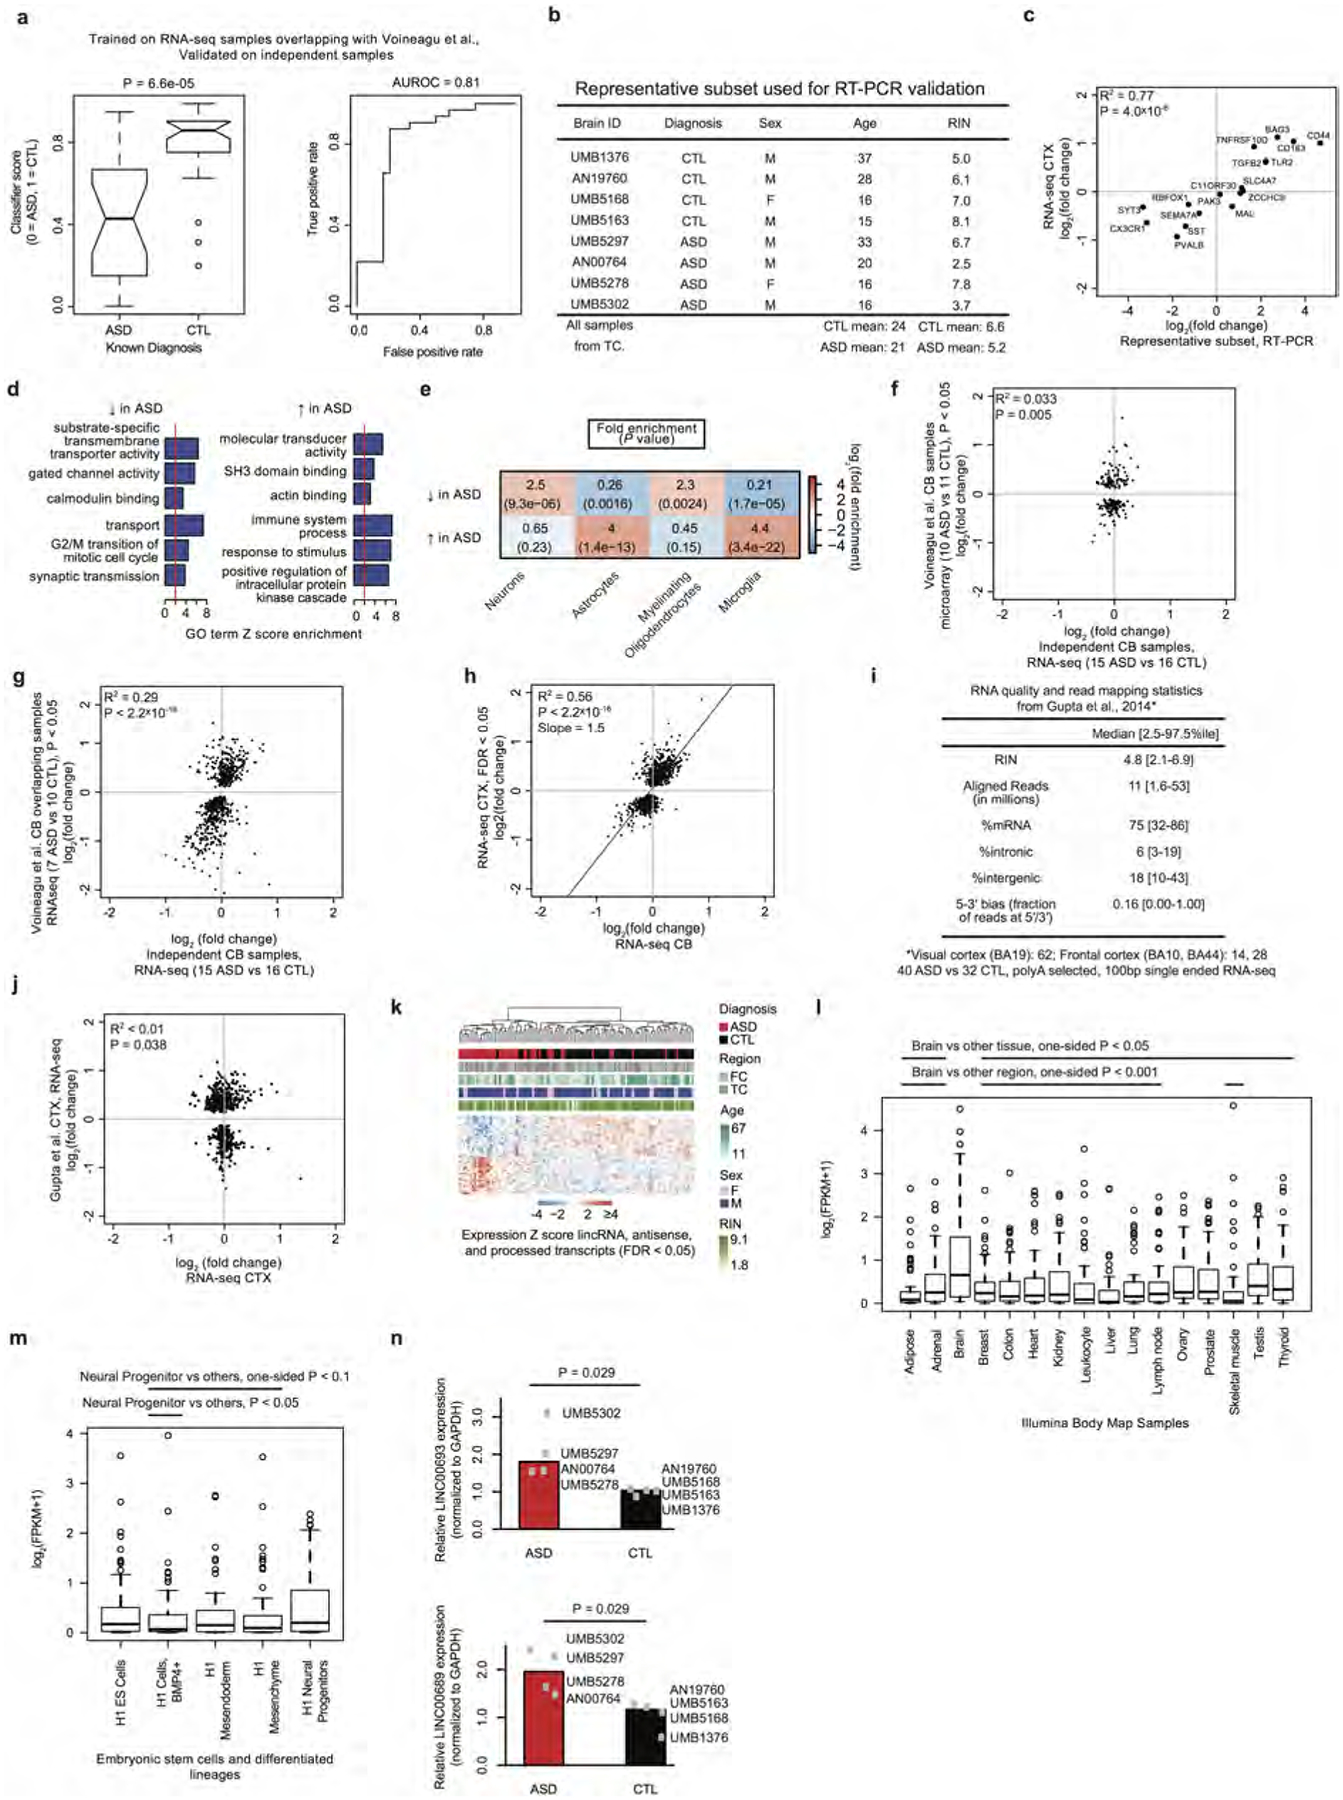
a, We applied a classification method robust to overfitting (elastic net model47) by training on the RNA-seq data from samples previously analysed in ref. 8 (Extended Data Fig. 1h, similar to the comparison in Extended Data Fig. 1i) and classifying ASD versus control status in independent samples. Results are shown as a comparison of classification scores (left) and area under the receiver operator characteristic curve (AUROC, right). Approximately 85% of ASD samples are classified successfully around a false positive rate of 20%. b, Summary table describing the subset of representative, covariate matched samples used for qRT–PCR validations. Supplementary Table 2 contains the underlying values. c, Fold changes from RNA-seq compared against fold changes from qRT–PCR (see Supplementary Table 2 for data). d, GO term enrichment analysis of genes that are upregulated or downregulated in individuals with ASD. e, Enrichment analysis of cell-type specific gene sets (defined as genes with fivefold higher expression in the cell type than in other cell types) with genes that are decreased or increased in ASD. f, g, Independent replication analysis of ASD versus control DGE fold changes between previously evaluated and new ASD samples from cerebellum by microarray and RNA-seq using samples from ref. 8 (similar to Fig. 1a and Extended Data Fig. 1i). The RNA-seq data show a replication signal between previously evaluated and new samples from this study. h, Comparison of fold changes that were significant at FDR < 0.05 in the ASD versus control DGE analysis from cortex compared with fold changes observed in cerebellum, revealing strong concordance but a lower average fold change in the cerebellum. i, Sample summary and quality control (QC) statistics for ref. 4. Compare to Extended Data Fig. 1b and see Supplementary Information for additional discussion. Compared to this study, samples from ref. 4 were prepared by poly(A) selection RNA-seq, exhibit lower RNA integrity number (RIN, median 4.8 versus 7.3), have lower median sequencing depth (11 million versus 40 million), exhibit greater 5′−3′ bias, and have generally greater variability across all QC metrics. j, Comparison of fold-changes for the top significant genes from ref. 4 (P < 0.01 as provided in their Supplementary Information) with the fold changes for the same genes in this study. Co-expression network analysis demonstrated that the moderate agreement is largely driven by concordance in upregulation of microglial genes in both studies (Extended Data Fig. 8e). k, Average linkage hierarchical clustering of lncRNAs in the DGE set. l, Boxplots of expression values of DGE lncRNAs across multiple tissue types from the Illumina Body Map (expression data from ref. 12). Lines above the plot indicate pairwise significance with a one-sided Wilcoxon rank-sum test between brain and the other tissues. m, Similar to l, except for embryonic stem cells and stem-cell-derived cell types. n, RT–PCR validation of the two lncRNAs shown in Fig. 1c, d; P values computed by two-sided Wilcoxon rank-sum test.
Extended Data Figure 3 |. RNA-seq gene expression on genome browser tracks for selected primate-specific lncRNAs in human, macaque and mouse.
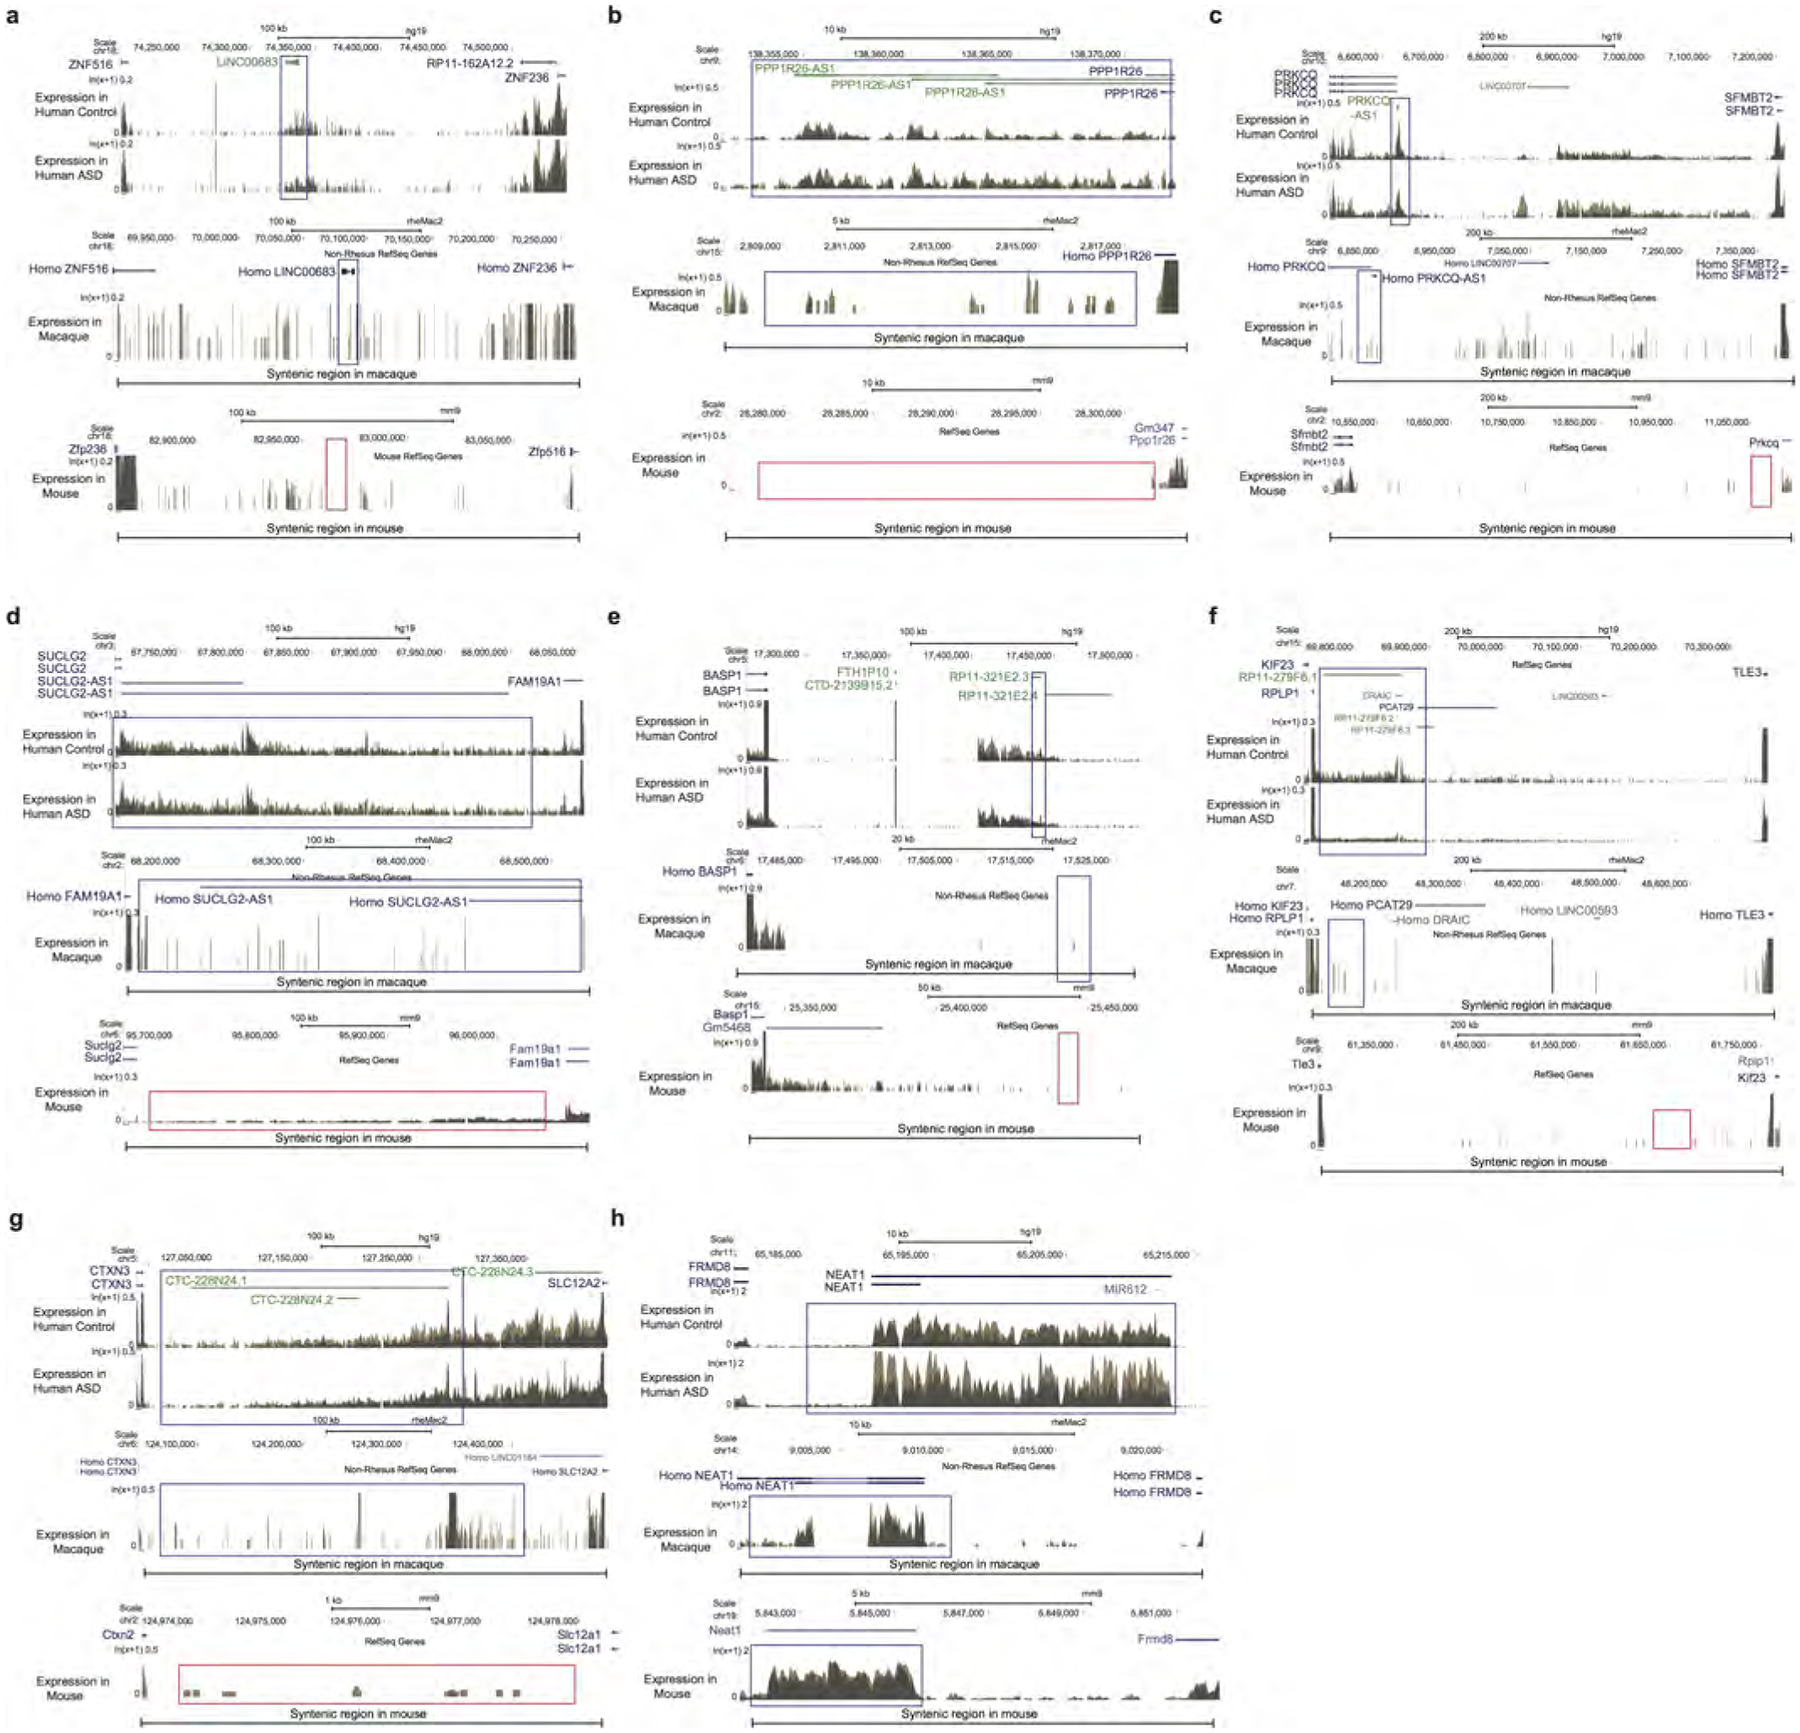
For each lncRNA, expression for representative samples for ASD versus control (top) in human, macaque (middle), and mouse (bottom) are shown. The genome location for macaque and mouse displayed is syntenic to the human region, with the expected location of the lncRNA highlighted. a–g, Examples of specific lncRNA transcripts that show primate-specific (in human and macaque, or only in human, but not in mouse) expression. h, Example of a strongly conserved lncRNA, which shows robust expression in all three species.
Extended Data Figure 4 |. Splicing analyses and validation in ASD.
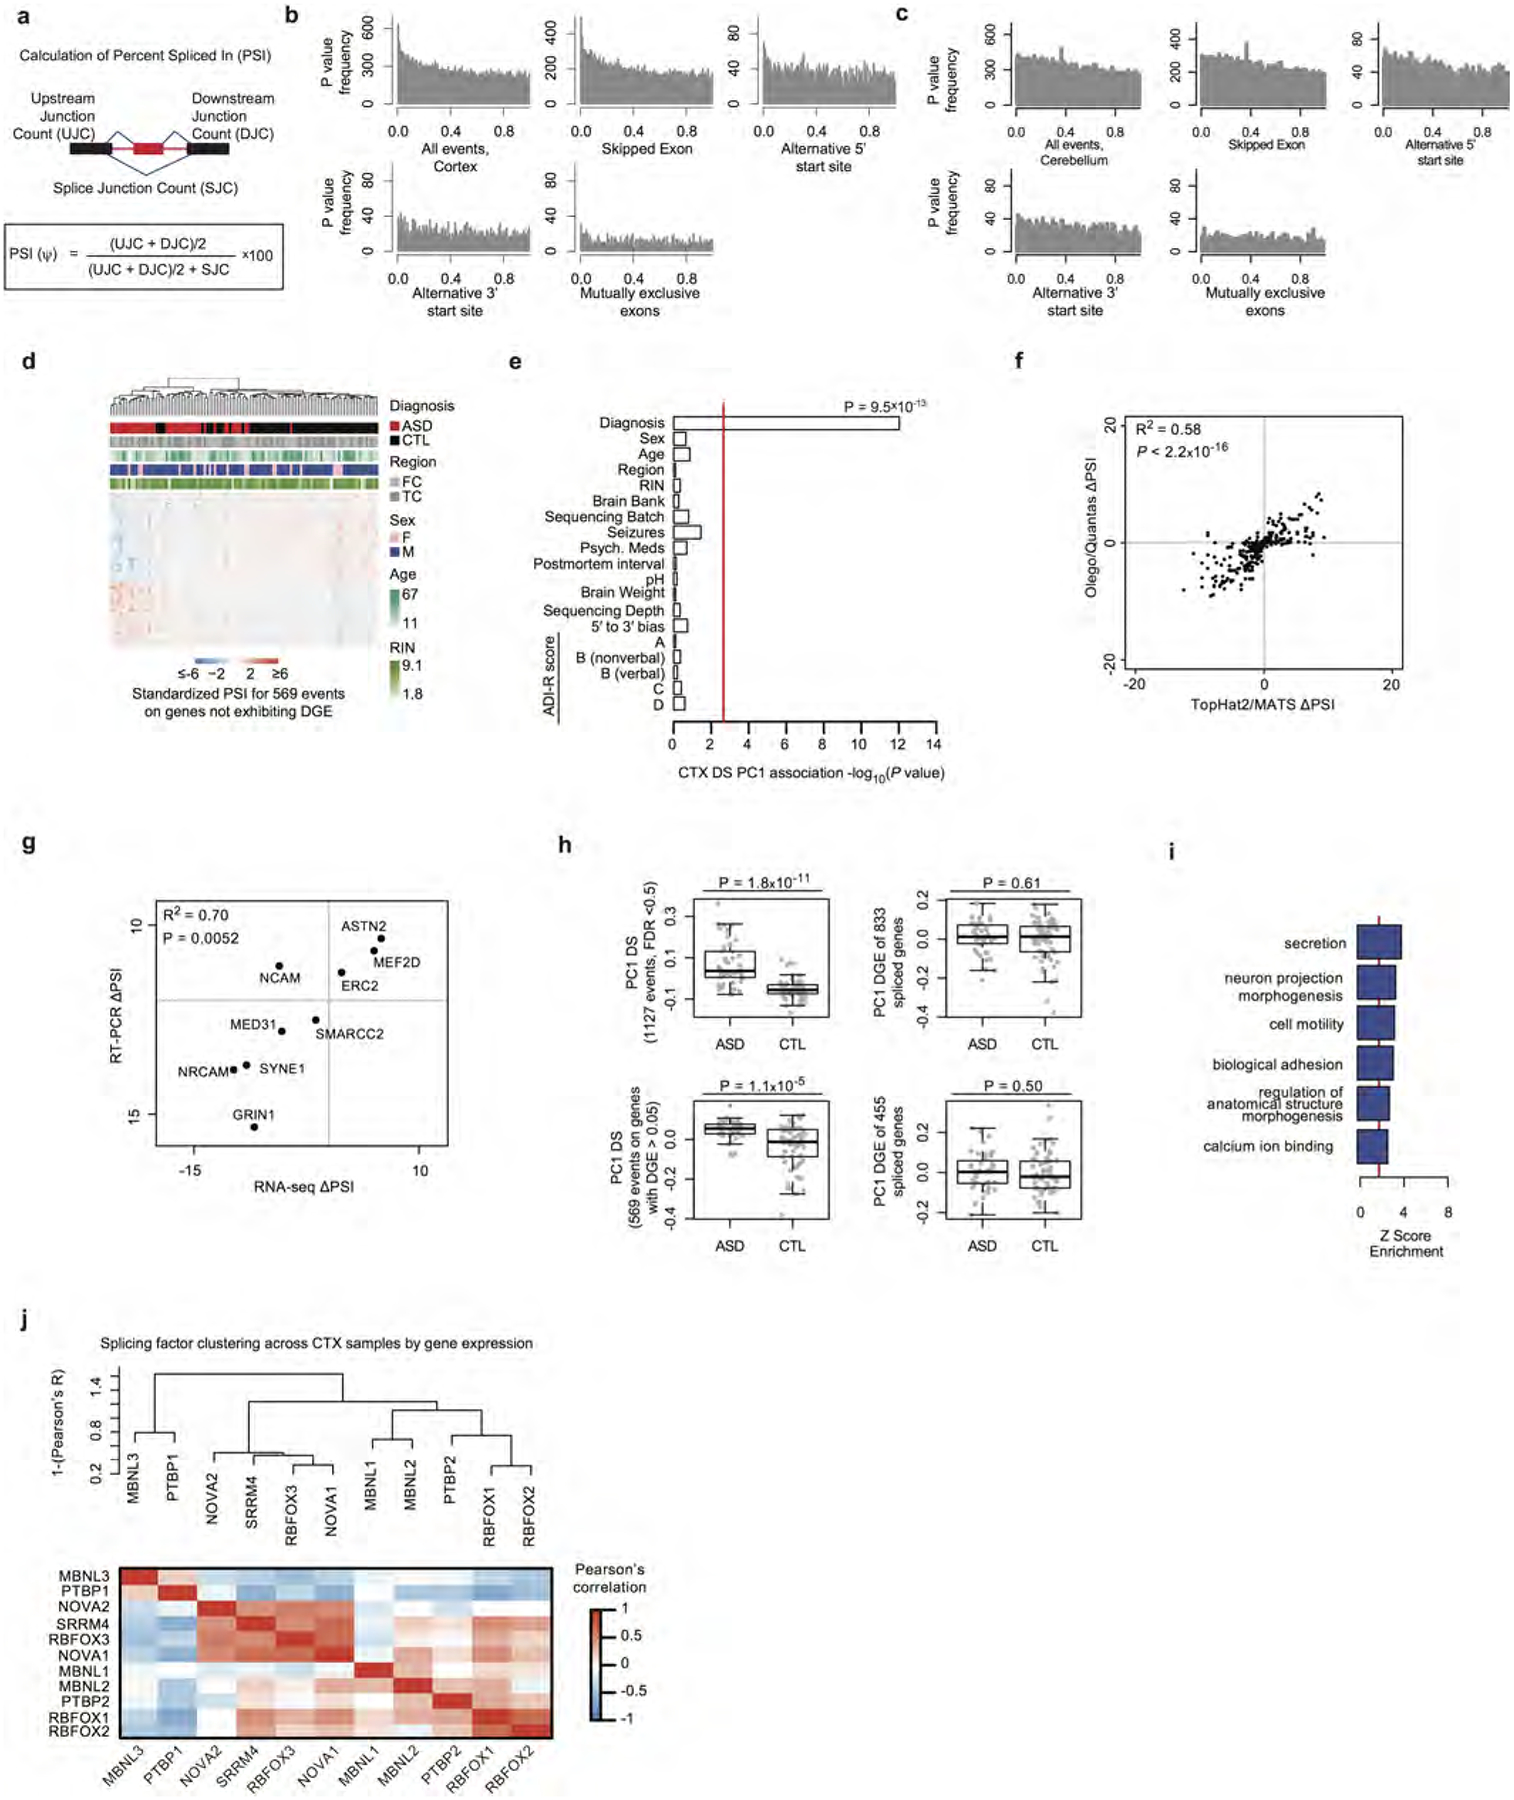
a, Schematic of the PSI metric used for differential alternative splicing35. b, Distribution of LME model P values for changes in the PSI between ASD and control in cortex for all events and event subtypes. c, Distribution of LME model P values for changes in the PSI between ASD and control in cerebellum. d, Average linkage hierarchical clustering in ASD and control cortex samples using top 100 differentially included and top 100 differentially excluded exons from the differential splicing set. e, The first principal component of the cortex differential splicing set is strongly associated with diagnosis, but not other factors. Red line marks Bonferroni-corrected P = 0.05. f, Comparison of the cortex differential splicing with the pipeline used here (TopHat2 (ref. 43) followed by multivariate analysis of transcript splicing, MATS35) with PSI values obtained via another method (read alignment by OLego followed by PSI quantification with Quantas15). g, Comparison of ΔPSI values between RT–PCR and RNA-seq for nine splicing events (Supplementary Table 3). h, Differential splicing analysis identifies events independent of DGE signal. Top,difference between ASD and control in the differential splicing set based on PC1 of the differential splicing set at the PSI level, and PC1 of the gene expression levels of genes in the differential splicing set. Bottom, same comparison after removing nominally differentially expressed genes (P < 0.05). P values computed by two-sided Wilcoxon rank-sum test. i, GO term enrichment analysis of genes with differential splicing events in ASD. j, Clustering dendrogram and heat map for neuronal splicing factor gene expression levels across samples demonstrating three major clusters and the known positive correlation between SRRM4 and RBFOX1 and anticorrelation between PTBP1 and SRRM4 (refs 14,19).
Extended Data Figure 5 |. Additional splicing analyses in ASD.
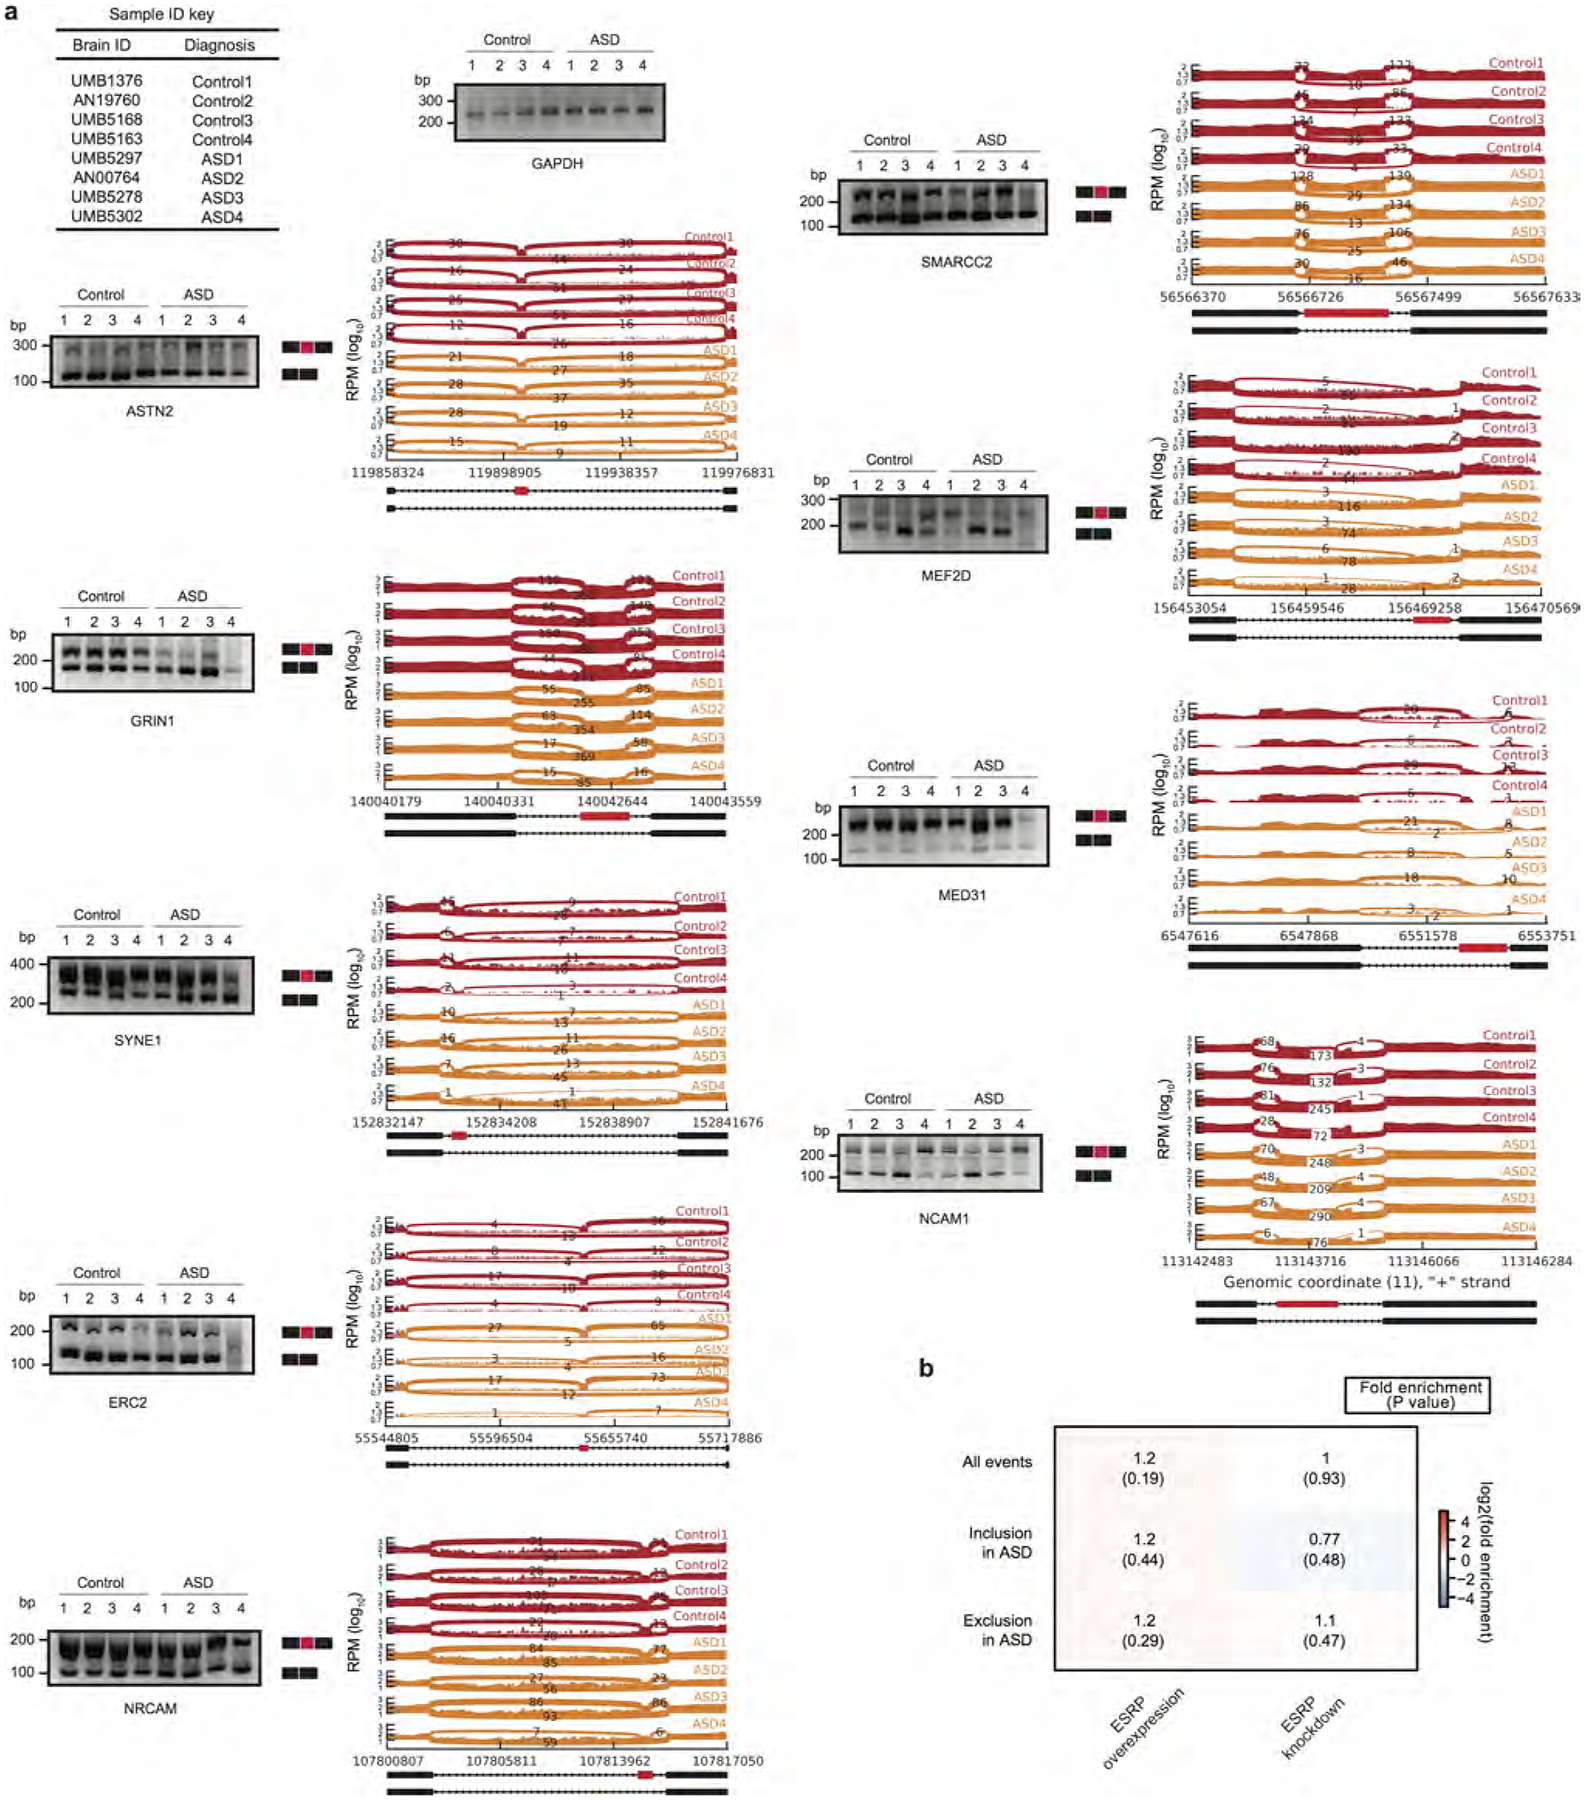
a, PCR validation and sashimi plots for nine splicing events delineated in Extended Data Fig. 4d, from the indicated samples (see Extended Data Fig. 2b for details of these samples). Notably, these genes are not in the DGE set, but are detected in the differential alternative splicing set owing to altered transcript structure. b, Heat map as in Fig. 1h for the splicing regulator ESRP48. ESRP is not known to be involved in neuronal function, ESRP1 is not expressed in cortex, and ESRP2 is expressed but not significantly different between ASD and control cortex. Therefore, we show ESRP enrichment analysis in differential splicing events as a control for Fig. 1h. Enrichment P values are computed as described in Methods.
Extended Data Figure 6 |. Attenuation of cortical patterning in ASD.
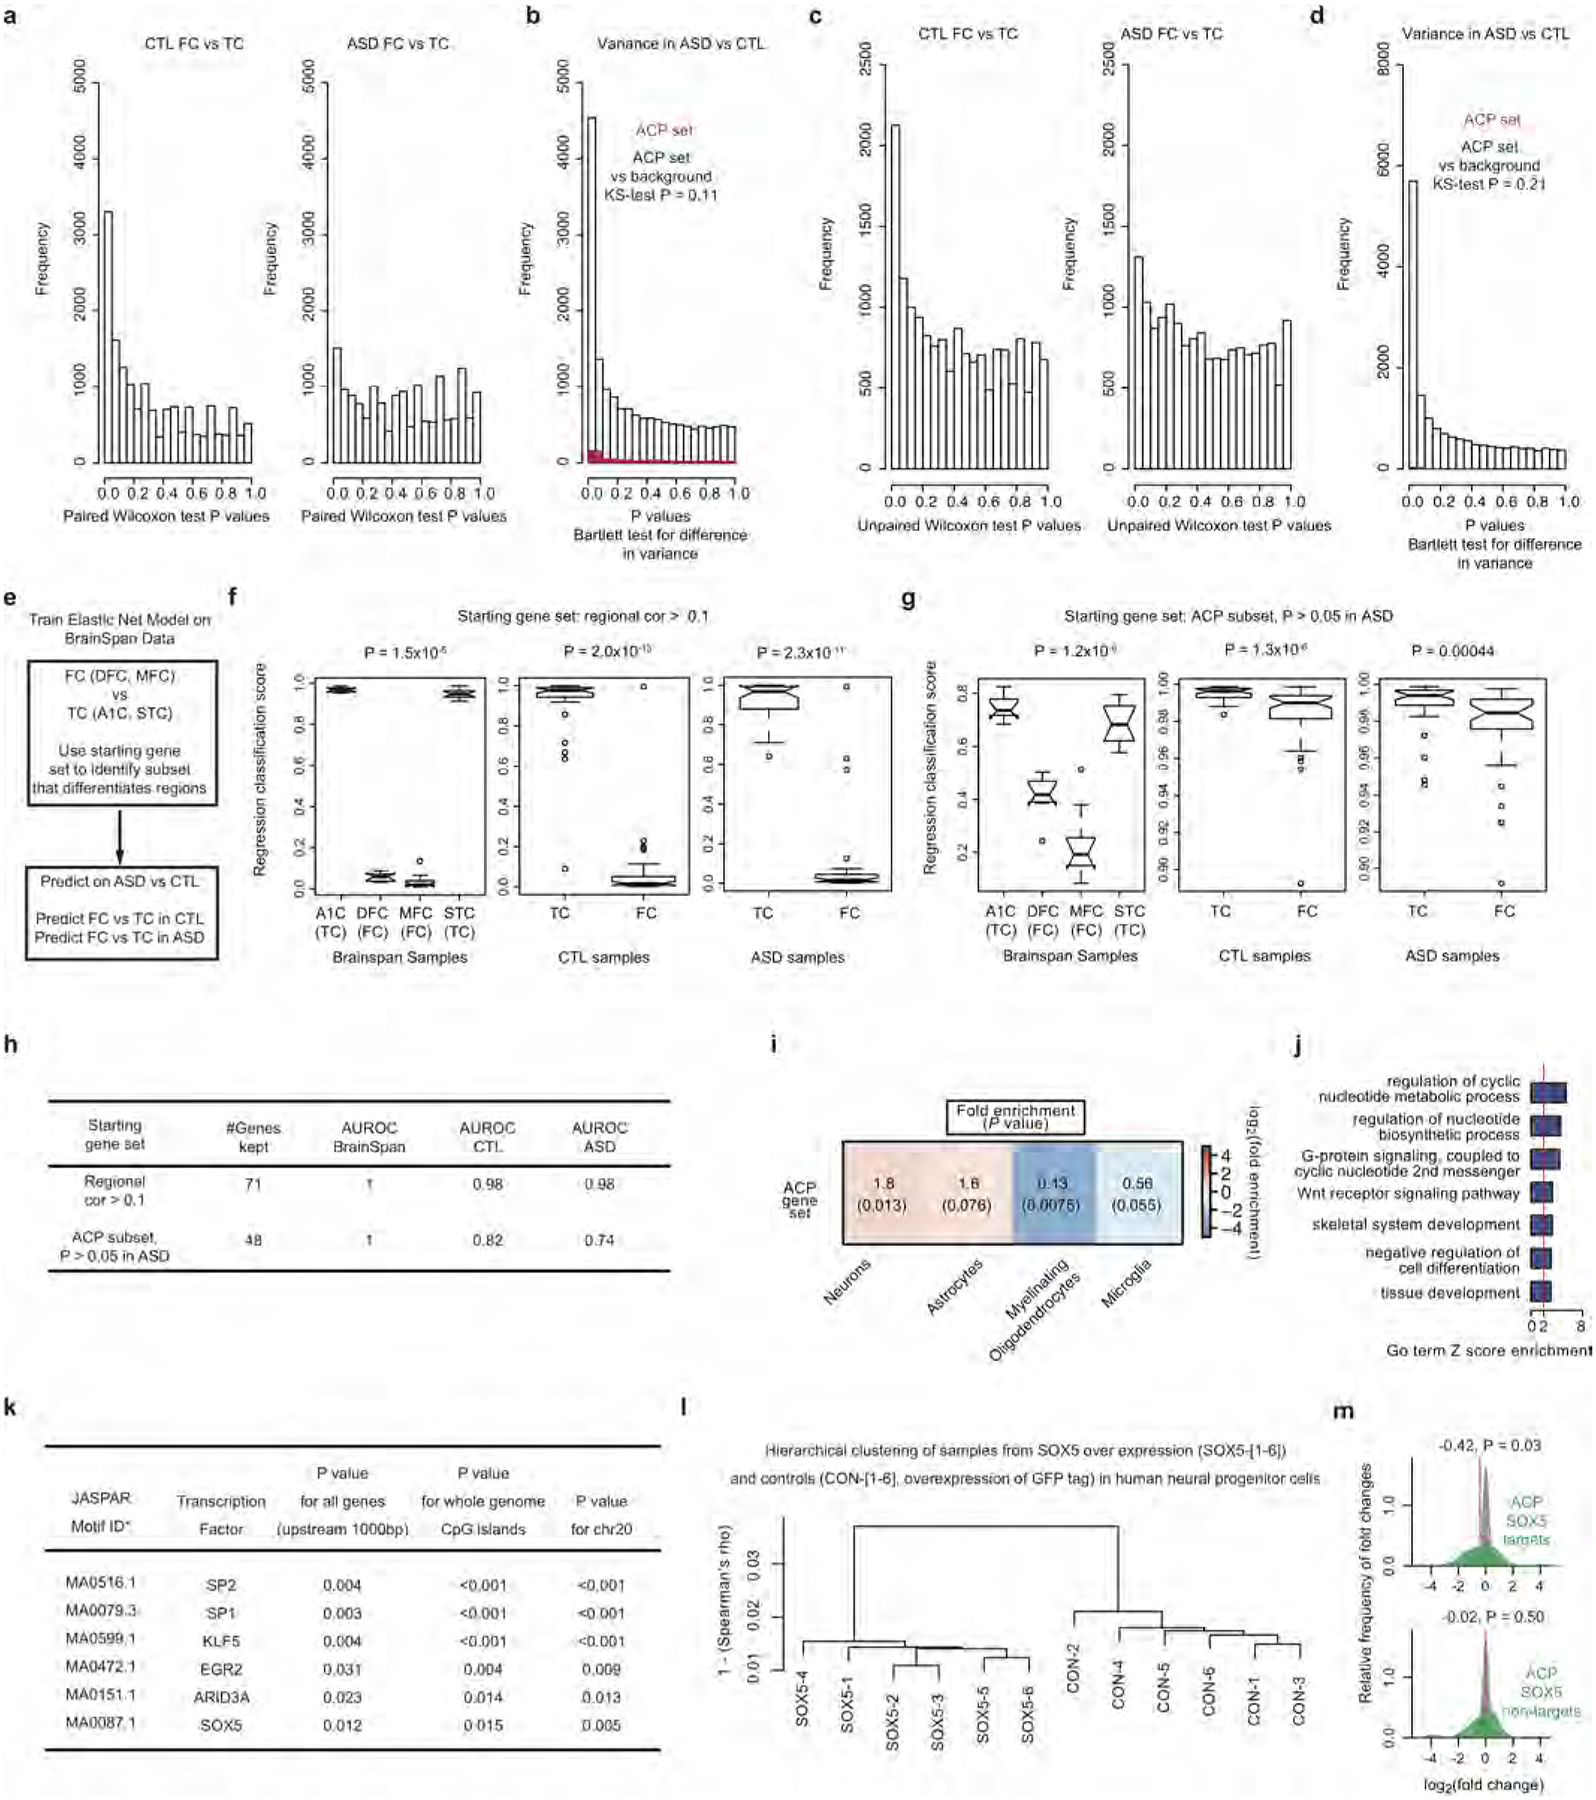
a, Histograms of P values from paired Wilcoxon rank-sum test differential gene expression between 16 frontal cortex (FC) and 16 temporal cortex (TC) samples from control and ASD individuals. b, Histogram of Bartlett’s test P values for differences in gene expression variance between ASD and control samples for all genes (white) and genes in the ACP set (red). The Kolmogorov–Smirnov (K–S) test P value for a difference between these two distributions is shown. c, Histograms of P values from unpaired Wilcoxon rank-sum test DGE between 21 frontal cortex and 22 temporal cortex samples after removing those used in ref. 8. d, Histogram of Bartlett’s test P values for differences in gene expression variance between ASD and control samples for all genes (white) and genes in the ACP set (red). The Kolmogorov–Smirnov test P value for a difference between these two distributions is reported. e, Approach to training the elastic net model on BrainSpan49,50 frontal cortex and temporal cortex samples and application of the model to 123 cortical samples in this study. f–h, Results of learned cortical region classifications with different starting gene sets, with the BrainSpan training set (left), control samples (middle) and ASD samples (right) in each panel and the Wilcoxon rank-sum test P value of frontal versus temporal cortex difference for each comparison. A1C, primary auditory cortex; DFC, dorsolateral prefrontal cortex; MFC, medial prefrontal cortex; STC, superior temporal cortex. i, Cell-type enrichment analysis for genes in the ACP set. j, GO term enrichment analysis of the ACP set. Enrichment P values are computed as described in Methods. k, Enrichment statistics for transcription factor motifs found to be significantly enriched in the ACP set (see Supplementary Information for details of P value computation). l, Average linkage hierarchical clustering of the global gene expression profiles for samples with overexpression of SOX5 and green fluorescent protein (GFP) tag overexpression (controls). m, Density plots of fold changes for the subset of ACP genes that are predicted SOX5 targets (top, green) and non-targets (bottom, green) against background (grey). The median log2[fold change] is marked (red line) and P values are from a one-sided Wilcoxon rank-sum test.
Extended Data Figure 7 |. Duplication 15q syndrome analyses.
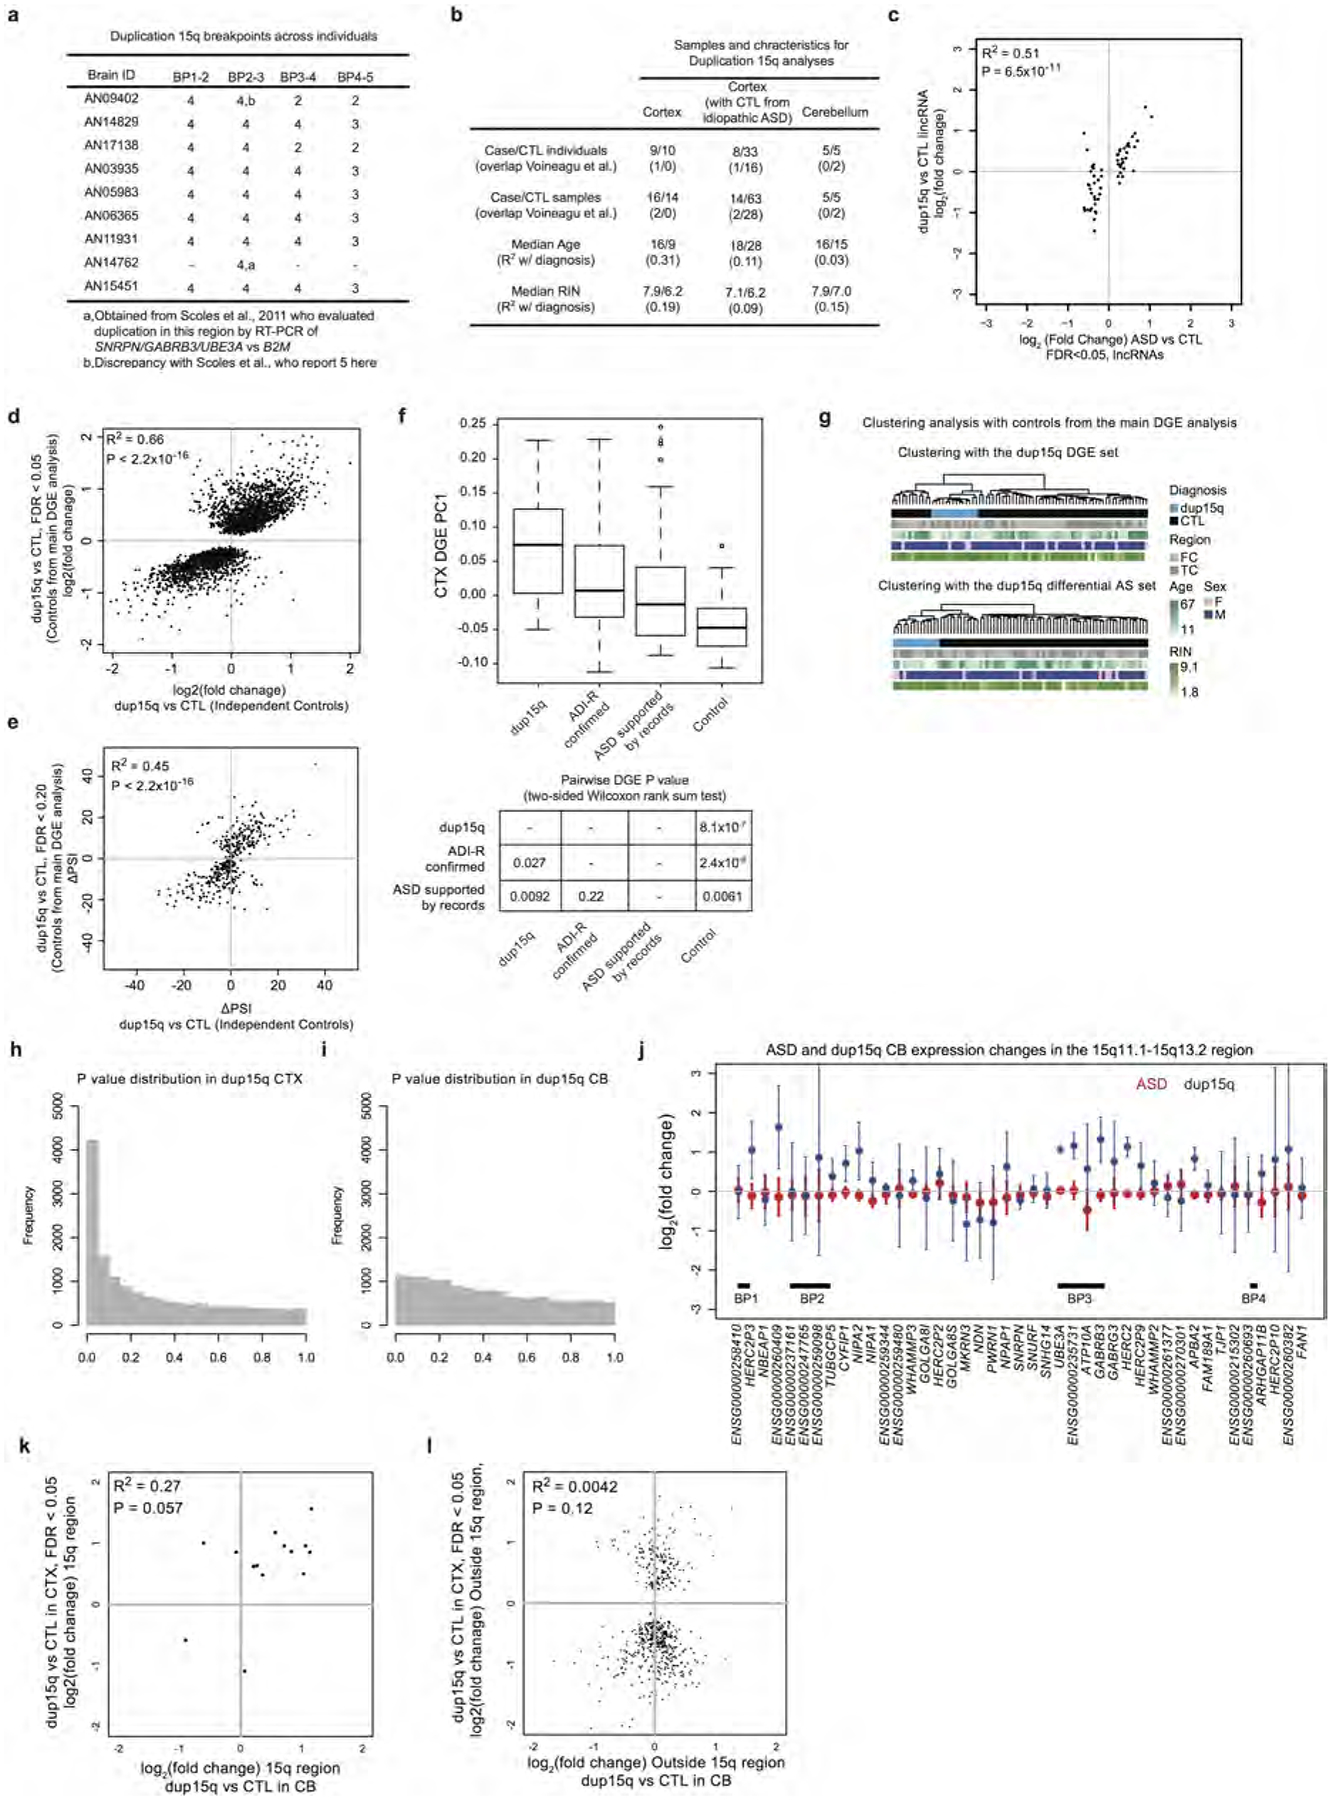
a, Copy number between breakpoints in the 15q region. Genome-wide copy number analysis allowed evaluation of copy number in additional regions from previous studies36. b, Sample characteristics for the dup15q analyses (additional details available in Supplementary Table 1). c, Similar to Fig. 3b, but focusing on the lncRNAs found to be significantly differentially expressed in idiopathic ASD compared to control subjects. d, Comparison of DGE fold changes demonstrating that using different control samples (control samples used in the idiopathic analysis, column 2 of Extended Data Fig. 7b) for the dup15q cortex analysis yields similar findings. e, Similar to d except for the differential alternative splicing analysis. f, Comparison of heterogeneity in the DGE signal using the first principal component of the ASD cortex DGE set across all cortical samples used in DGE analyses. Samples from individuals with diagnoses confirmed by dup15q mutations, confirmed by Autism Diagnostic Interview-Revised (ADI-R), and supported by clinical records are all significantly different from controls by two-sided pairwise Wilcoxon rank sum tests. g, Similar to Fig. 3d, but with the larger set of controls from the idiopathic ASD versus control analysis in Fig. 1. h, i, P value distributions for DGE changes outside the 15q region for cortex and cerebellum. j, Similar to Fig. 3a, but for the cerebellum analysis. k, Comparison of significant DGE changes in the duplicated region from cortex with changes in cerebellum. l, Comparison of significant DGE changes outside of the dup15q region in cortex with changes in cerebellum. Scatter plot P values correspond to the statistical significance of the Pearson correlation coefficient between fold changes (see Methods).
Extended Data Figure 8 |. Cortex co-expression network analyses.
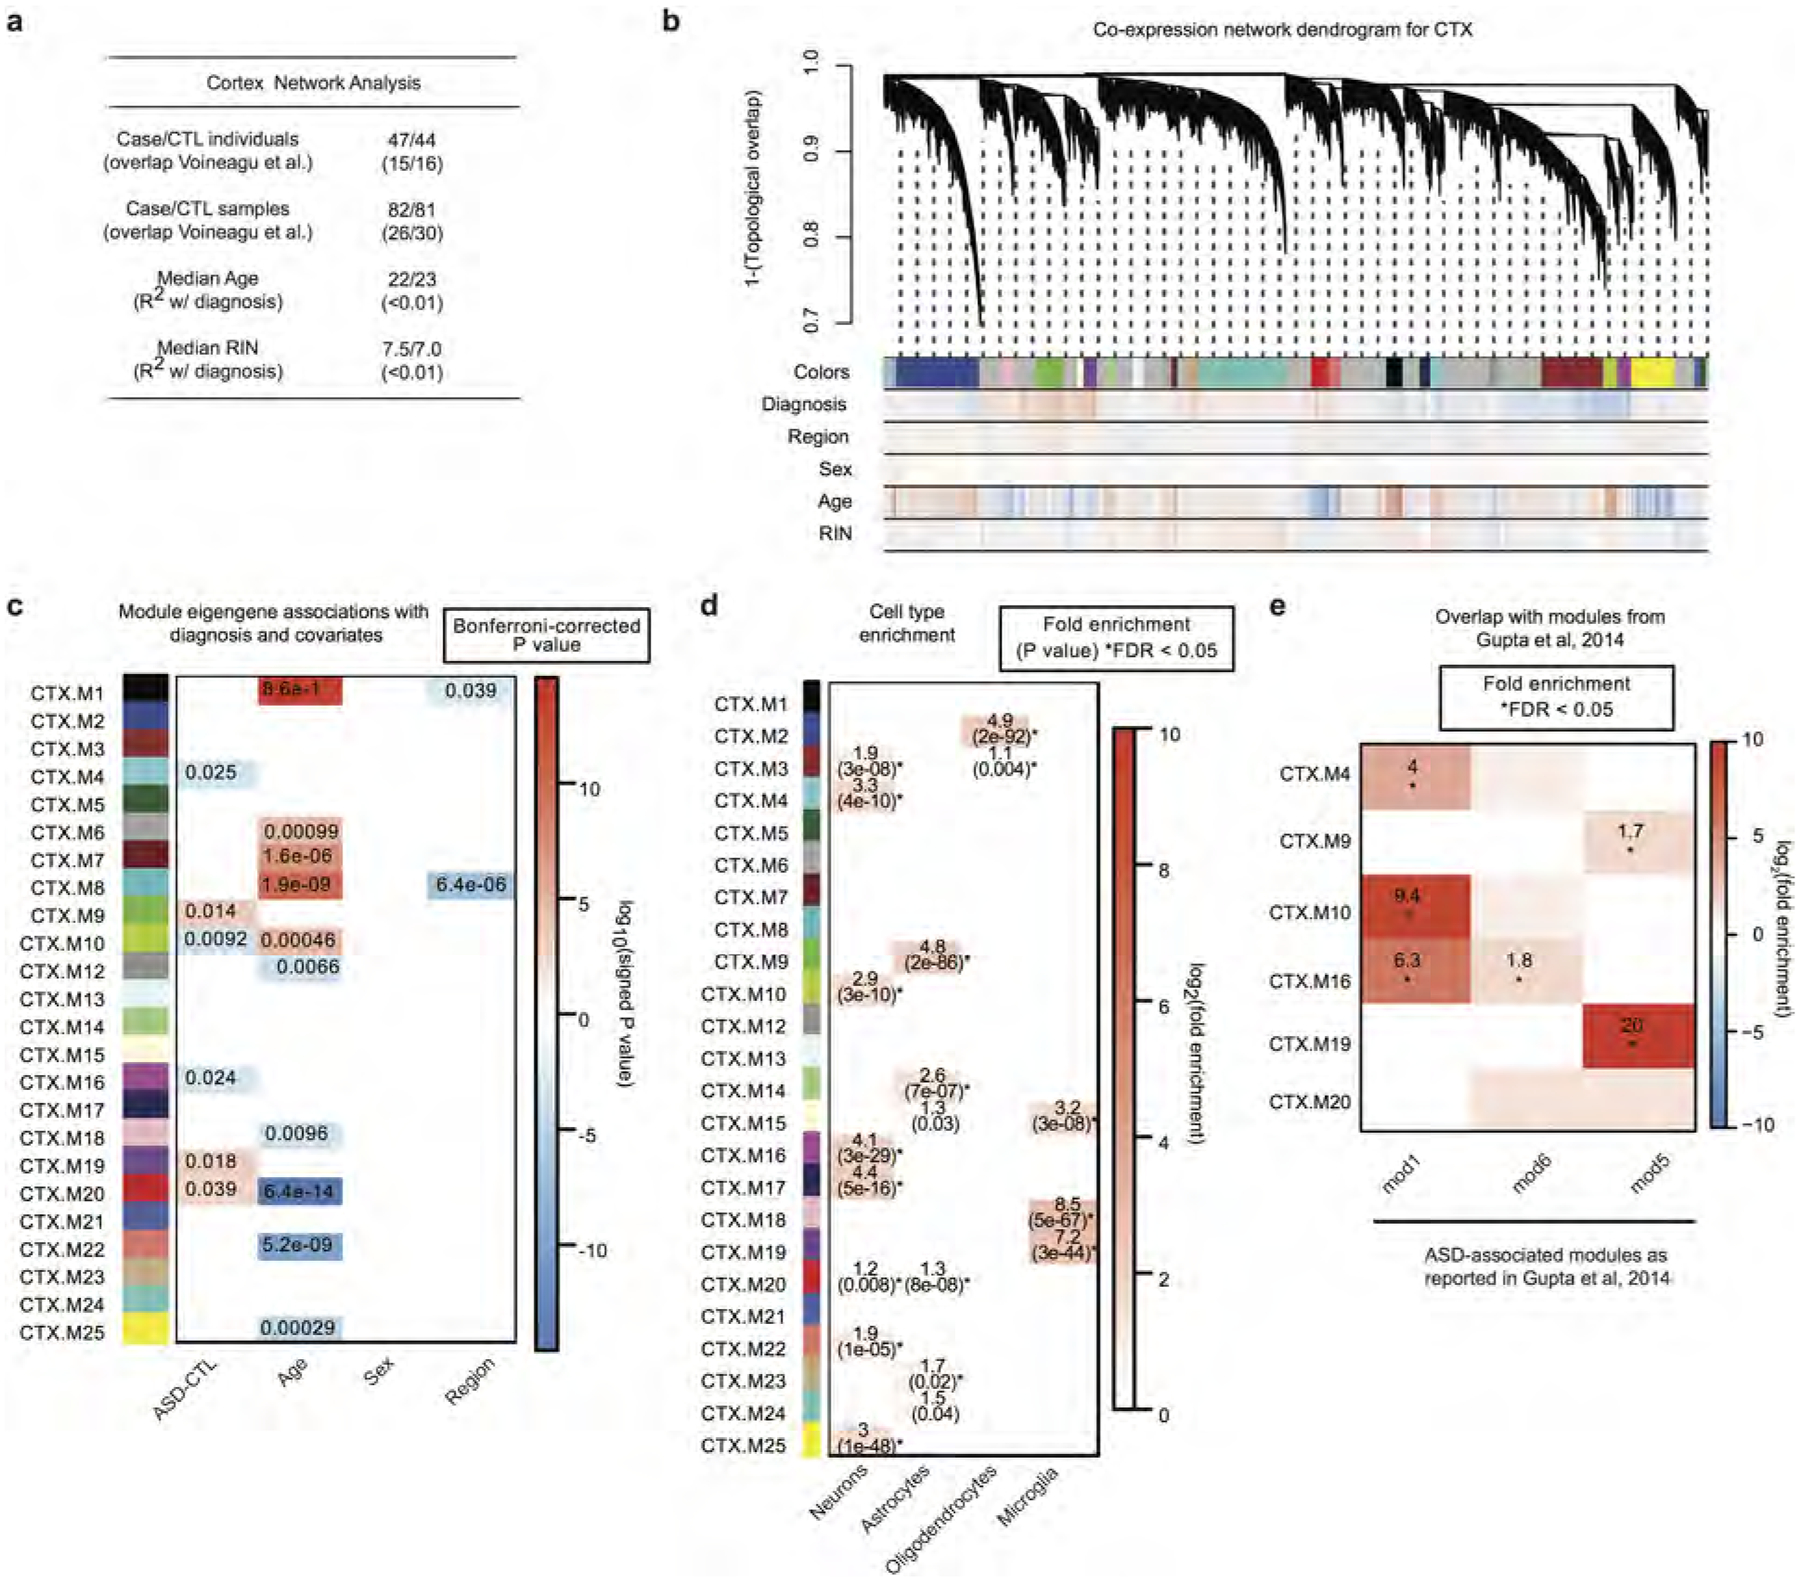
a, Sample characteristics for the cortex network analyses; additional details available in Supplementary Table 1. b, Average linkage hierarchical clustering using the topological overlap metric for co-expression dissimilarity37. Modules are identified from this dendrogram, which was constructed from a consensus of 100 bootstrapped datasets51,52 (see Methods). Correlations for each gene to covariates are delineated below the dendrogram (blue, negative; red, positive). Modules are labelled with colours and numerical labels (see Supplementary Table 4 for additional details). CTX.M11 is a module of genes that are not co-expressed (grey module) and was not evaluated in further comparisons. c, Module-trait associations as computed by an LME model with all factors on the x axis used as covariates. Technical covariates were removed as part of adjusting the FPKM values. All P values are displayed where the association passed Bonferroni-corrected P < 0.05. d, Module enrichments for cell-type specific gene expression patterns. Asterisks indicate FDR < 0.05 across all comparisons. e, Enrichment of ASD-associated modules with that from ref. 4. * FDR < 0.05 (see Supplementary Table 4 for details).
Extended Data Figure 9 |. Additional figures for cortex co-expression network analyses.
a, Gene set enrichment analyses comparing the 24 cortex co-expression modules with multiple gene sets from this RNA-seq study, post-mortem ASD cortex microarray8, human cortical development10, the set of all brain-expressed lncRNAs, genes enriched for ASD-associated rare variants26, and genes with de novo variants associated with intellectual disability (ID)9. Boxes are filled if the odds ratio is greater than 0 and the enrichment P < 0.05. * FDR < 0.05 across all comparisons, controlling for gene length and expression level with logistic regression (Supplementary Information). b, Overlap of gene sets between firing-rate and mitochondrial associated modules from ref. 53 with ASD-associated modules in cortex. c–e, Module plot of ASD-associated modules not shown in Fig. 4 (CTX.M4, CTX.M9, CTX.M10) displaying the top hub genes along with the module’s GO term enrichment. f, Temporal trajectories for four module eigengenes (CTX.M4, CTX.M9, CTX.M10, CTX.M16) associated with ASD, similar to Fig. 4g. ASD samples are represented by red points and lines, control samples by black. g, Module plot and GO term enrichment for CTX.M24, which is enriched in ASD-associated rare variants and lncRNAs. h, Common variant enrichment across modules as calculated by GWAS enrichment with LD score regression41,42 (see Methods). Disease GWAS studies evaluated include ASD54, schizophrenia55, inflammatory bowel disease56, type 2 diabetes mellitus57 and serum lipid levels58. P values are FDR corrected across all GWAS studies and modules. i, Plot of the proportion of SNP heritability across diseases for ASD-associated modules. Error bars represent s.e.
Extended Data Figure 10 |. Cerebellum co-expression network analyses.
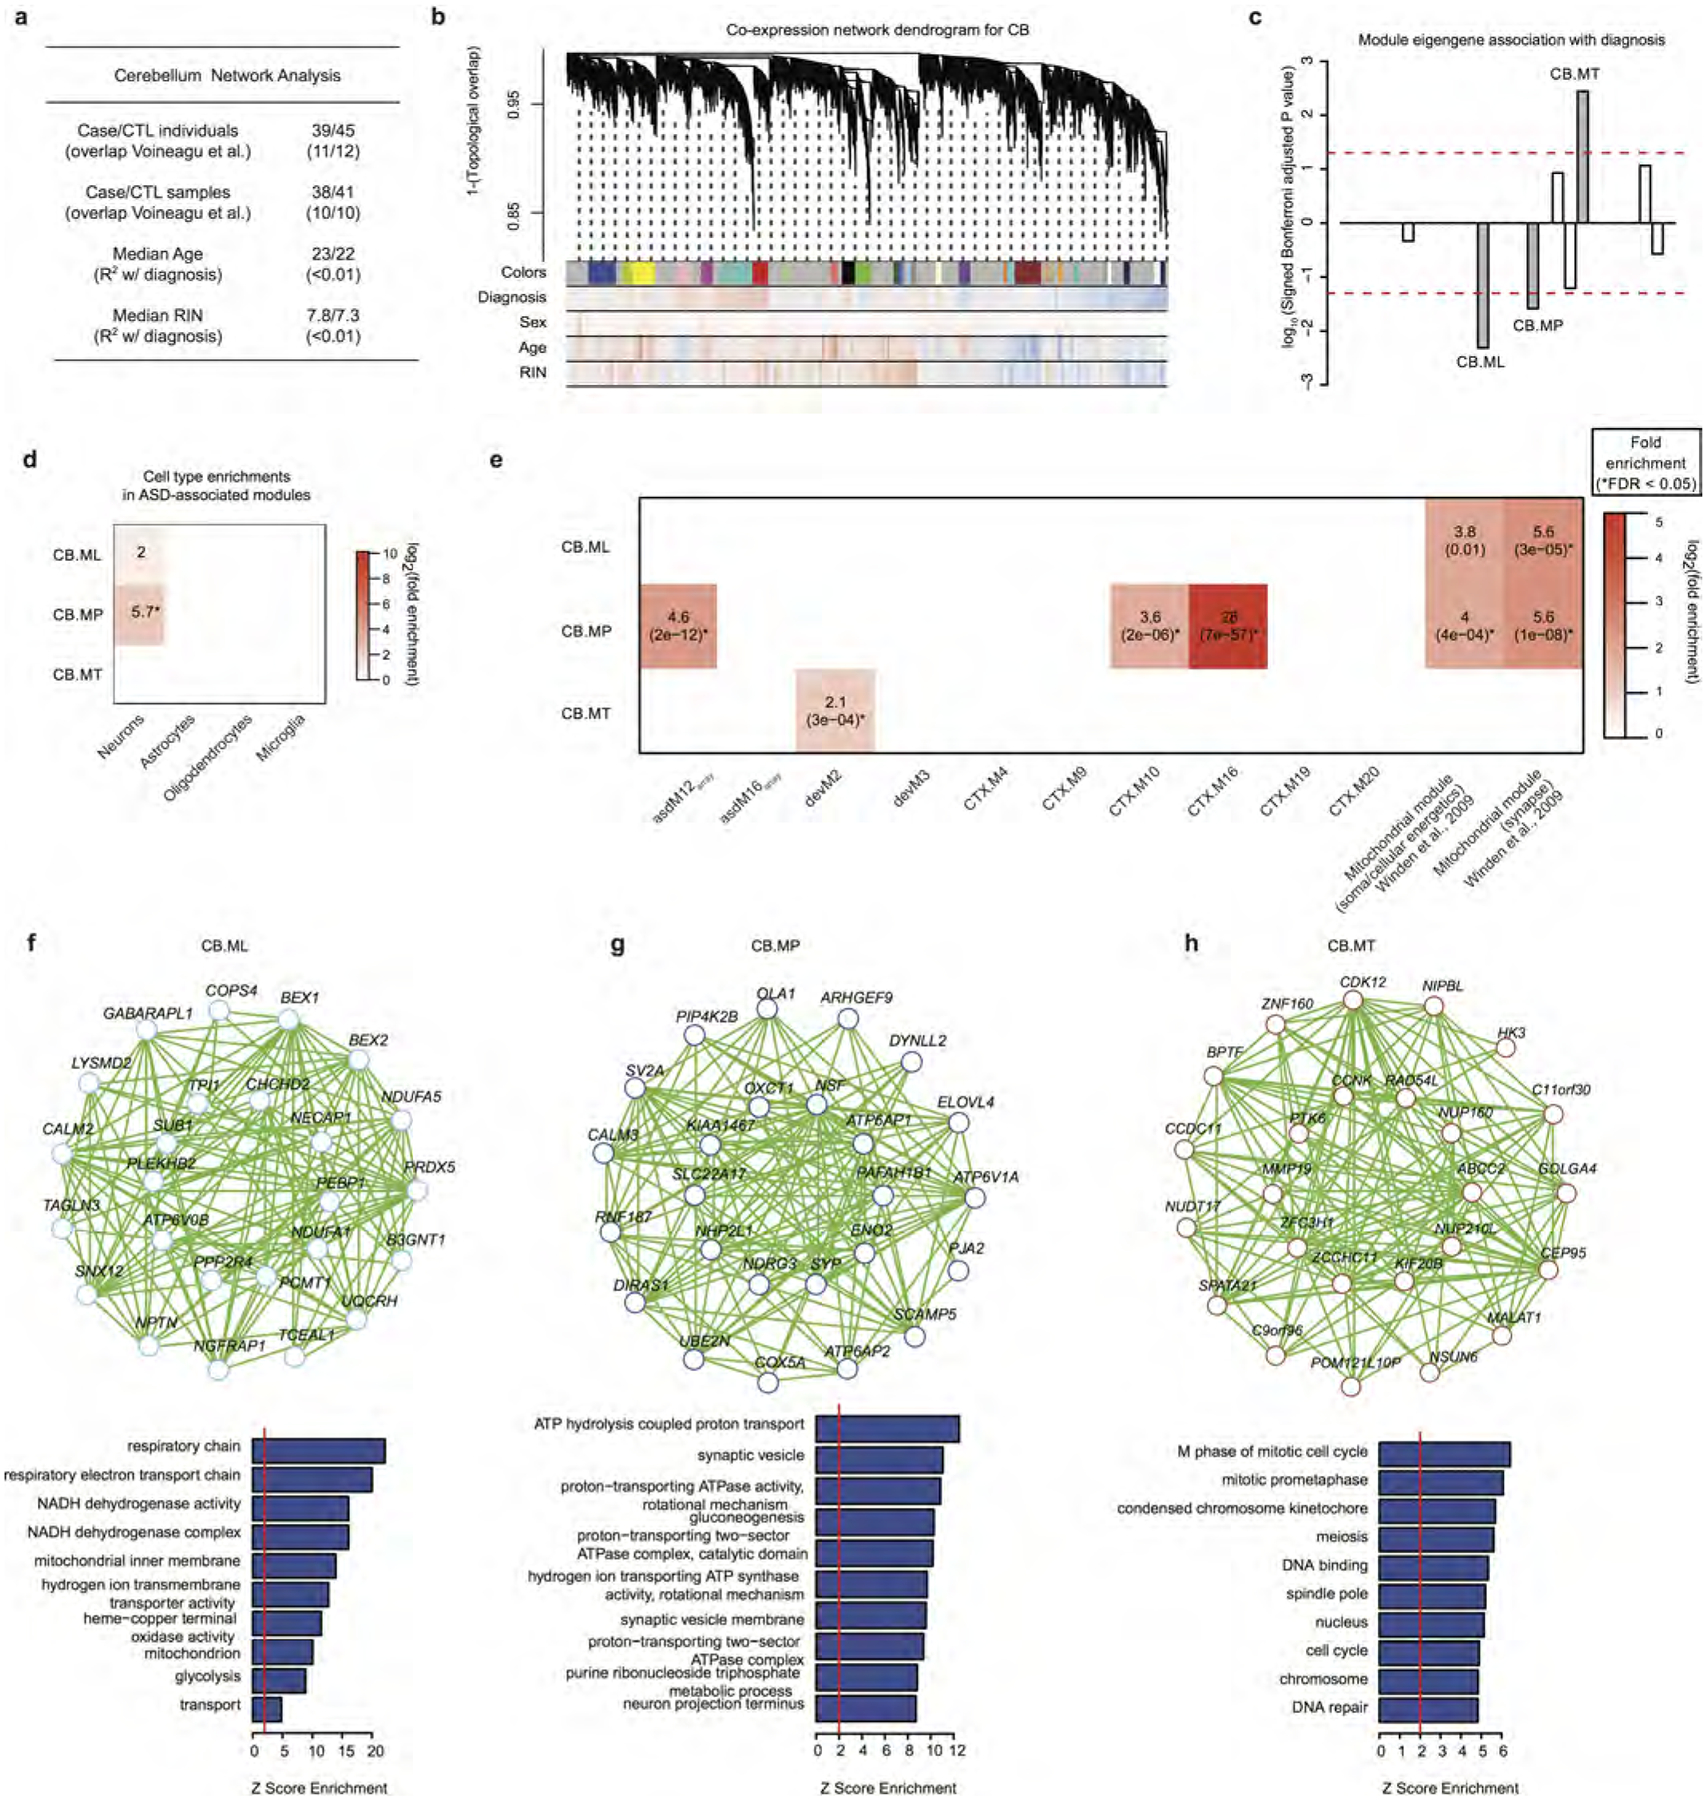
a, Sample characteristics for the cerebellum network analyses; additional details available in Supplementary Table 1. b, Modules identified from a dendrogram constructed from a consensus of 100 bootstrapped networks (see Methods). Correlations for each gene to each measured factor are delineated below the dendrogram (blue, negative; red, positive). Modules are labelled alphabetically instead of numerically to distinguish them from the cortex modules. Additional information is available in Supplementary Table 4. c, Signed association of module eigengenes with diagnosis; positive values indicate modules with increased expression in ASD samples. Grey bars with labels signify three ASD-associated modules. d, Cell-type enrichments for the three ASD-associated modules. e, Gene set enrichment analyses comparing the three ASD-associated cerebellum modules with post-mortem ASD cortex microarray, human brain development, six cortex ASD-associated modules from this RNA-seq study, and firing rate and mitochondrial associated modules from ref. 53. Boxes are filled if the odds ratio is greater than 0 and the enrichment P < 0.05. * FDR < 0.05 across all comparisons. f–h, Module plots of CB.ML, CB.MP, and CB.MT displaying the top hub genes along with the GO term enrichment. Additional details, including module preservation statistics for cerebellum in cortex and vice versa, are available in Supplementary Table 4.
Supplementary Material
Acknowledgements
Tissue, biological specimens or data used in this research were obtained from the Autism BrainNet (formerly the Autism Tissue Program), which is sponsored by the Simons Foundation, and the University of Maryland Brain and Tissue Bank, which is a component of the NIH NeuroBioBank. We are grateful to the patients and families who participate in the tissue donation programs. The authors acknowledge R. Zielke, J. Cottrell and R. Johnson, who assisted with sample acquisition from the latter brain bank. Funding for this work was provided by grants to D.H.G. (NIMH 5R37 MH060233, 5R01 MH09714 and 5R01 MH100027), N.N.P. (NRSA F30 MH099886, UCLA Medical Scientist Training Program), V.L. (Sigrid Juselius Fellowship) and T.G.B. (training grant 5T32 MH073526). Additional grants supporting this work include those to B.J.B. (CIHR, Alzheimer’s Research Foundation and University of Toronto McLaughlin Centre) and M.I. (ERC-StG-LS2-637591). We also thank D. Polioudakis for assistance with data management and V. Chandran for discussion of transcription factor binding site analysis and providing software.
Footnotes
Online Content Methods, along with any additional Extended Data display items and Source Data, are available in the online version of the paper; references unique to these sections appear only in the online paper.
Supplementary Information is available in the online version of the paper.
The authors declare competing financial interests: details are available in the online version of the paper. Readers are welcome to comment on the online version of the paper.
References
- 1.Gaugler T et al. Most genetic risk for autism resides with common variation. Nat. Genet 46, 881–885 (2014). [DOI] [PMC free article] [PubMed] [Google Scholar]
- 2.Gratten J, Visscher PM, Mowry BJ & Wray NR Interpreting the role of de novo protein-coding mutations in neuropsychiatric disease. Nat. Genet 45, 234–238 (2013). [DOI] [PubMed] [Google Scholar]
- 3.de la Torre-Ubieta L, Won H, Stein JL & Geschwind DH Advancing the understanding of autism disease mechanisms through genetics. Nat. Med 22, 345–361 (2016). [DOI] [PMC free article] [PubMed] [Google Scholar]
- 4.Gupta S et al. Transcriptome analysis reveals dysregulation of innate immune response genes and neuronal activity-dependent genes in autism. Nat. Commun 5, 5748 (2014). [DOI] [PMC free article] [PubMed] [Google Scholar]
- 5.Garbett K et al. Immune transcriptome alterations in the temporal cortex of subjects with autism. Neurobiol. Dis 30, 303–311 (2008). [DOI] [PMC free article] [PubMed] [Google Scholar]
- 6.Purcell AE, Jeon OH, Zimmerman AW, Blue ME & Pevsner J Postmortem brain abnormalities of the glutamate neurotransmitter system in autism. Neurology 57, 1618–1628 (2001). [DOI] [PubMed] [Google Scholar]
- 7.Chow ML et al. Age-dependent brain gene expression and copy number anomalies in autism suggest distinct pathological processes at young versus mature ages. PLoS Genet. 8, e1002592 (2012). [DOI] [PMC free article] [PubMed] [Google Scholar]
- 8.Voineagu I et al. Transcriptomic analysis of autistic brain reveals convergent molecular pathology. Nature 474, 380–384 (2011). [DOI] [PMC free article] [PubMed] [Google Scholar]
- 9.Iossifov I et al. The contribution of de novo coding mutations to autism spectrum disorder. Nature 515, 216–221 (2014). [DOI] [PMC free article] [PubMed] [Google Scholar]
- 10.Parikshak NN et al. Integrative functional genomic analyses implicate specific molecular pathways and circuits in autism. Cell 155, 1008–1021 (2013). [DOI] [PMC free article] [PubMed] [Google Scholar]
- 11.Necsulea A et al. The evolution of lncRNA repertoires and expression patterns in tetrapods. Nature 505, 635–640 (2014). [DOI] [PubMed] [Google Scholar]
- 12.Jaffe AE et al. Developmental regulation of human cortex transcription and its clinical relevance at single base resolution. Nat. Neurosci 18, 154–161 (2015). [DOI] [PMC free article] [PubMed] [Google Scholar]
- 13.Weyn-Vanhentenryck SM et al. HITS-CLIP and integrative modeling define the Rbfox splicing-regulatory network linked to brain development and autism. Cell Reports 6, 1139–1152 (2014). [DOI] [PMC free article] [PubMed] [Google Scholar]
- 14.Irimia M et al. A highly conserved program of neuronal microexons is misregulated in autistic brains. Cell 159, 1511–1523 (2014). [DOI] [PMC free article] [PubMed] [Google Scholar]
- 15.Wu J, Anczuków O, Krainer AR, Zhang MQ & Zhang C OLego: fast and sensitive mapping of spliced mRNA-Seq reads using small seeds. Nucleic Acids Res. 41, 5149–5163 (2013). [DOI] [PMC free article] [PubMed] [Google Scholar]
- 16.Li YI et al. RNA splicing is a primary link between genetic variation and disease. Science 352, 600–604 (2016). [DOI] [PMC free article] [PubMed] [Google Scholar]
- 17.Zhang Y et al. An RNA-sequencing transcriptome and splicing database of glia, neurons, and vascular cells of the cerebral cortex. J. Neurosci 34, 11929–11947 (2014). [DOI] [PMC free article] [PubMed] [Google Scholar]
- 18.Lovci MT et al. Rbfox proteins regulate alternative mRNA splicing through evolutionarily conserved RNA bridges. Nat. Struct. Mol. Biol 20, 1434–1442 (2013). [DOI] [PMC free article] [PubMed] [Google Scholar]
- 19.Raj B et al. A global regulatory mechanism for activating an exon network required for neurogenesis. Mol. Cell 56, 90–103 (2014). [DOI] [PMC free article] [PubMed] [Google Scholar]
- 20.Gueroussov S et al. An alternative splicing event amplifies evolutionary differences between vertebrates. Science 349, 868–873 (2015). [DOI] [PubMed] [Google Scholar]
- 21.Maze I et al. Critical role of histone turnover in neuronal transcription and plasticity. Neuron 87, 77–94 (2015). [DOI] [PMC free article] [PubMed] [Google Scholar]
- 22.Mullins C, Fishell G & Tsien RW Unifying views of autism spectrum disorders: a consideration of autoregulatory feedback loops. Neuron 89, 1131–1156 (2016). [DOI] [PMC free article] [PubMed] [Google Scholar]
- 23.Kwan KY et al. SOX5 postmitotically regulates migration, postmigratory differentiation, and projections of subplate and deep-layer neocortical neurons. Proc. Natl Acad. Sci. USA 105, 16021–16026 (2008). [DOI] [PMC free article] [PubMed] [Google Scholar]
- 24.Lamb AN et al. Haploinsufficiency of SOX5 at 12p12.1 is associated with developmental delays with prominent language delay, behavior problems, and mild dysmorphic features. Hum. Mutat 33, 728–740 (2012). [DOI] [PMC free article] [PubMed] [Google Scholar]
- 25.Willsey AJ et al. Coexpression networks implicate human midfetal deep cortical projection neurons in the pathogenesis of autism. Cell 155, 997–1007 (2013). [DOI] [PMC free article] [PubMed] [Google Scholar]
- 26.Sanders SJ et al. Insights into autism spectrum disorder genomic architecture and biology from 71 risk loci. Neuron 87, 1215–1233 (2015). [DOI] [PMC free article] [PubMed] [Google Scholar]
- 27.Blumenthal I et al. Transcriptional consequences of 16p11.2 deletion and duplication in mouse cortex and multiplex autism families. Am. J. Hum. Genet 94, 870–883 (2014). [DOI] [PMC free article] [PubMed] [Google Scholar]
- 28.Huttenlocher PR Morphometric study of human cerebral cortex development. Neuropsychologia 28, 517–527 (1990). [DOI] [PubMed] [Google Scholar]
- 29.Khundrakpam BS, Lewis JD, Zhao L, Chouinard-Decorte F & Evans AC Brain connectivity in normally developing children and adolescents. Neuroimage 134, 192–203 (2016). [DOI] [PubMed] [Google Scholar]
- 30.Zhang YE, Landback P, Vibranovski MD & Long M Accelerated recruitment of new brain development genes into the human genome. PLoS Biol. 9, e1001179 (2011). [DOI] [PMC free article] [PubMed] [Google Scholar]
- 31.Harrow J et al. GENCODE: producing a reference annotation for ENCODE. Genome Biol. 7 (Suppl. 1), 1–9 (2006). [DOI] [PMC free article] [PubMed] [Google Scholar]
- 32.Trapnell C et al. Differential analysis of gene regulation at transcript resolution with RNA-seq. Nat. Biotechnol 31, 46–53 (2013). [DOI] [PMC free article] [PubMed] [Google Scholar]
- 33.Anders S, Pyl PT & Huber W HTSeq—a Python framework to work with high-throughput sequencing data. Bioinformatics 31, 166–169 (2015). [DOI] [PMC free article] [PubMed] [Google Scholar]
- 34.Benjamini Y & Hochberg Y Controlling the false discovery rate: a practical and powerful approach to multiple testing. J. R. Stat. Soc 57, 289–300 (1995). [Google Scholar]
- 35.Shen S et al. MATS: a Bayesian framework for flexible detection of differential alternative splicing from RNA-Seq data. Nucleic Acids Res. 40, e61 (2012). [DOI] [PMC free article] [PubMed] [Google Scholar]
- 36.Scoles HA, Urraca N, Chadwick SW, Reiter LT & Lasalle JM Increased copy number for methylated maternal 15q duplications leads to changes in gene and protein expression in human cortical samples. Mol. Autism 2, 19 (2011). [DOI] [PMC free article] [PubMed] [Google Scholar]
- 37.Zhang B & Horvath S A general framework for weighted gene co-expression network analysis. Stat. Appl. Genet. Mol. Biol 4, 17 (2005). [DOI] [PubMed] [Google Scholar]
- 38.Langfelder P & Horvath S WGCNA: an R package for weighted correlation network analysis. BMC Bioinformatics 9, 559 (2008). [DOI] [PMC free article] [PubMed] [Google Scholar]
- 39.Langfelder P & Horvath S Eigengene networks for studying the relationships between co-expression modules. BMC Syst. Biol 1, 54 (2007). [DOI] [PMC free article] [PubMed] [Google Scholar]
- 40.Zambon AC et al. GO-Elite: a flexible solution for pathway and ontology over-representation. Bioinformatics 28, 2209–2210 (2012). [DOI] [PMC free article] [PubMed] [Google Scholar]
- 41.Bulik-Sullivan BK et al. LD Score regression distinguishes confounding from polygenicity in genome-wide association studies. Nat. Genet 47, 291–295 (2015). [DOI] [PMC free article] [PubMed] [Google Scholar]
- 42.Finucane HK et al. Partitioning heritability by functional annotation using genome-wide association summary statistics. Nat. Genet 47, 1228–1235 (2015). [DOI] [PMC free article] [PubMed] [Google Scholar]
- 43.Trapnell C et al. Differential gene and transcript expression analysis of RNA-seq experiments with TopHat and Cufflinks. Nat. Protocols 7, 562–578 (2012). [DOI] [PMC free article] [PubMed] [Google Scholar]
- 44.Law CW, Chen Y, Shi W & Smyth GK voom: Precision weights unlock linear model analysis tools for RNA-seq read counts. Genome Biol. 15, R29 (2014). [DOI] [PMC free article] [PubMed] [Google Scholar]
- 45.Leek JT & Storey JD Capturing heterogeneity in gene expression studies by surrogate variable analysis. PLoS Genet. 3, 1724–1735 (2007). [DOI] [PMC free article] [PubMed] [Google Scholar]
- 46.Love MI, Huber W & Anders S Moderated estimation of fold change and dispersion for RNA-seq data with DESeq2. Genome Biol. 15, 550 (2014). [DOI] [PMC free article] [PubMed] [Google Scholar]
- 47.Friedman J, Hastie T & Tibshirani R Regularization paths for generalized linear models via coordinate descent. J. Stat. Softw 33, 1–22 (2010). [PMC free article] [PubMed] [Google Scholar]
- 48.Dittmar KA et al. Genome-wide determination of a broad ESRP-regulated posttranscriptional network by high-throughput sequencing. Mol. Cell. Biol 32, 1468–1482 (2012). [DOI] [PMC free article] [PubMed] [Google Scholar]
- 49.Kang HJ et al. Spatio-temporal transcriptome of the human brain. Nature 478, 483–489 (2011). [DOI] [PMC free article] [PubMed] [Google Scholar]
- 50.Sunkin SM et al. Allen Brain Atlas: an integrated spatio-temporal portal for exploring the central nervous system. Nucleic Acids Res. 41, D996–D1008 (2013). [DOI] [PMC free article] [PubMed] [Google Scholar]
- 51.Langfelder P, Zhang B & Horvath S Defining clusters from a hierarchical cluster tree: the Dynamic Tree Cut package for R. Bioinformatics 24, 719–720 (2008). [DOI] [PubMed] [Google Scholar]
- 52.Langfelder P & Horvath S Fast R functions for robust correlations and hierarchical clustering. J. Stat. Softw 46, i11 (2012). [PMC free article] [PubMed] [Google Scholar]
- 53.Winden KD et al. The organization of the transcriptional network in specific neuronal classes. Mol. Syst. Biol 5, 291 (2009). [DOI] [PMC free article] [PubMed] [Google Scholar]
- 54.Robinson EB et al. Genetic risk for autism spectrum disorders and neuropsychiatric variation in the general population. Nat. Genet 48, 552–555 (2016). [DOI] [PMC free article] [PubMed] [Google Scholar]
- 55.Schizophrenia Working Group of the Psychiatric Genomics Consortium. Biological insights from 108 schizophrenia-associated genetic loci. Nature 511, 421–427 (2014). [DOI] [PMC free article] [PubMed] [Google Scholar]
- 56.Liu JZ et al. Association analyses identify 38 susceptibility loci for inflammatory bowel disease and highlight shared genetic risk across populations. Nat. Genet 47, 979–986 (2015). [DOI] [PMC free article] [PubMed] [Google Scholar]
- 57.Morris AP et al. Large-scale association analysis provides insights into the genetic architecture and pathophysiology of type 2 diabetes. Nat. Genet 44, 981–990 (2012). [DOI] [PMC free article] [PubMed] [Google Scholar]
- 58.Global Lipids Genetics Consortium Discovery and refinement of loci associated with lipid levels. Nat. Genet 45, 1274–1283 (2013). [DOI] [PMC free article] [PubMed] [Google Scholar]
Associated Data
This section collects any data citations, data availability statements, or supplementary materials included in this article.
Supplementary Materials
Data Availability Statement
Human brain RNA-seq data have been deposited in Synapse (https://www.synapse.org/#!Synapse:syn4587609) under accession number syn4587609. Data for the SOX5 overexpression are available from the Gene Expression Omnibus (accession number GSE89057). All other data are available from the corresponding author upon reasonable request.