Abstract
Mutations in the LMNA gene, which encodes the nuclear envelope (NE) proteins lamins A/C, cause Emery-Dreifuss muscular dystrophy, congenital muscular dystrophy, and other diseases collectively known as laminopathies. The mechanisms responsible for these diseases remain incompletely understood. Using three mouse models of muscle laminopathies and muscle biopsies from individuals with LMNA-related muscular dystrophy, we found that Lmna mutations reduced nuclear stability and caused transient rupture of the NE in skeletal muscle cells, resulting in DNA damage, DNA damage response activation, and reduced cell viability. NE and DNA damage resulted from nuclear migration during skeletal muscle maturation and correlated with disease severity in the mouse models. Reducing cytoskeletal forces on the myonuclei prevented NE damage and rescued myofiber function and viability in Lmna mutant myofibers, indicating that myofiber dysfunction is the result of mechanically induced NE damage. Taken together, these findings implicate mechanically induced DNA damage as a pathogenic contributor for LMNA skeletal muscle diseases.
INTRODUCTION
Lamins are the major components of the nuclear lamina, which lines the inner nuclear membrane. Lamins A/C provide structural support to the nucleus, connect the nucleus to the cytoskeleton, and participate in transcriptional regulation, genome organization, and DNA damage repair1, 2. LMNA mutations cause autosomal dominant Emery-Dreifuss muscular dystrophy (AD-EDMD), characterized by skeletal muscle wasting, joint contractures, and cardiomyopathy, congenital muscular dystrophy (LMNA-CMD), a particularly severe form of muscular dystrophy, and other muscle diseases3, 4. It remains unclear how the ubiquitously expressed mutant lamins cause muscle-specific defects. One explanation is that LMNA mutations result in structurally impaired nuclei that become damaged in mechanically active tissues2. This hypothesis is supported by findings of decreased nuclear stiffness in fibroblasts expressing LMNA mutations linked to striated muscle laminopathies, impaired assembly of mutant lamins, and reports of NE damage in muscle cells of individuals with AD-EDMD and LMNA-related dilated cardiomyopathies1, 5, 6. It remains unclear, however, whether the NE damage is a cause or consequence of muscle dysfunction.
We used three laminopathy mouse models coupled with an in vitro muscle differentiation platform7 and high resolution time-lapse microscopy to systematically study the link between impaired NE structure, damage, and muscle cell dysfunction. Lmna mutant myonuclei exhibited progressive NE damage, including chromatin protrusions and transient NE rupture. Intriguingly, NE rupture was associated with progressive DNA damage and DNA damage response activation, which was also observed in patient biopsies. Disrupting the Linker of Nucleoskeleton and Cytoskeleton (LINC) complex, which physically connects the nucleus to the cytoskeleton8, prevented nuclear envelope rupture, reduced DNA damage, and rescued myofiber viability and contractility in lamin A/C-deficient cells. These findings indicate a causative role of NE rupture and DNA damage in progressive muscle decline and provide an explanation for how lamin A/C mutations lead to muscle weakness and wasting in muscle laminopathies.
RESULTS
Lmna mutations cause progressive decline in myofiber health
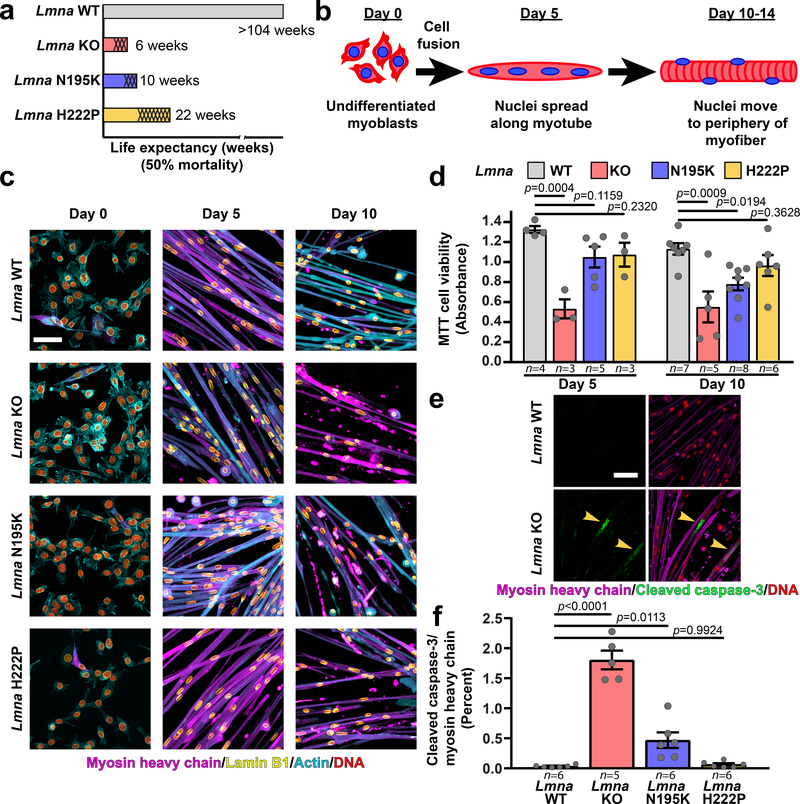
To examine the effect of Lmna mutations on nuclear mechanics and muscle function, we isolated myoblasts from three mouse models of striated muscle laminopathies, representing a spectrum of disease severity (Figure 1a, Supplementary Figure 1): Lamin A/C-deficient (Lmna–/–)9, referred to as lamin A/C knock-out (Lmna KO), LmnaN195K/N195K knock-in (Lmna N195K)10, LmnaH222P/H222P knock-in (Lmna H222P)11 mice, and wild-type littermates. While the Lmna N195K mice were originally described as a model for dilated cardiomyopathy10, in the C57BL/6 background they also developed muscular dystrophy (Supplementary Figure 1). For in vitro studies, we used a three-dimensional culture protocol to differentiate primary myoblasts into mature, contractile myofibers (Figure 1b,c; Supplementary Figure 2)7. All myoblasts successfully differentiated into myotubes and myofibers (Figure 1c). Wild-type myofibers remained healthy and highly contractile at ten days of differentiation (Supplementary Movie 1). In contrast, Lmna KO myofibers declined in contractility, viability, and number of myonuclei, starting at day five of differentiation; the Lmna N195K myofibers showed similar declines by day ten of differentiation, whereas Lmna H222P myofibers had no significant decline by day ten (Figure 1c,d; Extended Data Figure 1, Supplementary Movies 2–4). The decreased viability in Lmna KO and N195K myofibers was associated with increased caspase-3 activity (Figure 1e,f). Together, these assays revealed a striking correlation between the defects observed in vitro with the severity of the disease in the corresponding mouse models.
Figure 1. In vitro differentiated primary myoblasts from Lmna KO, Lmna N195K, and Lmna H222P mice recapitulate disease severity.
(a) Graphical representation of the disease severity in the three Lmna mutant models used in the study, showing the published 50% mortality rates of Lmna KO, Lmna N195K, and Lmna H222P mice, as well as wild-type (Lmna WT) controls. Shading represents the onset of disease symptoms in the mouse models. (b) Schematic diagram representing the stages of differentiation (primary myoblasts to mature myofibers) in the in vitro system. (c) Representative images of Lmna WT, Lmna KO, Lmna N195K and Lmna H222P primary skeletal muscle cells at days 0, 5 and 10 of differentiation. Scale bar: 100 μm. Experiments were conducted three times with similar results. (d) Quantification of cell viability using MTT assay at days 5 and 10 of differentiation. Data points indicate results from n independent primary cell lines for each genotype. Significance was determined by one-way ANOVA within each time point, using Tukey’s correction for multiple comparisons. (e) Representative image of cleaved caspase-3 immunofluorescence in Lmna WT and Lmna KO myofibers at day 10 of differentiation. Scale bar: 20 μm (f) Quantification of cleaved caspase-3 relative to myosin heavy chain immunofluorescence area in Lmna WT, Lmna KO, Lmna N195K and Lmna H222P myofibers after 10 days of differentiation. Data points are for n independent primary cell lines for each genotype. Significance was determined by one-way ANOVA, using Tukey’s correction for multiple comparisons. All bar plots show mean value ± standard error of the mean.
Lmna mutant muscle cells have reduced nuclear stability
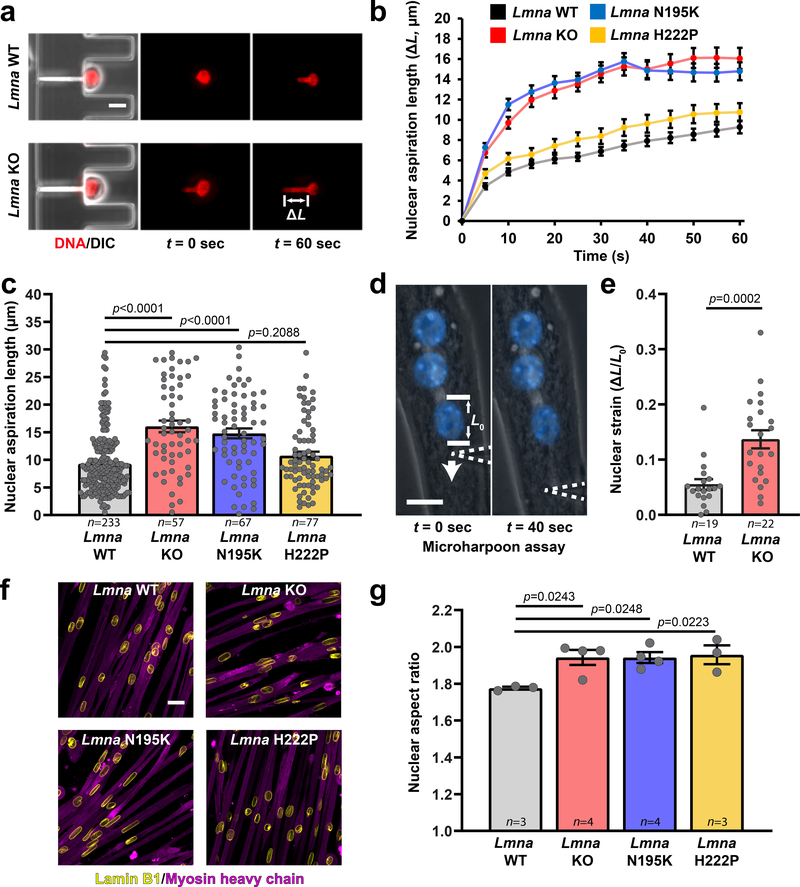
To test whether the progressive deterioration of Lmna mutant myofibers results from mechanically weakened myonuclei, we measured nuclear deformability in primary myoblasts using a microfluidic micropipette aspiration assay12 (Figure 2a, Supplementary Movie 5). Nuclei from Lmna KO and N195K myoblasts were much more deformable than nuclei from wild-type myoblasts; in contrast, Lmna H222P myonuclei had only modestly increased deformability (Figure 2b,c; Supplementary Figure 3a). Ectopic lamin A expression rescued nuclear deformability in Lmna KO myoblasts (Supplementary Figure 3b–d), confirming that impaired nuclear stability results from loss of lamin A/C. Myoblasts from dystrophin-mutant Mdx mice had normal nuclear deformability (Supplementary Figure 4), indicating that reduced nuclear stability is specific to Lmna mutations, not muscular dystrophy in general.
Figure 2. Lmna mutant muscle cells have reduced nuclear stability.
(a) Representative images of Lmna WT and Lmna KO nuclei deforming in a microfluidic micropipette aspiration device. Scale bar: 10 μm. (b, c) Measurements for nuclear deformation at 5 second intervals (b) for Lmna WT, Lmna KO, Lmna N195K, and Lmna H222P myoblasts during 60 seconds of aspiration. Quantification of the nuclear deformation after 60 seconds of aspiration (c). Data points are for n nuclei per genotype from three independent experiments. Significance was determined by one-way ANOVA, using Tukey’s correction for multiple comparisons. (d) A microharpoon assay was used to measure nuclear deformability (ΔL/L0) in myofibers, showing representative images before and at the end of perinuclear force application with a microneedle (dashed line). Scale bar: 15 μm. (e) Quantification of nuclear strain induced by the microharpoon assay in Lmna WT and Lmna KO myotubes at day 5 of differentiation. Data points are from n nuclei per genotype from three independent experiments. Significance was determined by two-tailed student’s t-test. (f) Representative images of nuclear morphology in Lmna WT, Lmna KO, Lmna N195K, and Lmna H222P myotubes after 5 days of differentiation. Scale bar: 20 μm. (g) Nuclear aspect ratio (length/width) in Lmna WT, Lmna KO, Lmna N195K, and Lmna H222P myotubes after 5 days of differentiation. Data points are for n independent primary cell lines for each genotype, with >100 nuclei counted per cell line. Significance was determined by one-way ANOVA, using Tukey’s correction for multiple comparisons. Bar plots show mean value ± standard error of the mean.
As a second approach to examine nuclear stability in mature myofibers, we measured nuclear deformability in response to perinuclear force application13. Lmna KO myofibers exhibited increased nuclear deformability compared with wild-type controls (Figure 2d,e; Supplementary Movie 6). Furthermore, Lmna mutant myofibers had significantly elongated myonuclei compared to wild-type controls (Figure 2f,g), consistent with previous reports from laminopathy patients14.
Lmna mutant myonuclei display chromatin protrusions
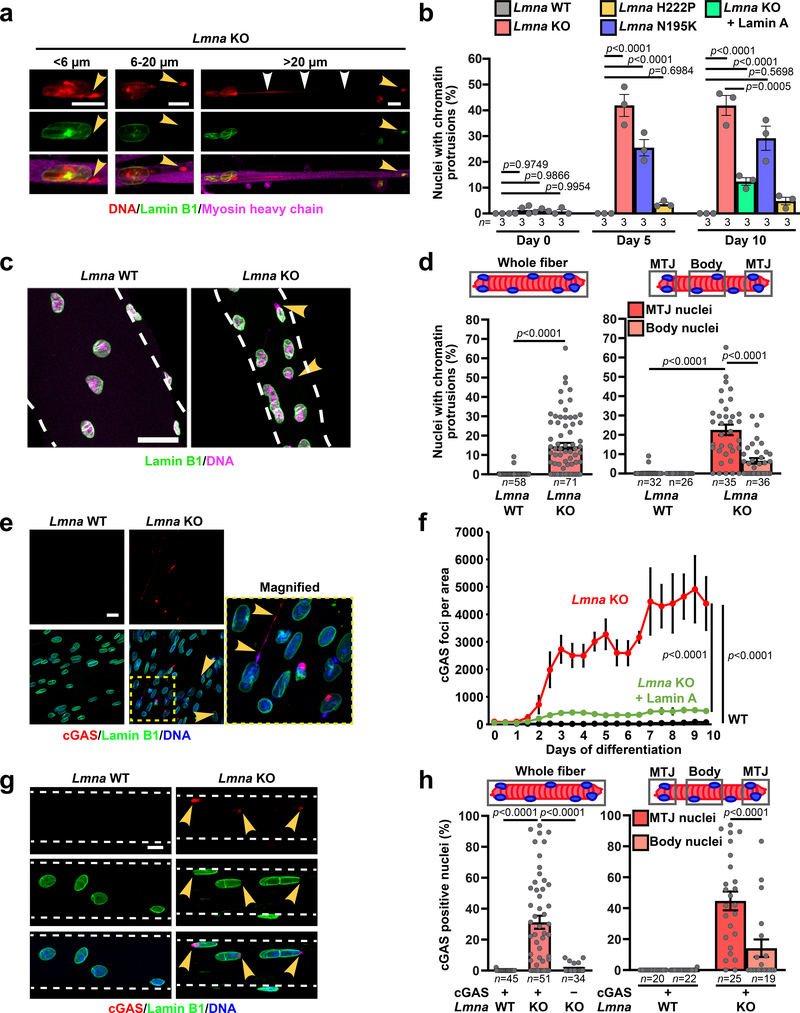
Despite possessing mechanically weak nuclei, Lmna mutant myoblasts initially displayed normal nuclear morphology. During differentiation, however, Lmna mutant myofibers exhibited striking chromatin protrusions (Figure 3a,b). The protrusions were enclosed by nuclear membranes, as evidenced by the presence of the nuclear membrane protein emerin, but lacked nuclear pores and other NE proteins (Supplementary Figure 5a,b). The chromatin protrusions were most prevalent in Lmna KO myofibers, followed by Lmna N195K, and then Lmna H222P myofibers (Figure 3b), correlating with the increased nuclear deformability in vitro and the disease severity in vivo. Expression of lamin A in Lmna KO myoblasts reduced the occurrence of chromatin protrusions (Figure 3b). Single muscle fibers isolated from the hindlimbs of Lmna KO exhibited similar NE defects, validating their presence in vivo (Figure 3c,d). Interestingly, the prevalence of chromatin protrusions in the Lmna KO myonuclei was higher at the myotendinous junctions (MTJ) than in the muscle fiber body (Figure 3d), consistent with a previous report of nuclear abnormalities at the MTJ in Lmna KO mice15.
Figure 3. Lmna mutant myonuclei exhibit chromatin protrusions and NE ruptures.
(a) Representative images of chromatin protrusions (arrowheads) in Lmna KO myofibers after 10 days of differentiation. Yellow arrowheads indicate protrusion end. Scale bar: 10 μm. (b) Percentage of myonuclei containing chromatin protrusion at days 5 and 10 of differentiation. n = 3 independent experiments; 62–73 nuclei quantified per genotype. Significance determined by one-way ANOVA within each time point, using Tukey’s correction for multiple comparisons. (c) Representative images of single muscle fibers from Lmna WT and Lmna KO mice. Arrowheads indicate chromatin protrusions. Scale bar: 20 μm. (d) Percentage of myonuclei with chromatin protrusion in muscle fibers from Lmna WT and Lmna KO mice. Left, whole muscle fibers; right, analysis for nuclei located at the MTJ versus fiber body. Data based on n individual myofibers per genotype, isolated from 5–11 animals each. Significance determined by two-tailed student’s t-test (total chromatin protrusions) or two-way ANOVA (genotype; MTJ/body) using Tukey’s correction for multiple comparisons. (e) Representative images of cGAS-mCherry accumulation at sites of NE rupture in Lmna KO myonuclei at day 5 of differentiation. Scale bar: 20 μm. (f) Formation of cGAS-mCherry foci per field of view during myofiber differentiation in Lmna WT, Lmna KO, and Lmna KO cells expressing ectopic lamin A, based on three independent experiments per group. Significance determined by non-linear regression analysis. (g) Representative images of single muscle fibers from Lmna WT and Lmna KO mice expressing cGAS-tdTomato NE rupture reporter, showing accumulation of cGAS-tdTomato (arrowhead) at sites of NE rupture. Scale bar: 10 μm. (h) Percentage of myonuclei with cGAS-tdTomato foci in isolated muscle fibers from Lmna WT and Lmna KO mice expressing the cGAS-tdTomato transgene (cGAS+) or non-expressing littermates (cGAS–). The latter served as control for potential autofluorescence. Analysis performed for whole fiber (left) and by classification of nuclei located at the MTJ or fiber body (right). Data based on n individual myofibers per genotype, isolated from 5 animals each. Significance determined by one-way ANOVA or two-way ANOVA (genotype; MTJ/body) using Tukey’s correction for multiple comparisons. All bar plots show mean value ± standard error of the mean.
Nuclear damage is intrinsic to lamin A/C-deficient nuclei
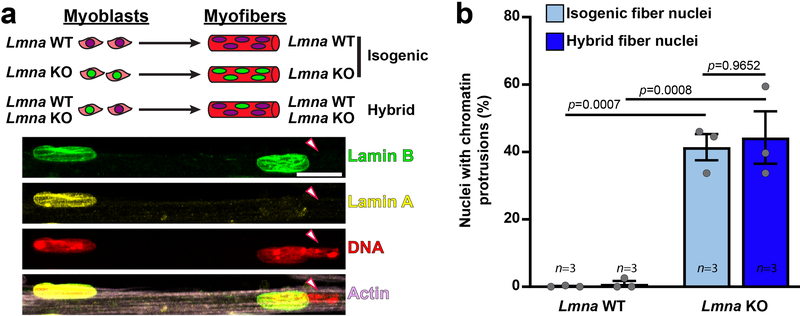
To address whether the observed NE defects are nucleus-intrinsic or arise from other changes in the Lmna mutant cells, we generated “hybrid” myofibers containing both wild-type and Lmna KO nuclei (Extended Data Figure 2a) by combining Lmna KO and wild-type myoblasts prior to differentiation. Hybrid myofibers containing ~20% of Lmna KO nuclei appeared healthy. Nonetheless, Lmna KO nuclei within the hybrid myofibers showed the same relative frequency of chromatin protrusions as nuclei from isogenic Lmna KO myofibers (Extended Data Figure 2b). Wild-type nuclei were not adversely affected in the hybrid myofibers. These results indicate that defects in nuclear structure are intrinsic to the Lmna mutant myonuclei and not due to altered cytoplasmic signaling or changes in the cytoplasmic architecture in Lmna mutant muscle fibers.
Lmna mutant myofibers exhibit extensive NE rupture
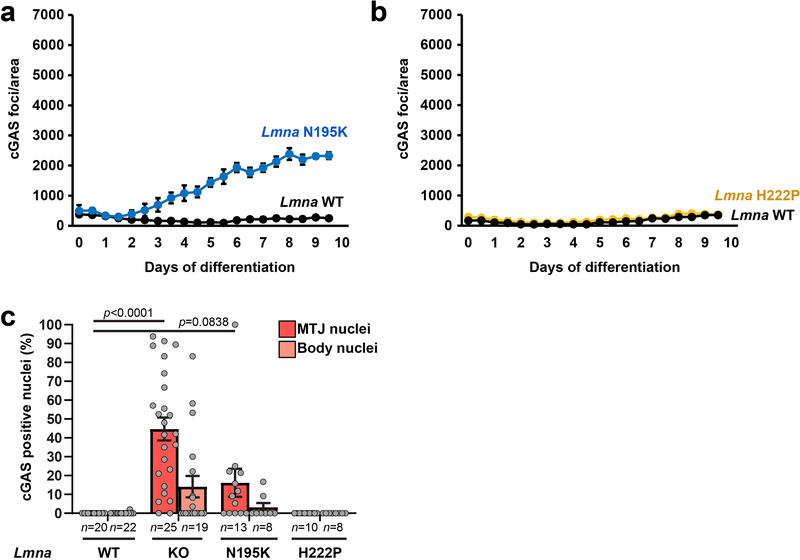
To examine whether reduced nuclear stability leads to increased NE rupture, we modified myoblasts to co-express fluorescently labeled histones (H2B-tdTomato) and a NE rupture reporter, consisting of a green fluorescent protein with a nuclear localization signal (NLS-GFP)16. Lmna KO myotubes frequently exhibited NE rupture, indicated by transient loss of nuclear NLS-GFP (Supplementary Figure 6, Supplementary Movie 7). Experiments using a second NE rupture reporter, cGAS-mCherry, which accumulates at the rupture site and persists after NE repair16, 17, confirmed a progressive increase in NE rupture in Lmna KO myotubes during differentiation that was rescued by re-introduction of wild-type lamin A (Figure 3e,f). Lmna N195K cells showed intermediate levels of NE rupture, whereas cGAS-mCherry accumulation in Lmna H222P myotubes was indistinguishable from wild-type controls (Extended Data Figure 3a,b).
To validate these results in vivo, we generated transgenic mice expressing a fluorescent cGAS-tdTomato NE rupture reporter and crossed these mice into the Lmna mutant mouse models. Muscle fibers from Lmna KO and Lmna N195K mice expressing the cGAS-tdTomato reporter (cGAS+) revealed a large fraction of myonuclei with cGAS-tdTomato foci, which were absent in both cGAS+ wild-type littermates and in cGAS– Lmna KO muscle fibers (Figure 3d–e; Extended Data. Figure 3c). The frequency of NE rupture was increased at the MTJ compared to the muscle fiber body (Figure 3e; Extended Data Figure 3; Supplementary Figure 7), paralleling the increased chromatin protrusions at the MTJs. cGAS-tdTomato accumulation in the different mouse models correlated with disease severity (Extended Data Figure 3c). As an independent measure of nuclear envelope integrity, we analyzed nuclear localization of heat shock protein 90 (Hsp90), which is normally excluded from the nucleus18. Whereas Hsp90 was mostly cytoplasmic in wild-type myofibers, Lmna mutant models had increased nuclear Hsp90 accumulation (Supplementary Figure 8a–d).
Lmna KO myonuclei have increased levels of DNA damage
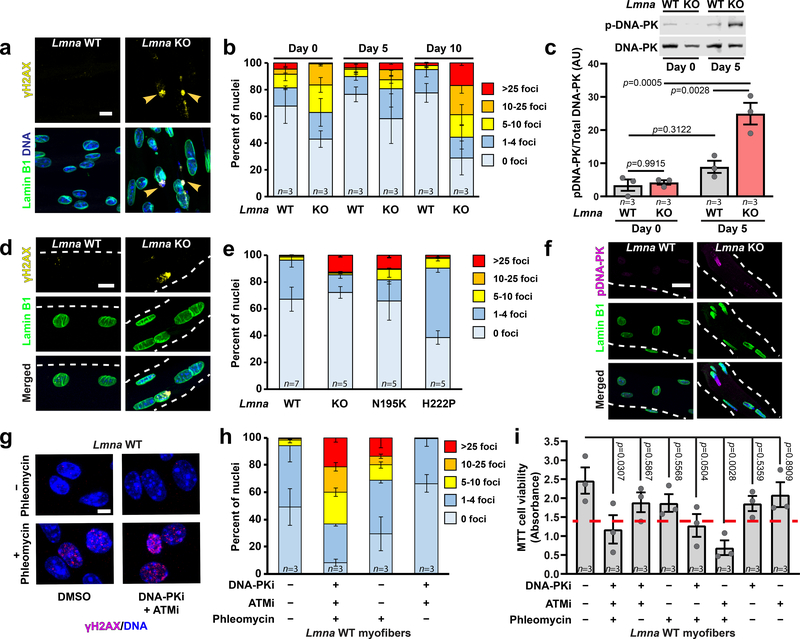
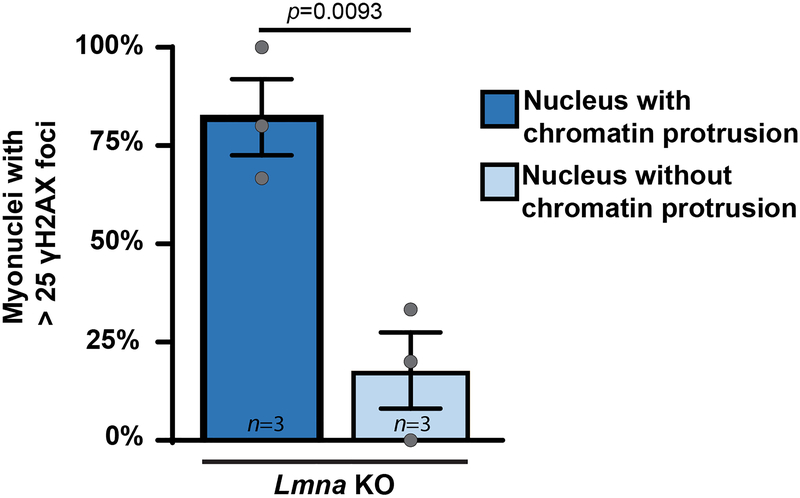
Nuclear deformation and NE rupture can cause DNA damage in migrating cells16, 17, 19. Quantifying DNA damage in differentiating myoblasts by staining for γH2AX revealed elevated levels of DNA damage at the onset of differentiation (Figure 4a,b), consistent with previous reports20, 21. However, while DNA damage in wild-type cells returned to baseline, the fraction of Lmna KO cells with severe DNA damage continued to increase with differentiation (Figure 4b). In addition, Lmna KO myotubes exhibited increased activity of the DNA-dependent protein kinase (DNA-PK) (Figure 4c). Muscle fibers isolated from Lmna KO mice confirmed increased γH2AX accumulation and increased DNA-PK activity, especially at the MTJ (Figure 4d–f, Supplementary Figure 9). Of the myonuclei with extensive γH2AX staining, >80% had chromatin protrusions, suggesting a link between NE damage and DNA damage (Extended Data Figure 4). Muscle fibers from Lmna N195K mice fibers had similar levels of DNA damage as Lmna KO mice, whereas DNA damage was less severe in the Lmna H222P animals (Figure 4d,e), correlating with disease severity.
Figure 4. Lmna KO myonuclei have increased DNA damage in vitro and in vivo.
(a) Representative images of γH2AX foci in Lmna KO myonuclei. Arrowheads indicated γH2AX foci in chromatin protrusions. Scale bar: 10 μm. (b) Quantification of DNA damage based on the number of γH2AX foci per nucleus, for n independent primary cell lines per genotype. (c) Quantification of DNA-PK activity in Lmna WT and Lmna KO myotubes at day 5 of differentiation by probing for phosphorylated DNA-PK (pS2053), based on lysates from n independent cell lines. Significance determined by two-way ANOVA (genotype; time-point), using Tukey’s correction for multiple comparisons. (d) Representative images of γH2AX foci in isolated single muscle fibers from Lmna WT and Lmna KO mice. Scale bar: 10 μm. (e) Extent of DNA damage based on the number of γH2AX foci per nucleus in isolated single fibers. n indicates number of mice per genotype, with 5 fibers imaged per animal. (f) Representative image of phosphorylated DNA-PK (pS2053) in isolated muscle fibers from Lmna WT and Lmna KO mice. Scale bar: 20 μm. (g) Representative image of γH2AX foci following treatment with phleomycin, with or without DNA-PK and ATM inhibition. Scale bar: 10 μm. (h) Quantification of DNA damage based on the number of γH2AX foci per nucleus for Lmna WT cells treated with phleomycin, with or without DNA-PK and ATM inhibition. n = 3 independent experiments per condition. (i) Quantification of viability in Lmna WT myofibers using MTT assay following DNA damage induction with phleomycin, with and without concurrent treatment with DNA-PK (NU7441) and/or ATM (KU55933) inhibition, based on n independent experiments per condition. Significance determine by one-way ANOVA, using Tukey’s correction for multiple comparisons. Dashed red line indicates the corresponding results for the Lmna KO untreated control. All bar plots show mean value ± standard error of the mean.
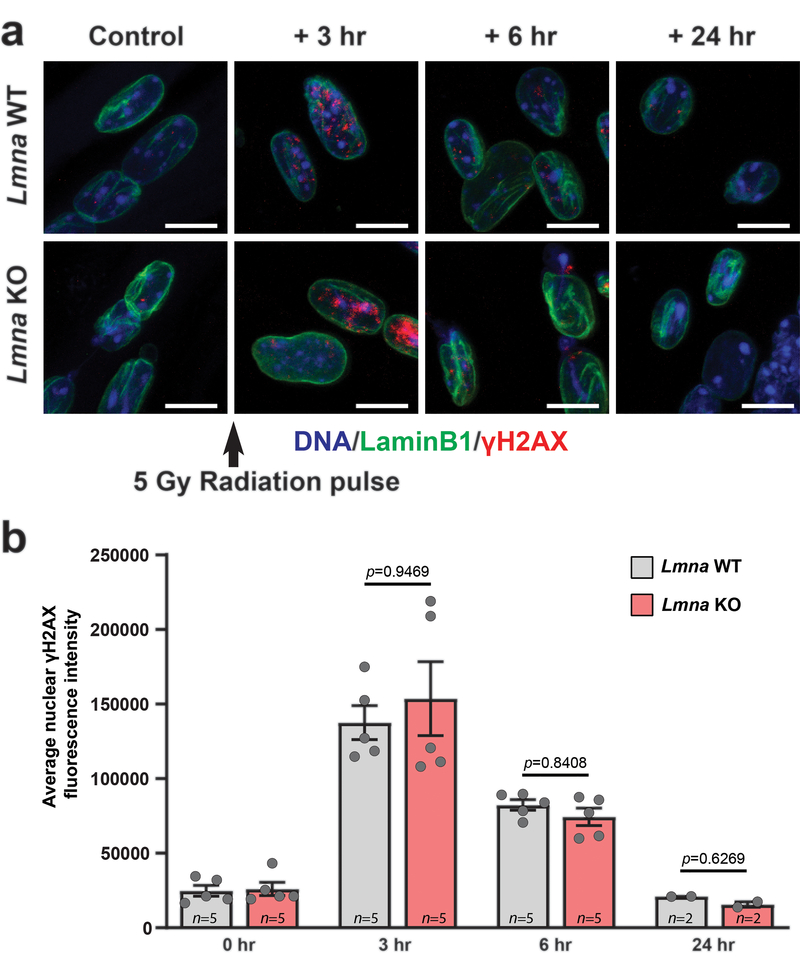
To address whether the accumulation of DNA damage during in vitro differentiation of Lmna KO myoblasts was caused by new nuclear damage or defects in DNA damage repair22, 23, we subjected Lmna KO and wild-type myofibers to gamma irradiation and monitored changes in γH2AX levels for 24 hours post-treatment. Lmna KO myofibers displayed a DNA damage repair profile nearly identical to wild-type controls (Extended Data Figure 5), suggesting that their ability to repair DNA damage is not significantly impaired.
Accumulation of DNA damage correlates with myofiber death
To test whether accumulation of DNA damage is sufficient to decrease myofiber viability, we treated Lmna KO and wild-type myofibers with phleomycin, a radiation mimetic agent, in conjuction with inhibition of DNA damage repair by treatment with NU7441, a DNA-PK-specific inhibitor, and/or KU55933, an ATM-specific inhibitor (Figure 4g). The combined treatment led to accumulation of DNA damage and reduced viability in wild-type myofibers, comparable to that observed in untreated Lmna KO cells (Figure 4h,i; Supplementary Figure 10). In contrast, phleomycin, alone or in combination with the inhibition of DNA damage repair, did not further reduce viability in Lmna KO myofibers (Supplementary Figure 10), suggesting that the preexisting DNA damage in these cells is sufficient to cause myofiber decline.
Microtubule stabilization reduces Lmna KO nuclear damage
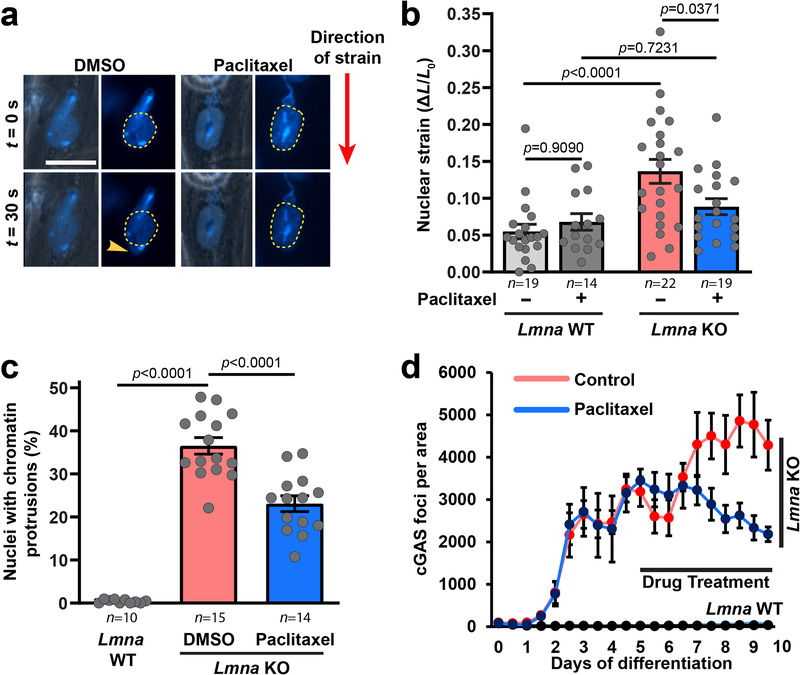
In striated muscle cells, the microtubule network forms a cage-like structure around the nucleus (Supplementary Figure 11)24, 25. To test if stabilizing this microtubule network, and thereby reinforcing myonuclei, could reduce NE damage, we treated in vitro differentiated Lmna KO myoblasts with the microtubule stabilizing drug paclitaxel. Paclitaxel treatment reduced deformation in Lmna KO myonuclei (Extended Data Figure 6a,b; Supplementary Movie 8) and lowered the percentage of nuclei with chromatin protrusions and NE rupture (Extended Data Figure 6c,d), suggesting that nuclear damage arises from mechanical stress on the myonuclei.
Nuclear movement causes NE damage in Lmna KO myotubes
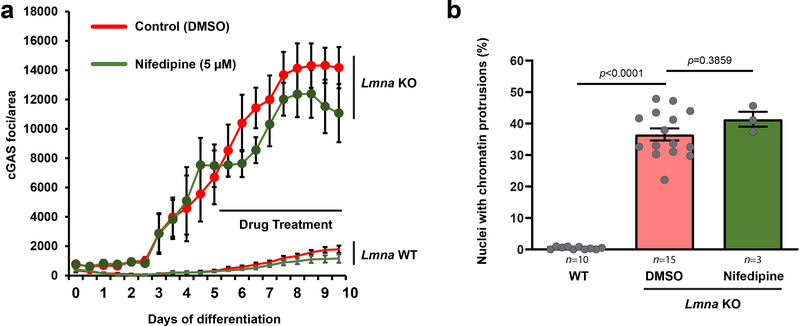
Mechanical stress may be imparted to myonuclei via actomyosin-mediated contractile forces, and/or forces due to nuclear movement during myoblast fusion, microtubule-driven spacing, and shuttling/anchoring to the myofiber periphery24, 26, 27. To determine if NE damage in myotubes was caused by actomyosin contractility, we treated Lmna KO and wild-type myotubes with nifedipine, a muscle-specific calcium channel blocker. Nifedipine treatment abrogated myotube contraction, but did not reduce chromatin protrusions and NE ruptures in Lmna KO myonuclei (Extended Data Figure 7), indicating that actomyosin contractility is not required to induce NE damage.
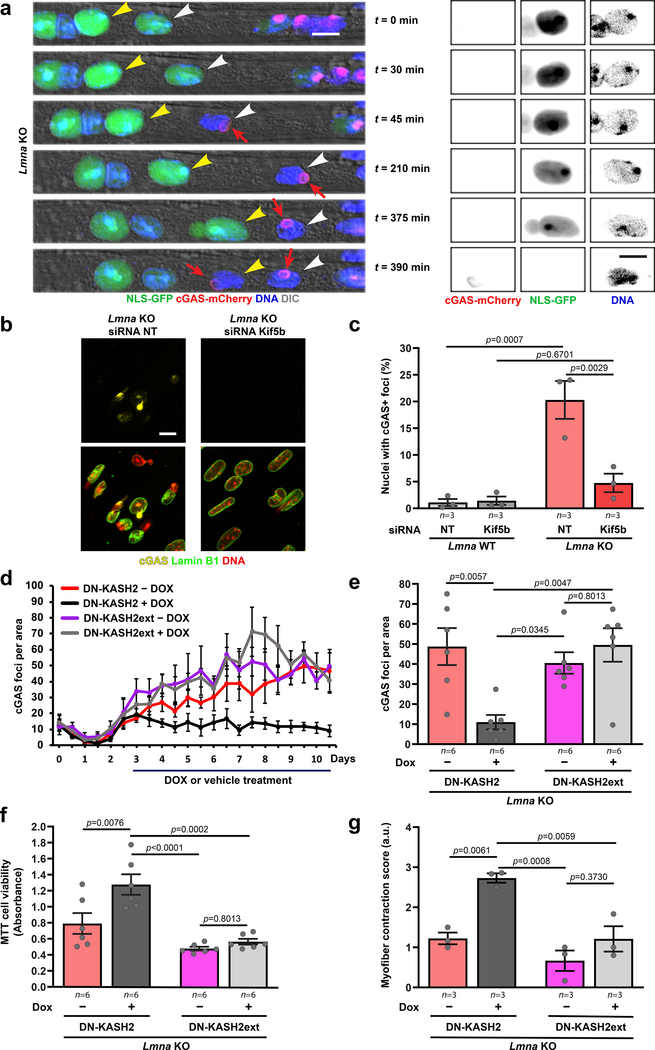
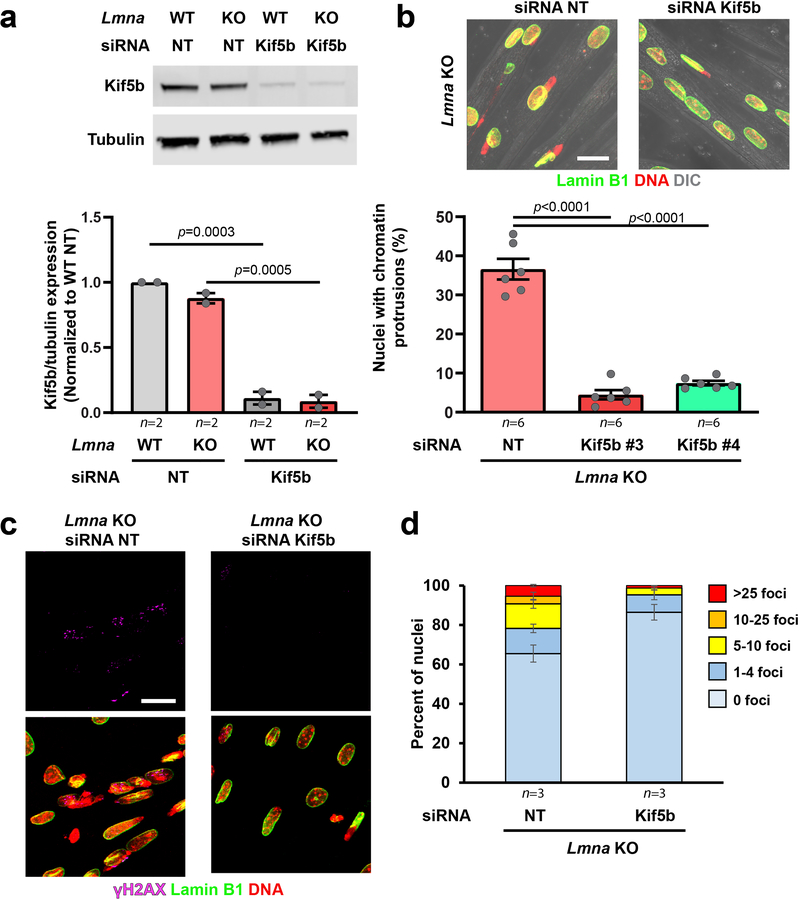
Since NE rupture (Figure 3f) and chromatin protrusions coincided with myotube maturation (Supplementary Figure 12) and myonuclear migration (Figure 5a; Supplementary Movie 9), we sought to determine if we could prevent NE damage by depletion of Kif5b, a subunit of kinesin-1 required for nuclear migration in myotubes24, 26, 27. Kif5b depletion nearly abolished chromatin protrusions, NE rupture, and severe DNA damage in the Lmna KO myotubes (Figure 5b,c; Extended Data Figure 8), indicating that nuclear movement by microtubule-associated motors is sufficient to cause nuclear damage in Lmna mutant myofibers, and that eliminating NE rupture reduces DNA damage in these cells.
Figure 5. Reducing forces on myonuclei prevents NE rupture and improves viability and contractility in Lmna KO myotubes.
(a) Representative time-lapse sequence of NE rupture during nuclear migration in Lmna KO myonuclei (day five of differentiation). Arrowheads mark two nuclei that undergo NE rupture, visible by transient loss of NLS-GFP from the nucleus and stable accumulation of cGAS-mCherry at the site of rupture (red arrow). Right, close-ups of the nucleus marked with the yellow arrowheads. Scale bar: 10μm for all images. (b) Representative images of cGAS-mCherry accumulation in Lmna KO cells treated with either non-target control siRNA (siRNA NT) or siRNA against Kif5b. Scale bar: 20 μm (c) Percentage of Lmna KO myonuclei positive for cGAS-mCherry foci, following treatment with either non-target (NT) siRNA or siRNA against Kif5b, based on n independent experiments, in which a total of 911–1383 nuclei per condition were quantified. Significance determined by two-way ANOVA (genotype; siRNA treatment), using Tukey’s correction for multiple comparisons. (d) Number of cGAS-mCherry foci/area in Lmna KO expressing either DN-KASH2 or DN-KASH2ext, treated with or without doxycycline (DOX) from day 3 until day 10 of differentiation, based on three independent experiments per condition. (e) Number of cGAS-mCherry foci/area at 10 days of differentiation, based on n independent experiments per condition. Significance determined by two-way ANOVA (genotype; DOX treatment), using Tukey’s correction for multiple comparisons. (f) Cell viability measured by MTT assay in Lmna KO cells expressing either DN-KASH2 or DN-KASH2ext. Data for n replicates per condition, from three independent experiments. Significance was determined by two-way ANOVA (genotype; DOX treatment), using Tukey’s correction for multiple comparisons. (g) Contractility of Lmna KO myofibers expressing either DN-KASH or DN-KASHext, based on n independent experiments, for which scores were determined based on 5–6 image sequences per condition. Significance was determined by two-way ANOVA (genotype; DOX treatment), using Tukey’s correction for multiple comparisons. All bar plots show mean value ± standard error of the mean.
LINC complex disruption improves Lmna KO myofiber function
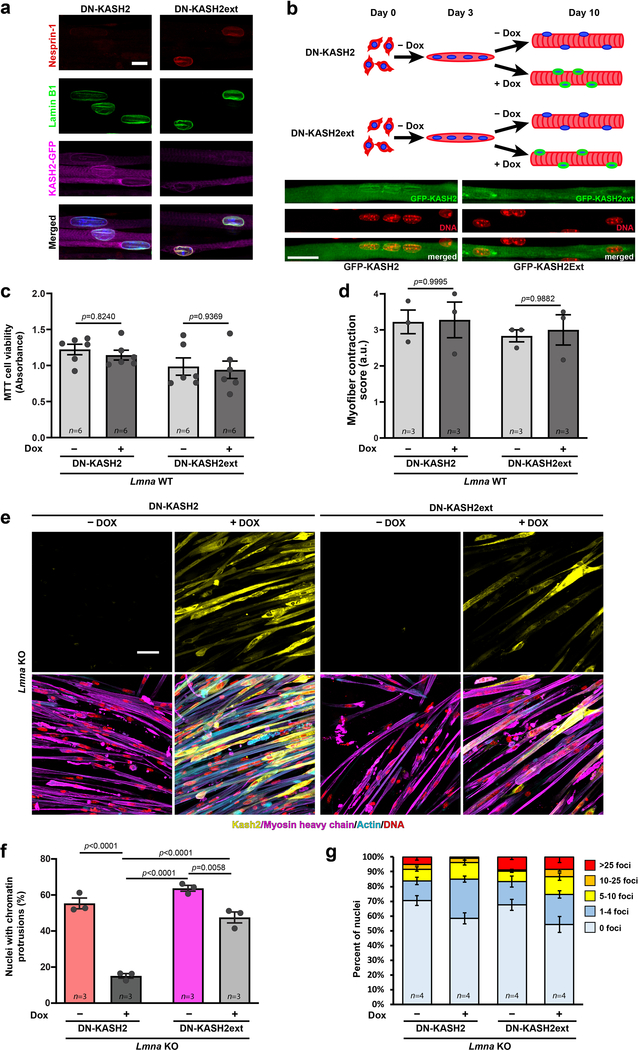
We hypothesized that reducing cytoskeletal forces on the myonuclei would improve myofiber health. Since depletion of Kif5b has detrimental long-term effects on myofiber function25, we disrupted the LINC complex through inducible expression of a dominant negative GFP-KASH2 (DN-KASH) protein28 (Extended Data Figure 9a,b). A construct containing a two amino acid extension (DN-KASHext) that targets to the NE but does not disrupt the LINC complex28 served as control (Extended Data Figure 9a). As expected, expression of DN-KASH, but not DN-KASHext, reduced nuclear migration (Extended Data Figure 9b). While DN-KASH expression had no effect on contractility or viability in Lmna WT myofibers, in Lmna KO cells it reduced chromatin protrusions, NE ruptures, and the number of cells with severe DNA damage, and improved cell viability and contractility (Figure 5d–h, Extended Data Figure 9c–g; Supplementary Movies 10–17). These findings support the model that mechanical forces induce NE rupture and DNA damage in Lmna mutant myofibers, leading to myofiber dysfunction and death.
Human laminopathy muscle biopsies have increased DNA damage
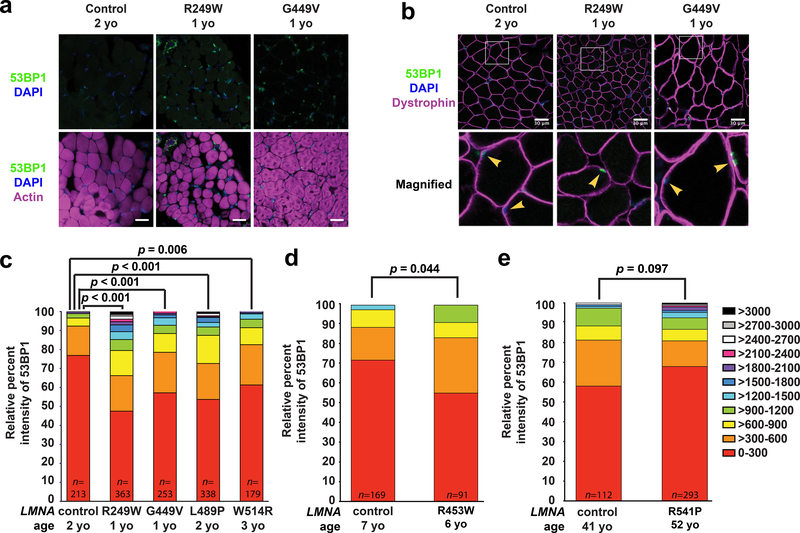
To corroborate our findings in the mouse models, we examined skeletal muscle biopsy samples from humans with LMNA-related muscular dystrophies and age-matched controls (Supplementary Table 1). Muscle cryosections were immunofluorescently labeled for 53BP1, an established marker for DNA double strand breaks29, and myofiber nuclei were identified based on labeling for DNA, actin, and dystrophin (Figure 6a,b, Supplementary Figure 13). Intriguingly, tissues from individuals with the most severe forms of the muscular dystrophy, i.e., those with early childhood and juvenile onsets, had increased DNA damage compared to age-matched controls (Figure 6c–e), closely mirroring the findings in the severe laminopathy mouse models (Figure 4e).
Figure 6. Human muscle biopsy tissues from individuals with LMNA muscular dystrophy have increased DNA damage.
Cryopreserved human muscle biopsy tissues from individuals with LMNA muscular dystrophy and age-matched controls were stained for either (a) 53BP1, DAPI, and phalloidin or (b) 53BP1, DAPI, and dystrophin. Arrowheads denote nuclei within muscle fibers, identified by dystrophin labeling of the muscle fiber membrane. Each muscular dystrophy patient possesses a LMNA point mutation producing a single amino acid substitution (Supplementary Table 1). The LMNA mutations cause reduced fiber size, abnormally shaped fibers, and increased nuclear 53BP1 staining. Scale bar: 30 μm. (c-e) Patients were stratified based on the age at time of tissue collection. The nuclear intensity values of 53BP1 were binned into 11 categories based on the level of intensity (color coding on the right). The X-axis shows the mutant lamin A/C expressed in individuals with an LMNA mutation and the age-matched control samples expressing wild-type lamin A/C. The Y-axis represents the relative percent intensity of 53BP1 staining quantified using ImageJ. The intensity values did not meet the criteria for a normal distribution. For panel (c) a two-sided Kruskal-Wallis one-way analysis of variance (ANOVA), followed by the two-sided Dunn post hoc test, were used to determine if there was a significant difference in staining among the genotypes. For panels (d) and (e) a two-sided Mann-Whitney non-parametric test was used for comparisons. n indicates the number of nuclei scored per patient. All bar plots show mean value ± standard error of the mean.
DISCUSSION
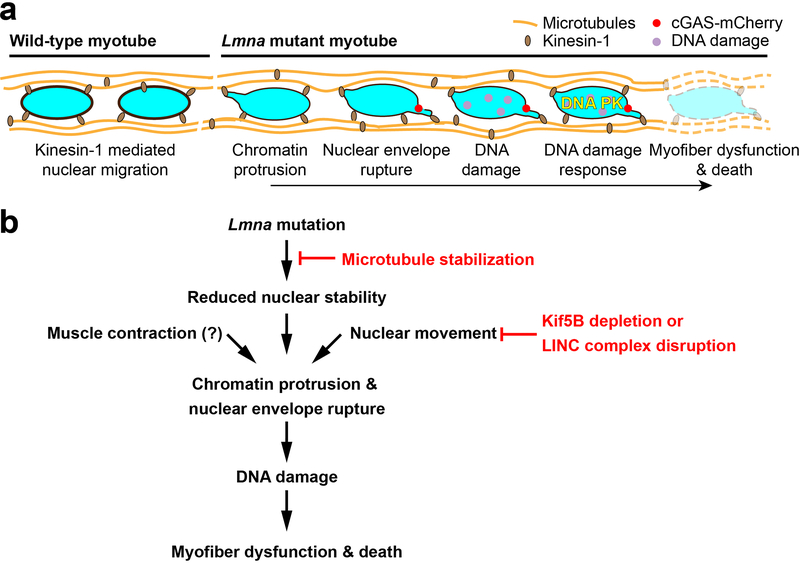
The mechanisms by which LMNA mutations result in muscle-specific diseases have long puzzled researchers and clinicians, presenting a major hurdle in the development of effective treatments. Our data revealed a striking correlation between NE defects and DNA damage in myonuclei and disease severity in three mouse models of striated muscle laminopathies. Muscle biopsy tissue from individuals with LMNA muscular dystrophies showed a similar trend, with the most severe cases of muscular dystrophy having the highest levels of DNA damage. Our data are consistent with previous reports of NE damage in laminopathic skeletal and cardiac muscle, and tendons9, 30–37. We now link these findings to a mechanism that may explain the muscle-specific defects in many laminopathies: cytoskeletal forces cause chromatin protrusions and NE ruptures in mechanically weakened Lmna mutant muscle cell nuclei, triggering DNA damage and DNA damage response activation, which then leads to myofiber dysfunction and death (Extended Data Figure 10). Other mechanisms, which may be mutation specific, likely add to the pathogenesis of laminopathies.
Increased DNA damage and altered DNA damage repair have been reported previously in progeroid laminopathies22, 23, 38, but not AD-EDMD and LMNA-CMD. The precise mechanisms by which NE rupture causes DNA damage and cell death remain to be elucidated. The DNA damage could arise from exposure of genomic DNA to cytoplasmic nucleases and/or nuclear exclusion and efflux of DNA repair factors39, 40. Our findings strongly indicate that DNA damage is linked to mechanically induced NE defects. Although we observed similar DNA damage repair dynamics between irradiated Lmna KO and wild-type myofibers, different types of DNA damage can elicit distinct repair responses in muscle cells41. Thus, Lmna mutant cells may experience impaired DNA damage repair23. In addition, decreased DNA repair efficiency over the course of differentiation42 may exacerbate the DNA damage in Lmna mutant myofibers.
DNA damage results in rapid activation of DNA damage response pathways, including DNA-PK and ATM, leading to the stabilization of p53 that can induce cell cycle arrest, senescence, and apoptosis.43 Increased activity of DNA-PK is associated with age-related decline of metabolic, mitochondrial, and physical fitness of skeletal muscle cells18. Furthermore, deletion of p53 improved cardiac defects and, to lesser degree, survival in a cardiac-specific laminopathy mouse model38. Consistent with DNA damage-induced p53 signaling, we observed caspase-3 activation and reduced viability in Lmna KO and N195K myofibers. While the mechanisms controlling apoptosis in a post-mitotic tissue such as skeletal muscle are unclear44, this type of cell death has been observed in myofiber wasting45 and hearts of Lmna mutant mice38, 46, 47.
Although we cannot exclude the possibility that altered cytoplasmic signaling and gene regulation contribute to the increased NE rupture and DNA damage in Lmna mutant muscle cells23, 38, our data suggest that the damage is mechanically induced and nucleus-intrinsic. Surprisingly, we found that nuclear damage during in vitro myofiber differentiation was associated with microtubule-associated movements and not actomyosin contractions. Nonetheless, mature muscle cells in vivo can generate substantially higher contractile forces than in vitro differentiated cells; thus, actomyosin contractility is likely to contribute to NE rupture and DNA damage in skeletal and cardiac tissues37. In addition, LMNA mutations could disrupt perinuclear cytoskeletal organization, including desmin34 and microtubule networks, thereby further destabilizing myonuclei and promoting mechanical NE damage.
Our findings indicate potential targets for disease intervention. Paclitaxel was recently reported to improve cardiac conduction defects in Lmna H222P mice by restoring connexin 43 localization48. Here, we identified an additional mechanism by which microtubule stabilization can mitigate damage in striated muscle laminopathies. Cell signaling pathways activated by DNA damage, such as DNA-PK18 and p5338, may provide additional targets to ameliorate muscle wasting. In addition, disruption of the LINC complex may offer a specific approach to reduce mechanical stress on myonuclei and improve muscle function.
Insights gained from this work are also relevant to other biological systems in which nuclei are exposed to physical stress, such as in confined migration and nuclear movement in polarized epithelial or neuronal cells49. For example, neuronal cells lacking lamin A/C50 or B-type lamins51 may be more susceptible to kinesin-mediated nuclear damage, leading to neurodevelopmental defects. Taken together, these findings highlight a mechanism by which weakened myonuclei experience microtubule-mediated NE damage, leading to DNA damage and muscle dysfunction, potentially explaining the phenotypes seen in striated muscle laminopathies and a spectrum of other diseases caused by NE defects.
METHODS
Animals
Lmna KO (Lmna–/–)9, Lmna N195K (LmnaN195K/N195K)10, and Lmna H222P (LmnaH222P/H222P)11 have been described previously. Lmna+/–, LmnaH222P/+, and LmnaN195K/+ mice were backcrossed at least seven generations into a C57-BL/6 line. For each mouse model, heterozygous mice were crossed to obtain homozygous mutants, heterozygous mice, and wild-type littermates. Lmna mutant mice were provided with gel diet (Nutri-Gel Diet, BioServe) supplement to improve hydration and metabolism upon onset of phenotypic decline. Dmdmdx mice have been described previously52; mice were obtained from the Jackson Laboratory in a C57BL background and hemi- or homozygous animals were bred to produce all hemi- and homozygous offspring. Data from wild-type littermate controls for Lmna KO, Lmna N195K and Lmna H222P showed no differences in experimental outcomes amongst them; therefore, data from wild-type littermates was combined into a single group, unless otherwise specified. For both in vivo and in vitro studies, cells and or tissues were isolated from a single mouse and counted as a single replicate. All data are based on at least two independently derived primary cell lines for each genotype. All experiments, including breeding, maintenance, and euthanasia of animals, were performed in accordance with relevant guidelines and ethical regulations approved by the Cornell University Institutional Animal Care and Use Committee (IACUC), protocols 2011–0099 and 2012–0115.
NE rupture reporter mouse (cGAS/MB21D1-tdTom transgenic mouse)
To detect NE ruptures in vivo, we generated a transgenic mouse expressing FLAG tagged human cGASE225A/D227A fused to a tdTomato fluorescent protein (cGAS-tdTomato) under the control of the commonly used constitutive active CMV promoter. The cGAS mutations are in the magnesium-binding domain, abolishing the enzymatic activity and downstream production of interferon, while still retaining the ability to bind to genomic DNA. The mammalian expression cassette including promoter and terminator (CMV-3xFLAG-cGASE225A/D227A-tdTomato-SV40polyA) was released from the expression vector, removing the prokaryotic domains. The purified linear DNA was then injected into the pronucleus of fertilized embryos collected from super-ovulated C57BL/6 mice and transplanted into pseudo-pregnant recipients. The resulting transgenic mouse model was used to cross into the Lmna KO background to generate 3×FLAG-cGASE225A/D227A-tdTomato positive Lmna KO mice within two generations.
Myoblast isolation
Cells were harvested from Lmna KO, Lmna N195K, Lmna H222P, and wild-type littermates between 3–5 weeks for Lmna KO mice, 4–6 weeks for Lmna N195K, and 4–10 weeks for Lmna H222P mice using a protocol adapted from9. With the exception of the Lmna KO myoblasts, these time-points were prior to the onset of disease phenotypes. Myoblasts from wild-type littermates were harvested at the same time. Muscles of the lower hindlimb were isolated, cleaned of fat, nerve and excess fascia, and kept in HBSS on ice until all mice were harvested. The muscles were digested in 4 ml:1 g of tissue wet weight in a solution of 0.5% Collagenase II (Worthington Biochemicals), 1.2 U/ml Dispase (Worthington Biochemicals), 1.25 mM CaCl2 (Sigma) in HBSS/25 mM HEPES buffer. Digestion was carried out in a 37˚C water bath for a total time of 60 minutes. At 20 minutes intervals, digestion cocktails were removed and triturated 40 times with a 5 ml pipet. In the case of difficult to digest tissues, an extra 25% of 1% Collagenase II was added to the digestion after 40 minutes.
When tissues were fully digested, the reaction was quenched using equal volumes of DMEM supplemented with 10% fetal bovine serum (FBS) and 1% P/S (D10 media, Gibco). The cell suspension was strained through 70 and 40 μm filters (Greiner Bioscience) sequentially to remove undigested myotube fragments and tendon. The cell suspension was centrifuged at 800 × g for 5 minutes and washed with 8 ml of D10 media for a total of four times. Cells were then resuspended in primary myoblast growth media (PMGM; Hams F-10 (Gibco) supplemented with 20% horse serum and 1% penicillin/streptomycin and 1 μl/ml basic fibroblast growth factor (GoldBio)) and plated onto a 2% gelatin coated T25 flask. Cells were allowed to sit undisturbed for 72 hours. Capitalizing on the fact that myoblasts adhere much more weakly than fibroblasts, cells were passaged using PBS (calcium- and magnesium-free) instead of trypsin to purify the myoblasts. Cells were washed for 2–3 minutes at room temperature using a volume of PBS sufficient to coat the bottom of the flask and dislodged using manual agitation. When necessary, a 0.000625% trypsin solution was used to aid in the myoblast removal. Myoblasts were resuspended in PMGM and re-plated onto gelatin coated flasks. This process was continued 3–4 times until pure myoblast cultures were achieved. Cells were maintained in culture on gelatin coated flasks with the media changed every other day. All experiments were carried out prior to passage 12. Each independent experiment was done on a different set of lamin mutant and wild-type littermates such that each independent experiment was sourced from a different animal to account for heterogeneity in phenotype.
Myoblast differentiation
Myoblasts were differentiated by modifying a published protocol7. Coverslips for differentiation were prepared by coating with CellTak (Corning) according to the manufacturer’s protocol and then coating with growth factor reduced Matrigel (Corning) diluted 1:100 with IMDM with Glutamax (Gibco). Pre-cooled pipette tips were used to avoid premature polymerization. Matrigel was allowed to polymerize at 37˚C for 1 hour and the excess solution was aspirated. Primary myoblasts were seeded at a density of 55,000 cells/cm2 in PMGM. Cells were allowed to attach for 24 hours before being switched to primary myoblast differentiation media (PMDM) composed of IMDM with Glutamax and 2% horse serum without antibiotics. This timepoint was considered day 0. One day after the onset of differentiation, a top coat of 1:3 Matrigel:IMDM was added to the cells and allowed to incubate for 1 hour at 37˚C. PMDM supplemented with 100 ng/ml agrin (R&D Systems) was added to the cells and henceforth replaced every second day. Cells were allowed to differentiate for a total of 0, 5, or 10 days.
Plasmids and generation of fluorescently labeled cell lines
Each of the mutant myoblast lines were stably modified with lentiviral vectors to express the nuclear rupture reporter NLS-GFP (pCDH-CMV-NLS-copGFP-EF1-blastiS) and cGAS-mCherry (pCDH-CMV-cGASE225A/D227A-mCherry2-EF1-blastiS). cGAS, a cytosolic DNA binding protein possessed the E225A/D227A amino acid substitutions that abolish enzyme activity and interferon production, but still bind DNA and serve as a NE rupture reporter16. For rescue experiments, Lmna KO cells were modified with human lamin A (pCDH-CMV-preLamin A-IRES-GFP-puro). To generate the DN-KASH and DN-KASHext constructs, GFP-KASH2 and GFP-KASH2ext were subcloned from previously published plasmids28 and inserted into an all-in-one doxycycline inducible backbone (pPB-tetO-GFP-KASH2-EIF1α-rtTA-IRES-Neo)53. Plasmids are available from Addgene at https://www.addgene.org/Jan_Lammerding/
Viral and Piggybac modification
Pseudoviral particles were produced as described previously16. In brief, 293-TN cells (System Biosciences, SBI) were co-transfected with the lentiviral-containing, packaging and envelope plasmids using PureFection (SBI), following manufactures protocol. Lentivirus-containing supernatants were collected at 48 hours and 72 hours after transfection, and filtered through a 0.45 μm filter. Cells to be transduced were seeded into 6-well plates so that they reached 50–60% confluency on the day of infection and transduced at most 2 consecutive days with the viral supernatant using the TransDux Max system (SBI). The viral solution was replaced with fresh culture medium, and cells were cultured for 72 hours before selection with 1 μg/mL of puromycin or 2 μg/mL blasticidin S for 2–5 days. After selection, cells were subcultured and maintained in their recommended medium without the continued use of selection agents. For PiggyBac modifications, myoblasts were transfected with 1.75 μg of the PiggyBac plasmid and 0.75 μg of a Hyperactive Transposase using the Lipofectamine 3000 reagent according to the manufacture’s guidelines.
Extended imaging using incubator microscope
Long term imaging was performed using an Incucyte imaging system, which allows for incubator imaging to minimize changes in humidity and CO2. The differentiating cells expressing combinations of NLS-GFP and cGAS-mCherry were imaged using the Incucyte dual color filter module from day 0 to day 10, every 30–60 minutes with a 20× objective. Resulting images were analyzed using the Incucyte software, which performs fluorescence background subtraction using a Top-hat method and subsequent thresholding. cGAS-mCherry cells were thresholded and then analyzed for increase in fluorescent foci over time to track the rate of increase in NE rupture or damage. NLS-GFP cells were used to investigate the frequency and presence of NE rupture. To verify the results obtained from the Incucyte, cells were fixed and stained with appropriate antibodies to evaluate DNA damage and NE rupture.
Isolation of single muscle fibers
Single muscle fibers were harvested using a protocol adapted from Vogler et al.54. Fibers were isolated from the hindlimb muscles of male and female Lmna KO and wild-type littermates at 5–6 weeks of age and Lmna N195K and wild-type littermates at 6–8 weeks of age. To compare pre- and post-phenotype onset, Lmna H222P and wild-type litter mates were harvested at 6–8 weeks of age and 23–25 weeks of age, respectively. Briefly, the extensor digitorum longus (EDL) and plantaris were isolated from the mouse and placed directly into a 1 ml solution of F10 media with 4,000 U/ml of Collagenase I (Worthington Biochemicals). The tissue was digested for 15–40 minutes depending on muscle size in a 37˚C water bath with agitation by inversion every 10 minutes. The reaction was quenched by transferring the digestion mixture to 4 ml of PMGM. Single fibers were hand-picked from the digested tissue using fire polished glass Pasteur pipettes coated with FBS. When necessary, the tissue was further dissociated by manual pipetting with a large-bore glass pipet. Fibers were washed once in fresh media prior to fixation with 4% paraformaldehyde (PFA) for 15 minutes at room temperature and then stained.
Pharmacological treatments
Myoblasts were differentiated using the standard protocol and treated with pharmacological treatments starting at day 5 of differentiation. For chromatin protrusion studies, paclitaxel was administered to differentiated myotubes in two 24-hour bursts at day 4 and day 6-post differentiation with a 24-hour recovery in between. Myotubes were then fixed in 4% PFA at day 7 and stained with anti-lamin B and DAPI in order to quantify the percentage of myonuclei with chromatin protrusions. For long term studies using the cGAS reporter, myotubes were treated with 10 nM of paclitaxel starting at day 5 and media was refreshed every day. To inhibit myotube contraction, cells were treated with 5 μM nifedipine starting on day 5 and media was refreshed every day. For DNA damage induction and inhibitor experiments, cells were treated with 20μg/ml of phleomycin for a two-hour pulse on day 3, 4, and 5 of differentiation. Concurrently, cells were treated with NU7441 (2 μM), KU55933 (2 μM) starting on day 2 through 10 of differentiation. For induction of DN-KASH2 and DN-KASH2ext, cells were treated with 1 μM doxycycline.
Biophysical assays
To evaluate nuclear deformability in high throughput, we designed and fabricated a microfluidic, micropipette aspiration device12. The mask and wafers were produced in the Cornell NanoScale Science and Technology Facility (CNF) using standard lithography techniques. PDMS molds of the devices were cast using Sylgard 184 (Dow Corning) and mounted on coverslips using a plasma cleaner as described previously16. Three port entrances were made using a 1.2 mm biopsy punch. Pressures at the inlet and outlet ports were set to 1.0 and 0.2 psi (relative to atmospheric pressure, Patm), respectively, using compressed air regulated by a MCFS-EZ pressure controller (Fluigent) to drive single cells through the device. Myoblasts (~5×10⁶ cells/mL suspended in 2 % bovine serum albumin (BSA), 0.2 % FBS and 10 μg/mL Hoechst 33342 DNA stain in PBS) were captured within an array of 18 pockets, and then forced to deform into 3 μm wide × 5 μm tall micropipettes. The selected pressures resulted in detectable nuclear deformations without causing significant damage to the cells (as evidence by lack of propidium iodide staining). The remaining port was set to Patm and outfitted with a handheld pipette to flush cells from the pockets at the start of each image acquisition sequence. Brightfield and fluorescence images were acquired every 5 seconds for a minimum of 60 seconds using an inverted microscope and 20×/NA 0.8 air objective. Nuclear protrusion length was calculated using a custom-written MATLAB program, made available upon request.
For perinuclear force application (‘microharpoon assay’), myoblasts were seeded in 35 mm glass bottom dishes and differentiated as previously described, except without the addition of a Matrigel top coat that allowed for access with a microneedle (‘microharpoon’). A Sutter P-97 micropipette puller was used to create microneedles from borosilicate glass rods (Sutter; OD: 1.0 mm, ID: 0.78, 10 cm length) with tip diameters of ≈1 μm. Day 4 myotubes (Lmna KO and wild-type) were treated for 24 hours with either 50 nM Paclitaxel or the corresponding 0.1% DMSO. The following day, “microharpoon assays” were performed as previously described8, 13, with slight modifications to the pull parameters to accommodate myotubes. The microharpoon was inserted ≈5–7 μm from the edge of the nucleus and pulled 15 μm at a rate of 1 μm/s. Pull direction was always along the long axis of the myofiber. Images were acquired at 40× (+1.6×) every 5 seconds. Nuclear strain and centroid displacement were calculated using a custom-written MATLAB program, made available upon request.
siRNA treatment
siRNAs used were as follows: Kif5b#3 (target sequence 5′-CAGCAAGAAGTAGACCGGATA-3′; Qiagen SI00176050), Kif5b#4 (target sequence 5′-CACGAGCTCACGGTTATGCAA-3′; Qiagen SI00176057), and non-target (NT) negative control (ON-TARGETplus non-targeting pool, Dharmachon, D-001810–10). Myoblasts were seeded at a density of ~15,000 cells per well in a 96-well glass bottomed dish containing a matrigel coating. Once adhered, the myoblasts were transfected twice, 48 hours apart, with siRNA for NT or Kif5b using Lipofectamine RNAiMAX at a concentration of 150 nM in PMGM. After 12 hours, the myoblasts were switched to PMDM and differentiated for 5 days.
Immunofluorescence staining of mouse cells and tissues
Cells were fixed in pre-warmed 4% PFA at the appropriate time point(s) and washed with PBS. Cells were blocked and permeabilized with a solution of 3% BSA, 0.1% Triton-X 100 and 0.1% Tween (Sigma) for 1 hour at room temperature. Cells were stained with primary antibodies diluted in blocking solution according to Supplementary Table 2 at 4˚C overnight. Samples were washed with PBS and incubated for 1 hour at room temperature with 1:250 dilution of AlexaFluor antibodies (Invitrogen) and 1:1000 DAPI (Sigma). Single muscle fibers were stained using the same procedure in Eppendorf tube baskets with an increase in blocking solution Triton-X concentration to 0.25%.
Human patient biopsy staining
Following diagnostic testing, muscle biopsies were stored at −80o C and subsequently utilized for research following protocols approved by the corresponding Internal Review Board (IRB), with informed consent from all participants. Cryopreserved human quadricep muscle biopsy tissue from LMNA muscular dystrophy individuals and age-matched controls were used for immunostaining as described previously55. An anti-rabbit polyclonal 53BP1 antibody (Novus) and anti-dystrophin mouse monocolonal antibody (Mab7A10, U of Iowa Hospitals and Clinics Pathology Core) were used at 1:1000 and 1:20 dilutions, respectively. Texas Red labeled phalloidin (Invitrogen) was used at 1:400 dilution. Secondary antibodies were a goat anti-rabbit Ig Alexa 488 conjugate (Invitrogen) and a goat anti-mouse IgG rhodamine Red-X conjugated (Molecular Probes), both used at 1:500 dilution. Slides were imaged on a Zeiss 710 confocal microscope (University of Iowa Central Microscopy Facility). The intensity of nuclear anti-53BP1 staining was quantified using ImageJ. Analysis of the human muscle samples was performed in a double-blinded manner. A pathologist generated the 10 μm thick cryo-sections and coded the samples, which were stained, imaged, and quantified prior to decoding by an independent researcher. The human muscle biopsy tissues were collected, processed, and analyzed according to all ethical regulations. The use of the human tissues for research purposes was approved by the University of Iowa Human Subjects Office IRB, protocol #200510769. All tissues used in this study were de-identified.
Western analysis
Cells were lysed in RIPA buffer containing protease (cOmplete EDTA-Free, Roche) and phosphatase (PhosSTOP, Roche) inhibitors. Protein was quantified using Bio-Rad Protein Assay Dye and 25–30 μg of protein lysate was separated using a 4–12% Bis-Tris polyacrylamide gel using standard a standard SDS-Page protocol. Protein was transferred to a polyvinylidene fluoride (PVDF) membrane overnight at 4˚C at a current of 40 mA. Membranes were blocked using 3% BSA in tris-buffered saline containing 0.1% Tween-20 and primary antibodies (Supplementary Table 2) were diluted in the same blocking solution and incubated overnight at 4˚C. Protein bands were detected using either IRDye 680LT or IRDye 800CW (LI-COR) secondary antibodies, imaged on an Odyssey® CLx imaging system (LI-COR) and analyzed in Image Studio Lite (LI-COR)
Imaging acquisition
Cells on coverslips and mounted single muscle fibers were imaged with an inverted Zeiss LSM700 confocal microscope. Z-stack were collected using 20× air (NA = 0.8), 40× water-immersion (NA = 1.2) and 63× oil-immersion (NA = 1.4) objectives. Airy units for all images were set between 1 and 1.5. Epi-fluorescence images were collected on a motorized inverted Zeiss Observer Z1 microscope equipped with CCD cameras (Photometrics CoolSNAP EZ or Photometrics CoolSNAP KINO) or a sCMOS camera (Hamamatsu Flash 4.0). H&E histology images were collected on an inverted Zeiss Observer Z1 microscope equipped with a color CCD camera (Edmund Optics, EO-0312C).
Image analysis
Image sequences were analyzed using ZEN (Zeiss), ImageJ, or MATLAB (Mathworks) using only linear adjustments uniformly applied to the entire image region. Region of interest intensities were extracted using ZEN or ImageJ. To quantify cleaved caspase-3 (i.e. active) area and myofiber health, maximum intensity protections were generated, which were then blinded to the observer. Cleaved caspase-3 area was calculated by thresholding of the caspase-3 and myosin heavy chain fluorescent signal and expressing the cleaved caspase-3 signal relative to the myosin heavy chain signal. Myofiber contractions were scored using a blinded analysis according to the scales provided in Extended Data Figure 1a. To count the number of DNA protrusions, and DNA damage foci, confocal image stacks were three-dimensionally reconstructed and displayed as maximum intensity projections. Protrusions lengths were both counted and measured by the presence of DAPI signal beyond the lamin B rim of the nucleus. Aspect ratio was quantified based on a thresholded lamin B rim to avoid the confounding factor of the DNA protrusions outside the body of the nucleus. Nuclear rupture was detected by an increase of the cytoplasmic NLS-GFP signal, or the localization of cGAS-mCherry to the nucleus. For better visualization of NLS-GFP cells many of the fluorescent single color image sequences were inverted. Graphs were generated in Excel (Microsoft), and figures were assembled in Illustrator (Adobe). DNA damage was determined by counting H2AX foci and then binned based on foci number. If damage was so severe that individual foci could not be counted, these nuclei were placed in the >25 foci category. For Hsp90 quantification, average nuclear Hsp90 fluorescence intensity was determined from a single mid-nucleus z-plane image and normalized to the cytoplasmic intensity at two points immediately adjacent to the nucleus.
MTT assay
Myoblasts, seeded in a 96-well plate and differentiated as previously described for 0, 5, or 10 days, were assayed for cell viability according to the manufacturer’s instructions (Promega, CellTiter 96 Non-Radioactive Cell Proliferation Assay). Fresh differentiation media was added two hours prior to the addition of 15 μL MTT 3-(4,5-dimethylthiazol-2-yl)-2,5-diphenyltetrazolium bromide dye. After incubation for 3 hours in MTT dye, 100 uL of Stop Solution was added to solubilize the formazan product (appears purple). Following overnight incubation at 37°C and 5% CO2, the absorbance of each well (measured at 590 nm) was analyzed using a microplate reader.
Gamma irradiation
A pulse of gamma-irradiation (5 Gy) was administered to myotubes differentiating (5 days) in a 96 well plate. Non-irradiated controls, along with treated cells following 3, 6, or 24 hours of recovery, were PFA-fixed and stained with anti-γH2AX, anti-lamin B and DAPI. A custom macro was used to quantify the mean integrated density of nuclear γH2AX signal from maximum intensity projections of confocal z-stacks.
Statistical analysis
Unless otherwise noted, all experimental results were taken from at least three independent experiments and in vivo data were taken from at least three animals. For data with normal distribution, we used either student’s t-tests (comparing two groups) or one-way ANOVA (for experiments with more than two groups) with post-hoc tests. When multiple comparisons were made, we adjusted the significance level using Bonferroni corrections. All tests were performed using GraphPad Prism. Micropipette aspiration data were natural log-transformed (Supplementary Figure 3) and analyzed by linear regression of the log-log data. In addition, data was analyzed with a multilevel model, in which the log-transformed protrusion length was the dependent variable in the model and the log-transformed time, genotype, and their interaction were treated as independent fixed effects. Variance from individual experiments and other effects were considered in the model as random effects. Post-hoc multiple comparisons test with Dunnett correction were performed to determine differences between Lmna mutant cells (Lmna KO, Lmna N195K, and Lmna H222P) and control cells (pooled wild-type). Analyses were carried out using JMP software. For human tissue samples, the intensity values did not meet the criteria for a normal distribution. Therefore, a two-sided Kruskal-Wallis one-way analysis of variance (ANOVA), followed by the two-sided Dunn post hoc test were used to determine if there was a significant difference in staining among the genotypes. For comparisons that involved one sample and one age-matched control, a two-sided Mann-Whitney non-parametric test was performed. Unless otherwise indicated, error bars represent the standard error of the mean (SEM). Data supporting the findings of this study are available from the corresponding author upon reasonable request.
Extended Data
Extended Data Fig. 1. Lmna KO and Lmna N195K have reduced contractility and experience nuclear loss.
(a) Quantification of myofiber contraction at day 10 of differentiation. Fibers were assigned contraction scores from 0 (worst) to 4 (best) based on the percentage of cells that were visually contracting. Data points indicate results from n independent primary cell lines for each genotype. Significance determined by one-way ANOVA, using Benjamini and Yecutieli (low power) multiple comparisons. (b) Quantification of the change in nuclear number between day 5 and day 10 of differentiation. Data points indicate results from n independent primary cell lines for each genotype. Significance determined by one-way ANOVA, using Tukey’s correction for multiple comparisons.
Extended Data Fig. 2. Nuclear defects are intrinsic to Lmna KO myonuclei.
(a) Top, schematic of the generation of hybrid myofibers containing nuclei from both Lmna WT and Lmna KO cell lines. Bottom, corresponding representative images. Final hybrid fibers contained ~80% Lmna WT nuclei and 20% Lmna KO nuclei. Arrowheads denote Lmna KO nucleus with a chromatin protrusion residing within the same myofiber as a Lmna WT nucleus. Experiments were conducted three independent times, with similar results. (b) Quantification of the number of chromatin protrusions from Lmna WT and Lmna KO nuclei contained within isogenic myofibers (control) or hybrid myofibers, typically containing 80% Lmna WT and 20% Lmna KO nuclei. Data points are for n independent experiments, in which 91–163 nuclei were quantified per experiment. Significance determined by two-way ANOVA (nuclear genotype vs. isogenic or hybrid myofiber), using Tukey’s correction for multiple comparisons. All bar plots show mean value ± standard error of the mean.
Extended Data Fig. 3. Nuclear envelope rupture is increased in Lmna N195K myofibers in vitro and in vivo.
Quantification of cGAS-mCherry nuclear envelope rupture reporter foci formation during myoblast differentiation in Lmna N195K (a), Lmna H222P (b), Lmna cells and wild-type littermate controls (Lmna WT). n = 3 independent experiments per genotype. (c) Quantification of the percentage of myonuclei positive for cGAS-tdTomato foci in isolated muscle fibers from Lmna WT, Lmna KO, Lmna N195K, and Lmna H222P mice expressing the cGAS-tdTomato transgene. Analysis performed for whole fiber (left) and by classification of nuclei located at the MTJ or within the body of the fiber (right). Data for Lmna WT and Lmna KO reproduced from Fig. 4E for comparison. Data based on n individual myofibers per genotype, isolated from 4–5 animals each.. All bar plots show mean value ± standard error of the mean.
Extended Data Fig. 4. Lmna KO myonuclei with the highest amount of γH2AX foci frequently display chromatin protrusions.
Analysis of DNA damage, assessed by γH2AX staining, in Lmna KO nuclei, comparing nuclei with chromatin protrusions to those without protrusions. Chromatin protrusions were assessed based on the presence of chromatin extending beyond the nuclear envelope, marked by lamin B-staining. Data based on n independent cell lines per genotype. Significance determined by two-tailed students t-test. All bar plots show mean value ± standard error of the mean.
Extended Data Fig. 5. Lmna KO myotubes have no defects in DNA damage repair.
(a) Representative images of γH2AX foci in Lmna WT and Lmna KO myotubes at 3, 6 and 24 hours following a 5 Gy dose with radiation or no irradiation control. (b) Quantification of γH2AX after 3, 6 and 24 hours post-irradiation or no irradiation control. Data based on n independent cell lines. Significance determined by two-way ANOVA (genotype; time point), using Tukey’s correction for multiple comparisons. All bar plots show mean value ± standard error of the mean.
Extended Data Fig. 6. Mechanical reinforcement of Lmna KO myonuclei by microtubule stabilization reduces nuclear damage.
(a) Representative image of nuclear deformation following microharpoon strain application in Lmna KO myotubes at day five of differentiation. Myotubes were treated for 24 hours with either paclitaxel or DMSO control. Yellow dotted line denotes the perimeter of the nucleus prior to strain application. Scale bar: 20μm. Similar results were obtained in >10 nuclei in at least three independent experiments (see panel b). (b) Quantification of nuclear strain in Lmna WT and Lmna KO myofibers using microharpoon assay following 24 hours of treatment with 50 nM paclitaxel or DMSO vehicle control. Data points are from n nuclei per genotype and condition from three independent experiments. Significance determined by two-way ANOVA (genotype; drug treatment), using Tukey’s correction for multiple comparisons. (c) Quantification of chromatin protrusions at day 7 of differentiation, following treatment with paclitaxel (50 nM) or DMSO starting at day 4 of differentiation. Data based on n independent experiments per condition. Significance determined by one-way ANOVA, using Tukey’s correction for multiple comparisons. (d) Quantification of cGAS-mCherry foci formation during 10 myofiber differentiation following treatment with paclitaxel (10 nM) or DMSO control, starting at day 5 of differentiation. Data based on n = 3 independent experiments. All bar plots show mean value ± standard error of the mean.
Extended Data Fig. 7. Inhibiting myofiber contractility does not prevent nuclear envelope rupture in Lmna KO myofibers.
(a) Quantification of cGAS-mCherry foci formation during 10 day myofiber differentiation follow treatment with nifedipine (5 μM), which inhibits contractility, or DMSO vehicle control, starting at day 5 of differentiation. Data based on three independent experiments. (b) Quantification of chromatin protrusions at day 7 of differentiation following treatment with nifedipine (10 μM) or DMSO, starting at day 4 of differentiation. Data points are from n images per genotype and condition, from three independent experiments. Significance determined by one-way ANOVA, using Tukey’s correction for multiple comparisons. All bar plots show mean value ± standard error of the mean.
Extended Data Fig. 8. Kif5b depletion in myotubes reduced chromatin protrusions and DNA damage in Lmna KO myonuclei.
(a) Western blot for Kif5b in myoblasts treated with a non-target control siRNA (siRNA NT) or siRNA against Kif5b. Data based on n independent experiments. (Bottom) Corresponding quantification. Significance determined by two-tailed students t-test within each genotype. (b) Representative images of Lmna KO myofibers at day 5 of differentiation treated with either a non-target control siRNA (siRNA NT) or siRNA against kinesin-1 (siRNA Kif5b) at day 0. Scale bar: 20 μm. Quantification of the number of chromatin protrusions at day 5 of differentiation in Lmna KO cells treated with non-target (NT) siRNA or depleted for Kif5b using two independent siRNAs (Kif5b #3 and Kif5b #4). Data based on n independent experiments, with 155–270 nuclei counted per experiment. Significance determined by one-way ANOVA, using Tukey’s correction for multiple comparisons. (c) Representative images of Lmna KO cells treated with either non-target (NT) siRNA or siRNA against Kif5b and immunofluorescently labeled for γH2AX, showing fewer chromatin protrusions and less DNA damage in the Kif5b depleted cells. Experiments were conducted three independent times, with similar results. Scale bar: 20 μm. (d) Quantification of the number of γH2AX foci in Lmna KO myonuclei following treatment with either non-target siRNA or siRNA against Kif5b. Data based on n independent experiments, in which 27–53 nuclei were counted per experiment. All bar plots show mean value ± standard error of the mean.
Extended Data Fig. 9. Expression of the DN-KASH2 construct disrupts the LINC complex and limits nuclear movement, without affecting myofiber function in Lmna WT myofibers.
(a) Representative image showing displacement of endogenous nesprin-1 in myofibers expressing the DN-KASH2 construct, and no displacement of nesprin-1 in myofibers expressing the DN-KASH2ext construct. Scale bar: 10 μm. (b) Representative image showing nuclear clustering in myofibers expressing the DN-KASH2 construct, and normal nuclear spreading in myofibers expressing the DN-KASH2ext construct. Scale bar: 20 μm. (c) Quantification of cell viability following DN-KASH2 or DN-KASH2ext treatment in Lmna WT cells using the MTT assay. Data based on n differentiation replicates per condition, from three independent experiments. Significance determined by two-way ANOVA (genotype; DOX treatment), using Tukey’s correction for multiple comparisons. (d) Quantification of myofiber contraction following DN-KASH2 or DN-KASH2ext treatment in Lmna WT cells based on the percent of contractile fibers. Data based on n independent experiments, for which scores were determined based on 5–6 image sequences per condition. Significance determined by two-way ANOVA (genotype x DOX treatment), using Tukey’s correction for multiple comparisons. (e) Representative images of Lmna KO expressing either DN-KASH2 or DN-KASH2ext, with or without 1 μM doxycycline (DOX), and immunofluorescently labeled for myosin heavy chain, actin, and DNA (DAPI) showing increased cell area and enhanced sarcomeric staining in the DOX treated cells expressing DN-KASH2. Scale bar: 50 μm. (f) Quantification of the number of chromatin protrusions in Lmna KO myonuclei expressing either DN-KASH2 or DN-KASH2ext. Data based on n independent experiments per condition. Significance determined by two-way ANOVA (genotype; DOX treatment), using Tukey’s correction for multiple comparisons. (g) Quantification of the extent of DNA damage based on the number of γH2AX foci per nucleus during myofiber differentiation. Lmna KO myonuclei expressing the DN-KASH2 construct show a decrease in the nuclei with severe DNA damage (>25 foci). Data based on n independent experiments per condition. All bar plots show mean value ± standard error of the mean.
Extended Data Fig. 10. Proposed mechanism by which Lmna mutations result in myofiber dysfunction and death.
Kinesin-1 motor proteins spread myonuclei along the myotubes axis during differentiation. In Lmna mutant cells, which have mechanically weaker nuclei, the localized forces associated with nuclear migration cause chromatin protrusion and NE ruptures. This mechanically induced nuclear damage results in DNA damage, detected by H2AX foci, and activation of DNA damage response pathways, which leads to decline in myofiber health and cell death. (b) Schematic flow chart delineating the steps described in panel a, along with interventions explored in this work. Stabilizing microtubules surrounding the myonuclei reinforces the Lmna mutant nuclei and prevents chromatin protrusions and NE ruptures. Inhibiting nuclear movement by Kif5b depletions similarly prevents nuclear damage. Muscle contractions may also contribute to nuclear damage in vivo.
Supplementary Material
Representative movie of spontaneous contractions in Lmna KO myofibers after 10 days of differentiation expressing the doxycycline inducible GFP-KASH2ext control. Doxycycline treated Lmna KO cells expressing GFP-KASH2ext.
Representative movie of spontaneous contractions in Lmna KO myofibers after 10 days of differentiation
Representative movie of spontaneous contractions in Lmna N195K myofibers after 10 days of differentiation
Representative movie of spontaneous contractions in Lmna H222P myofibers after 10 days of differentiation
Representative movie of micropipette aspiration of Lmna WT, Lmna KO Lmna N195K, and Lmna H222P myoblasts.
Representative movie of microharpoon manipulation of Lmna WT and Lmna KO myotubes after day 5 of differentiation.
Time-lapse of nuclear envelope rupture in Lmna KO myotubes after four days of differentiation. Note the loss of soluble NLS-GFP from the nucleus into the cytoplasm.
Representative movie of microharpoon manipulation of Lmna KO myotubes after day 5 of differentiation following 24 hours of treatment with either 50 nM paclitaxel or DMSO control.
Time-lapse of nuclear envelope rupture during myonuclear movement at 5 days of differentiation. Note the loss of NLS-GFP from the nucleus is immediately followed by the formation of cGAS-mCherry foci at the site of rupture.
Representative movie of spontaneous contractions in Lmna WT myofibers after 10 days of differentiation
Representative movie of spontaneous contractions in Lmna WT myofibers after 10 days of differentiation expressing a doxycycline inducible GFP-KASH2 to disrupt nucleo-cytoskeletal force transmission. Non-doxycycline treated control.
Representative movie of spontaneous contractions in Lmna WT myofibers after 10 days of differentiation expressing a doxycycline inducible GFP-KASH2 to disrupt nucleo-cytoskeletal force transmission. Doxycycline treated cells expressing GFP-KASH2.
Representative movie of spontaneous contractions in Lmna WT myofibers after 10 days of differentiation expressing the doxycycline inducible GFP-KASH2ext control. Non-doxycycline treated control.
Representative movie of spontaneous contractions in Lmna WT myofibers after 10 days of differentiation expressing the doxycycline inducible GFP-KASH2ext control. Doxycycline treated cells expressing GFP-KASH2ext.
Representative movie of spontaneous contractions in Lmna KO myofibers after 10 days of differentiation expressing a doxycycline inducible GFP-KASH2 to disrupt nucleo-cytoskeletal force transmission. Non-doxycycline treated Lmna KO control.
Representative movie of spontaneous contractions in Lmna KO myofibers after 10 days of differentiation expressing a doxycycline inducible GFP-KASH2 to disrupt nucleo-cytoskeletal force transmission. Doxycycline treated Lmna KO cells expressing GFP-KASH2.
Representative movie of spontaneous contractions in Lmna KO myofibers after 10 days of differentiation expressing the doxycycline inducible GFP-KASH2ext control. Non-doxycycline treated Lmna KO controls.
ACKNOWLEDGEMENTS
The authors thank Colin Stewart for providing the Lmna KO and Lmna N195K mouse models, Edgar Gomes for help with the in vitro myocyte differentiation protocol, Alexandra Corbin for in vivo and in vitro protrusion and cGAS analysis and in vivo Hsp90 localization analysis, Rebecca Mount for optimization of single fiber isolation and subsequent analysis, Daniel Huang for quantification of the Lmna N195K skeletal muscle fiber cross-sectional areas, Francoise Vermeylen, Stephen Parry and Lynn Johnson from the Cornell Statistical Consulting Unit, and Katherine Strednak and the Cornell Center for Animal Resources and Education (CARE) for help in maintaining the Lmna mutant mice. Clinical data from LMNA individuals was provided by Katherine D. Mathews, M.D. (Vice Chair for Clinical Investigation, Director, Muscular Dystrophy Clinic, Director, Iowa Neuromuscular Program, Professor of Pediatrics – Neurology and Professor of Neurology). Technical assistance with human muscle immunohistochemistry was provided by Nicholas M. Shaw and Margaret R. Ketterer (U. Iowa). This work was supported by awards from the National Institutes of Health (R01 HL082792 and U54 CA210184 to J.L), the Department of Defense Breast Cancer Research Program (Breakthrough Award BC150580 to J.L.), the National Science Foundation (CAREER Award CBET-1254846 and MCB-1715606 to J.L.), the Muscular Dystrophy Association (Development Award MDA603238 to T.J.K.; 477283 to L.L.W), a Fleming Postdoctoral Fellowship to T.J.K, National Science Foundation Graduate Research Fellowships (2013160437 to A.J.E.; 2014163403 to G.R.F.), Burroughs Welcome Fund Collaborative Research Travel Grant (1017502 to L.L.W.), the University of Iowa Wellstone Muscular Dystrophy Cooperative Research Center (U54, NS053672 to S.A.M), and generous gifts from the Mills family to J.L. This work was performed in part at the Cornell NanoScale Science & Technology Facility (CNF), a member of the National Nanotechnology Coordinated Infrastructure (NNCI), supported by the National Science Foundation (Grant NNCI-1542081).
Footnotes
COMPETING FINANCIAL INTERESTS
Nothing to declare.
DATA AND CODE AVAILABILITY
The data supporting the findings of this study are available from the corresponding authors upon reasonable request. MATLAB codes used for the microharpoon assay and micropipette aspiration analysis are available upon request.
REFERENCES
- 1.de Leeuw R, Gruenbaum Y & Medalia O Nuclear Lamins: Thin Filaments with Major Functions. Trends Cell Biol 28, 34–45 (2018). [DOI] [PubMed] [Google Scholar]
- 2.Davidson PM & Lammerding J Broken nuclei--lamins, nuclear mechanics, and disease. Trends Cell Biol 24, 247–256 (2014). [DOI] [PMC free article] [PubMed] [Google Scholar]
- 3.Maggi L, Carboni N & Bernasconi P Skeletal Muscle Laminopathies: A Review of Clinical and Molecular Features. Cells 5 (2016). [DOI] [PMC free article] [PubMed] [Google Scholar]
- 4.Emery AE Emery-Dreifuss muscular dystrophy - a 40 year retrospective. Neuromuscular disorders : NMD 10, 228–232 (2000). [DOI] [PubMed] [Google Scholar]
- 5.Zwerger M et al. Myopathic lamin mutations impair nuclear stability in cells and tissue and disrupt nucleo-cytoskeletal coupling. Hum Mol Genet 22, 2335–2349 (2013). [DOI] [PMC free article] [PubMed] [Google Scholar]
- 6.Gruenbaum Y & Foisner R Lamins: nuclear intermediate filament proteins with fundamental functions in nuclear mechanics and genome regulation. Annual review of biochemistry 84, 131–164 (2015). [DOI] [PubMed] [Google Scholar]
- 7.Pimentel MR, Falcone S, Cadot B & Gomes ER In Vitro Differentiation of Mature Myofibers for Live Imaging. Journal of visualized experiments : JoVE (2017). [DOI] [PMC free article] [PubMed] [Google Scholar]
- 8.Lombardi ML et al. The interaction between nesprins and sun proteins at the nuclear envelope is critical for force transmission between the nucleus and cytoskeleton. Journal of Biological Chemistry 286, 26743–26753 (2011). [DOI] [PMC free article] [PubMed] [Google Scholar]
- 9.Sullivan T et al. Loss of A-type lamin expression compromises nuclear envelope integrity leading to muscular dystrophy. J Cell Biol 147, 913–920 (1999). [DOI] [PMC free article] [PubMed] [Google Scholar]
- 10.Mounkes LC, Kozlov SV, Rottman JN & Stewart CL Expression of an LMNA-N195K variant of A-type lamins results in cardiac conduction defects and death in mice. Hum Mol Genet 14, 2167–2180 (2005). [DOI] [PubMed] [Google Scholar]
- 11.Arimura T et al. Mouse model carrying H222P-Lmna mutation develops muscular dystrophy and dilated cardiomyopathy similar to human striated muscle laminopathies. Hum Mol Genet 14, 155–169 (2005). [DOI] [PubMed] [Google Scholar]
- 12.Davidson PM et al. High-throughput microfluidic micropipette aspiration device to probe time-scale dependent nuclear mechanics in intact cells. Lab Chip 19, 3652–3663 (2019). [DOI] [PMC free article] [PubMed] [Google Scholar]
- 13.Fedorchak G & Lammerding J Cell Microharpooning to Study Nucleo-Cytoskeletal Coupling. Methods in molecular biology 1411, 241–254 (2016). [DOI] [PMC free article] [PubMed] [Google Scholar]
- 14.Tan D et al. Phenotype-Genotype Analysis of Chinese Patients with Early-Onset LMNA-Related Muscular Dystrophy. PLoS One 10, e0129699 (2015). [DOI] [PMC free article] [PubMed] [Google Scholar]
- 15.Gnocchi VF et al. Uncoordinated transcription and compromised muscle function in the lmna-null mouse model of Emery-Dreyfuss muscular dystrophy. PLoS One 6, e16651 (2011). [DOI] [PMC free article] [PubMed] [Google Scholar]
- 16.Denais CM et al. Nuclear envelope rupture and repair during cancer cell migration. Science 352, 353–358 (2016). [DOI] [PMC free article] [PubMed] [Google Scholar]
- 17.Raab M et al. ESCRT III repairs nuclear envelope ruptures during cell migration to limit DNA damage and cell death. Science 352, 359–362 (2016). [DOI] [PubMed] [Google Scholar]
- 18.Park S-J et al. DNA-PK promotes the mitochondrial, metabolic, and physical decline that occurs during aging. Cell metabolism 25, 1135–1146. e1137 (2017). [DOI] [PMC free article] [PubMed] [Google Scholar]
- 19.Irianto J et al. Nuclear constriction segregates mobile nuclear proteins away from chromatin. Mol Biol Cell 27, 4011–4020 (2016). [DOI] [PMC free article] [PubMed] [Google Scholar]
- 20.Larsen BD et al. Caspase 3/caspase-activated DNase promote cell differentiation by inducing DNA strand breaks. Proc Natl Acad Sci U S A 107, 4230–4235 (2010). [DOI] [PMC free article] [PubMed] [Google Scholar]
- 21.Connolly PF & Fearnhead HO DNA-PK activity is associated with caspase-dependent myogenic differentiation. Febs Journal 283, 3626–3636 (2016). [DOI] [PubMed] [Google Scholar]
- 22.Burla R, La Torre M, Merigliano C, Verni F & Saggio I Genomic instability and DNA replication defects in progeroid syndromes. Nucleus 9, 368–379 (2018). [DOI] [PMC free article] [PubMed] [Google Scholar]
- 23.Graziano S, Kreienkamp R, Coll-Bonfill N & Gonzalo S Causes and consequences of genomic instability in laminopathies: Replication stress and interferon response. Nucleus 9, 258–275 (2018). [DOI] [PMC free article] [PubMed] [Google Scholar]
- 24.Roman W & Gomes ER Nuclear positioning in skeletal muscle. Seminars in cell & developmental biology 82, 51–56 (2018). [DOI] [PubMed] [Google Scholar]
- 25.Starr DA Muscle Development: Nucleating Microtubules at the Nuclear Envelope. Current biology : CB 27, R1071–R1073 (2017). [DOI] [PMC free article] [PubMed] [Google Scholar]
- 26.Folker ES & Baylies MK Nuclear positioning in muscle development and disease. Front Physiol 4, 363 (2013). [DOI] [PMC free article] [PubMed] [Google Scholar]
- 27.Bone CR & Starr DA Nuclear migration events throughout development. J Cell Sci 129, 1951–1961 (2016). [DOI] [PMC free article] [PubMed] [Google Scholar]
- 28.Stewart-Hutchinson PJ, Hale CM, Wirtz D & Hodzic D Structural requirements for the assembly of LINC complexes and their function in cellular mechanical stiffness. Exp Cell Res 314, 1892–1905 (2008). [DOI] [PMC free article] [PubMed] [Google Scholar]
- 29.Loewer A, Karanam K, Mock C & Lahav G The p53 response in single cells is linearly correlated to the number of DNA breaks without a distinct threshold. BMC biology 11, 114 (2013). [DOI] [PMC free article] [PubMed] [Google Scholar]
- 30.Fidzianska A & Hausmanowa-Petrusewicz I Architectural abnormalities in muscle nuclei. Ultrastructural differences between X-linked and autosomal dominant forms of EDMD. J Neurol Sci 210, 47–51 (2003). [DOI] [PubMed] [Google Scholar]
- 31.Park YE et al. Nuclear changes in skeletal muscle extend to satellite cells in autosomal dominant Emery-Dreifuss muscular dystrophy/limb-girdle muscular dystrophy 1B. Neuromuscular disorders : NMD 19, 29–36 (2009). [DOI] [PubMed] [Google Scholar]
- 32.Gupta P et al. Genetic and ultrastructural studies in dilated cardiomyopathy patients: a large deletion in the lamin A/C gene is associated with cardiomyocyte nuclear envelope disruption. Basic research in cardiology 105, 365–377 (2010). [DOI] [PMC free article] [PubMed] [Google Scholar]
- 33.Sylvius N et al. In vivo and in vitro examination of the functional significances of novel lamin gene mutations in heart failure patients. J Med Genet 42, 639–647 (2005). [DOI] [PMC free article] [PubMed] [Google Scholar]
- 34.Nikolova V et al. Defects in nuclear structure and function promote dilated cardiomyopathy in lamin A/C-deficient mice. The Journal of clinical investigation 113, 357–369 (2004). [DOI] [PMC free article] [PubMed] [Google Scholar]
- 35.Uchino R, Nonaka YK, Horigome T, Sugiyama S & Furukawa K Loss of Drosophila A-type lamin C initially causes tendon abnormality including disintegration of cytoskeleton and nuclear lamina in muscular defects. Dev Biol 373, 216–227 (2013). [DOI] [PubMed] [Google Scholar]
- 36.Dialynas G et al. LMNA variants cause cytoplasmic distribution of nuclear pore proteins in Drosophila and human muscle. Hum Mol Genet 21, 1544–1556 (2012). [DOI] [PMC free article] [PubMed] [Google Scholar]
- 37.Cho S et al. Mechanosensing by the Lamina Protects against Nuclear Rupture, DNA Damage, and Cell-Cycle Arrest. Dev Cell 49, 920–935 e925 (2019). [DOI] [PMC free article] [PubMed] [Google Scholar]
- 38.Chen SN et al. DNA Damage Response/TP53 Pathway Is Activated and Contributes to the Pathogenesis of Dilated Cardiomyopathy Associated With LMNA (Lamin A/C) Mutations. Circ Res 124, 856–873 (2019). [DOI] [PMC free article] [PubMed] [Google Scholar]
- 39.Hatch EM Nuclear envelope rupture: little holes, big openings. Curr Opin Cell Biol 52, 66–72 (2018). [DOI] [PMC free article] [PubMed] [Google Scholar]
- 40.Irianto J et al. DNA Damage Follows Repair Factor Depletion and Portends Genome Variation in Cancer Cells after Pore Migration. Current biology : CB 27, 210–223 (2017). [DOI] [PMC free article] [PubMed] [Google Scholar]
- 41.Fortini P et al. DNA damage response by single-strand breaks in terminally differentiated muscle cells and the control of muscle integrity. Cell death and differentiation 19, 1741–1749 (2012). [DOI] [PMC free article] [PubMed] [Google Scholar]
- 42.Ferdousi LV et al. More efficient repair of DNA double-strand breaks in skeletal muscle stem cells compared to their committed progeny. Stem Cell Research 13, 492–507 (2014). [DOI] [PubMed] [Google Scholar]
- 43.Kruiswijk F, Labuschagne CF & Vousden KH p53 in survival, death and metabolic health: a lifeguard with a licence to kill. Nature reviews. Molecular cell biology 16, 393–405 (2015). [DOI] [PubMed] [Google Scholar]
- 44.Schwartz LM Skeletal Muscles Do Not Undergo Apoptosis During Either Atrophy or Programmed Cell Death-Revisiting the Myonuclear Domain Hypothesis. Frontiers in Physiology 9, 1887 (2019). [DOI] [PMC free article] [PubMed] [Google Scholar]
- 45.Cheema N, Herbst A, McKenzie D & Aiken JM Apoptosis and necrosis mediate skeletal muscle fiber loss in age-induced mitochondrial enzymatic abnormalities. Aging Cell 14, 1085–1093 (2015). [DOI] [PMC free article] [PubMed] [Google Scholar]
- 46.Lu D et al. LMNA E82K mutation activates FAS and mitochondrial pathways of apoptosis in heart tissue specific transgenic mice. PLoS One 5, e15167 (2010). [DOI] [PMC free article] [PubMed] [Google Scholar]
- 47.Wolf CM et al. Lamin A/C haploinsufficiency causes dilated cardiomyopathy and apoptosis-triggered cardiac conduction system disease. Journal of Molecular and Cellular Cardiology 44, 293–303 (2008). [DOI] [PMC free article] [PubMed] [Google Scholar]
- 48.Macquart C et al. Microtubule cytoskeleton regulates connexin 43 localization and cardiac conduction in cardiomyopathy caused by mutation in A-type lamins gene. Hum Mol Genet (2018). [DOI] [PubMed] [Google Scholar]
- 49.Gundersen GG & Worman HJ Nuclear positioning. Cell 152, 1376–1389 (2013). [DOI] [PMC free article] [PubMed] [Google Scholar]
- 50.Jung HJ et al. Regulation of prelamin A but not lamin C by miR-9, a brain-specific microRNA. Proc Natl Acad Sci U S A 109, E423–431 (2012). [DOI] [PMC free article] [PubMed] [Google Scholar]
- 51.Coffinier C et al. Deficiencies in lamin B1 and lamin B2 cause neurodevelopmental defects and distinct nuclear shape abnormalities in neurons. Mol Biol Cell 22, 4683–4693 (2011). [DOI] [PMC free article] [PubMed] [Google Scholar]
REFERENCES
- 52.Bulfield G, Siller WG, Wight PA & Moore KJ X chromosome-linked muscular dystrophy (mdx) in the mouse. Proc Natl Acad Sci U S A 81, 1189–1192 (1984). [DOI] [PMC free article] [PubMed] [Google Scholar]
- 53.Shurer CR et al. Physical Principles of Membrane Shape Regulation by the Glycocalyx. Cell 177, 1757–1770 e1721 (2019). [DOI] [PMC free article] [PubMed] [Google Scholar]
- 54.Vogler TO, Gadek KE, Cadwallader AB, Elston TL & Olwin BB Isolation, Culture, Functional Assays, and Immunofluorescence of Myofiber-Associated Satellite Cells. Methods in molecular biology 1460, 141–162 (2016). [DOI] [PubMed] [Google Scholar]
- 55.Dialynas G et al. Myopathic lamin mutations cause reductive stress and activate the nrf2/keap-1 pathway. PLoS Genet 11, e1005231 (2015). [DOI] [PMC free article] [PubMed] [Google Scholar]
Associated Data
This section collects any data citations, data availability statements, or supplementary materials included in this article.
Supplementary Materials
Representative movie of spontaneous contractions in Lmna KO myofibers after 10 days of differentiation expressing the doxycycline inducible GFP-KASH2ext control. Doxycycline treated Lmna KO cells expressing GFP-KASH2ext.
Representative movie of spontaneous contractions in Lmna KO myofibers after 10 days of differentiation
Representative movie of spontaneous contractions in Lmna N195K myofibers after 10 days of differentiation
Representative movie of spontaneous contractions in Lmna H222P myofibers after 10 days of differentiation
Representative movie of micropipette aspiration of Lmna WT, Lmna KO Lmna N195K, and Lmna H222P myoblasts.
Representative movie of microharpoon manipulation of Lmna WT and Lmna KO myotubes after day 5 of differentiation.
Time-lapse of nuclear envelope rupture in Lmna KO myotubes after four days of differentiation. Note the loss of soluble NLS-GFP from the nucleus into the cytoplasm.
Representative movie of microharpoon manipulation of Lmna KO myotubes after day 5 of differentiation following 24 hours of treatment with either 50 nM paclitaxel or DMSO control.
Time-lapse of nuclear envelope rupture during myonuclear movement at 5 days of differentiation. Note the loss of NLS-GFP from the nucleus is immediately followed by the formation of cGAS-mCherry foci at the site of rupture.
Representative movie of spontaneous contractions in Lmna WT myofibers after 10 days of differentiation
Representative movie of spontaneous contractions in Lmna WT myofibers after 10 days of differentiation expressing a doxycycline inducible GFP-KASH2 to disrupt nucleo-cytoskeletal force transmission. Non-doxycycline treated control.
Representative movie of spontaneous contractions in Lmna WT myofibers after 10 days of differentiation expressing a doxycycline inducible GFP-KASH2 to disrupt nucleo-cytoskeletal force transmission. Doxycycline treated cells expressing GFP-KASH2.
Representative movie of spontaneous contractions in Lmna WT myofibers after 10 days of differentiation expressing the doxycycline inducible GFP-KASH2ext control. Non-doxycycline treated control.
Representative movie of spontaneous contractions in Lmna WT myofibers after 10 days of differentiation expressing the doxycycline inducible GFP-KASH2ext control. Doxycycline treated cells expressing GFP-KASH2ext.
Representative movie of spontaneous contractions in Lmna KO myofibers after 10 days of differentiation expressing a doxycycline inducible GFP-KASH2 to disrupt nucleo-cytoskeletal force transmission. Non-doxycycline treated Lmna KO control.
Representative movie of spontaneous contractions in Lmna KO myofibers after 10 days of differentiation expressing a doxycycline inducible GFP-KASH2 to disrupt nucleo-cytoskeletal force transmission. Doxycycline treated Lmna KO cells expressing GFP-KASH2.
Representative movie of spontaneous contractions in Lmna KO myofibers after 10 days of differentiation expressing the doxycycline inducible GFP-KASH2ext control. Non-doxycycline treated Lmna KO controls.


