


Abstract
Fluorescence microscopy is invaluable to a range of biomolecular analysis approaches. The required labeling of proteins of interest, however, can be challenging and potentially perturb biomolecular functionality as well as cause imaging artefacts and photo bleaching issues. Here, we introduce inverse (super-resolution) imaging of unlabeled proteins bound to DNA. In this new method, we use DNA-binding fluorophores that transiently label bare DNA but not protein-bound DNA. In addition to demonstrating diffraction-limited inverse imaging, we show that inverse Binding-Activated Localization Microscopy or ‘iBALM’ can resolve biomolecular features smaller than the diffraction limit. The current detection limit is estimated to lie at features between 5 and 15 nm in size. Although the current image-acquisition times preclude super-resolving fast dynamics, we show that diffraction-limited inverse imaging can reveal molecular mobility at ∼0.2 s temporal resolution and that the method works both with DNA-intercalating and non-intercalating dyes. Our experiments show that such inverse imaging approaches are valuable additions to the single-molecule toolkit that relieve potential limitations posed by labeling.
INTRODUCTION
Fluorescence microscopy is the imaging method of choice for an extensive range of in vivo and in vitro studies in life sciences. In these studies, imaging of (individual) labeled molecular complexes typically provides spatially and temporally resolved information of their presence, location, motion, colocalization, conformation and stoichiometry as well as insight into the morphology of extended molecular architectures (1,2). Fluorescence microscopy typically relies on the fluorescent labeling of proteins of interest through their fusion with fluorescent proteins or through (site-)specific attachment of synthetic dyes. While such labeling can often be performed with high specificity and efficiency, labeling is also associated with significant challenges and drawbacks related to the labeling procedures and optimization involved. In particular, the most critical drawbacks occur if labeling interferes with the structure and/or function of the biomolecule of interest or if it causes for example artificial clustering of labeled proteins (3).
At present, label-free imaging techniques that circumvent drawbacks associated with labeling are receiving increased attention. These techniques include second and third harmonic generation, stimulated Raman scattering, interferometric scattering (iSCAT), and interference reflection microscopy (4–7). Here, we set out to develop a fluorescence-based approach capable of visualizing unlabeled proteins bound to DNA. Instead of labeling and imaging the proteins of interest themselves, we employ an inverse imaging strategy by imaging the regions of DNA that are not covered with protein using transiently-binding DNA-labels. While in principle any fluorescent DNA-binding label can be used, we first focus on the use of commercially available DNA-intercalating dyes that exhibit 2–3 orders of magnitude enhanced fluorescence upon binding DNA (8). These well-studied dyes have been used extensively to report on the presence and location of double-stranded DNA, on structural transitions of DNA, as well as on DNA replication and DNA digestion activities (9–14). Indeed, fluorescent intercalator displacement assays have demonstrated that DNA-bound proteins compete with intercalators for DNA-binding sites, such that a suppressed signal from these labels can report on the presence of unlabeled DNA-binding proteins (15,16). Here we further extend the power of this approach by imaging the DNA intermittently bound by intercalators and thus retrieving spatially-resolved information on unlabeled DNA-bound proteins.
Super-resolution approaches have enhanced the resolving power of fluorescence microscopy by improving its spatial resolution from the traditional diffraction limited resolution of ∼250 to 25 nm or less (17–19). Such enhanced resolution has also been applied to intercalator-based imaging of DNA: by localizing intermittent DNA-binding events of intercalators in an approach termed ‘Binding-Activated Localization Microscopy’ (BALM), super-resolved images of double-stranded DNA have been obtained with a spatial resolution of 14 nm (20). Inspired by this study, we present experimental evidence that DNA-bound-protein sections can be visualized with a resolution better than the diffraction limit without the need for labeling the proteins, in an approach we call ‘inverse Binding-Activated Localization Microscopy’, iBALM (Figure 1A). We use Monte Carlo simulations to obtain insight into the parameters determining the spatial resolution. Finally, we show that the inverse imaging approach extends to the use of transiently DNA-binding species other than intercalators to visualize the dynamics of protein complexes moving along DNA.
Figure 1.
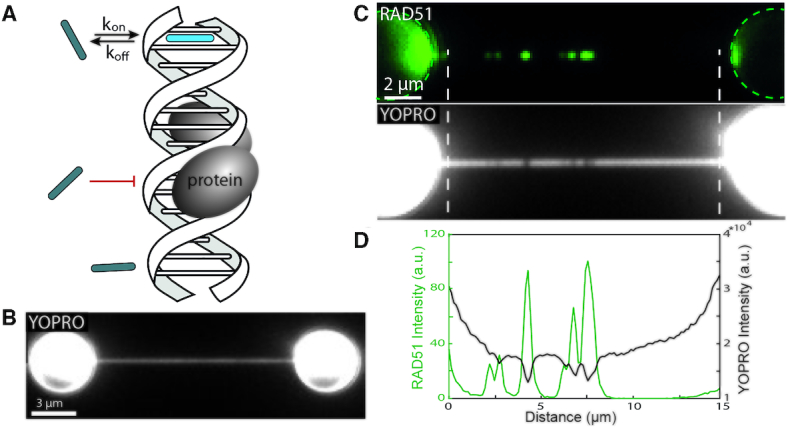
Inverse microscopy proof of principle. (A) Schematic of inverse microscopy principle. Inverse microscopy relies on the competition of binding sites between protein (grey oval) and fluorescent probe (rod). (B) YOPRO imaging in the absence of hRAD51 reveals a homogeneously stained DNA strand (exposure time: 1 s). (C) Fluorescence wide-field images of hRAD51-Alexa647 signal (upper, acquired in absence of YOPRO) and the subsequently acquired YOPRO image (lower) on DNA that is tethered between two optically trapped polystyrene beads (exposure time: 1s). (D) Intensity profile between the white dotted lines of the wide-field images of (C) shows a strong correlation between the position of peaks in the hRAD51-A647 image (green profile) and the dips in the YOPRO image (black profile).
MATERIALS AND METHODS
The Monte Carlo simulations
Locations of binding events were randomly generated over a length of 1 μm DNA and events that overlapped the blocked region were subsequently discarded. Normalized Gaussian profiles of localizations were summed according to position. The width of the Gaussians was calculated using the formula of localization uncertainty as described in (21)
 |
where s is given by the standard deviation of the point spread function, a is the pixel size, N is the number of photons collected and b is the background noise. For our experimental scheme  and
and  . The standard deviation of the point spread function can be calculated by
  , where λ is the light wavelength (λ = 570 nm for SxO emission) and NA the numerical aperture of the objective (NA = 1.2). The number of photons for each binding event was drawn from a gamma distribution with a scale parameter equal to the number of photons as a simulation parameter and a shape parameter, k, measured from experimental data (k = 2.95). We next compared the results from this approach to the actual position of the protein patch and determined the percentages of correct localizations and false positives. On a non-blocked region of the DNA, mean and standard deviation of the summed intensity profile along the DNA was determined. The threshold, given by
  , was used as criterion to test whether a blocked region was detected and whether any non-blocked regions would pop-up as false positives. Here, the parameter N tunes the tradeoff between minimal detection size and false positives. For any given parameter set, 20 iterations of every parameter combination were performed and subsequently the chance of true and false positives was calculated.
Instrumentation
Experiments were performed on a custom-built inverted microscope that combined dual-trap optical tweezers with either wide-field or confocal fluorescence microscopy (22,23). In brief, two optical traps are generated using a 10 W 1064 nm CW fiber laser (YLR-10-LP, IPG Photonics). Beam splitting and recombination is achieved using two polarizing beam-splitter cubes (10BC16PC.9, Newport). Independent trap steering is done via a coarse-positioning piezo stepper mirror (AG-M100N, Newport) and an accurate piezo mirror (Nano-MTA2X Aluminium, Mad City Labs). Two 300 mm lenses are used to couple the laser beams into a water-immersion objective (Plan Apo ×60, numerical aperture 1.2, Nikon). Force measurement is done with back-focal-plane interferometry by collecting the light using a condenser lens and separating the two trapping paths with a polarizing beam-splitter cube and two position-sensitive detectors (DL100-7PCBA3, Pacific Silicon Sensor). Fluorescence microscopy was performed on a wide-field setup using an EMCCD camera (iXON+ 897E, Andor Technology). For the localization experiments, the EM-gain was turned off. A 491-nm excitation laser (Cobolt Calypso 50 mW CW) was used for exciting YOPRO and a 532-nm excitation laser (Cobolt Samba 50 mW CW) was used for exciting SYTOX Orange. XLF experiments were performed with a confocal fluorescence setup as described before (22). Briefly, a pulsed laser system (ALP-745-710-SC) was used to create an excitation beam centered at 467 nm. A tip/tilt piezo mirror (S-334.1SD, Physik Instrumente GmbH & Co.) was used for beam scanning and a fiber coupled APD (APDs SPCM-AQRH-14-FC, fibers SPCM-QC9, PerkinElmer) was used for detection. Line scanning of 190ms was used to create XLF images.
ThunderSTORM analysis
Localization of binding events was performed using the ImageJ plugin ThunderSTORM. To each local maximum a fit of a Gaussian was performed with the weighted least-squares method using a fitting radius of 3 pixels. The results were visualized by depicting every localization as a normalized Gaussian without performing any selection on the localizations. The mean intensity of the localizations was 366 photons (mode 231 photons), while the background had an offset of 18±5 photons. This yielded an average localization uncertainty of 25 nm (mode 19 nm).
DNA, intercalators, proteins and buffers
Biotinylated DNA constructs were produced from bacteriophage λ DNA as described previously (23). DNA-dumbbell constructs were produced in the flow cell by spontaneous binding of biotinylated DNA to streptavidin-coated polystyrene microspheres (4.65μm diameter, Spherotech). SYTOX Orange and YO-PRO-1 were obtained from Invitrogen. hRAD51 labeling with Alexa 647 was performed as described previously (24). RAD51 experiments were performed in RAD51 buffer, containing 20 mM Tris–HCl at pH 7.5, 1 mM CaCl2 and 100 mM KCl. For localization experiments, 20 μM hRAD51 was pre-incubated for 1 h with 10 ng/μl bacteriophage λ DNA, 20 mM Tris–HCl at pH 7.5, 2 mM CaCl2, 1 mM ATP and 30 mM KCl. After incubation, hRAD51–DNA constructs were diluted in RAD51 buffer. For the fluorescence intercalator displacement assay (Supplementary Figure S1), a similar pre-incubation was performed with variable hRAD51 concentration. After incubation, the DNA was diluted in RAD51 buffer containing 1 μM SxO to yield a ∼10% staining of the DNA. Absorption spectra were collected with a UV–Vis spectrophotometer (Varian Cary 4000). hXLF labeling with eGFP was performed as was described before (25). TFAM labeling with Alexa 555 was performed via cysteine-maleimide linkage as described before (26). TFAM experiments were conducted in 10 mM HEPES pH 7.5, 25 mM NaCl, 1 mM DTT, 0.05% casein and 0.05% Pluronics. hXLF-eGFP experiments were conducted in 20 mM Tris–HCl (pH 7.5), 1 mM DDT and 25 mM KCl.
RESULTS
As a first demonstration of the ability to visualize unlabeled proteins on DNA, we studied human recombinase protein RAD51 (hRAD51) using DNA-intercalation-based inverse imaging. Here, DNA was incubated with hRAD51 in a calcium-containing buffer to form DNA-bound hRAD51 filaments (27,28) (Materials and Methods). This DNA was subsequently tethered to two optically trapped polystyrene beads and stretched to yield a DNA-dumbbell configuration. In this experiment, we used Alexa Fluor 647-labeled hRAD51 to allow direct confirmation of the presence and location of hRAD51 on the DNA (Figure 1A) in conventional wide-field epifluorescence imaging (methods). Concurrently, we used the mono-intercalator YO-PRO-1 (YOPRO) in order to visualize the DNA for inverse imaging. Even at low average intercalation density (<10%), the rapid and sequence-independent DNA-binding kinetics of YOPRO (∼10 ms−1), combined with ∼1 s camera exposure time, yields a uniform staining of the DNA in absence of hRAD51 (Figure 1B). In presence of DNA-bound hRAD51, however, regions of suppressed YOPRO signal (i.e. ‘dark’ spots along the DNA) are clearly visible (Figure 1C). Indeed, the locations of these dark spots in the YOPRO image correspond excellently to the locations of DNA-bound hRAD51 (Figure 1D). This experiment demonstrates that DNA-bound hRAD51 locally suppresses intercalator binding, which is in line with our findings in fluorescent intercalator displacement experiments performed in bulk solution on unlabeled hRAD51 bound to DNA (Supplementary Figure S1A). Similar inverse imaging experiments were performed on the mitochondrial transcription initiation protein TFAM, revealing a clear spatial correlation of the suppressed YOPRO signal with TFAM-Alexa555 bound regions of the DNA (Supplementary Information 4 and Supplementary Figure S4). These experiments provide the proof of concept that spatial information on the location of DNA-bound proteins can be retrieved through intercalator-based inverse imaging without the need to label the proteins themselves.
To further extend the concept of inverse labeling to super-resolution microscopy, we first analyzed the performance of binding-activated localization microscopy on optically manipulated DNA. Here, we employed the mono-intercalator Sytox Orange (SxO) because it has binding-event durations in the range of seconds ( at 15 pN DNA tension (9). At nanomolar intercalator concentration, such long binding times allow us to conveniently localize the positions of individually resolved DNA-intercalation events (Figure 2A). The average number of photons collected per binding event per frame was 366 (1 s exposure time). We reconstructed a super-resolution image of the DNA based on the localization of
  individual SxO binding events (Figure 2B), which demonstrates the feasibility of BALM on optically manipulated DNA. Note that control of DNA tension (implemented here using optical tweezers) allows tuning the event duration due to the strongly DNA tension-dependent off-rate of intercalators (9). Together with the intercalator concentration, DNA tension thus provides control over event frequency and duration, which allows convenient tuning of the spatial and temporal resolution of (inverse) localization microscopy. Additionally, we note that control of DNA tension allows suppressing the thermal fluctuations of the DNA, which may otherwise decrease the effective (super-)resolution due to motion blurring (22,29). In the reconstructed image, the standard deviation of the DNA cross-section was 38 ± 2 nm (corresponding to a FWHM of 90 ± 5 nm, Figure 2C and Supplementary Information 2) (20,30). Importantly, the high number of localizations acquired shows the feasibility of a dense sampling of the DNA (3 nm–1 or ∼1 event per base pair), which will assist the inverse imaging of proteins and protein patches with DNA-bound footprints in the range of 5–50 nm.
Figure 2.

Super-resolution imaging of DNA with BALM and visualization of DNA-bound proteins with iBALM. (A) Fluorescence images show individual SxO binding events on optically manipulated DNA (exposure time: 1 s). (B) Super-resolution reconstruction of the SxO binding events on optically manipulated DNA. (C) Cross section and Gaussian fit taken perpendicular to the DNA orientation, as indicated in the super-resolved image in (B). (D) Wide-field image of hRAD51-A647 filaments bound to DNA (upper) and the corresponding reconstructed super-resolution image of SxO binding to DNA (lower) accumulated over 100 minutes. (E) Intensity profile along the DNA between the white dotted lines of the images in (C) show a strong correlation between hRAD51 position (green profile) and dark spots in the super-resolved SxO image (black profile). (F) Comparison of the intensity profile of the diffraction-limited RAD51 signal and the inverted intensity profile of the iBALM signal, at the position indicated by the arrows in (D) and (E). The dashed lines are gaussian fits that correspond to FWHM values of  and
and  nm for the hRAD51-A647 and SxO signals, respectively.
Next, we combined the inverse labeling strategy with the principle of BALM, in order to demonstrate that we can super-resolve unlabeled proteins on DNA in an approach we call ‘inverse BALM’ (iBALM). To this end, we again turned to dsDNA that was pre-incubated with hRAD51-A647 and used SxO for localization microscopy of DNA. In this experiment, a localization density of 1.7 nm−1 was achieved with an average localization precision of individual SxO binding events of 25 nm. The reconstructed iBALM image exhibits dark spots, comparable to those observed in the diffraction limited experiment (cf. Figure 1) yet resolved at an enhanced resolution. Indeed, these super-resolved dark spots coincide with the location of hRAD51-A647 filaments on the dsDNA, as observed through direct imaging of hRAD51-A647 (Figure 2D, E). The observation that the SxO signal nearly vanishes at the RAD51-bound DNA indicates that RAD51 filaments indeed prevent SxO binding. The full-width at half maximum (FWHM) of the hRAD51 filament in the super-resolved iBALM image (see arrow in Figure 2D, E) is 180 ± 10 nm (corresponding to 120 ± 7 hRAD51 monomers), which is more than a factor of two better than the FWHM observed in the diffraction-limited Alexa Fluor 647 image (450 ± 20 nm) (Figure 2F). The size of the hRAD51 filament that we estimated through iBALM, is in good quantitative agreement with an estimate of the number of hRAD51 monomers in the filament based on the Alexa647 fluorescence signal, and with an estimate of the number of basepairs that are inaccessible for SxO binding based on the suppressed intercalator signal (see Supplementary Information 3). While the total image acquisition time of Figure 2D–F was 100 min, all RAD51 patches could already be detected after 5 min of imaging (using an automated detection algorithm, see Supplementary Figure S2). These results demonstrate a quantitative fluorescence-based super-resolution imaging method of unlabeled protein filaments on DNA.
To obtain quantitative insights into the performance and limitations of iBALM, we performed Monte Carlo simulations of our inverse imaging approach. These simulations assume that a 1 μm long DNA molecule has a protein (patch) bound at its center. Stochastic DNA intercalation events were generated at random positions along the DNA, except at the protein-bound section (see methods). These simulated intercalation events were subsequently used to reconstruct an iBALM image (see simulated reconstructed iBALM profile, Figure 3A). In order to identify protein-bound DNA in the simulated iBALM profiles, we invoked an intensity threshold  , below which the DNA is considered to be bound by proteins. We calculate the intensity threshold as
  , in which
  is the average intensity and
  is the standard deviation of the intensity. In principle,
  and
and  can be estimated through an iterative approach without prior knowledge (Supplementary Information 1), but, for simplicity, we obtained these parameters here directly from the simulated sections of bare DNA. Parameter N needs to be chosen to achieve a balanced tradeoff between false positives, correct detections, and the minimum detectable patch size. To quantify the impact of this tradeoff, we varied N for a range of different protein patch sizes and a range of localization densities (Figure 3B). In these simulated experiments, the number of detected photons was kept constant at 100 per nm DNA (Materials and Methods). The following observations can be made: (i) the percentage of false positives drops sharply with increasing N. Specifically, for N = 3.5, the fraction of false positives drops <10%, independent of localization density; and (ii) increasing N further >3.5 yields minimal improvement in false positives, while it substantially deteriorates (increases) the minimal detectable patch size, in a manner that is strongly dependent on localization density and precision. For example, a minimum detectable patch size of 23 nm is achieved using N = 3.5, at an intercalation density of 2 nm–1 and 50 detected photons per intercalator (corresponding to a localization accuracy of 65 nm).
Figure 3.

Monte Carlo simulations give insight into the performance of iBALM. (A) Example of a simulated intensity profile with a localization density  . Red area depicts the blocked region representing a protein patch. Green region is used to determine mean and standard deviation of the intensity profile. (B) Influence of the threshold value on the probability of finding false positives (black) and on the minimal detectable patch size (red). Three different combinations of localization densities were compared, while keeping the average number of photons constant at 100 per nm (continuous, dashed and dotted line). (C) The probability of detecting a protein patch of varying size as a function of localization density. Color scale depicts probability of detecting true positives. The threshold parameter and number of photons per intercalator were chosen to be
  and
and  respectively. (D) Probability of detecting small protein patches (<10 nm) at a photon yield of
  as a function of localization density.
Next, we sought to investigate how the efficiency of detecting protein patches of varying size depends on the localization density (Figure 3C). To this end, a second set of simulations was performed in which the number of photons per intercalator was fixed to 200, resulting in a localization accuracy of 19 nm (for simulations of different photon counts see Supplementary Figure S3A). As expected, the detection efficiency increases with increasing localization density and with increasing patch size (Figure 3C). For example, in order to detect protein patches between 20 and 55 nm in size with a minimum efficiency of 50%, a minimal localization density of about 0.75 nm–1 was required. These simulations furthermore show that the smallest protein (patch) sizes that can be detected reliably is about 15 nm (dashed line), which is comparable in size to large protein complexes such as nucleosomes, DNA Polymerase or to filament-forming proteins such as RAD51. This lower limit can be further enhanced to the size of a single protein of 5 nm by increasing the number of detected photons per intercalator to 800 (corresponding to an enhanced localization accuracy of 7 nm) at an intercalator density of 10 nm–1 (Figure 3D). Taken together, these simulations indicate that, under the conditions of our iBALM experiments (localization density of 1.7 nm–1 and localization accuracy of 25 nm), the minimum detectable protein (patch) size is 15 nm (detection probability > 90%). For RAD51, such 15 nm patch corresponds to a minimum detectable number of 10 proteins.
To explore further applications of our inverse imaging approach, we turn to the limit of high protein density, where inverse imaging may serve to quantify the length of long nucleoprotein filaments. In previous studies, the typical length of uninterrupted, defect-free hRAD51 nucleoprotein filaments on dsDNA has been measured using AFM to be on average 500 bp (31). We revisited this quantification by exposing dsDNA that was saturated with hRAD51 (as confirmed by force-extension analysis and fluorescence images (Supplementary Figure S1B, D)) to the intercalating dye YOPRO. Fluorescence imaging of YOPRO reveals a clear, sparse binding pattern of the intercalator to the hRAD51-saturated DNA (Figure 4A) that is distinct from the relatively homogeneous YOPRO binding pattern that we observed previously at low hRAD51 coverage (cf. Figure 1B). The YOPRO binding pattern of Figure 4A is consistent with a dense coverage of the DNA by continuous hRAD51 filaments that are interrupted by gaps where intercalators are permitted to bind to the exposed DNA. The peak-to-peak distance in the intensity profile (Figure 4B, inset) thus provides an upper limit estimate for the hRAD51 filament length of 0.7 μm or 1.4 kb, which is in good agreement with previous estimates from AFM data (31) (we tentatively attribute the second peak at twice the distance (Figure 4B, inset) to a double average filament length when gaps are not picked up by our peak-finding routine). In this inverse imaging approach, the filament length could be estimated owing to the small DNA-binding footprint of intercalators of (at most) two base pairs (9). Such small footprint allows intercalators to report on sub-nanometer gaps between hRAD51 filaments that are too small to resolve through direct imaging of fluorescently labeled hRAD51.
Figure 4.
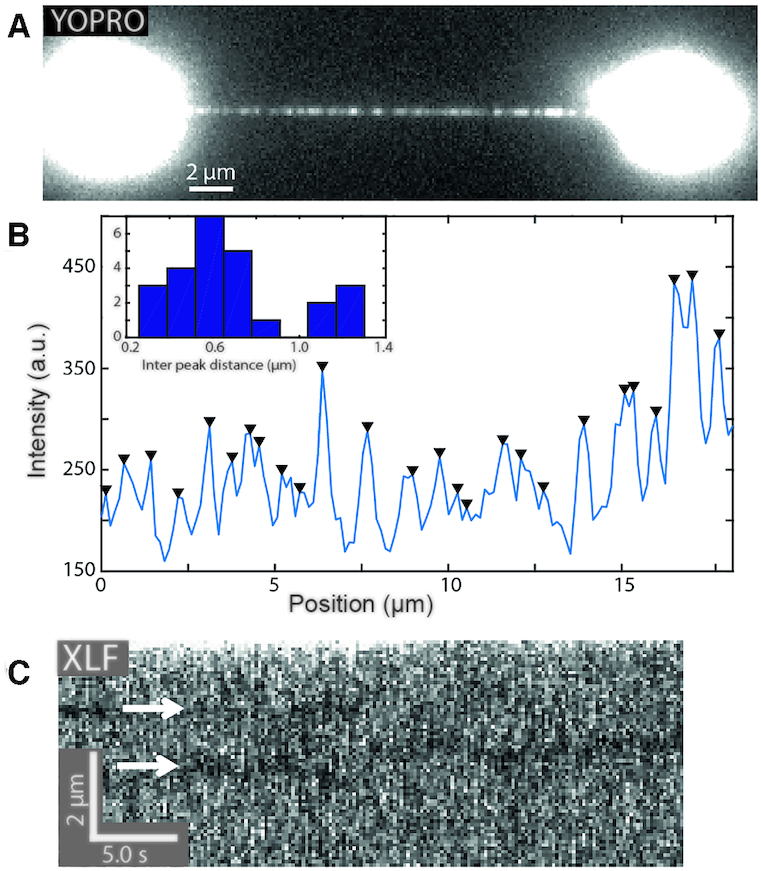
Inverse microscopy applications. (A) YOPRO imaging reveals a sparse binding pattern after the DNA was saturated with hRAD51 binding (exposure time: 1 s). (B) Intensity profile of the fluorescence image of (A). Black triangles indicate the position of detected peaks. Inset: histogram of nearest peak distances. (C) Kymograph of eGFP-labeled hXLF on optically manipulated DNA (line trace: 190 ms). DNA-bound hXLF-eGFP oligomers were bleached and are visualized as dark traces (arrows) in a brighter background of transiently binding hXLF-eGFP monomers.
In another application of inverse microscopy, we aimed to visualize the one-dimensional (diffusive) motion of DNA-bound proteins along dsDNA. Since visualizing one-dimensional diffusive motion requires a temporal resolution in the order of seconds (32), we turned to diffraction-limited inverse microscopy, which is intrinsically faster than super-resolution localization microscopy because it does not require image reconstruction from a multitude of sparse images. Furthermore, we employed the human protein XLF-eGFP to label the DNA instead of using intercalators. XLF is a DNA-repair protein that binds dsDNA intermittently as a monomer, but it can also form stable oligomers that exhibit one-dimensional diffusion along the DNA over extended periods of time (25). After continued exposure of such bound oligomers to fluorescence excitation, their fluorophores photo-bleach, leaving ‘dark’ complexes that are essentially representative of unlabeled complexes bound to DNA. Laser-scanning confocal fluorescence microscopy can subsequently report on the transient binding mode of monomeric hXLF-eGFP to the DNA that surrounds such dark complexes. Indeed, kymographs obtained under such conditions clearly show dark regions of DNA, which we associate with larger photobleached hXLF-eGFP complexes that locally suppress transient binding of hXLF-eGFP monomers to the DNA (Figure 4C, temporal resolution is 190 ms). In support of this hypothesis, the dark spots exhibit one-dimensional diffusion along the stretched DNA with a diffusion constant  (see Supplementary Figure S3B,C), consistent with the previously determined diffusion constant in the range of
  for large XLF complexes (25). These last results showcase not only the versatility of the inverse imaging approach to report on spatial dynamics, but also the generality of the approach beyond the use of DNA-intercalators as inverse labels.
DISCUSSION
In this study we have demonstrated an inverse imaging method that is capable of (super-)resolving unlabeled protein patches bound to DNA. This method is related to fluorescent intercalator displacement (FID) assays (15,16), but with the significant benefit that spatially resolved information of unlabeled proteins can be retrieved by registration of the local absence of fluorescence. In order to correctly assign a local lack of fluorescence to bound proteins, knowledge of DNA location is required, which, in our experiments, is accomplished through optical manipulation, but other methods can be envisioned such as the use of surface-bound DNA or DNA curtains, DNA in nanofluidic confinement, or by flow-stretching DNA.
DNA intercalators appear to be well suited for our inverse imaging approach: intercalators facilitate essentially background-free imaging because of their 2–3 orders of magnitude fluorescence enhancement upon DNA intercalation. Moreover, a range of well-characterized intercalators with a small DNA-binding footprint is commercially available (9), which makes it possible to quantitatively estimate the number of base pairs covered by the unlabeled proteins (Supplementary Figure S1 and Supplementary Information 3). A possible concern of using intercalators is their potentially perturbing effect on DNA structure and on enzymatic reactions (9). However, such perturbation has been well-characterized and can be minimized through experimental design: Through proper choice of DNA tension, intercalator and salt concentration, the DNA-binding kinetics and affinity can be tuned over ∼7 orders of magnitude and, for example, achieve low coverage (e.g. <1%) or high off-rates to minimize perturbation (provided that such salt concentration and tension is compatible with the DNA-protein interaction of interest) (9). While most of our experiments indeed focused on using DNA intercalators, we also demonstrated our inverse imaging approach using non-intercalating probes. In principle, any DNA-binding dye can be used as long as it competes with the protein of interest for DNA-binding sites. Labels suitable for inverse imaging should ideally bind DNA transiently while minimally perturbing it.
A common problem for fluorescence-based approaches is photobleaching. Inverse imaging, much like PAINT (33), circumvents photobleaching problems by continuously drawing new labels from bulk solution in order to report on the features of interest (e.g. bare DNA). Bleaching followed by photo-nicking of DNA, which can result in DNA breaks, on the other hand, can be problematic. This is particularly relevant for intercalators since their chromophoric systems interact strongly with the DNA. In our hands, photo-induced DNA breaks indeed limited the total duration of an experiment. Several approaches may be taken to suppress this photo-nicking problem and increase experiment duration or photon yield, such as the use of reducing and oxidizing reagents (34).
The ability of inverse imaging to retrieve spatially resolved information on molecular structures without the need to label the proteins of interest themselves sets the method apart from other fluorescence-based imaging approaches. Other label-free imaging methods such as second and third harmonic generation exist, but these are restrictive in the proteins/structures that yield contrast. Inverse imaging, on the other hand, can be used to image any DNA-binding protein. While this makes the method versatile, a lack of specific contrast also requires judicious experimental design in order to enable correct interpretation of inverse images. A label-free technique such as iSCAT gains some specificity by quantifying molecular weight (5). On the other hand, scattering-based techniques such as iSCAT cannot make use of conventional super-resolution methods that rely on switching between bright and dark states.
We demonstrated super-resolution imaging of unlabeled protein patches through inverse binding-activated localization microscopy (iBALM). The high sampling density that is required for iBALM causes super-resolution imaging to be comparatively slow. We showed that much higher temporal resolution can be achieved through beam-scanning confocal (diffraction limited) imaging of XLF-eGFP as DNA-labeling molecule. Similarly high time resolution may be achieved in super-resolution inverse imaging by employing beam-scanning (1D) STED imaging of intercalating dyes (e.g. Sytox Red, cf. (22)).
We envision wide applications for inverse imaging and iBALM approaches. Although we have focused on imaging isolated DNA strands, one could also imagine quantitative imaging of regions of variable DNA accessibility in chromosomes (35). Furthermore, these inverse imaging principles may be applied to systems other than DNA, including the cytoskeleton (e.g. microtubules) (36) and two- or three-dimensional structures like lipid surfaces (37). We consider inverse imaging and iBALM to be valuable additions to the single-molecule toolkit that can complement existing methods and relieve potential limitations posed by labeling in a wide range of applications.
Supplementary Material
ACKNOWLEDGEMENTS
We thank M. Modesti for kindly providing proteins and J. Bodin for experimental support with bulk fluorescent intercalator displacement experiments.
Notes
Present address: Ineke Brouwer, Division of Gene Regulation, the Netherlands Cancer Institute, 1066 CX Amsterdam, The Netherlands.
SUPPLEMENTARY DATA
Supplementary Data are available at NAR Online.
FUNDING
European Union's Horizon 2020 FET Open research program [665233 ‘Chromavision’] and research and innovation program [654148 ‘Laserlab-Europe’]; NWO VIDI (to I.H.); European Research Council (ERC) starting [260849 to G.J.L.W.].
Conflict of interest statement. A.E.C.M., A.S.B., E.J.G.P., G.J.L.W. and I.H. have filed a patent application on the inverse imaging method presented here. This pending patent is licensed to LUMICKS B.V., in which G.S., E.J.G.P., G.J.L.W. and I.H. declare a financial interest.
REFERENCES
- 1. Huang B., Bates M., Zhuang X.. Super-resolution fluorescence microscopy. Annu. Rev. Biochem. 2009; 78:993–1016. [DOI] [PMC free article] [PubMed] [Google Scholar]
- 2. Lichtman J.W., Conchello J.A.. Fluorescence microscopy. Nat. Methods. 2005; 2:910–919. [DOI] [PubMed] [Google Scholar]
- 3. Wang S., Moffitt J.R., Dempsey G.T., Xie X.S., Zhuang X.. Characterization and development of photoactivatable fluorescent proteins for single-molecule-based superresolution imaging. Proc. Natl. Acad. Sci. U.S.A. 2014; 111:8452–8457. [DOI] [PMC free article] [PubMed] [Google Scholar]
- 4. Freudiger C.W., Min W., Saar B.G., Lu S., Holtom G.R., He C., Tsai J.C., Kang J.X., Xie X.S.. Label-free biomedical imaging with high sensitivity by stimulated raman scattering microscopy. Science (80-.). 2008; 322:1857–1861. [DOI] [PMC free article] [PubMed] [Google Scholar]
- 5. Ortega-Arroyo J., Kukura P.. Interferometric scattering microscopy (iSCAT): new frontiers in ultrafast and ultrasensitive optical microscopy. Phys. Chem. Chem. Phys. 2012; 14:15625–15636. [DOI] [PubMed] [Google Scholar]
- 6. Cole D., Young G., Weigel A., Sebesta A., Kukura P.. Label-free single-molecule imaging with numerical-aperture-shaped interferometric scattering microscopy. ACS Photonics. 2017; 4:211–216. [DOI] [PMC free article] [PubMed] [Google Scholar]
- 7. Simmert S., Kazem Abdosamadi M., Hermsdorf G., Schäffer E.. LED-based interference-reflection microscopy combined with optical tweezers for quantitative three-dimensional single microtubule imaging. Opt. Express. 2018; 26:14499–14513. [DOI] [PubMed] [Google Scholar]
- 8. Glazer A.N., Rye H.S.. Stable dye-DNA intercalation complexes as reagents for high-sensitivity fluorescence detection. Nature. 1992; 359:859–861. [DOI] [PubMed] [Google Scholar]
- 9. Biebricher A.S., Heller I., Roijmans R.F.H., Hoekstra T.P., Peterman E.J.G., Wuite G.J.L.. The impact of DNA intercalators on DNA and DNA-processing enzymes elucidated through force-dependent binding kinetics. Nat. Commun. 2015; 6:7304. [DOI] [PMC free article] [PubMed] [Google Scholar]
- 10. Perkins T.T., Smith D.E., Chu S.. Single polymer dynamics in an elongational flow. Science. 1997; 276:2016–2021. [DOI] [PubMed] [Google Scholar]
- 11. Glazer A.N., Peck K., Mathies R.A.. A stable double-stranded DNA-ethidium homodimer complex: application to picogram fluorescence detection of DNA in agarose gels. Proc. Natl. Acad. Sci. U.S.A. 1990; 87:3851–3855. [DOI] [PMC free article] [PubMed] [Google Scholar]
- 12. Bianco P.R., Brewer L.R., Corzett M., Balhorn R., Yeh Y., Kowalczykowski S.C., Baskin R.J.. Processive tanslocation and DNA unwinding by individual RecBCD enzyme molecules. Nature. 2001; 409:374–378. [DOI] [PubMed] [Google Scholar]
- 13. Finkelstein I.J., Visnapuu M.L., Greene E.C.. Single-molecule imaging reveals mechanisms of protein disruption by a DNA translocase. Nature. 2010; 468:983–987. [DOI] [PMC free article] [PubMed] [Google Scholar]
- 14. Hamdan S.M., Loparo J.J., Takahashi M., Richardson C.C., Van Oijen A.M.. Dynamics of DNA replication loops reveal temporal control of lagging-strand synthesis. Nature. 2009; 457:336–339. [DOI] [PMC free article] [PubMed] [Google Scholar]
- 15. Zaitsev E.N., Kowalczykowski S.C.. Binding of double-stranded DNA by Escherichia coli RecA protein monitored by a fluorescent dye displacement assay. Nucleic Acids Res. 1998; 26:650–654. [DOI] [PMC free article] [PubMed] [Google Scholar]
- 16. Boger D.L., Fink B.E., Brunette S.R., Tse W.C., Hedrick M.P.. A simple, high-resolution method for establishing DNA binding affinity and sequence selectivity. J. Am. Chem. Soc. 2001; 123:5878–5891. [DOI] [PubMed] [Google Scholar]
- 17. Betzig E., Patterson G.H., Sougrat R., Lindwasser O.W., Olenych S., Bonifacino J.S., Davidson M.W., Lippincott-Schwartz J., Hess H.F.. Imaging intracellular fluorescent proteins at nanometer resolution. Science (80-.). 2006; 313:1642–1645. [DOI] [PubMed] [Google Scholar]
- 18. Rust M.J., Bates M., Zhuang X.. Sub-diffraction-limit imaging by stochastic optical reconstruction microscopy (STORM). Nat. Methods. 2006; 3:793–795. [DOI] [PMC free article] [PubMed] [Google Scholar]
- 19. Willig K.I., Rizzoli S.O., Westphal V., Jahn R., Hell S.W.. STED microscopy reveals that synaptotagmin remains clustered after synaptic vesicle exocytosis. Nature. 2006; 440:935–939. [DOI] [PubMed] [Google Scholar]
- 20. Schoen I., Ries J., Klotzsch E., Ewers H., Vogel V.. Binding-activated localization microscopy of DNA structures. Nano Lett. 2011; 11:4008–4011. [DOI] [PubMed] [Google Scholar]
- 21. Mortensen K.I., Churchman L.S., Spudich J.A., Flyvbjerg H.. Optimized localization analysis for single-molecule tracking and super-resolution microscopy. Nat. Methods. 2010; 7:377–381. [DOI] [PMC free article] [PubMed] [Google Scholar]
- 22. Heller I., Sitters G., Broekmans O.D., Farge G., Menges C., Wende W., Hell S.W., Peterman E.J.G., Wuite G.J.L.. STED nanoscopy combined with optical tweezers reveals protein dynamics on densely covered DNA. Nat. Methods. 2013; 10:910–916. [DOI] [PubMed] [Google Scholar]
- 23. Gross P., Farge G., Peterman E.J.G., Wuite G.J.L.. Combining optical tweezers, single-molecule fluorescence microscopy, and microfluidics for studies of DNA–protein interactions. Methods Enzymol. 2010; 475:427–453. [DOI] [PubMed] [Google Scholar]
- 24. Brouwer I., Moschetti T., Candelli A., Garcin E.B., Modesti M., Pellegrini L., Wuite G.J.L., Peterman E.J.G.. Two distinct conformational states define the interaction of human RAD51‐ATP with single‐stranded DNA. EMBO J. 2018; 37:e98162. [DOI] [PMC free article] [PubMed] [Google Scholar]
- 25. Brouwer I., Sitters G., Candelli A., Heerema S.J., Heller I., Melo De A.J., Zhang H., Normanno D., Modesti M., Peterman E.J.G. et al.. Sliding sleeves of XRCC4-XLF bridge DNA and connect fragments of broken DNA. Nature. 2016; 535:566–569. [DOI] [PubMed] [Google Scholar]
- 26. King G.A., Hashemi Shabestari M., Taris K.K.H., Pandey A.K., Venkatesh S., Thilagavathi J., Singh K., Krishna Koppisetti R., Temiakov D., Roos W.H. et al.. Acetylation and phosphorylation of human TFAM regulate TFAM-DNA interactions via contrasting mechanisms. Nucleic Acids Res. 2018; 46:3633–3642. [DOI] [PMC free article] [PubMed] [Google Scholar]
- 27. van Mameren J., Modesti M., Kanaar R., Wyman C., Wuite G.J.L., Peterman E.J.G.. Dissecting elastic heterogeneity along DNA molecules coated partly with rad51 using concurrent fluorescence microscopy and optical tweezers. Biophys. J. 2006; 91:L78–L80. [DOI] [PMC free article] [PubMed] [Google Scholar]
- 28. Hilario J., Amitani I., Baskin R.J., Kowalczykowski S.C.. Direct imaging of human Rad51 nucleoprotein dynamics on individual DNA molecules. Proc. Natl. Acad. Sci. U.S.A. 2009; 106:361–368. [DOI] [PMC free article] [PubMed] [Google Scholar]
- 29. Candelli A., Wuite G.J.L., Peterman E.J.G.. Combining optical trapping, fluorescence microscopy and micro-fluidics for single molecule studies of DNA-protein interactions. Phys. Chem. Chem. Phys. 2011; 13:7263–7272. [DOI] [PubMed] [Google Scholar]
- 30. Backer A.S., Lee M.Y., Moerner W.E.. Enhanced DNA imaging using super-resolution microscopy and simultaneous single-molecule orientation measurements. Optica. 2016; 3:659–666. [DOI] [PMC free article] [PubMed] [Google Scholar]
- 31. Ristic D., Modesti M., van der Heijden T., van Noort J., Dekker C., Kanaar R., Wyman C.. Human Rad51 filaments on double- and single-stranded DNA: correlating regular and irregular forms with recombination function. Nucleic Acids Res. 2005; 33:3292–3302. [DOI] [PMC free article] [PubMed] [Google Scholar]
- 32. Vestergaard C.L., Blainey P.C., Flyvbjerg H.. Optimal estimation of diffusion coefficients from single-particle trajectories. Phys. Rev. E - Stat. Nonlinear, Soft Matter Phys. 2014; 89:022726. [DOI] [PubMed] [Google Scholar]
- 33. Schnitzbauer J., Strauss M.T., Schlichthaerle T., Schueder F., Jungmann R.. Super-resolution microscopy with DNA-PAINT. Nat. Protoc. 2017; 12:1198–1228. [DOI] [PubMed] [Google Scholar]
- 34. Vogelsang J., Kasper R., Steinhauer C., Person B., Heilemann M., Sauer M., Tinnefeld P.. A reducing and oxidizing system minimizes photobleaching and blinking of fluorescent dyes. Angew. Chem. - Int. Ed. 2008; 47:5465–5469. [DOI] [PubMed] [Google Scholar]
- 35. Deng W., Tsao S.W., Lucas J.N., Leung C.S., Cheung A.L.M.. A new method for improving metaphase chromosome spreading. Cytometry. 2003; 51:46–51. [DOI] [PubMed] [Google Scholar]
- 36. Bailey M., Conway L., Gramlich M.W., Hawkins T.L., Ross J.L.. Modern methods to interrogate microtubule dynamics. Integr. Biol. (UK). 2013; 5:1324–1333. [DOI] [PubMed] [Google Scholar]
- 37. Owen D.M., Gaus K.. Imaging lipid domains in cell membranes: the advent of super-resolution fluorescence microscopy. Front. Plant Sci. 2013; 4:503. [DOI] [PMC free article] [PubMed] [Google Scholar]
Associated Data
This section collects any data citations, data availability statements, or supplementary materials included in this article.