

Abstract
A resistant source (S-343) having monogenic dominant resistance to chilli leaf curl virus disease (ChiLCVD) has been identified at Punjab Agricultural University (PAU), Ludhiana. The F2 mapping population of 204 plants was derived from the cross MS-341 (susceptible) × S-343 (resistant) to identify the linked marker with the disease-resistant gene. Out of the 685 single-sequence repeats (SSRs) used, only 160 primers showed parental polymorphism. These 160 polymorphic primers were used for bulk segregant analysis and only eight SSR primers were able to differentiate the resistant and susceptible bulks. The linkage analysis revealed that the two markers CA 516044 and PAU-LC-343-1 were found linked with the disease-resistant gene covering a total distance of 15.7 centimorgan (cM). The two primers CA 516044 and PAU-LC-343-1 were found located on chromosome 6 of the pepper genome at a genetic distance of 6.8 cM and 8.9 cM, respectively, from the resistant gene. The validation of linked markers was performed using 26 resistant and susceptible genotypes developed at PAU, Ludhiana by former researchers. The validation of the primers revealed that there was a correlation between phenotypic and genotypic data of the used genotypes, and these markers can be used for the marker-assisted breeding procedures for transferring ChiLCVD resistance until the gene-based markers will be developed. The markers described in this study are the first-ever molecular markers identified as linked to the ChiLCVD-resistant gene.
Electronic supplementary material
The online version of this article (10.1007/s13205-020-02168-7) contains supplementary material, which is available to authorized users.
Keywords: Capsicum annuum, Molecular mapping, Leaf curl virus, Dominant gene, Resistance, SSRs
Introduction
Chilli pepper is an important crop that belongs to family Solanaceae and comprises about 30 species. It is considered to be originated in tropical and subtropical Americas. Capsicum annuum is the most cultivated and economically important among the five cultivated species. It is grown over a wide range of locations worldwide and includes both sweet and hot peppers. Hot pepper is used as a spice in many parts of the world, and is valued for its sensory attributes of color, pungency, and flavor (Pino et al. 2007).
A number of pathogens including viruses infect chilli pepper at different stages and causes massive production losses. To date, 75 viruses have been reported including 37 ICTV ratified species and further six ICTV candidate species of begomoviruses were detected from Capsicum species (Kenyon et al. 2014). Begomoviruses (Geminiviridae) transmitted by whitefly (Bemisia tabaci) causes huge yield losses to this crop. Chilli leaf curl virus disease (ChiLCVD) is the most disparaging disease in terms of incidence and yield loss; in severe cases, cent percent losses of marketable fruit have been reported (Senanayake et al. 2007, 2012; Kumar et al. 2011, 2015). Control measures, such as natural and synthetic pesticide sprays for vector management, eradication of diseased plants, and cultural control methods, have been tried for various virus disease management without much success. Use of pesticidal sprays results in deteriorating soil health, environmental pollution, and increasing the cost of cultivation (Aktar et al. 2009). Therefore, the phenomena of host plant resistance is a better option to control diseases, especially which are caused by viruses to a larger extent of a certain period of time. Also, the RNAi-mediated broad spectrum transgenic resistance can be build up in chilli to overcome the production losses due to this viral disease (Sharma et al. 2015).
With the development of various molecular techniques, several linkage maps have been developed in the past two decades. Generally, F2, BC1, and Doubled Haploid (DH) populations have been used to construct most of the maps in chilli. In 1988, the first inter-specific genetic map was constructed by Tanskley et al. (1988) in pepper with a wide-genome coverage that contained 85 markers. Till then, many genetic maps have been developed by various researchers (Prince et al. 1993; Livingstone et al. 1999; Kang et al. 2001; Lee et al. 2004; Ben-Chaim et al. 2006; Barchi et al. 2007; Li et al. 2015). This area of research is rapidly adding to the existing knowledge of chilli and will undoubtedly be important in future crop improvement programs. Moreover, the sequenced genome of hot pepper C. annuum cv. CM334 (Criollo de Morelos 334) will help to improve various horticultural traits, biotic and abiotic stresses, and biochemical properties of Capsicum species in future (Kim et al. 2014).
Generally, 6–7 backcrosses are required to transfer a gene into a new genotype, which is a labor intensive and time-consuming process. Therefore, to facilitate the development of ChiLCVD-resistant cultivars, there is dire need to find out the linked markers to the resistant gene(s), so that the requisite period for gene transfer can be reduced. Till date, molecular markers linked to the ChiLCVD are not available in chilli. A total number of 292 known genes of capsicum were listed, including morphological traits, physiological traits, sterility and resistance to diseases, nematodes, and herbicide resistance, but no information on leaf curl virus resistance genes was available (Wang and Bosland 2006). The identified linked marker(s) will not only facilitate the transfer of disease-resistant gene(s) in elite chilli genotypes, but these will also help in identification of new genotypes resistant to ChiLCVD. Therefore, this research work was planned with a desirable proposition to find out the linked marker(s) to leaf curl virus disease-resistant gene and map their location on the chilli genome.
Materials and methods
Plant material
The susceptible line (MS-341) was crossed as a female parent with highly resistant line S-343 to generate F1 (Fig. 1). The F1 plants were grown in March 2016 and simultaneously selfed to produce an F2 mapping population. The seedlings of MS-341, S-343, and F2 population were grown in protrays and screened artificially inside the insect-proof cage during September–October, 2016 using viruliferous whitefly as a vector. The whole F2 population was covered with insect-proof nylon net and allowed to self to produce F2:3 population.
Fig. 1.
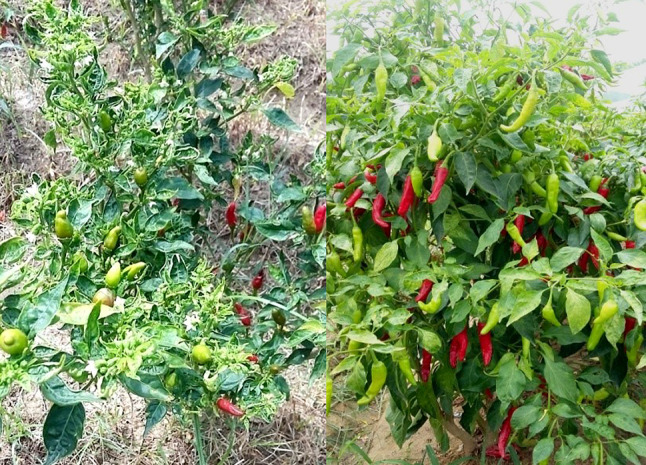
Plants of the two parents MS-341 (left) and S-343 (right) during their field growth stage. Symptoms of ChiLCVD can be easily seen on MS-341 (susceptible), while the symptoms are not seen on S-343 (resistant)
Phenotyping of F2 and F2:3 population
The virus inoculated seedlings of 204 F2 plants were transplanted in the field during February 2017. The variation in symptoms of leaf curl virus disease in F2 plants at nursery stage is presented in Fig. 2. Disease reactions for each plant were scored at nursery stage using a modified method (Sharma et al. 2018) as well as 90 days after transplantation on a symptom severity grade of 0–5. The adult plants with rating 0, 1, and 2 were considered as resistant and plants with rating 3, 4, and 5 as susceptible. A Chi-square test for goodness-of-fit was tested with the hypothesis of monogenic control of resistance to ChiLCVD. The genetic model was considered to be appropriate for a probability (P) value > 0.05.
Fig. 2.

Variation in the symptoms of chilli leaf curl virus disease in the plants of F2 population during artificial screening at nursery stage. (1) Mild puckering of 1–2 leaves. (2) Upward curling and cupping of leaves. (3) Yellowing of interveinal areas and upward curling of leaves. (4) Clearing of veins and yellowing of interveinal areas. (5) Downward and upward curling, inward rolling of the leaves, clearing of veins, and yellowing of interveinal areas
The F2:3 population was screened artificially using viruliferous whitefly as a vector in September–October 2017. This F2:3 was transplanted in the field in February 2018 and disease severity of each plant progeny was worked out 90 days after transplantation. These progenies were then categorized as homozygous resistant, homozygous susceptible, and heterozygous resistant and susceptible.
Single-sequence Repeat (SSR) amplification
Genomic DNA of 204 F2 individual plants along with two parental lines were isolated from the young leaf tissues following the modified method (Doyle and Doyle 1987). Fresh samples were collected in butter paper bags and were transported from the field to the lab in an icebox for isolation. DNA was quantified using spectrophotometer (Nanodrop 1000; Thermo scientific Inc., Waltham, MA USA) and diluted to 100 ng/µl by adding double-distilled autoclaved water. The PCR was performed in a reaction volume of 10 µl containing: 1 µl (100 ng/µl) genomic DNA, 0.6 µl (20 µM) of each forward and reverse primers, 3.5 µl (2 ×) of EmeraldAmp GT PCR Master Mix (DSS Takara Bio India Ltd.), and 4.3 µl of nuclease-free water. A touchdown PCR program was followed to amplify the DNA fragments, that is initial denaturation at 94 °C for 3 min followed by 10 cycles of denaturation at 94 °C for 30 s, annealing at 60 °C (the annealing temperature for each cycle being reduced by 1 °C per cycle) for 1 min and extension at 72 °C for 1 min, and subsequently, 30 cycles of denaturation at 94 °C for 30 s, annealing at 55 °C for 1 min, extension at 72 °C for 1 min, and a final extension at 72 °C for 5 min. The amplified DNA was resolved using 6% polyacrylamide gel using 0.5X Tris–borate EDTA (TBE) buffer containing ethidium bromide (HiMedia Labs. Pvt. Ltd, Mumbai, India) and visualized under UV light in AlphaImagerHP imaging system (Alpha Innotech, USA).
Parental screening and bulk segregant analysis
For parental screening and bulk segregant analysis (BSA), 685 SSR primer pairs were selected from the different linkage maps (Lee et al. 2004; Minamiyama et al. 2006; Yi et al. 2006; Ince et al. 2010). The selected markers were well distributed among all the linkage groups. Out of these 685 SSRs, the map position of only 459 was known, and 226 was not known. As many as 320 primer pairs (97 with known map position and 223 primer pairs with unknown map position) were kindly supplied by Dr Roland Schafleitner, Head of Molecular Genetics, AVRDC–The World Vegetable Center, Taiwan. The sequences and map position of microsatellite markers employed in our experiment are attached as a supplementary file.
To identify molecular markers linked to the ChiLCVD-resistant gene, the two genotypes MS-341 and S-343 were screened to determine the parental polymorphism. The markers, which were found polymorphic among parents, were further used for BSA using susceptible and resistant bulks (Michelmore et al. 1991). For BSA, four resistant and one susceptible bulk was made by pooling 10 μl of DNA from 40 resistant (ten in each bulk) and ten susceptible F2 plants. After doing BSA, the markers showing linkage with the disease-resistant phenotype were verified individually on resistant, heterozygous, and susceptible plants of F2 population to confirm their association with the disease-resistant gene.
After performing BSA, only one marker (CA 516044) was found linked with the resistant gene. The position of the linked marker (CA 516044) was found on the pepper whole genome (Kim et al. 2014) through sequence similarity searches in NCBI BLAST (Madden 2013). The other SSR motifs which were putatively linked to the disease-resistant locus were searched and 40 primers were designed by screening 50 kb sequence information upstream and downstream of the physical location of marker CA 516044 from the pepper whole-genome sequence using BatchPrimer3 v1.0 software.
Genotyping of F2 and linkage analysis
The markers which were found linked with the disease-resistant gene in the bulk segregant analysis were used for the genotyping of the F2 population. Chi-square test was used to determine the goodness-of-fit for the observed segregation ratio of co-dominant markers to the predicted segregation ratios of 1:2:1 or 3:1 according to the mode of inheritance of a monogenic dominant gene. For linkage studies, the plants with disease severity grade 0 and 1 were considered resistant, with grade 4 and 5 were considered susceptible and plants with grade 2 and 3 were considered heterozygous. While analyzing the data letter 'A' was assigned to the susceptible plants similar to susceptible parent MS-341, letter 'B' to the resistant plants similar to resistant parent S-343 and letter ‘H’ to the heterozygous plants between both the parents. MapMaker 3.0 (Lander et al. 1987) software was used to determine the linkage distance between ChiLCVD-resistant gene and the linked SSR markers to generate the linkage map. The linkage group that harbors the disease-resistant gene was established at LOD 3.0 by choosing a maximum distance of 50.0 centimorgan (cM) and using the kosambi mapping function.
Validation of markers
The identified linked markers were validated using the resistant and susceptible genotypes reported by former researchers at Punjab Agricultural University (PAU), Ludhiana (Dhaliwal et al. 2013; Ahmad et al. 2016; Thakur et al. 2017). A total of 26 resistant and susceptible chilli genotypes were used to validate the functioning of linked markers, viz., CA 516044 and PAU-LC-343-1. The genotypes, namely S-343 and MS-341, were used as check for resistance and check for susceptibility, respectively.
Results
Phenotyping of F2 and F2:3 population
The phenotype of artificially screened F2 plants was determined based on the disease severity grade. Out of the 204 F2 plants, 160 were found resistant and 44 were susceptible. The disease-resistant gene in S-343 was found to be monogenic dominant as the F2 segregated into 3:1 (resistant: susceptible) which was reported earlier by (Thakur et al. 2019). The results of Chi-square analysis indicated a good fit of this ratio in the hypothesis. Also, the frequency distribution curve was of skewed type, meaning to the non-involvement of QTL characteristics in controlling resistance (Fig. 3). To confirm the phenotypic reaction of an F2 plant, F2:3 single-plant progenies consisting of 15 plants each were grown. Out of the 160 F2-resistant plants, the seeds of only 136 were able to germinate. Out of these 136 plant progenies, 45 showed a homozygous resistant reaction and 89 showed a heterozygous reaction. Only 15 plants were able to bear fruits (seed) out of the 44 highly susceptible F2 plants, of which seeds of only nine plants germinated. All the plants of these nine progenies showed a homozygous susceptible reaction. The schematic representation of complete procedure of crossing and development of F2 mapping population and F2:3 are presented in Fig. 4.
Fig. 3.
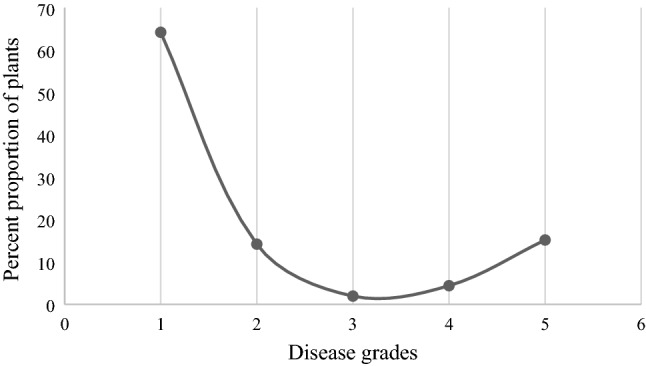
Percent proportion of plants with different disease grades in an F2 population of 204 plants
Fig. 4.

Schematic representation of development of F2 mapping population for genotyping and F2:3 for the confirmation of genetics of resistance
Parental screening and bulk segregant analysis
The parental screening was done to find out sufficient polymorphism among the two parents using 685 SSR primer pairs. The polymorphism consisted of upper and lower DNA amplicon or a difference in fluorescence intensity between the two DNA samples. The polyacrylamide gel electrophoresis (PAGE) was performed in spite of agarose gel electrophoresis as it was observed in earlier studies that the amount of polymorphism revealed in the agarose gel was 6.27% as compared to 21.68% in the PAGE (Aulakh et al. 2016). In this study, 160 SSR primers out of 685 were capable of giving sufficient polymorphism among the two parents with polymorphic percentage of 23.35%. The primers which showed polymorphism among parents were used for bulk segregant analysis approach (Michelmore et al. 1991).
In BSA, eight primers pairs, viz., CA 516044, PAU-LC-343-1, CA 516334, Hpms E080, Hpms E070, CAMS 460, AVRDC MD*850, and AVRDC PP 188, showed sufficient polymorphism and differentiated parents, and resistant and susceptible bulks. Four primer pairs (CA 516044, PAU-LC-343-1, AVRDC PP 188, and AVRDC*MD 850) which showed polymorphism in all the four resistant and one susceptible bulk with high polymorphic intensity were further used to amplify DNA of individual plants used for making the resistant and susceptible bulks. Out of the four primers used, only two primers, viz., CA 516044 and PAU-LC-343-1, were able to differentiate the resistant, susceptible, and heterozygous plants. It was observed that the marker AVRDC PP 188 did not showed segregation in F2 individual plants, and another marker AVRDC*MD 850 amplified more complex bands and was not suitable for scoring alleles in the F2 population. Therefore, the two markers, viz., CA 516044 and PAU-LC-343-1, were only found suitable for the genotyping of whole F2 population of 204 plants. The characteristics of these two markers are presented in Table 1.
Table 1.
Characteristics of the SSR markers used for screening the mapping F2 population
| Marker | Primer sequence | Fragment size | Annealing temp Tm (°C) | Source |
|---|---|---|---|---|
| CA 516044 |
ATTTTCTTTTCATTTCCCCCTTT (F) T GCTCAGCATTAACGACGTC (R) |
194 | 52.1 | AVRDC, Taiwan |
| PAU-LC-343-1 |
TGTGTGTGTGTAAATCTCCAA (F) ACGGCATGTAAATAAAGTTCA (R) |
171 | 54.9 | PAU, Ludhiana |
Genotyping of F2 and linkage analysis
The marker data for individual F2 plants were recorded as ‘A’ (MS-341), ‘B' (S-343), and the heterozygote between these two was recorded as 'H'. The frequency of these three types (A, B, and H) was recorded in the F2 population and segregation pattern of the disease-resistant gene was studied. The genotyping of the F2 population was done using only two markers, viz., CA 516044 and PAU-LC-343-1 (Figs. 5 and 6). The Chi-square analysis of segregation of the two selected markers in the F2 population are presented in Table 2. The calculated χ2cal values of these two markers CA 516044 and PAU-LC-343-1 were 2.86 and 2.11, respectively. The χ2cal was less than the tabulated value of χ2tab (5.99) at 5% level of significance with two degrees of freedom. The observed Chi-square value was low and acceptable at higher stringencies of P = 0.24 (CA 516044) and 0.34 (PAU-LC-343-1) for the above two markers, respectively. Thus, the estimates of Chi-square analysis revealed that the segregation data fitted well in the genotypic ratio (1:2:1) as expected for a single dominant gene of the cross "MS-341 × S-343".
Fig. 5.

Genotyping of F2 individuals by primer CA 516044. Here, P1: MS 341 (Susceptible parent), P2: S-343 (resistant parent), A: MS-341 type, B: S-343 type, and H: Heterozygous between A/B
Fig. 6.

Genotyping of F2 individuals by primer PAU-LC-343-1. Here, P1: MS 341 (Susceptible parent), P2: S-343 (resistant parent), A: MS-341 type, B: S-343 type, and H: Heterozygous between A/B
Table 2.
Segregation of marker CA 516044 and PAU-LC-343-1 in F2 population of cross MS-341 × S-343
| Marker | No of plants with allele | Total Σ{(O − E)2/E} | P | |||
|---|---|---|---|---|---|---|
| A | H | B | ||||
| CA516044 | 46 | 114 | 44 | 204 | 2.86 | 0.24 |
| PAU-LC-343-1 | 54 | 108 | 42 | 204 | 2.11 | 0.34 |
| Phenotype (F2) | 44 (susceptible) | 160 (resistant) | 204 | |||
The phenotypic data of F2 population were compiled as susceptible (A), resistant (B), and heterozygous resistant and susceptible (H), which was then computed along with the marker data of the linked marker with the gene. The analysis revealed that the two candidate markers CA 516044 and PAU-LC-343-1 were found linked with the disease-resistant gene covering a total distance of 15.7 cM (Fig. 7). The genetic distance between the disease-resistant gene and the closest marker CA 516044 was estimated to be 6.8 cM. The other marker PAU-LC-343-1 was located at 8.9 cM away from the resistant gene. Initially, only one marker, i.e., CA 516044, was found linked with the disease-resistant gene; later, all the markers located on linkage group six from various linkage maps (Lee et al. 2004; Minamiyama et al. 2006; Yi et al. 2006; Ince et al. 2010) were used to find out the polymorphism between parents and bulks, but none of these markers was able to show polymorphism. The location of the linked marker CA 516044 was known from the genome of chilli and 40 primers were synthesized by considering 50 kb region upstream and downstream of the linked marker CA 516044 using BatchPrimer 3 software. Out of these 40, ten primers were found polymorphic among parents and one primer was found polymorphic in bulk segregant analysis. This marker was then used to genotype the whole F2 population and it was also found linked to the disease-resistant gene. The failure to detect linkage by any other markers could be due to chromosomal rearrangements around this locus in S-343 compared to the pepper line "CM334" sequenced in 2014 (Kim et al. 2014). Second, the Capsicum genome is a draft genome and the SSR marker sequences used for BLAST search being very short (150–250 bp including the repeat); there is a possibility of misaligning of the SSR sequence with the assembly. Also, the contig from which SSRs were identified might be from another linkage group.
Fig. 7.

Linkage map of the disease-resistant gene and SSR markers CA 516044 and PAU-LC-343-1 using MapMaker 3.0 software
Validation of linked markers
A total of 26 resistant and susceptible chilli genotypes were used to validate the functioning of linked markers, viz., CA 516044 and PAU-LC-343-1 (Figs. 8 and 9). The genotypes, namely S-343 (check for resistance), SL 456, AC 102, SL 473, SL-475, DL 161, and C-142, showed a resistant reaction in the field and artificial screening and these were also showing banding pattern similar to S-343. Also the genotypes which were showing a susceptible reaction in field, viz., MS-341 (check for susceptibility), IS 267, IS 269, FL-201, VR 521, C 149, ML-342, IS 271, Punjab Sindhuri, PP 416, PAU 114, IS 270, IS 261, PLS-13, and PAU 211 also showed the banding pattern similar to the check MS-341. The genotypes, viz., JL 282, PE-415, SL-466, and SL 468, which were showing a moderate resistant reaction in the artificial screening, revealed the banding pattern similar to the susceptible check.
Fig. 8.

Validation of primer CA 516044 using resistant and susceptible chilli genotypes developed at Punjab Agricultural University, Ludhiana
Fig. 9.

Validation of primer PAU-LC-343-1 using resistant and susceptible chilli genotypes developed at Punjab Agricultural University, Ludhiana
Discussion
The foremost purpose of the present study was to identify the molecular markers linked with the ChiLCVD-resistant gene and to map their position on the Capsicum genome. Also, the study of the genetics of a gene is the most important element of a study including molecular mapping of the gene. Earlier, the genetics of resistance for ChiLCVD was reported to be controlled by a single recessive gene (reviewed by Thakur et al. 2018), but in our study, it was controlled by a single dominant gene (Thakur et al. 2019). The phenotypic segregation data of F2 population confirmed that the resistance of S-343 against ChiLCVD is controlled by a single dominant gene. A single dominant gene is easy to transfer in new elite genotypes as compared to recessive gene, because in transferring of a dominant gene consecutive backcrosses are made, while in transferring, a recessive gene selfing is needed after every two backcrosses, which is time-consuming and labor intensive. Also, it will be easier to transfer the dominant gene identified in this study using the marker-assisted breeding program.
The level of polymorphism shown by a polymorphic marker is of major concern in molecular breeding. The lower amount of DNA polymorphism in any crop species hinders the application of molecular markers in molecular breeding programs. However, the massive importance of the SSR markers in the molecular breeding of low polymorphic crops was suggested earlier (Minamiyama et al. 2006). The less polymorphism (23.35%) exhibited in this study among SSR markers may be due to the reason that the parents selected for developing the mapping population belonged to the same cultivated species. Also, it was suggested earlier that the lower polymorphism level using SSR markers was due to the genetic relatedness of parents belonging to species which comes under annuum complex (Arjun et al. 2018). A lower polymorphism of 21% among the parents used for mapping of male-sterile gene ms-10 using SSR markers in hot pepper was also reported in another study (Aulakh et al. 2016). Similarly, lower polymorphism of 24% has been reported in a mapping population developed from an intra-specific cross using SSR markers (Minamiyama et al. 2006). Consequently, the use of inter-specific crosses for developing mapping populations in the low polymorphic species is sometimes suggested.
Out of the eight polymorphic markers in BSA, three primers, viz., CA 516044, PAU-LC-343-1, and CA 516334, were present on linkage group 6, two were on 11th (Hpms E080, Hpms E070), and AVRDC*MD 850 and CAMS 460 were on first and seventh, respectively. The position of one primer, AVRDC PP 188, was not known. The failure of the other markers from chromosome six to detect linkage with the disease-resistant gene could be due to their farther location from the linked marker CA 516044. The linkage analysis revealed that the two candidate markers CA 516044 and PAU-LC-343-1 were found linked with the disease-resistant gene covering a total distance of 15.7 cM. The genetic distance between the disease-resistant gene and the closest marker CA 516044 was estimated to be 6.8 cM. The other marker PAU-LC-343-1 was located at 8.9 cM away from the resistant gene. These two primers were located on chromosome 6, the total length of chromosome 6 was 219,521,584 bp, and the position of CA 516044 was 4,902,426–4,902,619 bp and position of PAU-LC-343-1 was 4,861,289–4,861,459 bp on the pepper genome sequence (Kim et al. 2014). Although the identified markers are a bit far from the resistant gene, but there is no report of markers linked with the ChiLCVD-resistant gene so far. Therefore, this study can provide insight into the identification of more closely linked markers by developing a larger and permanent mapping population, changing the type of molecular markers, and by increasing their number. We have tried to locate the SSRs more closely to the gene, but the second SSR (8.9 cM) was found farther than the first one (6.8 cM).
The validation of the markers using resistant and susceptible chilli genotypes revealed that there was a correlation between the phenotypic and genotypic data. Out of the 26 genotypes studied, the phenotypic and genotypic data were similar for 22 resistant and susceptible genotypes. The susceptible reaction of the moderately resistant lines in the genotypic data may be due to the presence of a different resistant gene from the gene present in the above-mentioned resistant lines. Therefore, chilli breeders will now be benefitted from the marker-assisted based selection of the plants carrying disease-resistant gene for leaf curl virus resistance. Use of these markers can narrow the breeding population and it can also reduce the time required for the transfer of disease-resistant gene. The identified markers will now offer a precise and valuable tool for positive selection of a plant carrying ChiLCVD-resistant gene and thus greatly facilitate the resistance breeding. To our knowledge, these markers are the first-ever markers identified linked to the ChiLCVD-resistant gene.
Electronic supplementary material
Below is the link to the electronic supplementary material.
Acknowledgements
The authors are thankful to Confederation of Indian Industry, Department of Science and Technology and Verdenta Hybrid Seeds Pvt. Ltd. for providing Prime Minister’s Fellowship to Hament Thakur.
Author contributions
HT, SKJ, and AS conceived the experiments and wrote the original manuscript; SKJ, AS, and MSD revised the manuscript and supervise the experiments.
Compliance with ethical standards
Conflict of interest
The authors declare no competing interests.
References
- Ahmad A, Sharma A, Zehra SB, Kang SS, Bhat M, Hussain A. Evaluation of chilli genotypes against Chilli leaf curl virus. Indian J Ecol. 2016;43:144–147. [Google Scholar]
- Aktar W, Sengupta D, Chowdhury A. Impact of pesticides use in agriculture: their benefits and hazards. InterdiscipToxicol. 2009;2:1–2. doi: 10.2478/v10102-009-0001-7. [DOI] [PMC free article] [PubMed] [Google Scholar]
- Arjun K, Dhaliwal MS, Jindal SK, Fakrudin B. Mapping of fruit length related QTLs in interspecific cross (Capsicum annuum L.×Capsicum galapagoenseHunz.) of chilli. Breed Sci. 2018;68:219–226. doi: 10.1270/jsbbs.17073. [DOI] [PMC free article] [PubMed] [Google Scholar]
- Aulakh PS, Dhaliwal MS, Jindal SK, Schafleitner R, Singh K. Mapping of male sterility gene ms10 in chilli pepper (Capsicum annuum L.) Plant Breed. 2016;135:531–535. doi: 10.1111/pbr.12389. [DOI] [Google Scholar]
- Barchi L, Bonnet J, Boudet C, Signoret P, Nagy I, Lanteri S, Palloix A, Lefebvre V. A high-resolution, intraspecific linkage map of pepper (Capsicum annuum L.) and selection of reduced recombinant inbred line subsets for fast mapping. Genome. 2007;50:51–60. doi: 10.1139/g06-140. [DOI] [PubMed] [Google Scholar]
- Ben-Chaim A, Borovsky Y, Falise M, Mazourek M, Kang BC, Paran L, Jahn M. QTL analysis for capsaicinoid content in capsicum. TheorAppl Genet. 2006;113:1481–1490. doi: 10.1007/s00122-006-0395-y. [DOI] [PubMed] [Google Scholar]
- Dhaliwal MS, Jindal SK, Cheema DS. Punjab Sindhuri and Punjab Tej: new varieties of chilli. J Res Punjab AgricUniv. 2013;50:79–81. [Google Scholar]
- Doyle JJ, Doyle JL. A rapid DNA isolation procedure for small quantities of fresh leaf tissue. PhytoChem Bull. 1987;19:11–15. [Google Scholar]
- Ince AG, Karaca M, Onus AN. Polymorphic microsatellite markers transferable across Capsicum species. Plant MolBiol Rep. 2010;28:285–291. doi: 10.1007/s11105-009-0151-y. [DOI] [Google Scholar]
- Kang BC, Nahm SH, Huh JH, Yoo HS, Yu JW, Lee MH, Kim BD. An interspecific (Capsicum annuum × C. chinese) F2 linkage map in pepper using RFLP and AFLP markers. Theor Appl Genet. 2001;102:531–539. doi: 10.1007/s001220051678. [DOI] [Google Scholar]
- Kenyon L, Kumar S, Tsai WS, Hughes JDA. Advances in virus research. New York: Academic; 2014. Virus diseases of peppers (Capsicum spp.) and their control; pp. 297–335. [DOI] [PubMed] [Google Scholar]
- Kim S, Park M, Yeom SI, Kim YM, et al. Genome sequence of the hot pepper provides insights into the evolution of pungency in Capsicum species. Nat Genet. 2014;46:270–279. doi: 10.1038/ng.2877. [DOI] [PubMed] [Google Scholar]
- Kumar S, Kumar R, Kumar S, Singh AK, Singh M, Rai AB, Rai M. Incidence of leaf curl disease on capsicum germplasm under field conditions. Indian J Agric Sci. 2011;8:187–189. [Google Scholar]
- Kumar RV, Singh AK, Singh AK, Yadav T, Basu S, Kushwaha N, Chattopadhyay B, Chakraborty S. Complexity of begomovirus and betasatellite populations associated with chilli leaf curl disease in India. J Gen Virol. 2015;96:3143–3158. doi: 10.1099/jgv.0.000254. [DOI] [PubMed] [Google Scholar]
- Lander ES, Green P, Abrahamson J, Barlow A, Daly MJ, Lincoln SE, Lee N. MAPMAKER: an interactive computer package for constructing primary genetic linkage maps of experimental and natural populations. Genomics. 1987;1:174–181. doi: 10.1016/0888-7543(87)90010-3. [DOI] [PubMed] [Google Scholar]
- Lee JM, Nahm SH, Kim YM, Kim BD. Characterization and molecular genetic mapping of microsatellite loci in pepper. TheorAppl Genet. 2004;108:619–627. doi: 10.1007/s00122-003-1467-x. [DOI] [PubMed] [Google Scholar]
- Li W, Cheng J, Wu Z, Qin C, Tan S, Tang X, Cui J, Zhang L, Hu K. An InDel-based linkage map of hot pepper (Capsicumannuum L.) Mol Breed. 2015;35:32. doi: 10.1007/s11032-015-0219-3. [DOI] [PMC free article] [PubMed] [Google Scholar]
- Livingstone KD, Lackney VK, Blauth JR, Wijk R, Jahn MK. Genome mapping in capsicum and the evolution of genome structure in the Solanaceae. Genetics. 1999;152:1183–1202. doi: 10.1093/genetics/152.3.1183. [DOI] [PMC free article] [PubMed] [Google Scholar]
- Madden T (2013) The BLAST sequence analysis tool. In: The NCBI handbook [Internet], 2nd edn. https://www.ncbi.nlm.nih.gov/books/NBK153387/
- Michelmore RW, Paran I, Kessel RV. Identification of markers linked to disease-resistance genes by bulked segregant analysis: a rapid method to detect markers in specific genomic regions by using segregating populations. Proc Natl Acad Sci. 1991;88:9828–9832. doi: 10.1073/pnas.88.21.9828. [DOI] [PMC free article] [PubMed] [Google Scholar]
- Minamiyama Y, Tsuro M, Hirai M. An SSR-based linkage map of Capsicum annuum. Mol Breed. 2006;18:157–169. doi: 10.1007/s11032-006-9024-3. [DOI] [Google Scholar]
- Pino J, Gonzalez M, Ceballos L, Centurion-Yah AR, Trujillo-Aguirred J, Latournerie- Moreno L, Sauri-Duch E. Characterization of total capsaicinoidscolour and volatile compounds of Habanero chili pepper (Capsicum ChinenseJack.) cultivars grown in Yucatan. Food Chem. 2007;104:1682–1686. doi: 10.1016/j.foodchem.2006.12.067. [DOI] [Google Scholar]
- Prince JP, Pochard E, Tanskley SD. Construction of a linkage map of pepper and a comparison of syntony with tomato. Genome. 1993;36:404–417. doi: 10.1139/g93-056. [DOI] [PubMed] [Google Scholar]
- Senanayake DMJB, Mandal B, Lodha S. Varma A (2007) First report of Chilli leaf curl virus affecting chilli in India. Plant Pathol. 2007;56:343. doi: 10.1111/j.1365-3059.2007.01513.x. [DOI] [Google Scholar]
- Senanayake DMJB, Varma A, Mandal BJ. Virus–vector relationships, host range, detection and sequence comparison of chilli leaf curl virus associated with an epidemic of leaf curl disease of chilli in Jodhpur. Indian Phytopathol. 2012;160:146–155. doi: 10.1111/j.1439-0434.2011.01876.x. [DOI] [Google Scholar]
- Sharma A, Jindal SK, Thakur H. Phenotypic classes of leaf curl virus disease severity for nursery screening in chilli pepper. Pl Dis Res. 2018;33:99–103. [Google Scholar]
- Sharma VK, Basu S, Chakraborty S. RNAi mediated broad-spectrum transgenic resistance in Nicotiana benthamiana to chilli-infecting begomoviruses. Plant cell Rep. 2015;34:1389–1399. doi: 10.1007/s00299-015-1795-8. [DOI] [PubMed] [Google Scholar]
- Tanskley SD, Bernatzky R, Lapitan NL, Prince JP. Conservation of gene repertoire but not gene order in pepper and tomato. Proc Natl Acad Sci USA. 1988;85:6419–6423. doi: 10.1073/pnas.85.17.6419. [DOI] [PMC free article] [PubMed] [Google Scholar]
- Thakur H, Jindal SK, Sharma A, Dhaliwal MS (2017) Identification of resistant sources against chilli leaf curl virus disease. In: Indo-US symposium; Curbing whitefly—plant virus pandemics—The departure from pesticides to genomics solutions, Punjab Agricultural University, Ludhiana, Punjab, Abstr. No.: B14, p 72
- Thakur H, Jindal SK, Sharma A, Dhaliwal MS. Chilli leaf curl virus disease: a serious threat for chilli cultivation. J Plant Dis Protect. 2018;125:239–249. doi: 10.1007/s41348-018-0146-8. [DOI] [Google Scholar]
- Thakur H, Jindal SK, Sharma A, Dhaliwal MS. A monogenic dominant resistance for leaf curl virus disease in chilli pepper (Capsicum annuum L.) Crop Prot. 2019;116:115–120. doi: 10.1016/j.cropro.2018.10.007. [DOI] [Google Scholar]
- Wang D, Bosland PW. Thegenes of Capsicum. HortScience. 2006;41:1169–1187. doi: 10.21273/HORTSCI.41.5.1169. [DOI] [Google Scholar]
- Yi G, Lee JM, Lee S, Choi D, Kim BD. Exploitation of pepper EST-SSRs and an SSR-based linkage map. Theor Appl Genet. 2006;114:113–130. doi: 10.1007/s00122-006-0415-y. [DOI] [PubMed] [Google Scholar]
Associated Data
This section collects any data citations, data availability statements, or supplementary materials included in this article.