

Abstract
The human hs1.2 enhancer within the Ig heavy chain gene (IGH) is polymorphic and associated with a number of autoimmune diseases. The polymorphic region is characterized by tandem repeats of an ~53-bp invariant sequence containing possible binding sites for several transcription factors. Our previous studies suggest the human hs1.2 enhancer is sensitive to 2,3,7,8-tetrachlorodibenzo-p-dioxin (TCDD), an environmental toxicant and high affinity ligand of the aryl hydrocarbon receptor (AhR). TCDD induced hs1.2 enhancer activity in an AhR-dependent manner and the number of invariant sequences influenced the magnitude of activity. To better understand the regulation of human hs1.2 enhancer activity, the objective of the current study was to utilize mutational analysis and luciferase reporter constructs to evaluate the contribution of putative transcription factor binding sites to overall hs1.2 enhancer activity and modulation by TCDD. Basal and LPS-induced activity of the hs1.2 enhancer appeared to be most affected by mutation of sites outside of the invariant sequence or deletion of the entire invariant sequence; whereas sites influencing the effect of TCDD were dependent on the cellular activation state (i.e. unstimulated vs. LPS stimulation) and relatively independent of the putative AhR binding site within the invariant sequence. These results suggest that AhR activation affects human hs1.2 activity through an as yet undetermined non-canonical pathway. A better understanding regarding the role of the hs1.2 enhancer in human Ig expression and how AhR ligands modulate its activity may lead to insights into overall Ig regulation and mechanisms of dysfunction.
Keywords: aryl hydrocarbon receptor, transcription factors, gene regulation, 3′IGH regulatory region, immunoglobulin, TCDD
1. INTRODUCTION
The immunoglobulin heavy chain (Igh)1 gene, which encodes antigen-specific Ig heavy chain protein of a specific isotype (i.e. μ, δ, γ, ε, or α), is an essential component in maintaining immunity but also has a potential role in human disease processes (i.e., autoimmunity, hypersensitivity, and B-cell lymphomas) (Brandtzaeg 2003, Vincent-Fabert et al. 2010, Xiang et al. 2011, Gadermaier et al. 2014, Ludwig et al. 2017). Transcriptional regulation of Igh expression is complex and not fully understood but several transcriptional elements within the Igh gene locus have been identified such as the variable heavy chain promoter (VH), intronic enhancer (Eμ), intronic germline promoters upstream of each heavy chain constant region, and the 3′ Ig heavy chain regulatory region (3′IghRR) (Fig. 1) (Roy et al. 2011). In vivo mouse models have identified an essential role of the mouse 3′IghRR in modulating transcription of the Igh gene, class switch recombination (CSR) and somatic hypermutation (Vincent-Fabert et al. 2010, Pinaud et al. 2011, Rouaud et al. 2013). However, the current understanding of Igh transcriptional expression and the 3′IghRR has primarily been limited to mouse models. Although the mouse Igh gene and the human homolog (i.e. IGH) are structurally similar, there are some notable differences including an evolutionary duplication in the human IGH gene resulting in two 3′IGHRRs with distinct heavy chain constant regions upstream of each 3′IGHRR (Fig. 1) (Chen and Birshtein 1997, Mills et al. 1997, Pinaud et al. 1997, Sepulveda et al. 2005). Additionally, the mouse 3′IghRR consists of at least four enhancers (hs3a; hs1.2; hs3b; hs4) as opposed to three enhancers in the human 3′IGHRR (hs3; hs1.2; hs4) (Mills et al. 1997). These enhancers contain numerous transcription factor-binding sites that likely play a complex role in regulating enhancer activity (Khamlichi et al. 2000, Kim et al. 2004, Giambra et al. 2005, Pinaud et al. 2011). Of particular interest is the human hs1.2 enhancer within the most upstream 3′IGHRR (i.e. 3′IGHRR-1) (Fig. 1B), which contains a polymorphic region that has been associated with many immunological disorders such as systemic lupus erythematosus, dermatitis herpetiformis, plaque psoriasis, psoriatic arthritis, rheumatoid arthritis, systemic sclerosis, celiac disease, IgA deficiency, IgA nephropathy, and even AIDS progression (Aupetit et al. 2000, Frezza et al. 2004, Guglielmi et al. 2004, Giambra et al. 2005, Frezza et al. 2007, Cianci et al. 2008, Tolusso et al. 2009, Frezza et al. 2012, Montesano et al. 2014). These structural differences in the mouse vs. human IGH gene suggest the possibility of functional differences in regulation.
Figure 1. Comparison of the mouse and human Ig heavy chain genes.

A) Mouse Ig heavy chain gene and B) human Ig heavy chain gene with the possible hs1.2 enhancer alleles found in the human population. The hs1.2 enhancer (underlined) is sensitive to AhR ligands and the human hs1.2 enhancer is polymorphic with 1 to 4 ~53 bp invariant sequence repeats (denoted by asterisks), which represent the different alleles (i.e. A, B, C, or D). VH, variable heavy chain promoter; VDJ, variable region; Eμ, intronic or μ enhancer; Greek letters, constant regions (IGHC) encoding different heavy chain isotypes (e.g. α encodes the heavy chain protein for IgA); open rectangles, germline promoters upstream of each constant region; 3′IghRR, mouse 3′Igh regulatory region (A); 3 ′IGHRR, human 3′IGH regulatory region (B). C) Human and mouse hs1.2 enhancers with predicted binding sites (Michaelson et al. 1996, Mills et al. 1997, Chen and Birshtein 1997, Denizot et al. 2001, Kim et al. 2004, Sepulveda et al. 2005, Giambra et al. 2005, Fernando et al. 2012). Adjacent transcription factor binding sites are italicized and underlined with nucleotides overlapping two binding sites in smaller case.
Our previous results have identified the mouse 3′IghRR as a sensitive target of numerous chemicals, particularly ligands of the aryl hydrocarbon receptor (AhR), such as 2,3,7,8-tetrachlorodibenzo-ρ-dioxin (TCDD) (Sulentic et al. 2004, Henseler et al. 2009, Romer and Sulentic 2011, Sharma et al. 2013, Salisbury and Sulentic 2015, Wourms and Sulentic 2015). Further analysis of the polymorphic human hs1.2 enhancer also demonstrated sensitivity to TCDD. However, unlike the mouse 3′IghRR and mouse hs1.2 enhancer whose activity was inhibited by TCDD, the polymorphic human hs1.2 enhancer was activated by TCDD (Fernando et al. 2012). AhR-mediated inhibition of the mouse 3′IghRR and hs1.2 enhancer is AhR-dependent (Wourms and Sulentic 2015) and appears to be mediated by binding of the AhR and its binding partner, AhR nuclear translocator (ARNT), to dioxin response elements (DRE), which altered the NFκB/Rel protein binding profile within the hs1.2 enhancer (Salisbury and Sulentic 2015). Sequence comparison suggests conservation of several transcription factor-binding sites between the mouse and human hs1.2 enhancers, including putative κB binding sites for NFκB/Rel proteins and perhaps the AhR due to the presence of a DRE-core motif (Fig. 1C) (Michaelson et al. 1996, Mills et al. 1997, Kim et al. 2004, Sepulveda et al. 2005, Fernando et al. 2012). However, there are also marked differences in that the human hs1.2 enhancer does not contain Pax5 binding sites. The mouse hs1.2 enhancer has two Pax5 binding sites, which play an inhibitory role on hs1.2 enhancer activity (Fig. 1C) (Michaelson et al. 1996, Mills et al. 1997, Kim et al. 2004, Sepulveda et al. 2005, Fernando et al. 2012). TCDD has been shown to increase Pax5 stability, perhaps partially explaining the inhibition of mouse hs1.2 enhancer activity by TCDD (Yoo et al. 2004, Fernando et al. 2012).
The human hs1.2 polymorphism consists of tandem repeats of an ~53-bp invariant sequence, which is present one, two, three or four times (i.e. hs1.2 allele A, B, C, or D, respectively) (Fig. 1B) (Denizot et al. 2001, Giambra et al. 2005, D’Addabbo et al. 2011, Fernando et al. 2012). The invariant sequence contains putative transcription factor binding sites for NFκB/Rel, the AhR, AP-1, and nuclear factor 1 (NF1) (Fig. 1C) (Chen and Birshtein 1997, Denizot et al. 2001, Giambra et al. 2005, Fernando et al. 2012). Therefore, an increased number of the invariant sequence repeats results in more potential binding sites for these transcription factors and the number of invariant sequence repeats appear to influence transcriptional activity, Ig levels, and the association with several autoimmune or hypersensitivity disease states (Aupetit et al. 2000, Frezza et al. 2004, Guglielmi et al. 2004, Giambra et al. 2005, Frezza et al. 2007, Cianci et al. 2008, Frezza et al. 2009, Giambra et al. 2009, Tolusso et al. 2009, Fernando et al. 2012, Frezza et al. 2012, Montesano et al. 2014). In addition to the transcription factor binding sites within the invariant sequence, there are also binding sites for AP-1/ETS, POU (Octamer-binding protein), and Sp-1 outside of the invariant sequence that may be important to hs1.2 activity (Fig. 1C) (Mills et al. 1997, Kim et al. 2004, Frezza et al. 2009). Exogenous factors (i.e. stimulation and/or xenobiotics) likely influence binding of transcription factors to putative sites outside and within the invariant sequence leading to altered hs1.2 enhancer activity and Ig expression.
To determine the relative contribution of each putative transcription factor binding site to the activity of the basic human hs1.2 enhancer, site-directed mutagenesis of a luciferase reporter containing allele A (i.e. one invariant sequence) of the human 3′IGHRR-1 hs1.2 enhancer was conducted, and the resultant mutants were analyzed under exposure to TCDD and/or cellular stimulation induced by LPS treatment in the CH12.LX mouse B-cell line. The CH12.LX cell line has been extensively used to evaluate B-cell activation, Ig expression and class switch recombination (Arnold et al. 1983, LoCascio et al. 1984, Bishop and Haughton 1986, Kunimoto et al. 1988, Whitmore et al. 1989, Bishop et al. 1990, Strober et al. 1991, Whitmore et al. 1991, Bishop 1992, Kunimoto et al. 1993, Louie et al. 1993, Wakatsuki and Strober 1993, Neurath et al. 1994, Wakatsuki et al. 1994, Usui et al. 1997, Kimura et al. 2000). This cell line also expresses a well-characterized and functioning AhR signaling pathway and therefore has served as a model to evaluate the molecular mechanisms involved in the inhibitory effect of TCDD on B-cell activation and Ig expression (Sulentic et al. 1998, Sulentic et al. 2000, Suh et al. 2002, Crawford et al. 2003, Boverhof et al. 2004, Sulentic et al. 2004, Yoo et al. 2004, Schneider et al. 2008, Henseler et al. 2009, Schneider et al. 2009, De Abrew et al. 2010, North et al. 2010, Fernando et al. 2012, Sharma et al. 2013, Salisbury and Sulentic 2015).
We identified the AP-1/ETS and NF1 sites as positive regulators of hs1.2 enhancer activity; whereas most of the other transcription factor binding sites were generally, to varying degrees, negative regulators of basal hs1.2-induced transcriptional activity. Surprisingly, only the POU and putative NF1 binding sites were found to be significant mediators of TCDD-induced activation of the human hs1.2 enhancer but at different B-cell activation states. The other transcription factor binding sites, including the DRE core motif, had modest to no impact on TCDD-induced activation of the human hs1.2 enhancer. These results suggest TCDD affects human hs1.2 enhancer activity through an as yet undetermined non-canonical AhR signaling pathway rather than the canonical pathway of transactivation through DRE binding of the AhR:ARNT heterodimer. A better understanding regarding the role of the hs1.2 enhancer in human Ig expression and how TCDD modulates its activity may lead to insights into overall Ig regulation and mechanisms of dysfunction, as well as further defining the relationship between Ig-mediated disorders and the hs1.2 polymorphism.
2. MATERIALS AND METHODS
2.1. Chemicals and Reagents
TCDD in 100% DMSO was purchased from AccuStandard, Inc. (New Haven, CT) and the certificate of analysis reported 99.1% purity. LPS (Escherichia coli) and DMSO were purchased from Sigma Aldrich (St. Louis, MO). The LPS was dissolved in sterile-filtered 1x PBS.
2.2. Cell Line Model and Culture Conditions
The CH12.LX mouse B-cell line, compliments of Dr. Geoffrey Haughton (University of North Carolina, Chapel Hill, NC), was derived from the mouse CH12 B-cell lymphoma arising in a B10.H-2aH-4bp/Wts (2a4b) mouse. The CH12.LX cell line was characterized by Bishop and Haughton (Bishop and Haughton 1986) and has been used extensively in immunological and toxicological research (Arnold et al. 1983, LoCascio et al. 1984, Bishop and Haughton 1986, Kunimoto et al. 1988, Whitmore et al. 1989, Bishop et al. 1990, Strober et al. 1991, Whitmore et al. 1991, Bishop 1992, Kunimoto et al. 1993, Louie et al. 1993, Wakatsuki and Strober 1993, Neurath et al. 1994, Wakatsuki et al. 1994, Usui et al. 1997, Sulentic et al. 1998, Kimura et al. 2000, Sulentic et al. 2000, Suh et al. 2002, Crawford et al. 2003, Boverhof et al. 2004, Sulentic et al. 2004, Yoo et al. 2004, Schneider et al. 2008, Henseler et al. 2009, Schneider et al. 2009, De Abrew et al. 2010, North et al. 2010, Fernando et al. 2012, Sharma et al. 2013, Salisbury and Sulentic 2015). The CH12.LX cells have high AhR expression and a functional AhR signaling pathway (Sulentic et al. 1998, Sulentic et al. 2000). These cells also demonstrate a sensitive inhibition of LPS-induced Ig expression as seen in vivo and in primary mouse B cells (Sulentic et al. 1998, Sulentic et al. 2000). Cells were cultured at 37°C in a 5% CO2 atmosphere and grown in RPMI-1640 (MediaTech, Herndon, VA) enhanced with 10% bovine calf serum (Hyclone, Logan, UT), 2 mM L-glutamine, 13.5 mM HEPES, 0.1 mM nonessential amino acids, 1.0 mM sodium pyruvate, 100 units/ml penicillin, 100 μg/ml streptomycin, and 50 μM β-mercaptoethanol. Cell viability was determined by assaying 1.0 ml of cell suspension for Trypan Blue exclusion with a ViCell instrument (Beckman Coulter, Brea, California).
2.3. Reporter Plasmid Constructs
The human polymorphic plasmids were constructed using a pGL3 basic luciferase reporter backbone (Promega, Madison, WI) containing ampicillin resistance and the luciferase gene. The enhancerless variable heavy chain promoter (VH) plasmid and the hs1.2 plasmid regulated by the VH and allele A of the hs1.2 enhancer from the 3′IGHRR-1 were a generous gift from Dr. Michel Cogné (Université de Limoges, France) (Denizot et al. 2001). Site-directed mutagenesis of the hs1.2 plasmid was performed as described previously (Fernando et al. 2012). Putative transcription factor binding sites outside (i.e. AP-1.ETS or POU), flanking (i.e. 5’ Sp-1.1 or 3’ Sp-1.2), or within (i.e. DRE, AP-1, NF1, or κB) the invariant sequence were mutated. Plasmids containing these mutations in the hs1.2 enhancer were named with the prefix hs1.2 in the following pattern: AP-1.ETSmut, POUmut, Sp-1.1mut, Sp-1.2mut, DREmut, AP-1mut, NF1mut, or κBmut, respectively (Table 1). Combined mutations of the DRE and κB sites within the invariant sequence or of the Sp-1 sites flanking the invariant sequence were also generated (i.e. DREmut+κBmut or Sp-1.1mut+Sp-1.2mut). Additionally, as described previously (Fernando et al. 2012), a hs1.2 plasmid with a deletion of the invariant sequence (ΔIS) was utilized to generate a plasmid with both a deletion of the invariant sequence and a mutated POU (ΔIS+POUmut) (Table 1). Mutations of transcription factor binding sites were designed based on previous electrophoretic mobility shift assay data and motif analysis with TFSEARCH, an online transcription factor profile database (Lenardo et al. 1987, Pierce et al. 1988, Yao and Denison 1992, Grant et al. 1995, Heinemeyer et al. 1998). Additionally, the unmutated hs1.2 enhancer and each mutation were further analyzed in silico for motif binding using the MEME Suite Tomtom motif comparison tool (Bailey et al. 2009). For each mutated plasmid, plasmid DNA was isolated from transformed colonies and sequenced to ensure quality and accuracy of the mutations (data not shown, Retrogen Inc., San Diego, CA).
Table 1. Site-directed mutagenesis primers.
Only the forward primers are noted above. Bolded sequence denotes the nucleotide mutations. Underlined sequence denotes the original sequence.
| Mutation (mut) or deletion (Δ) of transcription factor binding sites within the invariant sequence (IS) of the hs1.2 enhancer | ||
| DREmut | ||
|
GCGTG 5’-CCCGCCCCCTCCCCCAAGTCTGCCAGGCTGGCTCAGG-3’ | ||
| NF1mut | ||
|
AGGCCTCCA 5’-AGCGTGGCCAGGCTGGCTCTTAAGTTGGATTCGGGACACCCGCCC-3’ | ||
| AP-1mut | ||
|
TGGCTCA 5’-CTCCCCCAGCGTGGCCAGGCATCTAAGGGCCTCCAGATTCGGGACA-3’ | ||
| NFκBmut | ||
|
CGGGGACACCC 5’-CTGGCTCAGGCCTCCAGATTGTAGAAGAACTGCCCCCTCCCCCAGGACAGG-3’ | ||
| DREmut+NFκBmut | Serial mutagenesis performed using primer sets for DREmut and NFκBmut | |
| ΔIS | 5’-CACGATTCTCCCGCCCCCTCCCCC -3’ | |
| Mutation of transcription factor binding sites outside or flanking the invariant sequence of the hs1.2 enhancer | ||
| AP1.ETSmut | ||
|
TGACTCATTCT 5’-GGCTCTGATCTGTTTCTCCTTGAGGGGCCAACTAGGGGCAGACTTGGCCCTCAGGGCAC-3’ | ||
| POUmut | ||
|
ATGCAAAT 5’-TCTGGGCAGACTTGGCCCTCAGGGCACCCTAAGTCGGTTGTTTGTTCCACACCGAAAACATG | ||
| Sp-1.1mut | ||
|
CCCGCCC 5’-CCAGAAATAGCTTGCACGATTCTAGTCGATCCTCCCCCGCGTGGCAGGCTG-3’ | ||
| Sp-1.2mut | ||
|
CCCGCCC 5’-GCCTCCAGATTCGGGGACAAGTCGATCCTCCCCCAGGACAGGCCC-3’ | ||
| Sp-1.1mut+Sp-1.2mut | Serial mutagenesis performed using primer sets for Sp-1.1mut and Sp-1.2mut | |
| Combined mutations within and outside the invariant sequence of the hs1.2 enhancer | ||
| ΔIS+ POUmut | Serial mutagenesis performed using primer sets for ΔIS and POUmut | |
2.4. Transient Transfections and Luciferase Assays
Transient transfections and luciferase assays were performed as described previously (Sulentic et al. 2004, Fernando et al. 2012). Briefly, 1 × 10⁷ CH12.LX cells were transfected with 10 μg of reporter plasmid by electroporation then aliquoted into appropriate treatment groups and incubated for 24 hrs at a seeding concentration of 2 × 10⁵ cells/ml. Following incubation, the cells were collected by centrifugation, washed with 1xPBS, and resuspended in reporter lysis buffer (Promega, Madison, WI) then frozen at −80°C. After thawing and centrifugation to remove cell debris, 20 μl of sample lysate was mixed with 100 μl of luciferase substrate reagent (Promega, Madison, WI) and measured by a single-tube luminometer (Berthold Detection Systems, Oak Ridge, TN). Luciferase activity was normalized to plasmids per cell as previously described (Sulentic et al. 2004). Briefly, the concentration of luciferase plasmid DNA in the transfected cells was determined by real-time PCR (RT-PCR) for the luciferase gene. A control luciferase reporter plasmid ranging in concentration from 0.1 ng/μl to 1×10⁻⁶ ng/μl was used to generate a standard curve. The luciferase forward and reverse primers were 5’-ACTGGGACGAAGACGAACACTT-3’ and 5’-TCAGAGACTTCAGGCGGTCAA-3’, respectively. Amount of transfected plasmid (ng) was calculated by the equation: [ng/μl luciferase plasmid DNA × 2μl (volume of DNA in RT-PCR) × 10 (fold dilution of original DNA sample). Number of plasmids per cell was calculated from the equation: [ng of plasmid DNA × number of plasmids/ng] / total number of cells (Sulentic et al. 2004).
2.5. Statistical Analysis of Data
Luciferase activity (mean ± SEM, n≥3) was represented as the relative light units (RLU) normalized to transfection efficiency (i.e. plasmid/cell) or as the TCDD-induced fold change. For the fold-change graphs, the means of at least three separate experiments are represented as separate data points; the overall fold-change mean is represented by a horizontal line. Comparisons between treatment groups of the same reporter plasmid were analyzed using a 1-way ANOVA followed by a Dunnett’s Multiple Comparison post-test. Significant differences in luciferase activity or TCDD-induced fold change compared to the corresponding vehicle control was represented by “*”, “**”, “***” denoting significance at p<0.05, p<0.01 and p<0.001, respectively. To compare basal and LPS-stimulated reporter activity between the different reporter plasmids, RLU values normalized to transfection efficiency were represented as fold-change relative to the basal activity or the LPS-induced activity of the corresponding wildtype hs1.2 enhancer. Significant differences in luciferase activity or fold change between reporter plasmids were analyzed using a 2-way ANOVA with a Bonferroni post-test and represented by “†”, “††”, “†††” denoting significance at p<0.05, p<0.01 and p<0.001, respectively.
3. RESULTS
3.1. A limited number of binding sites influence TCDD-induced activity of the human hs1.2 enhancer, which is dependent on the cellular activation state
To determine the relative contribution of each transcription factor binding site outside and within the invariant sequence to the activity of the human hs1.2 enhancer, we utilized site-directed mutagenesis of a luciferase reporter containing allele A (i.e. one IS) of the human 3′IGHRR-1 hs1.2 enhancer. Since the mouse 3′IghRR enhancers have been shown to regulate both basal and induced (i.e. in response to cellular stimulation) Igh expression and CSR, we evaluated the effect of each mutation on basal human hs1.2 enhancer activity and activity induced by cellular stimulation using the toll-like receptor (TLR4) ligand LPS. Additionally, we have previously demonstrated an AhR-dependent activation of all four human hs1.2 enhancer alleles following TCDD treatment in both the well-characterized CH12.LX mouse B-cell line and the human IM-9 B-cell line suggesting similar signaling pathways in the mouse and human B-cell lines (Fernando et al. 2012). To continue the characterization of the human hs1.2 enhancer, we utilized the CH12.LX cells due to their well-defined and functional AhR signaling pathway and unlike the IM-9 cells, their ability to respond to cellular stimulation (Henseler et al. 2009, Fernando et al. 2012).
Since previous studies demonstrated an AhR-dependent activation of the human hs1.2 enhancer by TCDD that was increased with an increased number of invariant sequence repeats (Fernando et al. 2012), we expected that the DRE-like site, perhaps through an interaction between the AhR and the other transcription factor binding sites within the invariant sequence, would mediate the effects of TCDD. However, mutation of the DRE core motif had modest inhibitory effects on TCDD-induced activation of the hs1.2 enhancer in unstimulated cells, which was only significant at 1 nM TCDD (Fig. 2B). In contrast, the DRE mutation induced a slight increase in hs1.2 activation in LPS-stimulated cells treated with 1 nM TCDD (Fig. 2B). Further analysis via electrophoretic mobility shift assays could not detect AhR binding to the DRE-like motif within the human hs1.2 enhancer (data not shown). However, this does not rule out the possibility of weak binding to the DRE or indirect interactions of the AhR through protein-protein binding with other transcription factors. Potential binding sites for AP-1 and NFκB are also within the invariant sequence and these transcription factors are affected by the AhR and TCDD through direct protein-protein interactions or altered binding and expression (Suh et al. 2002, Tian 2009, Vogel and Matsumura 2009, Salisbury and Sulentic 2015). However, neither of these sites when mutated was found to significantly affect TCDD-induced activation of the human hs1.2 enhancer (Figs. S1B and S2B). Additionally, a double mutation of the DRE and κB sites had no effect on TCDD-induced activation of the human hs1.2 enhancer (data not shown).
Figure 2. Mutation of the core DRE binding motif within the invariant sequence has little effect on overall transcriptional activity of the human hs1.2 enhancer.

CH12.LX cells were transiently transfected with a luciferase reporter regulated by the wildtype hs1.2 enhancer (hs1.2) or the hs1.2 enhancer with a mutated core DRE binding site. Transfected cells were either cultured in the absence of any additional treatment (naïve, NA) or treated for 24 hr with 0.01% DMSO vehicle (0 nM TCDD) or TCDD (0.01–10 nM) in the absence or presence of LPS (0.1 μg/ml) stimulation. C represents the LPS alone control. A) Luciferase activity (mean ± SEM, n≥3) is represented as the relative light units (RLU) normalized to transfection efficiency. Results are representative of at least 4 separate experiments. B) TCDD-induced activation is represented on the y-axis as fold change relative to the DMSO vehicle. Results (mean ± SEM) were generated from separate experiments (N≥4); a horizontal line represents the overall fold-change mean. Comparisons between treatment groups of the same reporter plasmid were analyzed using a 1-way ANOVA followed by a Dunnett’s Multiple Comparison post-test. Significant differences in luciferase activity or TCDD-induced fold change compared to the corresponding vehicle control are represented by “*”, “**”, or “***” denoting significance at p<0.05, p<0.01 or p<0.001, respectively. Comparisons between reporter plasmids were analyzed using a 2-way ANOVA with a Bonferroni post-test. “†”, “††”, or “†††” denotes a significant difference compared to hs1.2 at p<0.05, p<0.01 or p<0.001, respectively. A vertical bar represents a significant difference for all treatment groups.
Unexpectedly, mutation of the putative NF1 binding site within the invariant sequence significantly reduced TCDD-induced activation of the human hs1.2 enhancer but only in LPS-stimulated cells (Fig. 3B). Since Sp-1 has been shown to interact with NF1 and the AhR, the Sp-1 sites were also evaluated for their influence on TCDD-induced activation of the hs1.2 enhancer. Mutation of the Sp-1.2 site had no effect, but mutation of the Sp-1.1 site increased TCDD-induced activation in LPS-stimulated cells (Figs. S3B and 4B). The only other mutation influencing TCDD-induced activation was mutation of the POU site outside of the invariant sequence, which resulted in an increase in TCDD-induced activity of the hs1.2 enhancer but only in unstimulated cells (Fig. 5B). Deletion of the invariant sequence with mutation of the POU binding site reversed this effect but also resulted in a significant decrease in hs1.2 enhancer activity by 10 nM TCDD in LPS-stimulated cells, perhaps mediated by the loss of the NF1 site (compare Figs. 5B and 3B). Taken together these results support a partial and opposite role of the DRE and POU sites in TCDD-induced activity of the hs1.2 enhancer in unstimulated cells, i.e. DRE is a weak positive modulator and POU a negative modulator. Whereas, in LPS-stimulated cells NF1 is a positive modulator of TCDD-induced hs1.2 enhancer activity and Sp-1.1 appears to be a weak negative modulator (summarized in Fig. 6). These results underscore the complexity of the transcriptional interactions at the hs1.2 enhancer and do not appear to support a canonical AhR signaling paradigm (i.e. AhR-mediated transactivation through DRE-binding).
Figure 3. Mutation of the NF1 binding site within the invariant sequence has little effect on overall transcriptional activity but decreases LPS- and TCDD-induced activation of the human hs1.2 enhancer.

CH12.LX cells were transiently transfected with a luciferase reporter regulated by the wildtype hs1.2 enhancer (hs1.2) or the hs1.2 enhancer with a mutated NF1 binding site. Transfected cells were either cultured in the absence of any additional treatment (naïve, NA) or treated for 24 hr with 0.01% DMSO vehicle (0 nM TCDD) or TCDD (0.01–10 nM) in the absence or presence of LPS (0.1 μg/ml) stimulation. C represents the LPS alone control. A) Luciferase activity (mean ± SEM, n≥3) is represented as the relative light units (RLU) normalized to transfection efficiency. Results are representative of at least 4 separate experiments. B) TCDD-induced activation is represented on the y-axis as fold change relative to the DMSO vehicle. Results (mean ± SEM) were generated from separate experiments (N≥4); a horizontal line represents the overall fold-change mean. Comparisons between treatment groups of the same reporter plasmid were analyzed using a 1-way ANOVA followed by a Dunnett’s Multiple Comparison post-test. Significant differences in luciferase activity or TCDD-induced fold change compared to the corresponding vehicle control are represented by “*”, “**”, or “***” denoting significance at p<0.05, p<0.01 or p<0.001, respectively. Comparisons between reporter plasmids were analyzed using a 2-way ANOVA with a Bonferroni post-test. “†”, “††”, or “†††” denotes a significant difference compared to hs1.2 at p<0.05, p<0.01 or p<0.001, respectively. A vertical bar represents a significant difference for all treatment groups.
Figure 4. Mutation of the Sp-1.1 binding sites increases overall transcriptional activity of the human hs1.2 enhancer.

CH12.LX cells were transiently transfected with a luciferase reporter regulated by the wildtype hs1.2 enhancer (hs1.2) or the hs1.2 enhancer with the Sp-1.1 site mutated (Sp-1.1mut). Transfected cells were either cultured in the absence of any additional treatment (naïve, NA) or treated for 24 hr with 0.01% DMSO vehicle (0 nM TCDD) or TCDD (0.01–10 nM) in the absence or presence of LPS (0.1 μg/ml) stimulation. C represents the LPS alone control. A) Luciferase activity (mean ± SEM, n≥3) is represented as the relative light units (RLU) normalized to transfection efficiency. Results are representative of at least 5 separate experiments. B) TCDD-induced activation is represented on the y-axis as fold change relative to the DMSO vehicle. Results (mean ± SEM) were generated from separate experiments (N=5); a horizontal line represents the overall fold-change mean. Comparisons between treatment groups of the same reporter plasmid were analyzed using a 1-way ANOVA followed by a Dunnett’s Multiple Comparison post-test. Significant differences in luciferase activity or TCDD-induced fold change compared to the corresponding vehicle control are represented by “*”, “**”, or “***” denoting significance at p<0.05, p<0.01 or p<0.001, respectively. Comparisons between reporter plasmids were analyzed using a 2-way ANOVA with a Bonferroni post-test. “†”, “††”, or “†††” denotes a significant difference compared to hs1.2 at p<0.05, p<0.01 or p<0.001, respectively. A vertical bar represents a significant difference for all treatment groups.
Figure 5. Mutation of the POU site increases overall transcriptional activity and TCDD-induced activation of the human hs1.2 enhancer.
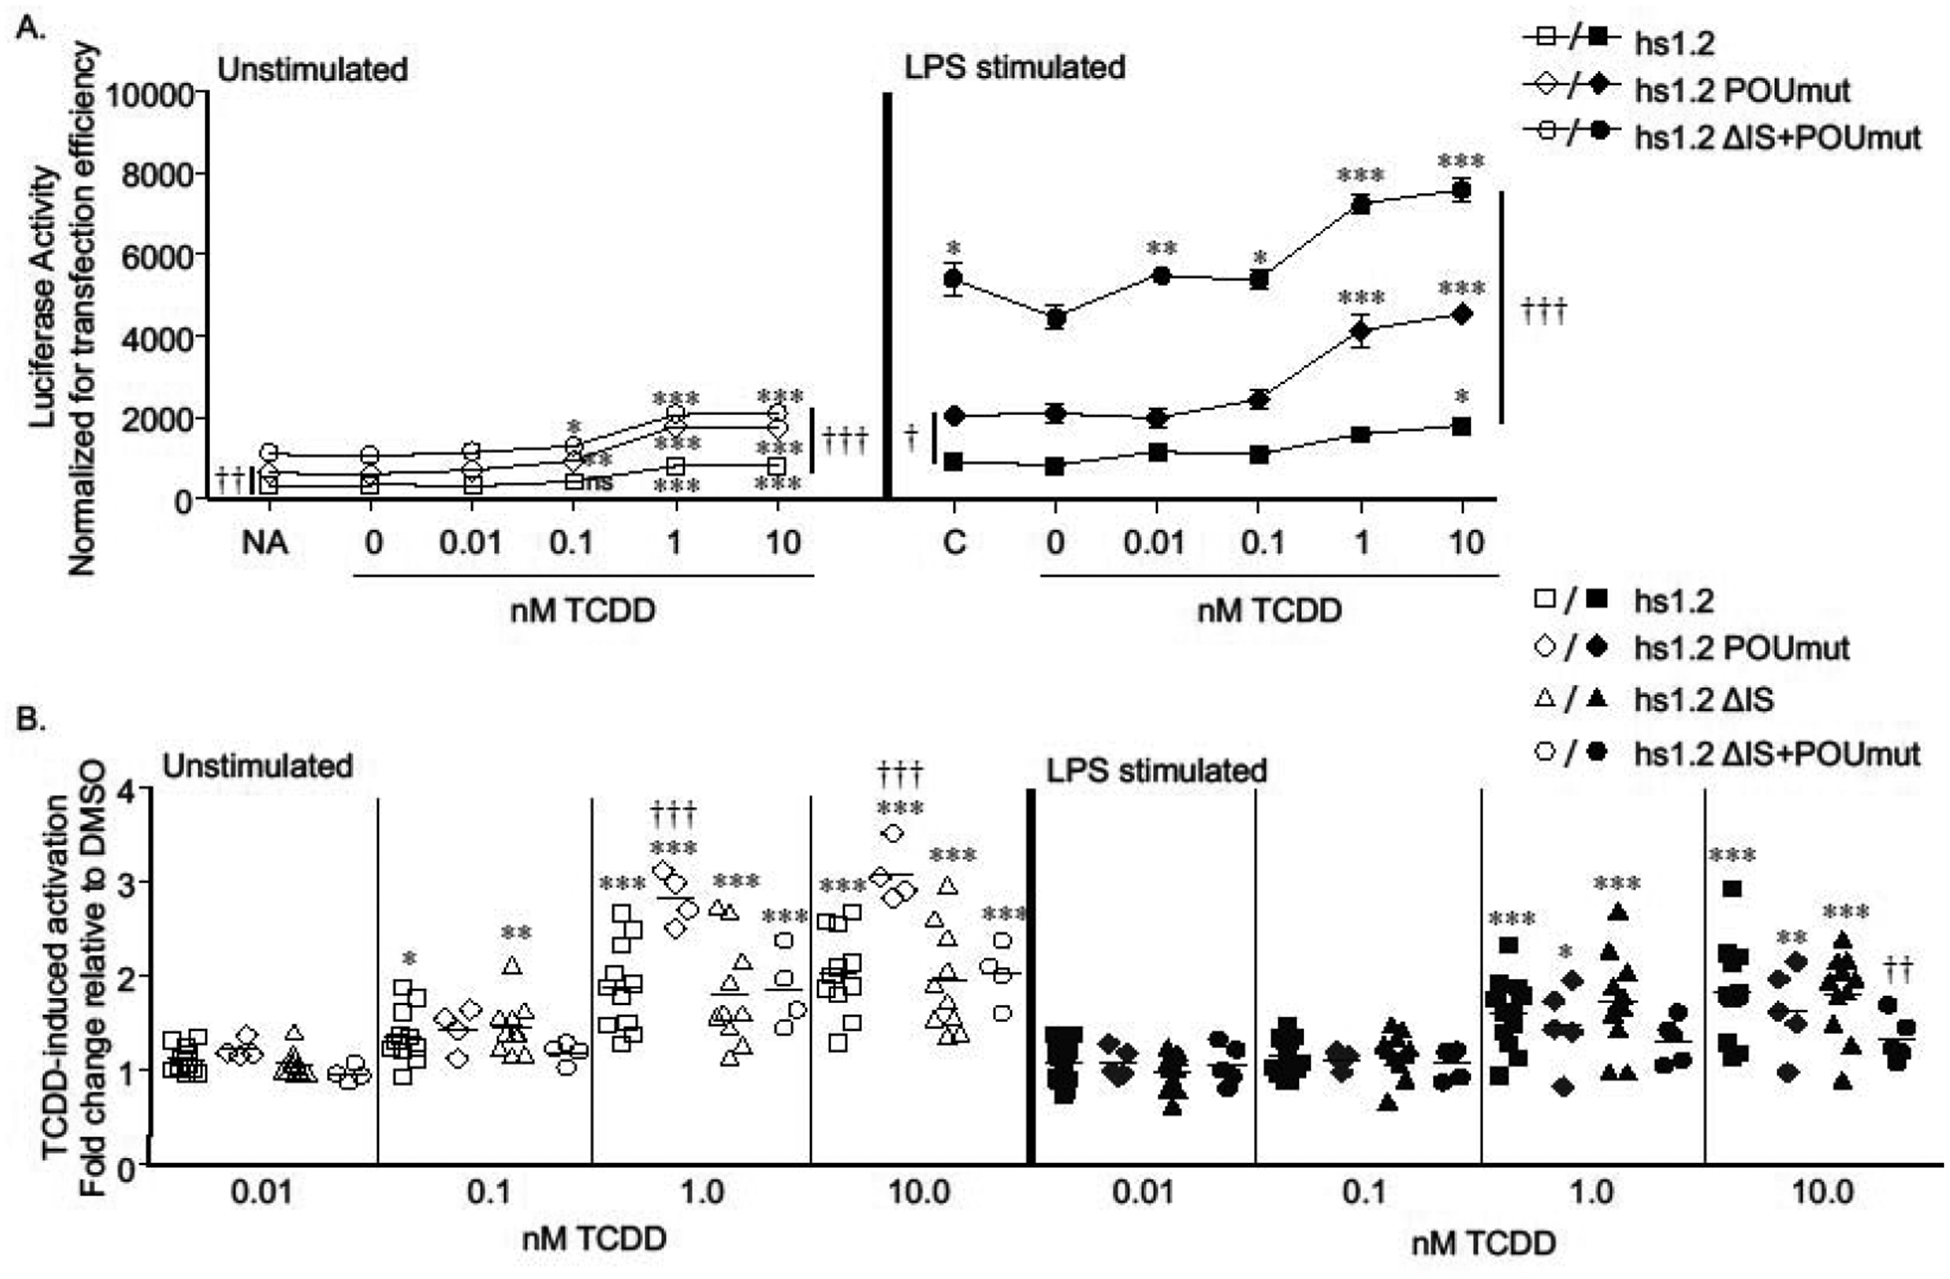
CH12.LX cells were transiently transfected with a luciferase reporter regulated by the wildtype hs1.2 enhancer (hs1.2) or the hs1.2 enhancer with either a mutated POU binding site (POUmut), deletion of the invariant sequence (ΔIS), or a combined POU mutation and IS deletion (ΔIS+POUmut). Transfected cells were either cultured in the absence of any additional treatment (naïve, NA) or treated for 24 hr with 0.01% DMSO vehicle (0 nM TCDD) or TCDD (0.01–10 nM) in the absence or presence of LPS (0.1 μg/ml) stimulation. C represents the LPS alone control. A) Luciferase activity (mean ± SEM, n≥3) is represented as the relative light units (RLU) normalized to transfection efficiency. Results are representative of at least 4 separate experiments. B) TCDD-induced activation is represented on the y-axis as fold change relative to the DMSO vehicle. Results (mean ± SEM) were generated from separate experiments (N≥4); a horizontal line represents the overall fold-change mean. Comparisons between treatment groups of the same reporter plasmid were analyzed using a 1-way ANOVA followed by a Dunnett’s Multiple Comparison post-test. Significant differences in luciferase activity or TCDD-induced fold change compared to the corresponding vehicle control are represented by “*”, “**”, or “***” denoting significance at p<0.05, p<0.01 or p<0.001, respectively. Comparisons between reporter plasmids were analyzed using a 2-way ANOVA with a Bonferroni post-test. “†”, “††”, or “†††” denotes a significant difference compared to hs1.2 at p<0.05, p<0.01 or p<0.001, respectively. A vertical bar represents a significant difference for all treatment groups for the two reporter plasmids indicated by the ends of the bar.
Figure 6. Mutational analysis summary and proposed transcriptional regulation for TCDD-induced hs1.2 enhancer activity.

A) Schematic summarizing the specific mutations/deletions and the resulting effect on TCDD-induced hs1.2 enhancer activity in unstimulated (Unstim) or LPS-stimulated (LPS) CH12.LX cells. Boxes represent putative transcription factor binding sites; mutations or deletions are indicated by gray or black filled boxes, respectively. The number of arrows indicates the degree of effect. Downward or upward arrows indicate decreased or increased TCDD-induced fold change compared to the wildtype hs1.2 enhancer, respectively; NC indicates no change from the wildtype hs1.2 enhancer. B) Proposed transcriptional regulation of TCDD-induced hs1.2 enhancer activity. Bolded text within thick-outlined boxes indicate transcription factor binding sites we propose to regulate hs1.2 enhancer activity under TCDD-treatment in the absence (TCDD alone) or presence of LPS-stimulation (TCDD + LPS). The plus or minus indicate whether the transcription factor binding site is an activator (+) or suppressor (−) of hs1.2 enhancer activity. Parenthesis enclosing the plus or minus sign indicate a weak effect. We propose that the putative POU, NF1 and to a lesser extent DRE and Sp1.1 binding sites are transcriptional regulators. The NF-1 site is the primary transcriptional mediator of TCDD-induced hs1.2 activation but this is limited to LPS stimulation. The DRE-like site appears to be a weak mediator of TCDD-induced hs1.2 activation in unstimulated cells but does not adequately account for the effect of TCDD in unstimulated cells.
3.2. Mutation of the binding sites within the invariant sequence generally increases overall transcriptional activity of the human hs1.2 enhancer
Each of the putative binding sites within the invariant sequence were also evaluated for their contribution to basal and LPS-stimulated activity of the hs1.2 enhancer. The invariant sequence is straddled by Sp-1 binding sites, which are not repeated in the hs1.2 polymorphic alleles (D’Addabbo et al. 2011). Mutation of either Sp-1 site modestly increased overall transcriptional activity of the human hs1.2 enhancer (Figs. 4A and S3A). A double mutation of both Sp-1 sites had little additional effect over the single Sp-1 mutations (Table 2). Unlike the Sp-1 site, most of the putative transcription factor binding sites (i.e. AP-1, NF1, κB, and DRE core binding motif) are repeated with each repeat of the invariant sequence in the polymorphic hs1.2 enhancer (Denizot et al. 2001, Giambra et al. 2005, D’Addabbo et al. 2011, Fernando et al. 2012). Mutation of the AP-1, κB, or the DRE core motif within the invariant sequence of allele A tended to increase overall transcriptional activity of the hs1.2 enhancer; while mutation of the NF1 site had no effect in unstimulated cells but decreased transcriptional activity in LPS-stimulated cells (Figs. S1A, S2A, 2A, 3A). Transcriptional activity was further evaluated by determining the mean fold change in basal and LPS-stimulated reporter activity of each mutant plasmid relative to the basal activity of the wildtype hs1.2 enhancer from several independent experiments (Table 2). Predictably, there was greater variability and less statistical significance when analyzing all of the experiments together. However, the combined comparison supports increased basal and LPS-stimulated reporter activity with each of the invariant sequence mutations except NF1 (Table 2). Additionally, a double mutation of the DRE core binding motif and the putative κB site resulted in markedly higher basal and LPS-stimulated reporter activity compared to the wildtype hs1.2 enhancer suggesting a cooperative inhibitory effect of proteins binding to these sites (Table 2). Notably, LPS-induced hs1.2 enhancer activation was blunted to a similar degree by deletion of the invariant sequence or mutation of the putative NF1 binding site (Table 2). These results suggest that the NF1 motif primarily mediates the positive contribution of the invariant sequence on hs1.2 enhancer activity in LPS-stimulated cells.
Table 2. Effect of the hs1.2 enhancer mutations or deletions on basal or LPS-induced reporter activity.
Reporter activity is represented as either fold change (average ± SE from independent experiments) relative to basal (unstimulated)a or LPS-stimulatedb activity of the wildtype hs1.2 enhancer in unstimulated or LPS-stimulated cells. Statistical significance was determined via one-way ANOVA with multiple comparisons post-hoc test. “*” or “***” denote significance within a column at p<0.05 or p<0.001, respectively, compared to the wildtype hs1.2 enhancer.
| Luciferase reporters | Fold change relative to basal (unstimulated)a or stimulatedb hs1.2 enhancer activity | |||
|---|---|---|---|---|
| Unstimulated cells | LPS-stimulated cells | |||
| control reporters | VH promoter alone | 0.51 ± 0.18a | 0.66 ± 0.34a | 0.21 ± 0.11b |
| wildtype hs1.2 | 1 | 3.12 ± 0.15 | 1 | |
| hs1.2 enhancer mutations and deletions | AP-1.ETS mut | 0.40 ± 0.12 | 1.02 ± 0.51 | 0.32 ± 0.16 |
| POU mut | 2.33 ± 0.62* | 8.34 ± 2.12 | 2.64 ± 0.67 | |
| ΔIS | 0.78 ± 0.15 | 2.09 ± 0.45 | 0.66 ± 0.14 | |
| ΔIS+POU mut | 3.31 ± 0.49*** | 17.51 ± 3.28*** | 5.54 ± 1.04*** | |
| hs1.2 enhancer IS mutations | Sp-1.1 mut | 1.70 ± 0.28 | 5.88 ± 1.80 | 1.86 ± 0.57 |
| DRE mut | 1.92 ± 0.28 | 4.85 ±0.99 | 1.54 ± 0.31 | |
| AP-1 mut | 1.75 ± 0.66 | 4.98 ± 2.14 | 1.58 ± 0.68 | |
| NF1 mut | 1.21 ± 0.19 | 2.38 ± 0.28 | 0.75 ± 0.09 | |
| κB mut | 1.46 ± 0.51 | 4.91 ± 1.63 | 1.56 ± 0.52 | |
| κB+DRE mut | 7.37 ± 2.24*** | 16.01 ± 4.22*** | 5.07 ± 1.34*** | |
| Sp-1.2 mut | 1.72 ± 0.55 | 5.47 ± 1.76 | 1.73 ± 0.56 | |
| Sp-1.1+Sp-1.2 mut | 1.56 ± 0.31 | 6.97 ± 1.76 | 2.21 ± 0.56 | |
3.2. Mutations of the binding sites outside of the invariant sequence in the human hs1.2 enhancer have opposite transcriptional effects
In relation to the hs3 enhancer, the AP-1.ETS binding site is the most proximal transcription factor binding site in the human hs1.2 enhancer and is upstream of the invariant sequence (i.e. not one of the sites repeated in the hs1.2 polymorphism) (Fig. 1C). Mutation of the AP-1.ETS site markedly reduced transcriptional activity of the hs1.2 enhancer in both unstimulated and LPS-stimulated cells (Fig. 7A). In contrast, TCDD-induced fold activation of the hs1.2 enhancer was unaffected by this mutation, suggesting that the AP-1.ETS site is a strong positive regulator of hs1.2 enhancer activity but plays no role in TCDD-induced activation of this enhancer (Fig. 7B). Like the AP-1.ETS site, a binding site for POU transcription factors (e.g. octamer-binding proteins, Oct and Oca-B) is located outside the invariant sequence and is between the AP-1.ETS site and the invariant sequence (Fig. 1C). Mutation of the POU binding site, which includes mutation of the HoxC4 site as identified by Kim et al. (Kim et al. 2004), significantly increased overall activity of the human hs1.2 enhancer suggesting a negative influence of proteins binding to this site (Fig. 5A). As mentioned previously, mutation of the POU binding site also significantly increased TCDD-induced fold activation of the hs1.2 enhancer (Figs. 5B and 6), supporting an inhibitory role of the POU site in basal and TCDD-induced hs1.2 enhancer activity.
Figure 7. Mutation of the AP-1.ETS site decreases overall transcriptional activity of the human hs1.2 enhancer.

CH12.LX cells were transiently transfected with a luciferase reporter regulated by the wildtype hs1.2 enhancer (hs1.2) or the hs1.2 enhancer with a mutated AP-1.ETS binding site (AP-1.ETSmut). Transfected cells were either cultured in the absence of any additional treatment (naïve, NA) or treated for 24 hr with 0.01% DMSO vehicle (0 nM TCDD) or TCDD (0.01–10 nM) in the absence or presence of LPS (0.1 μg/ml) stimulation. C represents the LPS alone control. A) Luciferase activity (mean ± SEM, n≥3) is represented as the relative light units (RLU) normalized to transfection efficiency. Results are representative of at least 3 separate experiments. B) TCDD-induced activation is represented on the y-axis as fold change relative to the DMSO vehicle. Results (mean ± SEM) were generated from separate experiments (N≥3); a horizontal line represents the overall fold-change mean. Comparisons between treatment groups of the same reporter plasmid were analyzed using a 1-way ANOVA followed by a Dunnett’s Multiple Comparison post-test. Significant differences in luciferase activity or TCDD-induced fold change compared to the corresponding vehicle control is represented by “*”, “**”, or “***” denoting significance at p<0.05, p<0.01 or p<0.001, respectively. Comparisons between reporter plasmids were analyzed using a 2-way ANOVA with a Bonferroni post-test. “†††” denotes a significant difference between hs1.2 and hs1.2 AP-1.ETSmut at p<0.001. A vertical bar represents a significant difference for all treatment groups.
3.2. The invariant sequence modulates the opposing effects of AP-1.ETS and POU on hs1.2 enhancer activity
We have previously demonstrated a decrease in hs1.2 enhancer activity with deletion of the invariant sequence (Fernando et al. 2012). Interestingly, deletion of the invariant sequence with mutation of the POU binding site resulted in a marked increase in hs1.2 transcriptional activity that was greater than the mutation of the POU binding site alone (Fig. 5A). To determine the general effect of the AP-1.ETS, POU, and invariant sequence binding sites on hs1.2 enhancer activity, we determined the mean fold change in basal and LPS-stimulated reporter activity of each mutant plasmid relative to the basal activity of the wildtype hs1.2 enhancer from several independent experiments (Fig. 8 and Table 2). As expected, when all of the experiments were analyzed together, there was greater variability and less statistical significance. However, the comparison shows that the AP-1.ETS mutation dramatically reduced hs1.2 enhancer activity in unstimulated and LPS-stimulated cells, resulting in activity similar to the enhancerless VH promoter. Deletion of the invariant sequence also reduced hs1.2 enhancer activity but to a lesser degree as compared to the AP-1.ETS mutation. The other striking comparison is the consistent increase in hs1.2 enhancer activity with the POU mutation and the even greater increase in activity with the POU mutation combined with deletion of the invariant sequence, particularly with LPS-stimulation (Fig. 8 and Table 2). Additionally, the double mutation of the DRE core binding motif and the κB site resulted in an ~5-fold higher activity, which was similar to the increase induced by deletion of the invariant sequence with mutation of the POU binding site (Table 2). Taken together, these results suggest that the invariant sequence dampens both the stimulatory action of the AP-1.ETS site and the inhibitory action of the POU site. Perhaps the invariant sequence functions as a fine regulator of hs1.2 enhancer activity (summarized in Fig. 9).
Figure 8. Transcriptional activity of the hs1.2 enhancer is modulated by the AP-1.ETS and POU binding sites and the invariant sequence.

Box and whisker plots of several independent experiments comparing the fold-change in transcriptional activity in unstimulated and LPS-stimulated CH12.LX cells relative to the basal (unstimulated) activity of the wildtype hs1.2 enhancer for the AP-1.ETSmut, POUmut, ΔIS, or ΔIS+POUmut. The box represents the upper and lower quartile and the horizontal line the median. The whiskers represent the lowest and highest observations. Individual data points are shown and represent the mean fold change from an independent transient transfection experiment of the mutant plasmid compared to the control plasmid (wildtype hs1.2 enhancer). VH alone, variable heavy chain promoter without the hs1.2 enhancer. Dashed line, basal wildtype hs1.2 enhancer activity set to 1. Significant differences in transcriptional activity relative to the basal wildtype hs1.2 enhancer was determined using a 1-way ANOVA followed by a Dunnett’s Multiple Comparison post-test and represented by “†” or “†††”, denoting significance at p<0.05 or p<0.001, respectively.
Figure 9. Mutational analysis summary and proposed transcriptional regulation for basal and LPS-stimulated hs1.2 enhancer activity.

A) Schematic summarizing the specific mutations/deletions and the resulting effect on transcriptional activity compared to the wildtype hs1.2 enhancer. Boxes represent putative transcription factor binding sites; mutations or deletions are indicated by gray or black filled boxes, respectively. The number of arrows indicates the degree of effect. Downward arrow indicates decreased transcriptional activity compared to the wildtype hs1.2 enhancer; upward arrow indicates increased activity. For the mutated NF1 binding site, NC/↓ indicates no change in basal activity and a decrease in LPS-stimulated activity. B) Proposed transcriptional regulation of the hs1.2 enhancer. Bolded text within thick-outlined boxes indicate transcription factor binding sites we propose to regulate basal and LPS-stimulated hs1.2 enhancer activity. The plus or minus indicate whether the transcription factor binding site is an activator (+) or suppressor (−) of hs1.2 enhancer activity. Parenthesis enclosing the plus or minus sign indicate a weak effect. Line joining the DRE and κB sites indicates that mutation of both sites was more suppressive then a single mutation of either site alone. The current mutational analysis supports the AP-1.ETS site as a primary activator and the POU site as a major suppressor of basal and LPS-stimulated hs1.2 enhancer activity, while the invariant sequence negatively modulates both the stimulatory effect of AP-1.ETS and the suppressor effect of POU perhaps through the DRE and κB sites and the NF1 site, respectively. We propose that the invariant sequence functions as a fine regulator of hs1.2 enhancer activity.
4. DISCUSSION
The objective of this study was to identify the transcriptional regulatory elements within the hs1.2 enhancer that influence basal and stressor-induced activity. Mutation of the AP-1.ETS site had the most dramatic negative impact on overall transcription as compared to any other transcription factor binding site mutation but had no impact on TCDD-induced activation of the hs1.2 enhancer. Our results suggest that the AP-1.ETS site is essential for basal and LPS-stimulated hs1.2 activity, whereas the fold-induction by LPS was unaffected by all other mutations except NF1, which resulted in an ~25% loss of LPS-induced activity. In relation to the hs3 enhancer, the AP-1.ETS site is the most proximal transcription factor site in the human hs1.2 enhancer and is outside of the invariant sequence (Fig. 1C). There is a single nucleotide difference between the mouse and human AP-1.ETS site, which causes the human AP-1.ETS site to match the consensus AP-1.ETS sequence (Mills et al. 1997). In the mouse hs1.2 enhancer, the AP-1.ETS site confers responsiveness to B-cell receptor cross-linking and has a functional role in hs1.2 enhancer activity in both primary B-lymphocytes and a B-lymphocyte cell line model (Grant et al. 1995). Enhancer activity was associated with binding to the AP-1.ETS site of the nuclear factor of activated B cells (NFAB), which consists of the ETS protein Elf-1 and the AP-1 proteins Jun-B and c-Fos (Grant et al. 1995). Our results support a primary role of the AP-1.ETS site in both basal and LPS-induced hs1.2 enhancer activity.
Like the AP-1.ETS site, the binding site for POU transcription factors (e.g. octamer-binding proteins, Oct and Oca-B) is located outside the invariant sequence and is between the AP-1.ETS site and the invariant sequence in the human hs1.2 enhancer (Fig. 1C). POU contributes to mouse hs1.2 enhancer activity and is conserved between mouse and human (Mills et al. 1997). In mouse B cells, POU in cooperation with Pax5, and G-rich, κB-like motifs repress transcription of the mouse hs1.2 enhancer but during the course of B-cell activation, Pax5 expression is downregulated and binding to POU and κB result in activation of enhancer activity (Michaelson et al. 1996, Singh and Birshtein 1996). However, the Pax5 binding site is not conserved in the human hs1.2 enhancer (Fig. 1C). Additionally, previous studies have demonstrated homeobox C4 (HoxC4)-dependent recruitment and binding of Oct-1, Oct-2, and Oca-B to the POU binding site within the human hs1.2 enhancer in a human mature B-lymphocyte cell line, which resulted in an overall increase in hs1.2 enhancer activity (Kim et al. 2004). In contrast to these results, mutation of the POU binding site, which includes mutation of the HoxC4 site as identified by Kim et al. (Kim et al. 2004), increased overall activity of our human hs1.2 enhancer in the CH12.LX cells suggesting a negative influence of proteins binding to this site. Additionally, mutation of the POU binding site also significantly increased TCDD-induced fold activation of the hs1.2 enhancer. However, this was only observed in unstimulated cells, which indicates some aspect of TLR-4 signaling can override the stimulatory effect of TCDD in the absence of POU and HoxC4 binding.
In silico analysis for motif binding using the MEME Suite Tomtom motif comparison tool (Bailey et al. 2009) verified loss of the POU binding site without the addition of other binding motifs (data not shown). The difference between our results and the previous study (Kim et al. 2004) could be due to differences between the hs1.2 enhancers within the 3′IGHRR-1 vs. 3′IGHRR-2 and/or the cellular model. The previous study (Kim et al. 2004) evaluated the hs1.2 enhancer from the 3′IGHRR-2, which has four invariant sequence repeats (i.e. allele D) and is in the reverse orientation of the hs1.2 enhancer in the 3′IGHRR-1. Additionally, the previous study evaluated a larger sequence (1178 bp vs. our 539 bp sequence) and identified a region beyond the AP1.ETS site that has transcriptional activity (Kim et al. 2004). Our reporter contains a portion of this region (171 bp of the 314 bp evaluated in (Kim et al. 2004)). Furthermore, another study compared the transcriptional activity of the hs1.2 enhancer from both 3′IGHRRs and demonstrated lower overall reporter activity with the 3′IGHRR-1 as compared to the 3′IGHRR-2, which might be due to the increased number of invariant sequence repeats in the 3′IGHRR-2 hs1.2 enhancer (i.e. allele D with four invariant sequence repeats) (Chen and Birshtein 1997). Notably the 3′IGHRR-1 is the most polymorphic in humans with specific alleles (i.e. alleles B and C, two and three invariant sequence repeats, respectively) associated with a number of autoimmune and hypersensitivity disease states (Aupetit et al. 2000, Frezza et al. 2004, Guglielmi et al. 2004, Giambra et al. 2005, Frezza et al. 2007, Cianci et al. 2008, Frezza et al. 2009, Giambra et al. 2009, Tolusso et al. 2009, Fernando et al. 2012, Frezza et al. 2012, Montesano et al. 2014).
The invariant sequence contains putative transcription factor binding sites for NFκB/Rel proteins, the AhR, AP-1, and NF1 (Fig. 1C) (Chen and Birshtein 1997, Denizot et al. 2001, Giambra et al. 2005, Fernando et al. 2012). Previous studies demonstrated a marked loss in hs1.2-allele A enhancer activity with deletion of the invariant sequence and decreased activity with deletion of one of the two invariant sequence repeats within allele B of the hs1.2 enhancer, supporting a significant contribution of the invariant sequence to transcriptional activity of the hs1.2 enhancer (Fernando et al. 2012). Interestingly, our mutational analysis suggests that the NF1 site is the primary positive mediator within the invariant sequence of basal and LPS-induced transcriptional activity, whereas the other invariant sequence binding sites had modest to pronounced inhibitory effects on hs1.2 activity. Furthermore, mutation of the NF1 site significantly impaired TCDD-induced hs1.2 activity but only in stimulated cells. NF1 has previously been identified in TCDD-induced Cyp1a1 induction (i.e. a hallmark AhR-mediated response to TCDD exposure). Two NF1 binding sites were identified in the mouse Cyp1a1 minimal promoter (i.e. lacking the upstream DRE binding sites) and deletional analysis with a CAT (chloramphenicol acetyltransferase) reporter containing the Cyp1a1 promoter and one DRE binding motif demonstrated that both NF1 sites are necessary for full TCDD-induced reporter activation (Jones and Whitlock 1990). In contrast to Cyp1a1 transactivation, the putative DRE site appears to be a weak negative regulator of TCDD-induced hs1.2 activity but only in stimulated cells. Since mutation of the putative DRE and Sp-1.1 sites individually results in a weak inhibition of TCDD-induced hs1.2 activity in stimulated cells, loss of the NF1 binding site may allow the negative regulation of proteins binding the putative Sp-1.1 and DRE sites to dominate. A previous study has verified binding of Sp-1 proteins to the hs1.2 enhancer, but there is no information available about the role Sp-1 plays in IGH regulation. Sp-1 is often associated with other transcription factors, especially those proposed to bind within the hs1.2 enhancer (Nehls et al. 1991, Kobayashi et al. 1996, Wang et al. 1999, Rafty et al. 2002, Safe and Abdelrahim 2005, Tapias et al. 2008). In particular, other groups have shown interactions between Sp-1 and NF1 and also between Sp-1 and the AhR (Nehls et al. 1991, Kobayashi et al. 1996, Wang et al. 1999, Rafty et al. 2002). Although the current results do not support a cooperative interaction between the NF1 and DRE or Sp-1 binding sites, previous antagonist studies do support an AhR-dependent induction of hs1.2 enhancer activity by TCDD (Fernando et al. 2012), further suggesting non-canonical AhR signaling perhaps mediated through direct and indirect interactions with other transcription factors. Because the NF1 and AP-1 sites are the primary inducers of hs1.2 activity and previous studies have identified interactions between the AhR and NF1 and the AP-1 proteins, Jun-B and c-Fos (Suh et al. 2002; Jones and Whitlock 1990), it is tempting to speculate that the AhR interacts with NF1 and AP-1 to enhance transcriptional activity of the hs1.2 enhancer.
Notably, the double mutation of the DRE core binding motif and the κB site within the invariant sequence resulted in an ~5-fold higher hs1.2 basal and LPS-stimulated enhancer activity, which was similar to the increase induced by deletion of the invariant sequence with mutation of the POU binding site. Perhaps the proteins binding to these sites (i.e. κB, DRE, and POU) interact with each other to negatively regulate the hs1.2 enhancer. As mentioned previously, POU in cooperation with Pax5, and G-rich, κB-like motifs repress transcription of the mouse hs1.2 enhancer but this repression is reversed with B-cell activation due to a decrease in Pax5 levels (Michaelson et al. 1996, Singh and Birshtein 1996). Furthermore, interactions between the AhR and NFκB/Rel proteins have been shown to directly influence DNA binding and transcriptional activity in various target genes including the mouse hs1.2 and hs4 enhancers (Tian 2009, Vogel and Matsumura 2009, Salisbury and Sulentic 2015). We have previously identified inhibition of mouse hs1.2 transcriptional activity that appeared to be mediated by the AhR altering the binding profile of specific NFκB/Rel dimers to the κB motif (Salisbury and Sulentic 2015). The NF-κB/Rel subunits (RelA, RelB, c-Rel, p50 and p52) can form homo- or hetero-dimers, which have inhibitory or stimulatory roles depending on the specific transcriptional target and potential interactions with other transcription factors such as the AhR. In contrast to our results with the mouse hs1.2 enhancer, we were unable to identify binding of the AhR to the human hs1.2 enhancer via electrophoretic mobility shift assay (data not shown) and a κB consensus oligo did not compete for protein binding to the hs1.2-allele A enhancer sequence (Frezza et al. 2012). Therefore, the AhR and NFκB/Rel proteins may not play a direct transactivation role in hs1.2 enhancer activity; however, electrophoretic mobility shift assays do not rule out the possibility of weak DNA binding or indirect interactions (i.e., through protein-protein binding with other transcription factors) of the AhR and NFκB/Rel proteins in the human hs1.2 enhancer.
Alternatively, the repressive effect on transcriptional activity may be mediated by other transcription factors. In silico analysis of the wildtype hs1.2-allele A enhancer using the MEME Suite Tomtom motif comparison tool (Bailey et al. 2009) identified other potential transcription factor binding motifs within the IS that were eliminated with mutation of the putative κB or DRE motifs. These included PPARγ (peroxisome proliferator-activated receptor γ), Smad3, and Hic1 (hypermethylated-in-cancer 1) for mutation of the DRE core motif and Hey1/2, Myf6 (myogenic factor 6), and PU.1 (PU box binding-1) for mutation of the putative κB motif. Although a potential role of these transcription factors in human IGH gene regulation or hs1.2 enhancer activity has not been directly evaluated, many have been shown to have repressive effects on B-cell differentiation. Of relevance to B-cell activation and differentiation, PPARs can inhibit AP-1 and NFκB activity; however, PPARγ appears to be more highly expressed than PPARγ in B cells and its binding motif is markedly different from the putative PPARγ site in the hs1.2 enhancer (Jones et al. 2002, Ricote and Glass 2007, Yasmeen et al. 2013, Tzeng et al. 2015). Smad3 interacts with Sp-1 and AP-1 proteins and may be a negative regulator of B-cell differentiation because its expression is decreased during differentiation to plasma cells (Feng et al. 2000, Verrecchia et al. 2001, Sundqvist et al. 2013, Caron et al. 2015). However, Smad3 also induces IgA CSR in a mouse B cell line (Lee et al. 2014). Furthermore, studies have demonstrated a cooperative interaction between Smad3 and PU.1 to promote germline transcription of the α constant region and CSR to IgA (Malhotra and Kang 2013). Similar to the proposed negative effect of Smad3 on B-cell differentiation, PU.1 knockout increased plasma cell number (Willis et al. 2017). Therefore, despite an overall negative role in B-cell differentiation, it is possible that Smad3 and PU.1 could induce germline transcription of the α constant region and CSR to IgA by influencing hs1.2 activity and the 3′IGHRR. Little is known regarding Myf6 or Hey1/2. Nagel and coworkers (Nagel et al. 2013) suggested a model where Hey1 inhibits B-cell differentiation but no direct evidence for this was provided. Hic1, on the other hand, may be a positive regulator of B-cell differentiation. Hic1 levels increase during B-cell differentiation and it appears to function as an epigenetic repressor. Hic1 was shown to interact with DNA methyltransferases to inhibit the class II transcriptional coactivator (CIITA) gene (Zeng et al. 2016), which is normally downregulated in differentiating B cells (Green et al. 2006). Overall, these proteins warrant further analysis to determine if they play a role in the transcriptional regulation of the hs1.2 enhancer or in the larger context of 3′IGHRR activity, IGH expression, and CSR. Regardless, the current mutational analysis suggests a complicated interaction between several transcription factors that could also be modulated by environmental stressors and the activation state of the cell.
Overall our results suggest that the invariant sequence can have both a positive and negative influence on hs1.2 enhancer activity, which appears to be mediated by different transcription factor binding sites (i.e. κB and DRE negative; NF1 positive) and likely interactions with transcription factors within and outside the invariant sequence. Perhaps the invariant sequence functions as a fine regulator of hs1.2 enhancer activity such that the ratio of transcription factors, including the specific dimers (e.g. NFκB/Rel proteins) binding within the invariant sequence and influenced by cellular stimulation or xenobiotic exposures, alters interactions with other transcription factors (e.g. AP-1.ETS and POU) and transcriptional machinery to either induce or inhibit hs1.2 enhancer activity. Chen and Birshtein suggested a similar conclusion and demonstrated both a positive and negative impact of the invariant sequence repeats on hs1.2 enhancer activity (Chen and Birshtein 1997). Specifically, in a human plasma cell line, they evaluated the hs1.2 enhancer (~1.6 kb sequence) from both the 3′IGHRR-1 and 3′IGHRR-2 as well as a 177 bp core sequence within the human hs1.2 enhancer that is ~75% conserved with mouse and rat and contains the AP-1.ETS, POU, and one invariant sequence (Chen and Birshtein 1997). As mentioned previously, the 3′IGHRR-1 hs1.2 enhancer (i.e. allele A with one IS) produced lower reporter activity as compared to the 3′IGHRR-2 hs1.2 enhancer (i.e. allele D with four IS repeats) but deletion of the IS repeats in the 3′IGHRR-2 hs1.2 enhancer resulted in the highest reporter activity (Chen and Birshtein 1997). Evaluation of the 177 bp core sequence containing AP-1.ETS, POU, and one invariant sequence demonstrated comparable activity to the ~ 1.6 kb 3′IGHRR-1 hs1.2 enhancer but addition of three more invariant sequence repeats to the 177 bp core had a negative impact on transcriptional activity, opposite of the positive transcriptional influence of four invariant sequence repeats on the larger 3′IGHRR-2 hs1.2 enhancer. The authors suggested that transcriptional regulation via the invariant sequence repeats could be dependent on the surrounding motifs, interactions between proteins binding to these sites as well as the cell type (e.g. allotypic variations and B-cell maturation stage) (Chen and Birshtein 1997). The three-dimensional structure of the 3′IGHRRs also likely influences interactions with other regulatory regions within the IGH gene, which could be impacted by changes in the number of invariant sequence repeats (D’Addaboo et al. 2011, Le Noir et al. 2017, Saintamand et al. 2016). A clear limitation of reporter studies is the inability to effectively study the structural impact or to evaluate the entire ~17 kb 3′IGHRR-1.
Because of the previous associations between the number of invariant sequence repeats and IGH expression, Ig levels and disease states, understanding the transcriptional regulation through the polymorphic hs1.2 enhancer may be the key to developing new therapeutics to control IGH expression and Ig isotype levels with the ultimate goal of alleviating antibody-mediated diseases. Additionally, the AhR is known to interact directly or indirectly with a number of transcription factors including those thought to bind within the hs1.2 enhancer, such as AP-1, NFκB, and Sp-1 (Kobayashi et al. 1996, Suh et al. 2002, Khan et al. 2006, Tian 2009, Vogel et al. 2013, Salisbury and Sulentic 2015). Even though a link between the AhR and POU remains unclear, high frequency of POU sites were found in AhR-responsive genes using a genetic algorithm, thus suggesting a potential role for POU in mediating a response to TCDD (Kel et al. 2004). Therefore, the AhR could be a significant modulator of sites outside and within the invariant sequence, which are also likely influenced by exogenous factors (i.e. stimulation and/or xenobiotics).
There are very limited studies evaluating environmental influences on human hs1.2 enhancer activity. Most studies have evaluated basal enhancer activity and there are even less studies evaluating the human enhancer. We have reported that TCDD, a prototypic high affinity AhR ligand, induced a significant increase in overall human hs1.2 transcriptional activity that was dependent on the AhR and the allelic state of the hs1.2 enhancer (Fernando et al. 2012). Studies evaluating human primary lymphocytes have generally identified an inhibitory effect of TCDD on IgM secretion (Wood et al. 1993, Lu et al. 2010, Dornbos, et al. 2016)), but this effect appears to be limited to a specific B-lymphocyte subtype (Zhou et al. 2018). In regard to other antibody isotypes, TCDD has been shown to increase IgE expression in B-lymphocytes isolated from patients with atopic dermatitis (Kimata 2003). Evaluation of Korean Veterans (Vietnam War) suspected of being exposed to the TCDD-contaminated herbicide Agent Orange demonstrated an increase in plasma IgE and a decrease in plasma IgG1 (Kim et al. 2003). Additionally, a correlation between increased TCDD plasma concentrations and decreased IgG levels was revealed in a population exposed to TCDD in Seveso, Italy (Baccarelli et al. 2002). These studies support a differential effect of AhR activation on antibody isotypic profiles that may be mediated through the 3′IGHRR enhancers, particularly the polymorphic hs1.2 enhancer, and could be associated with disease states such as decreased immune competence (i.e. decreased IgM and IgG) and increased hypersensitivity (i.e. non-specific increase in IgE).
5. CONCLUSION
These results suggest a complex interplay between different transcription factors in the regulation of the hs1.2 enhancer. Notably, regulation of basal and LPS-stimulated hs1.2 enhancer activity was dependent on the same sites with the AP-1.ETS site being the primary inducer of activity and the POU site a major suppressor of activity. The invariant sequence appeared to play more of a modulatory role on both the AP-1.ETS and POU sites, perhaps through interactions with the transcription factors binding within the hs1.2 enhancer. We propose that proteins binding to both the putative DRE and κB sites inhibit AP-1.ETS-induced transcriptional activity, through a cooperative interaction with the POU family of proteins. However, in silico analysis identified potential binding motifs for transcription factors other than the AhR and NF-κB/Rel proteins that could mediate the inhibitory effect of the putative DRE and κB sites (i.e. PPARγ, Smad3, Hic1 for DRE core motif and Hey1/2, Myf6, PU.1 for putative κB motif). Additionally, the putative NF1 site appears to be the only site within the invariant sequence responsible for a stimulatory effect on hs1.2 activity, which could be mediated by altering the interactions between the inhibitory transcription factors, thus blunting the repression of AP-1.ETS.
TCDD-induced hs1.2 enhancer activation appears to be regulated differently under basal versus LPS-stimulated conditions (Fig. 6). The POU site is a significant suppressor of TCDD-induced hs1.2 activity but only in unstimulated cells. Although the current study supports the putative NF1 site as a primary transcriptional activator of TCDD-induced hs1.2 activation, this is limited to LPS stimulation and does not account for the stimulatory effect of TCDD in unstimulated cells (Fig. 6). However, none of the putative transcription factor binding sites evaluated in this study can adequately account for the effect of TCDD in unstimulated cells, including the DRE-like site despite its weak inducing effect. These results suggest that other as yet unidentified transcription factors and binding sites are involved. Another possible explanation is a compensatory effect of other stimulatory binding sites that cannot be detected by single mutations. Since previous studies support an AhR-mediated induction of hs1.2 activity by TCDD (Fernando et al. 2012), these results support an as yet undetermined non-canonical pathway (i.e. not through DRE-binding of the AhR:ARNT dimer), likely involving protein:protein interactions between the AhR and other transcription factors. Understanding the role of the hs1.2 enhancer in human Ig expression and how AhR ligands modulate its activity may lead to insights into overall Ig regulation, mechanisms of dysfunction, and individual susceptibility to environmental triggers such as AhR ligands.
Supplementary Material
Highlights.
Mutational analysis of the human Ig heavy chain polymorphic hs1.2 enhancer
AP-1.ETS and POU binding sites have opposing effects on hs1.2 enhancer activity
Effects of AP-1.ETS and POU sites are modulated by the hs1.2 polymorphic sequence
Dioxin induced hs1.2 activity independent of the binding site for the AhR
A putative NF-1 binding site partially mediates dioxin-induced hs1.2 activity
Acknowledgments
We are thankful for the generous contributions from Dr. Michel Cogne, for providing the human hs1.2 luciferase reporter plasmid; Dr. Geoffrey Haughton (in memoriam), for providing the CH12.LX cells; and Dr. Michael Denison, for verifying, via electrophoretic mobility shift assay, the lack of AhR binding to the DRE-like motif within the human hs1.2 enhancer.
Funding: This work was supported in part by funds from the National Institute of Environmental Health Sciences [grant R01ES014676 plus supplement 05S1]; and the National Institute of General Medical Sciences [grant R25GM090122]. The content is solely the responsibility of the authors and does not necessarily represent the official views of the funding organizations acknowledged above.
Footnotes
Publisher's Disclaimer: This is a PDF file of an unedited manuscript that has been accepted for publication. As a service to our customers we are providing this early version of the manuscript. The manuscript will undergo copyediting, typesetting, and review of the resulting proof before it is published in its final form. Please note that during the production process errors may be discovered which could affect the content, and all legal disclaimers that apply to the journal pertain.
1 Abbreviations: AhR, aryl hydrocarbon receptor; ARNT, AhR nuclear translocator; CSR, class switch recombination; DRE, dioxin response enhancer; Eμ, intronic enhancer; Igh, immunoglobulin heavy chain gene; 3′IghRR, mouse 3′Igh regulatory region; 3′IGHRR, human 3′IGH regulatory region; hs1.2, hs1.2 enhancer within the 3′IGHRR; IS, invariant sequence within the hs1.2 enhancer; LPS, lipopolysaccharide; TLR4, toll-like receptor; TCDD, 2,3,7,8-tetracholorodibenzo-p-dioxin
REFERENCES
- Arnold LW, LoCascio NJ, Lutz PM, Pennell CA, Klapper D and Haughton G (1983). “Antigen-induced lymphomagenesis: identification of a murine B cell lymphoma with known antigen specificity.” J Immunol 131(4): 2064–2068. [PubMed] [Google Scholar]
- Aupetit C, Drouet M, Pinaud E, Denizot Y, Aldigier JC, Bridoux F and Cogne M (2000). “Alleles of the alpha1 immunoglobulin gene 3′ enhancer control evolution of IgA nephropathy toward renal failure.” Kidney Int 58(3): 966–971. [DOI] [PubMed] [Google Scholar]
- Baccarelli A, Mocarelli P, Patterson DG, Bonzini M, Pesatori AC, Caporaso N, Landi MT (2002). “ Immunologic effects of dioxin: new results from Seveso and comparison with other studies.” Environ Health Perspect 110(12): 1169–73. [DOI] [PMC free article] [PubMed] [Google Scholar]
- Bailey TL, Boden M, Buske FA, Frith M, Grant CE, Clementi L, Ren J, Li WW and Noble WS (2009). “MEME SUITE: tools for motif discovery and searching.” Nucleic Acids Res 37(Web Server issue): W202–208. [DOI] [PMC free article] [PubMed] [Google Scholar]
- Bishop GA (1992). “Signaling to a CD5+ B-cell clone through surface Ig and MHC class II molecules.” Ann N Y Acad Sci 651: 228–240. [DOI] [PubMed] [Google Scholar]
- Bishop GA and Haughton G (1986). “Induced differentiation of a transformed clone of Ly-1+ B cells by clonal T cells and antigen.” Proc Natl Acad Sci U S A 83(19): 7410–7414. [DOI] [PMC free article] [PubMed] [Google Scholar]
- Bishop GA, Pennell CA, Travis W, Haughton G and Frelinger JA (1990). “Antibodies specific for Ig idiotype, but not isotype, can substitute for antigen to induce IgM secretion by a B cell clone.” Int Immunol 2(4): 285–290. [DOI] [PubMed] [Google Scholar]
- Boverhof DR, Tam E, Harney AS, Crawford RB, Kaminski NE and Zacharewski TR (2004). “2,3,7,8-Tetrachlorodibenzo-p-dioxin induces suppressor of cytokine signaling 2 in murine B cells.” Mol Pharmacol 66(6): 1662–1670. [DOI] [PubMed] [Google Scholar]
- Brandtzaeg P (2003). “Role of secretory antibodies in the defence against infections.” Int J Med Microbiol 293(1): 3–15. [DOI] [PubMed] [Google Scholar]
- Caron G, Hussein M, Kulis M, Delaloy C, Chatonnet F, Pignarre A, Avner S, Lemarie M, Mahe EA, Verdaguer-Dot N, Queiros AC, Tarte K, Martin-Subero JI, Salbert G and Fest T (2015). “Cell-Cycle-Dependent Reconfiguration of the DNA Methylome during Terminal Differentiation of Human B Cells into Plasma Cells.” Cell Rep 13(5): 1059–1071. [DOI] [PubMed] [Google Scholar]
- Chen C and Birshtein BK (1997). “Virtually identical enhancers containing a segment of homology to murine 3′IgH-E(hs1,2) lie downstream of human Ig C alpha 1 and C alpha 2 genes.” J Immunol 159(3): 1310–1318. [PubMed] [Google Scholar]
- Cianci R, Giambra V, Mattioli C, Esposito M, Cammarota G, Scibilia G, Magazzu G, Orlando A, Sandri G, Bianchi L, Gasbarrini GB, Pandolfi F and Frezza D (2008). “Increased frequency of Ig heavy-chain HS1,2-A enhancer *2 allele in dermatitis herpetiformis, plaque psoriasis, and psoriatic arthritis.” J Invest Dermatol 128(8): 1920–1924. [DOI] [PubMed] [Google Scholar]
- Crawford RB, Sulentic CEW, Yoo BS and Kaminski NE (2003). “2,3,7,8-Tetrachlorodibenzo-p-dioxin (TCDD) alters the regulation and posttranslational modification of p27kip1 in lipopolysaccharide-activated B cells.” Toxicol Sci 75(2): 333–342. [DOI] [PubMed] [Google Scholar]
- D’Addabbo P, Scascitelli M, Giambra V, Rocchi M and Frezza D (2011). “Position and sequence conservation in Amniota of polymorphic enhancer HS1.2 within the palindrome of IgH 3’Regulatory Region.” BMC Evol Biol 11: 71. [DOI] [PMC free article] [PubMed] [Google Scholar]
- De Abrew KN, Kaminski NE and Thomas RS (2010). “An integrated genomic analysis of aryl hydrocarbon receptor-mediated inhibition of B-cell differentiation.” Toxicol Sci 118(2): 454–469. [DOI] [PMC free article] [PubMed] [Google Scholar]
- Denizot Y, Pinaud E, Aupetit C, Le Morvan C, Magnoux E, Aldigier JC and Cogne M (2001). “Polymorphism of the human alpha1 immunoglobulin gene 3’ enhancer hs1,2 and its relation to gene expression.” Immunology 103(1): 35–40. [DOI] [PMC free article] [PubMed] [Google Scholar]
- Dornbos P, Crawford RB, Kaminski NE, Hession SL, LaPres JJ (2016) “The Influence of Human Interindividual Variability on the Low-Dose Region of Dose-Response Curve Induced by 2,3,7,8-Tetrachlorodibenzo-p-Dioxin in Primary B Cells ” Toxicol Sci 153(2): 352–60. [DOI] [PMC free article] [PubMed] [Google Scholar]
- Feng XH, Lin X and Derynck R (2000). “Smad2, Smad3 and Smad4 cooperate with Sp1 to induce p15(Ink4B) transcription in response to TGF-beta.” EMBO J 19(19): 5178–5193. [DOI] [PMC free article] [PubMed] [Google Scholar]
- Fernando TM, Ochs SD, Liu J, Chambers-Turner RC and Sulentic CEW (2012). “2,3,7,8-Tetrachlorodibenzo-p-Dioxin Induces Transcriptional Activity of the Human Polymorphic hs1,2 Enhancer of the 3′Igh Regulatory Region.” J Immunol 188(7): 3294–3306. [DOI] [PMC free article] [PubMed] [Google Scholar]
- Frezza D, Giambra V, Cianci R, Fruscalzo A, Giufre M, Cammarota G, Martinez-Labarga C, Rickards O, Scibilia G, Sferlazzas C, Bartolozzi F, Starnino S, Magazzu G, Gasbarrini GB and Pandolfi F (2004). “Increased frequency of the immunoglobulin enhancer HS1,2 allele 2 in coeliac disease.” Scand J Gastroenterol 39(11): 1083–1087. [DOI] [PubMed] [Google Scholar]
- Frezza D, Giambra V, Mattioli C, Piccoli K, Massoud R, Siracusano A, Di Giannantonio M, Birshtein BK and Rubino IA (2009). “Allelic frequencies of 3′ Ig heavy chain locus enhancer HS1,2-A associated with Ig levels in patients with schizophrenia.” Int J Immunopathol Pharmacol 22(1): 115–123. [DOI] [PMC free article] [PubMed] [Google Scholar]
- Frezza D, Giambra V, Tolusso B, De Santis M, Bosello S, Vettori S, Triolo G, Valentini G and Ferraccioli G (2007). “Polymorphism of immunoglobulin enhancer element HS1,2A: allele *2 associates with systemic sclerosis. Comparison with HLA-DR and DQ allele frequency.” Ann Rheum Dis 66(9): 1210–1215. [DOI] [PMC free article] [PubMed] [Google Scholar]
- Frezza D, Tolusso B, Giambra V, Gremese E, Marchini M, Nowik M, Serone E, D’Addabbo P, Mattioli C, Canestri S, Petricca L, D’Antona G, Birshtein BK, Scorza R and Ferraccioli G (2012). “Polymorphisms of the IgH enhancer HS1.2 and risk of systemic lupus erythematosus.” Ann Rheum Dis 71(8): 1309–1315. [DOI] [PubMed] [Google Scholar]
- Gadermaier E, Levin M, Flicker S and Ohlin M (2014). “The human IgE repertoire.” Int Arch Allergy Immunol 163(2): 77–91. [DOI] [PMC free article] [PubMed] [Google Scholar]
- Giambra V, Cianci R, Lolli S, Mattioli C, Tampella G, Cattalini M, Kilic SS, Pandolfi F, Plebani A and Frezza D (2009). “Allele *1 of HS1.2 enhancer associates with selective IgA deficiency and IgM concentration.” J Immunol 183(12): 8280–8285. [DOI] [PubMed] [Google Scholar]
- Giambra V, Fruscalzo A, Giufre M, Martinez-Labarga C, Favaro M, Rocchi M and Frezza D (2005). “Evolution of human IgH3′EC duplicated structures: both enhancers HS1,2 are polymorphic with variation of transcription factor’s consensus sites.” Gene 346: 105–114. [DOI] [PubMed] [Google Scholar]
- Grant PA, Thompson CB and Pettersson S (1995). “IgM receptor-mediated transactivation of the IgH 3′ enhancer couples a novel Elf-1-AP-1 protein complex to the developmental control of enhancer function.” EMBO J 14(18): 4501–4513. [DOI] [PMC free article] [PubMed] [Google Scholar]
- Green MR, Yoon H and Boss JM (2006). “Epigenetic regulation during B cell differentiation controls CIITA promoter accessibility.” J Immunol 177(6): 3865–3873. [DOI] [PubMed] [Google Scholar]
- Guglielmi L, Truffinet V, Magnoux E, Cogne M and Denizot Y (2004). “The polymorphism of the locus control region lying downstream the human IgH locus is restricted to hs1,2 but not to hs3 and hs4 enhancers.” Immunol Lett 94(1–2): 77–81. [DOI] [PubMed] [Google Scholar]
- Heinemeyer T, Wingender E, Reuter I, Hermjakob H, Kel AE, Kel OV, Ignatieva EV, Ananko EA, Podkolodnaya OA, Kolpakov FA, Podkolodny NL and Kolchanov NA (1998). “Databases on transcriptional regulation: TRANSFAC, TRRD and COMPEL.” Nucleic Acids Res 26(1): 362–367. [DOI] [PMC free article] [PubMed] [Google Scholar]
- Henseler RA, Romer EJ and Sulentic CEW (2009). “Diverse chemicals including aryl hydrocarbon receptor ligands modulate transcriptional activity of the 3′immunoglobulin heavy chain regulatory region.” Toxicology 261(1–2): 9–18. [DOI] [PMC free article] [PubMed] [Google Scholar]
- Jones DC, Ding X and Daynes RA (2002). “Nuclear receptor peroxisome proliferator-activated receptor alpha (PPARalpha) is expressed in resting murine lymphocytes. The PPARalpha in T and B lymphocytes is both transactivation and transrepression competent.” J Biol Chem 277(9): 6838–6845. [DOI] [PubMed] [Google Scholar]
- Jones KW and Whitlock JP Jr. (1990). “Functional analysis of the transcriptional promoter for the CYP1A1 gene.” Mol Cell Biol 10(10): 5098–5105. [DOI] [PMC free article] [PubMed] [Google Scholar]
- Kel A, Reymann S, Matys V, Nettesheim P, Wingender E and Borlak J (2004). “A novel computational approach for the prediction of networked transcription factors of aryl hydrocarbon-receptor-regulated genes.” Mol Pharmacol 66(6): 1557–1572. [DOI] [PubMed] [Google Scholar]
- Khamlichi AA, Pinaud E, Decourt C, Chauveau C and Cogne M (2000). “The 3′ IgH regulatory region: a complex structure in a search for a function.” Adv Immunol 75: 317–345. [DOI] [PubMed] [Google Scholar]
- Khan S, Barhoumi R, Burghardt R, Liu S, Kim K and Safe S (2006). “Molecular mechanism of inhibitory aryl hydrocarbon receptor-estrogen receptor/Sp1 cross talk in breast cancer cells.” Mol Endocrinol 20(9): 2199–2214. [DOI] [PubMed] [Google Scholar]
- Kim EC, Edmonston CR, Wu X, Schaffer A and Casali P (2004). “The HoxC4 homeodomain protein mediates activation of the immunoglobulin heavy chain 3’ hs1,2 enhancer in human B cells. Relevance to class switch DNA recombination.” J Biol Chem 279(40): 42258–42269. [DOI] [PMC free article] [PubMed] [Google Scholar]
- Kim HA, Kim EM, Park YC, Yu JY, Hong SK, Jeon SH, Park KL, Hur SJ, Heo Y (2003) “Immunotoxicological effects of Agent Orange exposure to the Vietnam War Korean veterans.” Ind Health 41(3): 158–66. [DOI] [PubMed] [Google Scholar]
- Kimata H (2003) “2,3,7,8-tetrachlorodibenzo-p-dioxin selectively enhances spontaneous IgE production in B cells from atopic patients.” Int J Hyg Environ Health 206(6): 601–4. [DOI] [PubMed] [Google Scholar]
- Kimura S, Tamamura T, Nakagawa I, Koga T, Fujiwara T and Hamada S (2000). “CD14-dependent and independent pathways in lipopolysaccharide-induced activation of a murine B-cell line, CH12. LX.” Scand J Immunol 51(4): 392–399. [DOI] [PubMed] [Google Scholar]
- Kobayashi A, Sogawa K and Fujii-Kuriyama Y (1996). “Cooperative interaction between AhR.Arnt and Sp1 for the drug-inducible expression of CYP1A1 gene.” J Biol Chem 271(21): 12310–12316. [DOI] [PubMed] [Google Scholar]
- Kunimoto DY, Harriman GR and Strober W (1988). “Regulation of IgA differentiation in CH12LX B cells by lymphokines. IL-4 induces membrane IgM-positive CH12LX cells to express membrane IgA and IL-5 induces membrane IgA-positive CH12LX cells to secrete IgA.” J Immunol 141(3): 713–720. [PubMed] [Google Scholar]
- Kunimoto DY, Sneller MC, Claflin L, Mushinski JF and Strober W (1993). “Molecular analysis of double isotype expression in IgA switching.” J Immunol 150(4): 1338–1347. [PubMed] [Google Scholar]
- Le Noir S, Boyer F, Lecardeur S, Brousse M, Oruc Z, Cook-Moreau J, Denizot Y, Cogne M (2017). “Functional anatomy of the immunoglobulin heavy chain 3 super-enhancer needs not only core enhancer elements but also their unique DNA context.” Nucleic Acids Res 45 (10): 5829–5837. [DOI] [PMC free article] [PubMed] [Google Scholar]
- Lee SH, Kim PH, Oh SM, Park JH, Yoo YC, Lee J and Park SR (2014). “SUMO Proteins are not Involved in TGF-beta1-induced, Smad3/4-mediated Germline alpha Transcription, but PIASy Suppresses it in CH12F3–2A B Cells.” Immune Netw 14(6): 321–327. [DOI] [PMC free article] [PubMed] [Google Scholar]
- Lenardo M, Pierce JW and Baltimore D (1987). “Protein-binding sites in Ig gene enhancers determine transcriptional activity and inducibility.” Science 236(4808): 1573–1577. [DOI] [PubMed] [Google Scholar]
- LoCascio NJ, Haughton G, Arnold LW and Corley RB (1984). “Role of cell surface immunoglobulin in B-lymphocyte activation.” Proc Natl Acad Sci U S A 81(8): 2466–2469. [DOI] [PMC free article] [PubMed] [Google Scholar]
- Lu H, Crawford RB, Suarez-Martinez JE, Kaplan BL, Kaminski NE (2010). “Induction of the aryl hydrocarbon receptor-responsive genes and modulation of the immunoglobulin M response by 2,3,7,8-tetrachlorodibenzo-p-dioxin in primary human B cells.” Toxicol Sci 118(1): 86–97. [DOI] [PMC free article] [PubMed] [Google Scholar]
- Louie SW, Ramirez LM, Krieg AM, Maliszewski CR and Bishop GA (1993). “Endogenous secretion of IL-4 maintains growth and Thy-1 expression of a transformed B cell clone.” J Immunol 150(2): 399–406. [PubMed] [Google Scholar]
- Ludwig RJ, Vanhoorelbeke K, Leypoldt F, Kaya Z, Bieber K, McLachlan SM, Komorowski L, Luo J, Cabral-Marques O, Hammers CM, Lindstrom JM, Lamprecht P, Fischer A, Riemekasten G, Tersteeg C, Sondermann P, Rapoport B, Wandinger KP, Probst C, El Beidaq A, Schmidt E, Verkman A, Manz RA and Nimmerjahn F (2017). “Mechanisms of Autoantibody-Induced Pathology.” Front Immunol 8: 603. [DOI] [PMC free article] [PubMed] [Google Scholar]
- Malhotra N and Kang J (2013). “SMAD regulatory networks construct a balanced immune system.” Immunology 139(1): 1–10. [DOI] [PMC free article] [PubMed] [Google Scholar]
- Michaelson JS, Singh M, Snapper CM, Sha WC, Baltimore D and Birshtein BK (1996). “Regulation of 3′ IgH enhancers by a common set of factors, including kappa B-binding proteins.” J Immunol 156(8): 2828–2839. [PubMed] [Google Scholar]
- Mills FC, Harindranath N, Mitchell M and Max EE (1997). “Enhancer complexes located downstream of both human immunoglobulin Calpha genes.” J Exp Med 186(6): 845–858. [DOI] [PMC free article] [PubMed] [Google Scholar]
- Montesano C, Giambra V, Frezza D, Palma P, Serone E, Gattinara GC, Mattei M, Mancino G, Colizzi V and Amicosante M (2014). “HS1,2 Ig enhancer alleles association to AIDS progression in a pediatric cohort infected with a monophyletic HIV-strain.” Biomed Res Int 2014: 637523. [DOI] [PMC free article] [PubMed] [Google Scholar]
- Nagel S, Ehrentraut S, Tomasch J, Quentmeier H, Meyer C, Kaufmann M, Drexler HG and MacLeod RA (2013). “Ectopic expression of homeobox gene NKX2–1 in diffuse large B-cell lymphoma is mediated by aberrant chromatin modifications.” PLoS One 8(4): e61447. [DOI] [PMC free article] [PubMed] [Google Scholar]
- Nehls MC, Rippe RA, Veloz L and Brenner DA (1991). “Transcription factors nuclear factor I and Sp1 interact with the murine collagen alpha 1 (I) promoter.” Mol Cell Biol 11(8): 4065–4073. [DOI] [PMC free article] [PubMed] [Google Scholar]
- Neurath MF, Strober W and Wakatsuki Y (1994). “The murine Ig 3′ alpha enhancer is a target site with repressor function for the B cell lineage-specific transcription factor BSAP (NF-HB, S alpha-BP).” J Immunol 153(2): 730–742. [PubMed] [Google Scholar]
- North CM, Crawford RB, Lu H and Kaminski NE (2010). “2,3,7,8-tetrachlorodibenzo-p-dioxin-mediated suppression of toll-like receptor stimulated B-lymphocyte activation and initiation of plasmacytic differentiation.” Toxicol Sci 116(1): 99–112. [DOI] [PMC free article] [PubMed] [Google Scholar]
- Pierce JW, Lenardo M and Baltimore D (1988). “Oligonucleotide that binds nuclear factor NF-kappa B acts as a lymphoid-specific and inducible enhancer element.” Proc Natl Acad Sci U S A 85(5): 1482–1486. [DOI] [PMC free article] [PubMed] [Google Scholar]
- Pinaud E, Aupetit C, Chauveau C and Cogne M (1997). “Identification of a homolog of the C alpha 3′/hs3 enhancer and of an allelic variant of the 3′IgH/hs1,2 enhancer downstream of the human immunoglobulin alpha 1 gene.” Eur J Immunol 27(11): 2981–2985. [DOI] [PubMed] [Google Scholar]
- Pinaud E, Marquet M, Fiancette R, Peron S, Vincent-Fabert C, Denizot Y and Cogne M (2011). “The IgH locus 3′ regulatory region: pulling the strings from behind.” Adv Immunol 110: 27–70. [DOI] [PubMed] [Google Scholar]
- Rafty LA, Santiago FS and Khachigian LM (2002). “NF1/X represses PDGF A-chain transcription by interacting with Sp1 and antagonizing Sp1 occupancy of the promoter.” EMBO J 21(3): 334–343. [DOI] [PMC free article] [PubMed] [Google Scholar]
- Ricote M and Glass CK (2007). “PPARs and molecular mechanisms of transrepression.” Biochim Biophys Acta 1771(8): 926–935. [DOI] [PMC free article] [PubMed] [Google Scholar]
- Romer EJ and Sulentic CEW (2011). “Hydrogen peroxide modulates immunoglobulin expression by targeting the 3’Igh regulatory region through an NFkappaB-dependent mechanism.” Free Radic Res 45(7): 796–809. [DOI] [PMC free article] [PubMed] [Google Scholar]
- Rouaud P, Vincent-Fabert C, Saintamand A, Fiancette R, Marquet M, Robert I, Reina-San-Martin B, Pinaud E, Cogne M and Denizot Y (2013). “The IgH 3′ regulatory region controls somatic hypermutation in germinal center B cells.” J Exp Med 210(8): 1501–1507. [DOI] [PMC free article] [PubMed] [Google Scholar]
- Roy AL, Sen R and Roeder RG (2011). “Enhancer-promoter communication and transcriptional regulation of Igh.” Trends Immunol 32(11): 532–539. [DOI] [PMC free article] [PubMed] [Google Scholar]
- Safe S and Abdelrahim M (2005). “Sp transcription factor family and its role in cancer.” Eur J Cancer 41(16): 2438–2448. [DOI] [PubMed] [Google Scholar]
- Salisbury RL and Sulentic CE (2015). “The AhR and NF-kappaB/Rel Proteins Mediate the Inhibitory Effect of 2,3,7,8-Tetrachlorodibenzo-p-Dioxin on the 3’ Immunoglobulin Heavy Chain Regulatory Region.” Toxicol Sci 148(2): 443–459. [DOI] [PMC free article] [PubMed] [Google Scholar]
- Santamand A, Vincent-Fabert C, Garot C,A, Rouaud P, Oruc Z, Magnone V, Cogne M, Denizot Y (2016) “ Deciphering the importance of the palindromic architecture of the immunoglobulin heavy-chain 3′ regulatory region.” Nat Commun 7:10730. [DOI] [PMC free article] [PubMed] [Google Scholar]
- Schneider D, Manzan MA, Crawford RB, Chen W and Kaminski NE (2008). “2,3,7,8-Tetrachlorodibenzo-p-dioxin-mediated impairment of B cell differentiation involves dysregulation of paired box 5 (Pax5) isoform, Pax5a.” J Pharmacol Exp Ther 326(2): 463–474. [DOI] [PMC free article] [PubMed] [Google Scholar]
- Schneider D, Manzan MA, Yoo BS, Crawford RB and Kaminski N (2009). “Involvement of Blimp-1 and AP-1 dysregulation in the 2,3,7,8-Tetrachlorodibenzo-p-dioxin-mediated suppression of the IgM response by B cells.” Toxicol Sci 108(2): 377–388. [DOI] [PMC free article] [PubMed] [Google Scholar]
- Sepulveda MA, Garrett FE, Price-Whelan A and Birshtein BK (2005). “Comparative analysis of human and mouse 3′ Igh regulatory regions identifies distinctive structural features.” Mol Immunol 42(5): 605–615. [DOI] [PubMed] [Google Scholar]
- Sharma M, Salisbury RL, Maurer EI, Hussain SM and Sulentic CE (2013). “Gold nanoparticles induce transcriptional activity of NF-kappaB in a B-lymphocyte cell line.” Nanoscale 5(9): 3747–3756. [DOI] [PMC free article] [PubMed] [Google Scholar]
- Singh M and Birshtein BK (1996). “Concerted repression of an immunoglobulin heavy-chain enhancer, 3′ alpha E(hs1,2).” Proc Natl Acad Sci U S A 93(9): 4392–4397. [DOI] [PMC free article] [PubMed] [Google Scholar]
- Strober W, Harriman GR and Kunimoto DR (1991). “Early steps of IgA B cell differentiation.” Immunol Res 10(3–4): 386–388. [DOI] [PubMed] [Google Scholar]
- Suh J, Jeon YJ, Kim HM, Kang JS, Kaminski NE and Yang KH (2002). “Aryl hydrocarbon receptor-dependent inhibition of AP-1 activity by 2,3,7,8-tetrachlorodibenzo-p-dioxin in activated B cells.” Toxicol Appl Pharmacol 181(2): 116–123. [DOI] [PubMed] [Google Scholar]
- Sulentic CEW, Holsapple MP and Kaminski NE (1998). “Aryl hydrocarbon receptor-dependent suppression by 2,3,7, 8-tetrachlorodibenzo-p-dioxin of IgM secretion in activated B cells.” Mol Pharmacol 53(4): 623–629. [PubMed] [Google Scholar]
- Sulentic CEW, Holsapple MP and Kaminski NE (2000). “Putative link between transcriptional regulation of IgM expression by 2,3,7,8-tetrachlorodibenzo-p-dioxin and the aryl hydrocarbon receptor/dioxin-responsive enhancer signaling pathway.” J Pharmacol Exp Ther 295(2): 705–716. [PubMed] [Google Scholar]
- Sulentic CEW, Kang JS, Na YJ and Kaminski NE (2004). “Interactions at a dioxin responsive element (DRE) and an overlapping kappaB site within the hs4 domain of the 3′alpha immunoglobulin heavy chain enhancer.” Toxicology 200(2–3): 235–246. [DOI] [PubMed] [Google Scholar]
- Sulentic CEW, Zhang W, Na YJ and Kaminski NE (2004). “2,3,7,8-tetrachlorodibenzo-p-dioxin, an exogenous modulator of the 3′alpha immunoglobulin heavy chain enhancer in the CH12.LX mouse cell line.” J Pharmacol Exp Ther 309(1): 71–78. [DOI] [PubMed] [Google Scholar]
- Sundqvist A, Zieba A, Vasilaki E, Herrera Hidalgo C, Soderberg O, Koinuma D, Miyazono K, Heldin CH, Landegren U, Ten Dijke P and van Dam H (2013). “Specific interactions between Smad proteins and AP-1 components determine TGFbeta-induced breast cancer cell invasion.” Oncogene 32(31): 3606–3615. [DOI] [PubMed] [Google Scholar]
- Tapias A, Ciudad CJ and Noe V (2008). “Transcriptional regulation of the 5′-flanking region of the human transcription factor Sp3 gene by NF-1, c-Myb, B-Myb, AP-1 and E2F.” Biochim Biophys Acta 1779(5): 318–329. [DOI] [PubMed] [Google Scholar]
- Tian Y (2009). “Ah receptor and NF-kappaB interplay on the stage of epigenome.” Biochem Pharmacol 77(4): 670–680. [DOI] [PubMed] [Google Scholar]
- Tolusso B, Frezza D, Mattioli C, Fedele AL, Bosello S, Faustini F, Peluso G, Giambra V, Pietrapertosa D, Morelli A, Gremese E, De Santis M and Ferraccioli GF (2009). “Allele *2 of the HS1,2A enhancer of the Ig regulatory region associates with rheumatoid arthritis.” Ann Rheum Dis 68(3): 416–419. [DOI] [PMC free article] [PubMed] [Google Scholar]
- Tzeng J, Byun J, Park JY, Yamamoto T, Schesing K, Tian B, Sadoshima J and Oka S (2015). “An Ideal PPAR Response Element Bound to and Activated by PPARalpha.” PLoS One 10(8): e0134996. [DOI] [PMC free article] [PubMed] [Google Scholar]
- Usui T, Wakatsuki Y, Matsunaga Y, Kaneko S, Koseki H and Kita T (1997). “Overexpression of B cell-specific activator protein (BSAP/Pax-5) in a late B cell is sufficient to suppress differentiation to an Ig high producer cell with plasma cell phenotype.” J Immunol 158(7): 3197–3204. [PubMed] [Google Scholar]
- Verrecchia F, Vindevoghel L, Lechleider RJ, Uitto J, Roberts AB and Mauviel A (2001). “Smad3/AP-1 interactions control transcriptional responses to TGF-beta in a promoter-specific manner.” Oncogene 20(26): 3332–3340. [DOI] [PubMed] [Google Scholar]
- Vincent-Fabert C, Fiancette R, Cogne M, Pinaud E and Denizot Y (2010). “The IgH 3′ regulatory region and its implication in lymphomagenesis.” Eur J Immunol 40(12): 3306–3311. [DOI] [PubMed] [Google Scholar]
- Vincent-Fabert C, Fiancette R, Pinaud E, Truffinet V, Cogne N, Cogne M and Denizot Y (2010). “Genomic deletion of the whole IgH 3′ regulatory region (hs3a, hs1,2, hs3b, and hs4) dramatically affects class switch recombination and Ig secretion to all isotypes.” Blood 116(11): 1895–1898. [DOI] [PubMed] [Google Scholar]
- Vogel CF, Khan EM, Leung PS, Gershwin ME, Chang WL, Wu D, Haarmann-Stemmann T, Hoffmann A and Denison MS (2013). “Cross-talk between aryl hydrocarbon receptor and the inflammatory response: a role for nuclear factor-kappaB.” J Biol Chem 289(3): 1866–1875. [DOI] [PMC free article] [PubMed] [Google Scholar]
- Vogel CF and Matsumura F (2009). “A new cross-talk between the aryl hydrocarbon receptor and RelB, a member of the NF-kappaB family.” Biochem Pharmacol 77(4): 734–745. [DOI] [PMC free article] [PubMed] [Google Scholar]
- Wakatsuki Y, Neurath MF, Max EE and Strober W (1994). “The B cell-specific transcription factor BSAP regulates B cell proliferation.” J Exp Med 179(4): 1099–1108. [DOI] [PMC free article] [PubMed] [Google Scholar]
- Wakatsuki Y and Strober W (1993). “Effect of downregulation of germline transcripts on immunoglobulin A isotype differentiation.” J Exp Med 178(1): 129–138. [DOI] [PMC free article] [PubMed] [Google Scholar]
- Wang F, Wang W and Safe S (1999). “Regulation of constitutive gene expression through interactions of Sp1 protein with the nuclear aryl hydrocarbon receptor complex.” Biochemistry 38(35): 11490–11500. [DOI] [PubMed] [Google Scholar]
- Whitmore AC, Prowse DM, Arnold LW and Haughton G (1989). “Ig isotype switching in B lymphocytes. A method for estimating isotype switch frequency in cloned B cell lymphomas.” Int Immunol 1(5): 532–539. [DOI] [PubMed] [Google Scholar]
- Whitmore AC, Prowse DM, Haughton G and Arnold LW (1991). “Ig isotype switching in B lymphocytes. The effect of T cell-derived interleukins, cytokines, cholera toxin, and antigen on isotype switch frequency of a cloned B cell lymphoma.” Int Immunol 3(1): 95–103. [DOI] [PubMed] [Google Scholar]
- Willis SN, Tellier J, Liao Y, Trezise S, Light A, O’Donnell K, Garrett-Sinha LA, Shi W, Tarlinton DM and Nutt SL (2017). “Environmental sensing by mature B cells is controlled by the transcription factors PU.1 and SpiB.” Nat Commun 8(1): 1426. [DOI] [PMC free article] [PubMed] [Google Scholar]
- Wood SC, Jeong HG, Morris DL, Holsapple MP (1993). “Direct effects of 2,3,7,8-tetrachlorodibenzo-p-dioxin (TCDD) on human tonsillar lymphocytes.” Toxicology 81(2): 131–43. [DOI] [PubMed] [Google Scholar]
- Wourms MJ and Sulentic CE (2015). “The aryl hydrocarbon receptor regulates an essential transcriptional element in the immunoglobulin heavy chain gene.” Cell Immunol 295(1): 60–66. [DOI] [PMC free article] [PubMed] [Google Scholar]
- Xiang H, Noonan EJ, Wang J, Duan H, Ma L, Michie S and Boxer LM (2011). “The immunoglobulin heavy chain gene 3′ enhancers induce Bcl2 deregulation and lymphomagenesis in murine B cells.” Leukemia 25(9): 1484–1493. [DOI] [PMC free article] [PubMed] [Google Scholar]
- Yao EF and Denison MS (1992). “DNA sequence determinants for binding of transformed Ah receptor to a dioxin-responsive enhancer.” Biochemistry 31(21): 5060–5067. [DOI] [PubMed] [Google Scholar]
- Yasmeen R, Meyers JM, Alvarez CE, Thomas JL, Bonnegarde-Bernard A, Alder H, Papenfuss TL, Benson DM Jr., Boyaka PN and Ziouzenkova O (2013). “Aldehyde dehydrogenase-1a1 induces oncogene suppressor genes in B cell populations.” Biochim Biophys Acta 1833(12): 3218–3227. [DOI] [PMC free article] [PubMed] [Google Scholar]
- Yoo BS, Boverhof DR, Shnaider D, Crawford RB, Zacharewski TR and Kaminski NE (2004). “2,3,7,8-Tetrachlorodibenzo-p-dioxin (TCDD) alters the regulation of Pax5 in lipopolysaccharide-activated B cells.” Toxicol Sci 77(2): 272–279. [DOI] [PubMed] [Google Scholar]
- Zeng S, Yang Y, Cheng X, Zhou B, Li P, Zhao Y, Kong X and Xu Y (2016). “HIC1 epigenetically represses CIITA transcription in B lymphocytes.” Biochim Biophys Acta 1859(12): 1481–1489. [DOI] [PubMed] [Google Scholar]
- Zhou J, Henriques J, Crawford R, Kaminski N (2018). “Suppression of the IgM Response by Aryl Hydrocarbon Receptor Activation in Human Primary B Cells Involves Impairment of Immunoglobulin Secretory Processes.” Toxicol Sci. 163(1): 319–329. [DOI] [PMC free article] [PubMed] [Google Scholar]
Associated Data
This section collects any data citations, data availability statements, or supplementary materials included in this article.