Abstract
A colorimetric platform for influenza A virus detection was developed by using the high efficiency of enzymatic catalysis and the reduction of gold ions with hydrogen peroxide. Aptamer-functionalized magnetic microparticles were synthesized to capture the influenza A virus. This was followed by the binding of ConA-GOx-AuNPs to the H3N2 virus through the ConA-glycan interaction. The sandwich complex was subsequently dispersed in glucose solution to trigger an enzymatic reaction to produce hydrogen peroxide, which controlled the growth of gold nanoparticles and produced colored solutions. The determination of H3N2 concentration was realized by comparing the two differently colored gold nanoparticles. This method could detect the target virus as low as 11.16 μg ml−1. Furthermore, it opens new opportunities for sensitive and colorimetric detection of viruses and proteins.
Keywords: influenza A virus, detection, colorimetric, magnetic microparticles
1. Introduction
Influenza A viruses are zoonotic pathogens, which have been rampant periodically for centuries throughout the world. Every year, respiratory diseases caused by influenza A viruses have resulted in about 500 million human infections and 0.25–0.5 million victims worldwide [1, 2]. The H3N2 virus is the primary cause of human influenza morbidity and mortality in the world [3]. Therefore, early and sensitive detection of the influenza A virus is important to control the outbreaks. To date, different methods have been developed for detecting influenza A viruses such as virus culture [4–6], loop-mediated isothermal amplification (LAMP) [7–9], polymerase chain reaction (PCR) methods [10–12], enzyme linked immunosorbent assay (ELISA) [13–15] and microarray technology [16–18]. However, they are labor intensive, have complex sample pretreatment, low sensitivity, high cost and require appropriate laboratory facilities and well-trained technicians. To improve the sensitivity, some researchers have developed electrochemical biosensors for the detection of the influenza virus [19, 20]. Although the strategies of electrode immobilization are well developed, some drawbacks still exist such as the complicated, tedious and time-consuming immobilization procedures, and low reproducibility and regeneration ability [21–23]. Therefore, a simple, rapid and reliable method is urgently needed.
Colorimetric assays have attracted much attention due to the simplicity, practicality, and visibility of the target, without the utilization of expensive and sophisticated instruments [24–27]. Researchers have developed various methods and strategies for colorimetric assays. Recently, enzyme [28] and enzyme-functionalized nanostructure-based colorimetric biosensors [29–31] have shown great application value in the colorimetric assays. These methods exhibited high catalytic activity and high specificity. However, since the signals of the colorimetric biosensors are based on the distinction between non-colored and colored solution, and this can only be realized with confidence when the concentrations of the target are high, making ultrasensitive detection with the naked eye unsuitable. For example, Gao et al [31] designed a magnetic bead (MB)-based assay for the analysis of biomolecules. The MBs were employed as peroxidase mimics and used to catalyze the 3,3′,5,5′-tetramethylbenzidine (non-colored solution) to produce a colored solution. It is hard to distinguish between two similar-looking lightly colored solutions. To solve this problem, Rica and Stevens [32] had exploited a new method based on the reduction of gold ions by hydrogen peroxide, which generates blue- or red-colored solutions in the absence or presence of the target, respectively. In detail, gold nanoparticles (AuNPs) are grown as nonaggregated red colloidal suspensions, when the concentration of hydrogen peroxide is high. Whereas, blue-colored NP solutions of aggregated AuNPs are acquired when the concentration of hydrogen peroxide is low. The generation of two differently colored AuNP solutions has advantages over traditional colorimetric assays due to the distinction of two differently colored solutions being easier than the differentiation of two similar-looking lightly colored solutions.
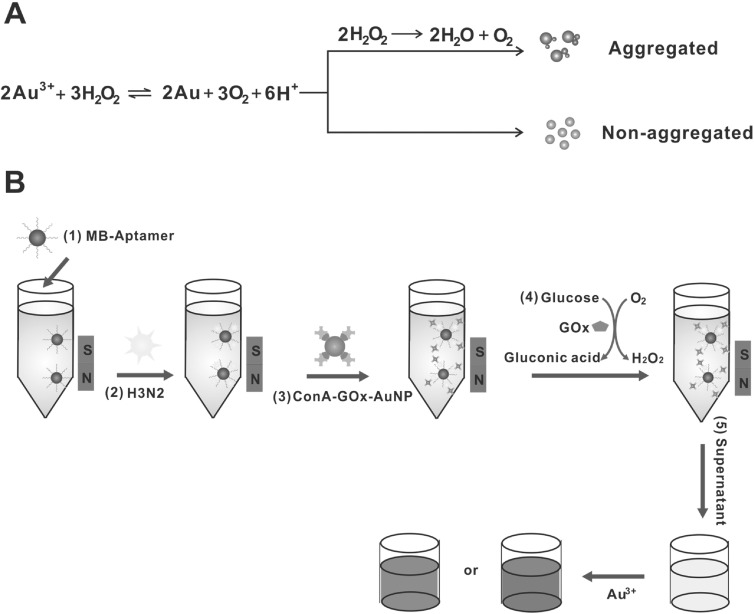
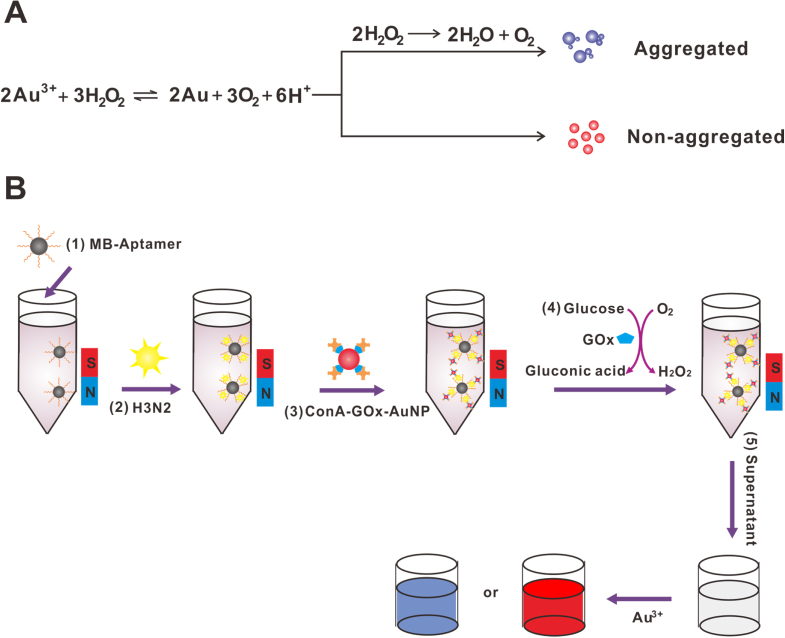
With this idea in mind, a colorimetric platform for influenza A virus detection via functionalized magnetic microparticles has been designed and developed (figure 1). H3N2 viruses were captured by MBs, which were modified with H3N2-specific aptamer. This was followed by the addition of ConA-GOx-AuNPs, which were formed by the modification of glucose oxidase (GOx) and concanavalin A (ConA) onto AuNPs. The ConA-GOx-AuNPs were conjugated to the H3N2 virus through the ConA-glycan interaction. The sandwich complex was incubated with glucose solution to trigger an enzymatic reaction to produce hydrogen peroxide. The determination of H3N2 concentration was realized by comparing the two differently colored AuNPs. This new method combined the inherent advantages of the high efficiency of enzymatic catalysis with the high sensitivity of the distinction of two differently colored solutions.
Figure 1.

(A) The signal generation mechanism for detection with the naked eye. (B) The detection strategy of this colorimetric method for influenza A virus analysis.
2. Materials and methods
2.1. Chemicals and reagents
The carboxylated matrix metalloproteinases (MMPs) (1.02 μm, 10 mg ml−1) were obtained from Invitrogen (USA). Sodium phosphate monobasic dihydrate (NaH2PO4·2H2O), sodium phosphate dibasic dodecahydrate (Na2HPO4·12H2O), sodium chloride (NaCl), concanavalin A (ConA) ((type VI, from Canavalia ensiformis (Jack bean)), hydrogen tetrachloroaurate (III) trihydrate (HAuCl4·3H2O), N-hydroxysuccinimide (NHS) and 2-(N-morpholino)ethanesulphonic acid (MES), 1-ethyl-3-(3-dimethylaminopropyl)carbodiimide (EDC) were purchased from Sigma (St Louis, MO, USA). Glucose oxidase was obtained from Amresco (USA). Influenza virus (H3N2) was supplied by Huazhong Agricultural University. The selected aptamer with high affinity and specificity to the H3N2 surface protein was developed by Jeon [33], and DNA oligonucleotides were synthesized and purified by Sangon.
The aptamer A22: 5′-NH2-AATTAACCCTCACTAAAGGGCTGAGTCTCAAAACCGCAATAACTGGTTGTATGGTCGAATAAGTTAA-3′
The aptamers were prepared in 10 mM Tris-HCl buffer (1 mM EDTA, pH = 8.0).
2.2. Instrumentation
Ultrapure water was produced by a Millipore-Q Academic Water Purification System (USA). UV-vis measurements were recorded by a UV-2250 spectrophotometer (Shimadzu, Tokyo, Japan) and the colorimetric photos were taken by a digital camera. The pH of the solutions was measured by a pB-10 potentiometer (Sartorius). Transmission electron microscopy (TEM) was conducted on a JEM 2100 transmission electron microscope (Japan).
2.3. Modification of MMPs
The conjugation of MMPs and the aptamer A22 was prepared according to a modified protocol according to the manufacturer (Invitrogen). In brief, the carboxyl-modified MMPs (0.5 ml, 10 mg ml−1) were washed three times with 500 μl of the binding buffer (10 mM PB, 15 mM NaCl, pH 7.4) and then redispersed in 260 μl of the binding buffer. The aptamer A22 (9 nM) in 90 μl binding buffer was added into the MMP suspension. The above suspension was mixed with EDC (50 μl, 0.1 M), NHS (100 μl, 0.05 M) and incubated at room temperature with gentle shaking overnight. After washing three times with 0.25 mM Tris-HCl buffer (0.01% Tween-20, pH = 8.0) for 30 min, the modified MMPs were dispersed in 1 ml 10 mM Tris-HCl (1 mM EDTA and 0.5% BSA, pH = 8.0) buffer and stored at 4 °C for further use.
2.4. Preparation of ConA-GOx-AuNPs
AuNPs were synthesized according to the previous method [34]. 5 mg of GOx was added into 1 ml solution of AuNPs, and then the mixture was incubated for 1 h with gentle shaking and then incubated overnight at 4 °C. At the same time, 2 mg ml−1 of conA solution mixed with 1 mM Mn2+ and Ca2+ was incubated overnight at 4 °C. After centrifugation and washing with phosphate-buffered saline with Tween-20 (PBST) three times, the GOx-AuNPs were suspended in the above ConA solution to form the ConA-GOx-AuNPs through the interaction between glycan of GOx and ConA [35]. Then, the mixture was incubated for 30 min with gentle shaking. Finally, the ConA-GOx-AuNP suspension was centrifuged at 6000 r min−1. After washing with PBST twice, the ConA-GOx-AuNPs were dispersed in PBS and stored at 4 °C.
2.5. Procedure for H3N2 detection
The aptamer-modified MMPs were washed three times with 10 mM PBS buffer (0.1% Tween-20, pH = 7.40) and magnetically separated for 3 min. Then, the modified MMPs were mixed with different concentrations of the influenza A virus (H3N2) to a final volume of 400 μl in the PBS buffer and rotated at 5000 r min−1 for 30 min. The MMPs were washed three times and then redispersed in 200 μl PBS containing 20 μl of ConA-GOx-AuNPs, which could bind to the H3N2 through the ConA-glycan interaction. After incubation for 30 min with gentle shaking, the MMPs were washed three times with wash buffer and once with deionized water, followed by the addition of 2 mM (100 μl) glucose solution. An hour later, the suspension was magnetically separated and transferred to the 96-well plate. HAuCl4 (100 μl, 0.2 mM) in MES buffer was added to the well and the absorbance was collected using UV-vis spectroscopy after 20 min.
2.6. Gel electrophoresis
10 μl of AuNPs, GOx-AuNPs and ConA-GOx-AuNPs were loaded onto a 3% agarose gel and electrophoresed in 1× Tris-acetate-EDTA (TAE) buffer (40 mM TrisAcOH, 2.0 mM Na2EDTA, pH = 8.50) at 120 V for 40 min. The photo was taken by a digital camera.
2.7. Transmission electron microscopy
For TEM examination, a 10 μl sample was loaded onto a carbon-coated copper grid and dried on filter paper after 2 min. Then, the sample was negatively stained. After that, the samples were observed with a Hitachi H7000 electron microscope at 200 kV.
3. Results and discussions
3.1. The principle of colorimetric sensor for influenza A virus analysis
The signal generation mechanism was based on the reduction of gold ions with hydrogen peroxide. As illustrated in figure 1(A), when the concentration of hydrogen peroxide was high, nonaggregated and spherical NPs were formed and this turned the solution red. When the concentration of hydrogen peroxide was low, aggregates of NPs were generated and a blue-colored solution was acquired due to the biocatalytic action of the enzyme catalase. The detection strategy of the colorimetric sensor for influenza A virus analysis was shown in figure 1(B), the aptamer-modified MBs were used to capture the H3N2 virus. After the AuNPs were modified with GOx and ConA, the ConA-GOx-AuNP complexes were then conjugated to the H3N2 virus through the glycan-ConA interaction. A glucose aqueous solution was added to the final complex and incubated for 90 min to produce hydrogen peroxide. Finally, the absorbance was collected.
3.2. Verification of products
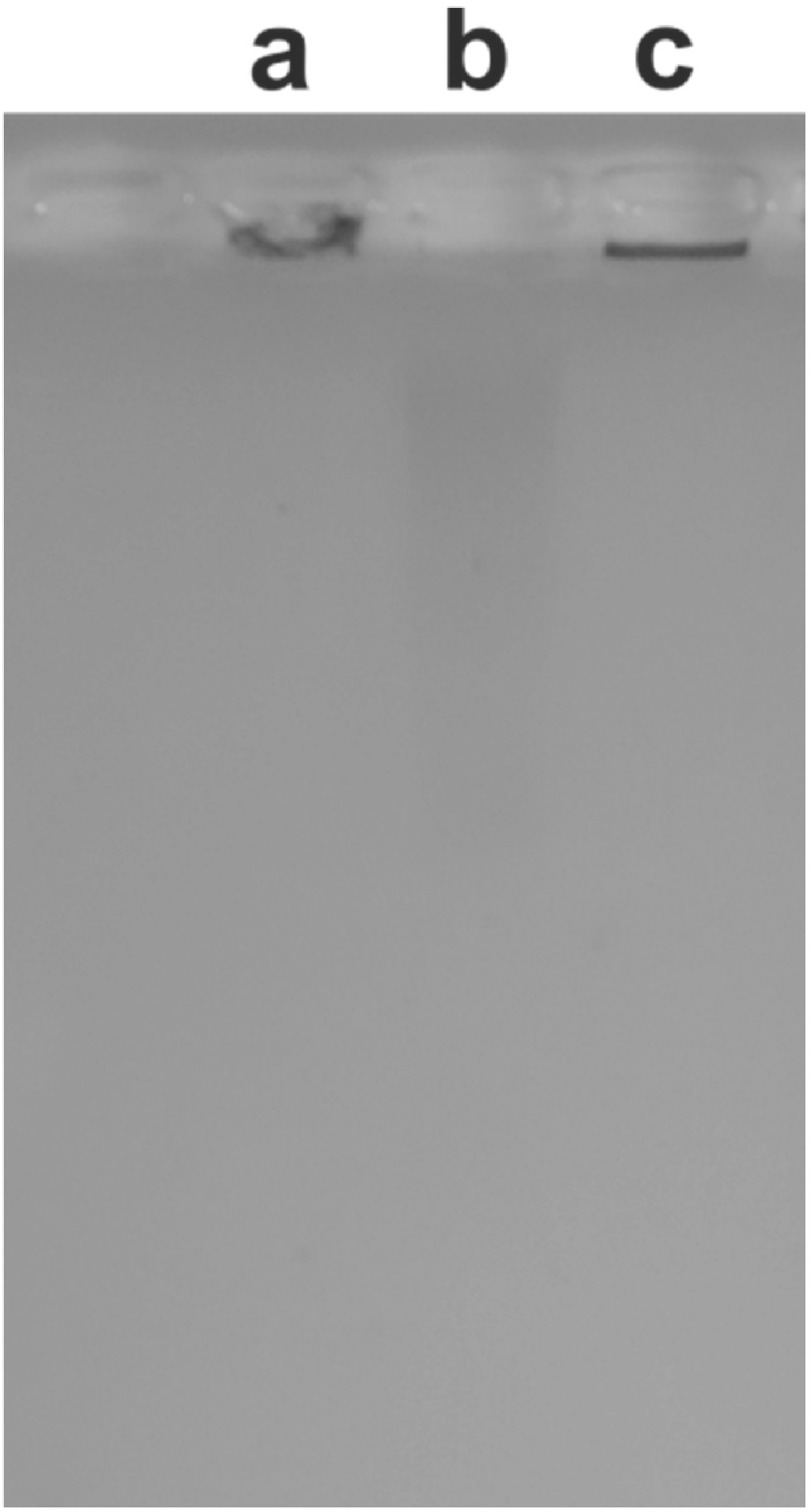
First, it was essential to confirm the formation of modified products. As shown in figure 2, in the presence of unmodified AuNPs (lane a), no band was exhibited and the AuNPs were aggregated at the well. When the AuNPs were modified with GOx (lane b), a red band was observed. The reason was that the AuNPs could be protected from aggregating by the GOx, and the negatively charged GOx-AuNPs verified that the modification was successful. Furthermore, when the GOx-AuNPs were further modified with ConA, the red ConA-GOx-AuNP complexes exhibited no migration as a result of the neutral ConA-GOx-AuNPs.
Figure 2.
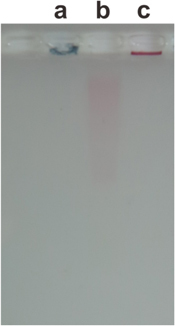

The agarose gel analysis for the modified products of AuNPs. From left to right, lanes: (a) AuNPs; (b) GOx-AuNPs; (c) ConA-GOx-AuNPs.
The TEM results (figure 3) were consistent with the results of agarose gel analysis. For AuNPs without proteins (figure 3(A)), no corona coating was observed. For GOx-AuNPs (figure 3(B)) and ConA-GOx-AuNPs (figure 3(C)), protein corona could be observed by TEM image.
Figure 3.

TEM images of AuNPs, GOx-AuNPs, ConA-GOx-AuNPs.
3.3. Optimization of the variables
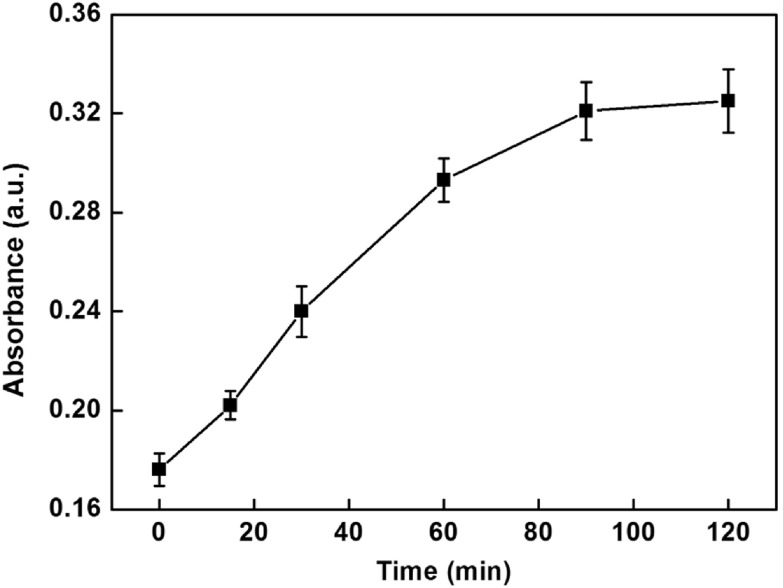
In order to obtain obvious color changes and UV-vis signal, some of the parameters were investigated. Figure 4 depicts the influence of the number of functionalized MMPs used in assay on the UV-vis signal. The UV-vis absorption intensities increased with increasing the number of functionalized MMPs in the range 10–50 μg and then reached a plateau in the range from 40–50 μg. Hence, 40 μg of functionalized MMPs were chosen in this assay. Since the amount of glucose might have an influence on the enzymatic catalysis reaction, excessive glucose was used to ensure the completion of the reaction. In addition, the incubation time that influenced the enzymatic catalysis reaction was explored and the results are shown in figure 5. The UV-vis absorption intensities increased progressively in 1.5 h and then leveled off in the range from 1.5–2 h, which indicated the completion of the reaction. Therefore, 1.5 h was chosen for this study.
Figure 4.
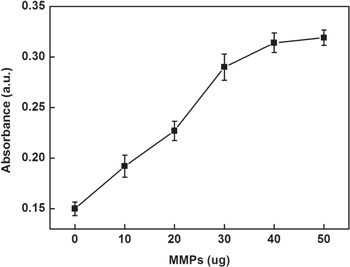

Effect of the number of functionalized MMPs on the UV-vis absorption intensity of this sensing system.
Figure 5.
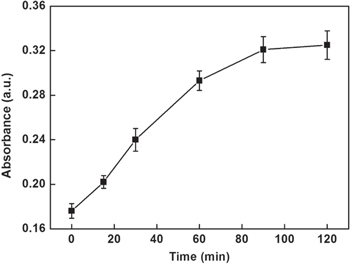
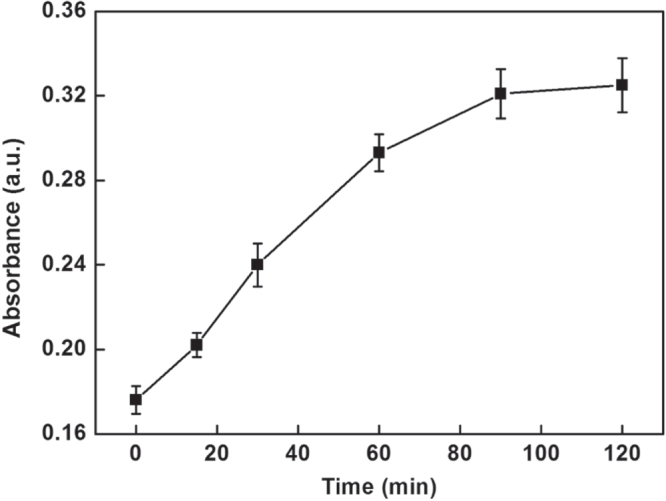
Effect of the incubation time of enzymatic catalysis on the UV-vis absorption intensity of this sensing system.
3.4. Colorimetric detection of H3N2
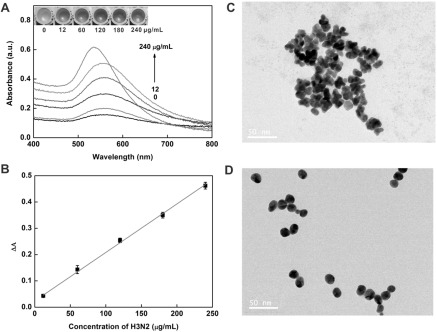
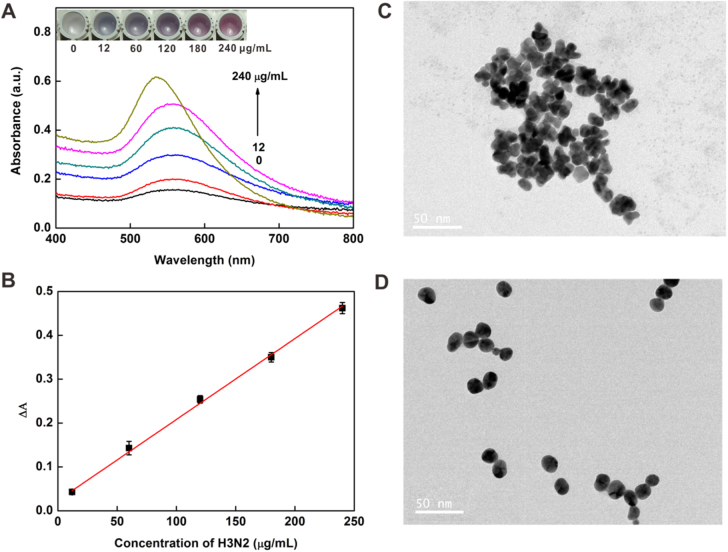
Under the optimized conditions, the virus assay was performed with different concentrations of target H3N2. As shown in figure 6(A) inset, with the increase in the concentration of H3N2, the tonality of the solution changed from blue to red between 12 and 240 μg ml−1 and the UV-vis absorbance intensity increased gradually, which was consistent with the color change. In addition, TEM images (figures 6(C) and (D)) showed that AuNPs aggregated at low concentration of target and dispersed well at higher concentration of target. The plot of the UV-vis intensities versus the concentrations of the virus is presented in figure 6(B). It exhibited a good linear relationship with the linear equation y = 0.0237 + 0.0018 ×(R2 = 0.9942). The limit of detection (LOD) was calculated to be 11.16 μg ml−1 (3σ/slope, whereas σ is the relative standard deviation of a blank solution, n = 11). Seven parallel measurements of 200 μg ml−1 target H3N2 were used for estimating the precision, and the relative standard deviation (RSD) was 1.17%, and the blank standard deviation was 0.670%. Furthermore, the introduction of magnetic separation made it easier to detect complex samples than with other methods [36–38] and this colorimetric assay would be possible for sensing low concentrations of target in a real sample [39] owing to the separation and enrichment functions of the MBs.
Figure 6.
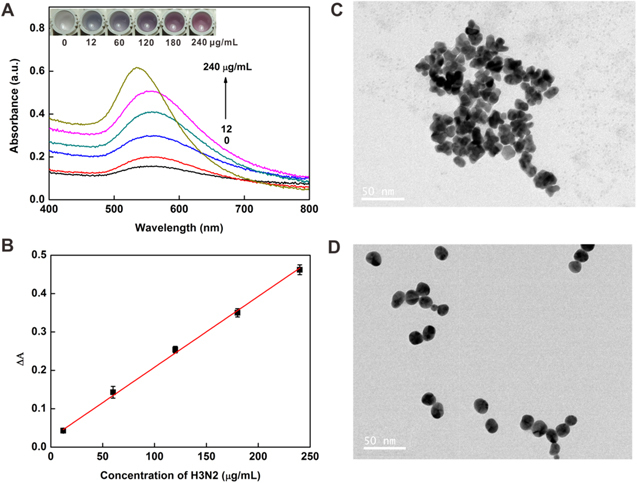
(A) Changes in the UV-vis absorbance with increasing concentrations of H3N2: 0, 12, 60, 120, 180 and 240 μg ml−1. Inset: colorimetric responses of the sensing system in the presence of different concentrations of H3N2. (B) The linear relationship between the UV-vis absorption intensities and the target H3N2 concentration. TEM images of NPs grown with the H3N2 at concentrations of 12 μg ml−1 (C) and 240 μg ml−1 (D). Scale bars = 50 nm.
3.5. The specificity of H3N2 sensing
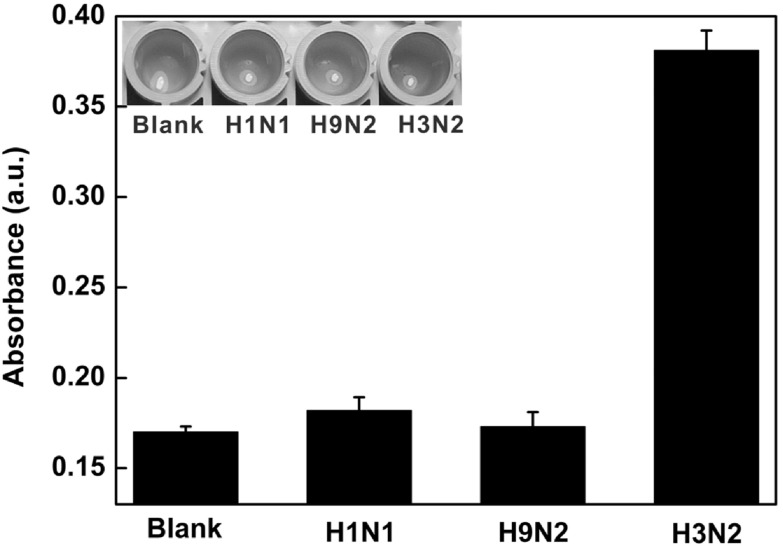
To assess the selectivity of this colorimetric sensor, the control experiments were carried out in the presence of purified H1N1, H9N2 and target virus. As shown in figure 7, there was no obvious signal change in the presence of H1N1 and H9N2, which indicated the specificity of this proposed method.
Figure 7.
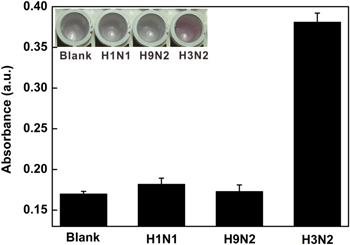
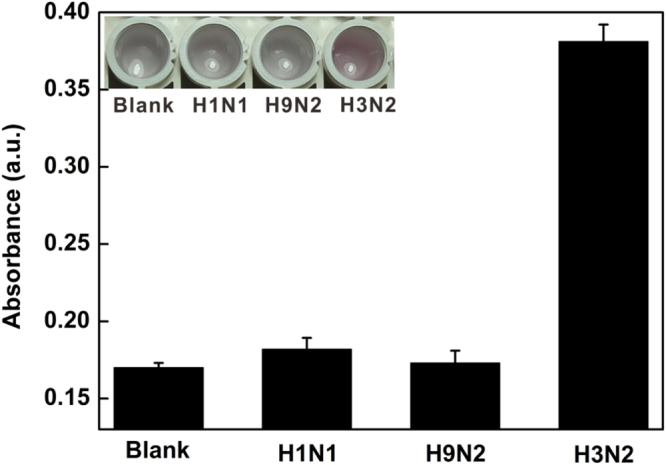
Histogram for the specificity of this colorimetric platform for H3N2 detection. The concentration of H1N1, H9N2 and H3N2 was 120 μg ml−1. The inset shows the corresponding color changes.
4. Conclusions
In conclusion, a simple magnetic microparticle-based colorimetric method for influenza virus (H3N2) detection was developed by coupling the high efficiency of enzymatic catalysis with the colored AuNPs. The sensitivity of this assay was calculated to be 11.16 μg ml−1 by the UV-vis instrument. In addition, this method could not only determine the target virus by UV-vis absorbance, but achieve semiquantitative determination by visual detection. Moreover, the present sensory system could be exploited for other virus detection.
Supplementary Material
Acknowledgments
This work was financially supported by the National Key Scientific Program-Nanoscience and Nanotechnology (2011CB933600), the National Science Foundation of China (21475101, 21675119, 21205089 and 21305049) and Suzhou Nanotechnology Special Project (ZXG2013028).
References
- 1.Arias C F, Escalera-Zamudio M, Río M, Cobián-Güemes A G, Isa P, López S. Arch. Med. Res. 2009;40:643–54. doi: 10.1016/j.arcmed.2009.10.007. [DOI] [PubMed] [Google Scholar]
- 2.Medina R A, García-Sastre A. Nat. Rev. Microbiol. 2011;9:590–603. doi: 10.1038/nrmicro2613. [DOI] [PMC free article] [PubMed] [Google Scholar]
- 3.Russell C A, et al. Science. 2008;320:340–6. doi: 10.1126/science.1154137. [DOI] [PubMed] [Google Scholar]
- 4.Daisy J A, Lief F S, Friedman H M. J. Clin. Microbiol. 1979;9:688–92. doi: 10.1128/jcm.9.6.688-692.1979. [DOI] [PMC free article] [PubMed] [Google Scholar]
- 5.Stamboulian D, Bonvehí P E, Nacinovich F M, Rüttimann R W. Vaccine. 1999;17:53–6. doi: 10.1016/S0264-410X(99)00106-1. [DOI] [PubMed] [Google Scholar]
- 6.Stamboulian D, Bonvehí P E, Nacinovich F M, Cox N. Infect. Dis. Clin. North Am. 2000;14:141–66. doi: 10.1016/S0891-5520(05)70222-1. [DOI] [PubMed] [Google Scholar]
- 7.Imai M, Ninomiya A, Minekawa H, Notomi T, Ishizaki T, Tashiro M, Odagiri T. Vaccine. 2006;24:6679–82. doi: 10.1016/j.vaccine.2006.05.046. [DOI] [PubMed] [Google Scholar]
- 8.Goto M, Honda E, Ogura A, Nomoto A, Hanaki K. Biotechniques. 2009;46:167–72. doi: 10.2144/000113072. [DOI] [PubMed] [Google Scholar]
- 9.Nie K, et al. Clin. Microbiol. Infect. 2013;19:372–5. doi: 10.1111/1469-0691.12263. [DOI] [Google Scholar]
- 10.Lee M S, Chang P C, Shien J H, Cheng M C, Shieh H K. J. Virol. Methods. 2001;97:13–22. doi: 10.1016/S0166-0934(01)00301-9. [DOI] [PubMed] [Google Scholar]
- 11.Spackman E, Senne D A, Myers T J, Bulaga L L, Garber L P, Perdue M L, Lohman K, Daum L T, Suarez D L. J. Clin. Microbiol. 2002;40:3256–60. doi: 10.1128/JCM.40.9.3256-3260.2002. [DOI] [PMC free article] [PubMed] [Google Scholar]
- 12.Chen Y, Liu T C, Cai L J, Du H Y, Li M. J. Clin. Lab. Anal. 2013;6:450–60. doi: 10.1002/jcla.21627. [DOI] [PMC free article] [PubMed] [Google Scholar]
- 13.He Q G, Velumani S, Du Q Y, Lim C W, Ng F K, Donis R, Kwang J. Clin. Vaccine Immunol. 2007;14:617–23. doi: 10.1128/CVI.00444-06. [DOI] [PMC free article] [PubMed] [Google Scholar]
- 14.Li Y X, Hong M, Qiu B, Lin Z Y, Chen Y T, Cai Z W, Chen G N. Biosens. Bioelectron. 2014;54:358–64. doi: 10.1016/j.bios.2013.10.045. [DOI] [PubMed] [Google Scholar]
- 15.Wu M, Zhang Z L, Chen G, Wen C Y, Wu L L, Hu J, Xiong C C, Chen J J, Pang D W. Small. 2015;11:5280–8. doi: 10.1002/smll.201403746. [DOI] [PubMed] [Google Scholar]
- 16.Wang Z, Daum L T, Vora G J, Metzgar D, Walter E A, Canas L C, Malanoski A P, Lin B, Stenger D A. Emerg. Infect. Dis. 2006;12:638–46. doi: 10.3201/eid1204.051441. [DOI] [PMC free article] [PubMed] [Google Scholar]
- 17.Dawson E D, Moore C L, Dankbar D M, Mehlmann M, Townsend M B, Smagala J A, Smith C B, Cox N J, Kuchta R D, Rowlen K L. Anal. Chem. 2007;79:378–84. doi: 10.1021/ac061920o. [DOI] [PubMed] [Google Scholar]
- 18.Mikhailovich V, Gryadunov D, Kolchinsky A, Makarov A A, Zasedatelev A. BioEssays. 2008;30:673–82. doi: 10.1002/bies.20781. [DOI] [PubMed] [Google Scholar]
- 19.Wang R, Wang Y, Lassiter K, Li Y, Hargis B, Tung S, Berghman L, Bottje W. Talanta. 2009;79:159–64. doi: 10.1016/j.talanta.2009.03.017. [DOI] [PubMed] [Google Scholar]
- 20.Lum J, Wang R H, Lassiter K, Srinivasan B, Abi-Ghanem D, Berghman L, Hargis B, Tung S, Lu H G, Li Y B. Biosens. Bioelectron. 2012;38:67–73. doi: 10.1016/j.bios.2012.04.047. [DOI] [PubMed] [Google Scholar]
- 21.Xiao Y, Lai R Y, Plaxco K W. Nat. Protocols. 2007;2:2875–80. doi: 10.1038/nprot.2007.413. [DOI] [PubMed] [Google Scholar]
- 22.Burke A M, Gorodetsky A A. Nat. Chem. 2012;4:595–7. doi: 10.1038/nchem.1418. [DOI] [PubMed] [Google Scholar]
- 23.Cheng W, Ding L, Ding S, Yin Y, Ju H. Angew. Chem., Int. Ed. 2009;48:6465–8. doi: 10.1002/anie.200902356. [DOI] [PubMed] [Google Scholar]
- 24.Zhang J, Wang L, Pan D, Song S, Boey F Y C, Zhang H, Fan C. Small. 2008;4:1196–200. doi: 10.1002/smll.200800057. [DOI] [PubMed] [Google Scholar]
- 25.Song Y, Wei W, Qu X. Adv. Mater. 2011;23:4215–36. doi: 10.1002/adma.201101853. [DOI] [PubMed] [Google Scholar]
- 26.Deng H, Zhang X, Kumar A, Zou G, Liang X. Chem. Commun. 2013;49:51–3. doi: 10.1039/C2CC37037A. [DOI] [PubMed] [Google Scholar]
- 27.Zhou Y L, Dong H, Liu L T, Xu M T. Small. 2015;11:2144–9. doi: 10.1002/smll.201402593. [DOI] [PubMed] [Google Scholar]
- 28.Perfezou M, Turner A, Merkoci A. Chem. Soc. Rev. 2012;41:2606–22. doi: 10.1039/C1CS15134G. [DOI] [PubMed] [Google Scholar]
- 29.Lequin R. Clin. Chem. 2005;51:2415–8. doi: 10.1373/clinchem.2005.051532. [DOI] [PubMed] [Google Scholar]
- 30.Song Y J, Qu K G, Zhao C, Ren J S, Qu X G. Adv. Mater. 2010;22:2206–10. doi: 10.1002/adma.200903783. [DOI] [PubMed] [Google Scholar]
- 31.Gao Z Q, Xu M D, Hou L, Chen G N, Tang D P. Anal. Chem. 2013;85:6945–52. doi: 10.1021/ac401433p. [DOI] [PubMed] [Google Scholar]
- 32.Rica R, Stevens M M. Nat. Nanotechnol. 2012;7:821–4. doi: 10.1038/nnano.2012.186. [DOI] [PubMed] [Google Scholar]
- 33.Jeon S H, Kayhan B, Benyedidia T, Arnon R. J. Biol. Chem. 2004;279:48410–9. doi: 10.1074/jbc.M409059200. [DOI] [PubMed] [Google Scholar]
- 34.Grabar K, Freeman R, Hommer M, Natan M. Anal. Chem. 1995;67:735–43. doi: 10.1021/ac00100a008. [DOI] [Google Scholar]
- 35.Zhou L, Jiang Y, Gao J, Zhao X, Ma L, Zhou Q. Biochem. Eng. J. 2012;69:28–31. doi: 10.1016/j.bej.2012.07.025. [DOI] [Google Scholar]
- 36.Lee C W, Gaston M A, Weiss A A, Zhang P. Biosens. Bioelectron. 2013;42:236–41. doi: 10.1016/j.bios.2012.10.067. [DOI] [PMC free article] [PubMed] [Google Scholar]
- 37.Teo J W P, Chiang D, Jureen R, Lin R T P. Diagn. Micr. Infec. Dis. 2015;85:261–2. doi: 10.1016/j.diagmicrobio.2015.07.018. [DOI] [PubMed] [Google Scholar]
- 38.Ahmed S R, Kim J, Suzuki T, Lee J, Park E Y. Biosens. Bioelectron. 2016;85:503–8. doi: 10.1016/j.bios.2016.05.050. [DOI] [PubMed] [Google Scholar]
- 39.Ranzoni A, Sabatte G, IJzendoorn L, Prins M W J. ACS Nano. 2012;6:3134–41. doi: 10.1021/nn204913f. [DOI] [PubMed] [Google Scholar]
Associated Data
This section collects any data citations, data availability statements, or supplementary materials included in this article.


