

Abstract
Introduction
Although new influenza virus (IAn/H1N1) infections are mild and indistinguishable from any other seasonal influenza virus infections, there are few data on comparisons of the clinical features of infection with (IAn/H1N1) and with other respiratory viruses. The incidence, clinical aspects and temporal distribution of those respiratory viruses circulating during flu pandemic period were studied.
Methods
Respiratory samples from patients with acute influenza-like symptoms were collected from May 2009 to December 2009. Respiratory viruses were detected by conventional culture methods and genome amplification techniques.
Results
Although IAn/H1N1 was the virus most frequently detected, several other respiratory viruses co-circulated with IAn/H1N1 during the pandemic period, especially rhinovirus. The similarity between clinical signs included in the clinical case definition for influenza and those caused by other respiratory viruses, particularly rhinovirus, suggest that a high percentage of viral infections were clinically diagnosed as case of influenza.
Conclusions
Our study offers useful information to face future pandemics caused by influenza virus, indicating that differential diagnoses are required in order to not overestimate the importance of the pandemic.
Keywords: New influenza virus, IAn/H1N1, Flu pandemic, Respiratory viruses, Misdiagnosis
Abstract
Introducción
Aunque los síntomas clínicos causados por el virus de la gripe nueva (IAn/H1N1) son leves e indistinguibles de los causados por los virus de la gripe estacionales, existen pocos datos que comparen las características clínicas de la infección por IAn/H1N1 con las de otros virus respiratorios. Por ello, se estudiaron la incidencia, los aspectos clínicos y la distribución temporal de los virus respiratorios circulantes durante el período de la pandemia gripal.
Métodos
Se recogieron muestras respiratorias de pacientes con síntomas de gripe desde mayo de 2009 a diciembre de 2009. Diferentes virus respiratorios fueron detectados mediante métodos convencionales de cultivo y técnicas de amplificación genómica.
Resultados
Aunque el virus detectado con mayor frecuencia fue el IAn/H1N1, otros virus respiratorios co-circularon durante la pandemia gripal, especialmente rinovirus. La similitud entre los síntomas clínicos incluidos en la definición de caso clínico para la gripe nueva y los causados por otros virus respiratorios sugiere que fueron declarados clínicamente como casos de gripe nueva un alto porcentaje de infecciones causadas por otros virus respiratorios, especialmente rinovirus.
Conclusiones
Nuestro estudio ofrece una información útil para hacer frente a futuras pandemias causadas por virus de gripe, que indica que los diagnósticos diferenciales son necesarios a fin de no sobrestimar la importancia de la pandemia.
Palabras clave: Virus de la gripe nueva, IAn/H1N1, Pandemia de gripe, Virus respiratorios, Diagnóstico erróneo
Introduction
Several sentinel surveillance networks have been established because of the concern about the possibility of a pandemic outbreak caused by a virulent new influenza virus and its implications for humans and the global economic and financial system. The Asturian Sentinel Surveillance Network (ASSN), which comprises primary care health units (PCHU) throughout the region, has been organized to detect and monitor the mergence of influenza virus outbreaks each year. This surveillance system detects the onset of influenza epidemics and identifies specific strains each season. Although the main role of ASSN, which is included in the Spanish Influenza Sentinel Surveillance System (SISSS), is the study of influenza outbreaks, such network could also be used as a virological surveillance system for other community-acquired viral infections. The importance of similar networks was shown after the emergence of the new influenza virus IAn/H1N1, which was first reported in Mexico during April 2009 and rapidly detected in many other countries. Thus, >600,000 cases and >14,000 deaths had been reported to the World Health Organization during 2009. As the pandemic progressed, it became clear that the majority of IAn/H1N1 infections are mild and indistinguishable from any other seasonal influenza virus infection.1 Nevertheless, there are few data about the comparison of the clinical features of infection with IAn/H1N1 and with other respiratory viruses.
In this study, the incidence, clinical aspects and seasonality of the new influenza virus and other respiratory virus were studied between May 2009 and December 2009 in Asturias (North of Spain).
Materials and methods
Patients and samples
From May 2009 to December 2009, 1279 respiratory samples (694 pharyngeal, 458 nasopharyngeal and 127 nasal swabs) from 1269 patients who fulfilled the clinical case definition of influenza were collected by the ASSN. Among the patients with known age, 683 were children (mean: 7.2 ± 4.2 years, range: 1 month–14 years) and 581 were adults (mean: 35.3 ± 14.9 years, range: 15–90 years).
A patient who fulfilled the clinical case definition of influenza was defined as a patient with at least one of the following general symptoms (fever, headache, malaise and myalgia), at least one of the following respiratory symptoms (cough, dyspnea and sore throat) and with absence of any other suspected diagnosis), according to SISSS.
All the samples were submitted in viruses transport medium (ViralPack, Biomedics SL, Madrid, Spain) at the Clinical Virology Laboratory.
Laboratory diagnosis
The samples were diluted in phosphate-buffered saline, vortexed and centrifuged at 6000 rpm to pellet the cells. These were stained by monoclonal antibodies against influenzaviruses A and B, RSV and parainfluenzavirus (Dako Ltd., UK).2 The supernatants were divided into two fractions. One of them was processed for conventional and rapid cultures following standard protocols.2 The other one was stored at −40 °C and used to purify viral genomes.
Genome detection
Viral genomes were purified by using an automated nucleic acid purifier Ampliprep (Roche Diagnostics, Mannheim, Germany). IAn/H1N1 and IA/H1N1 were detected by the CDC Realtime RT-PCR (rRTPCR) protocol for detection and characterization of swine influenza using the AgPath-ID one-step RT-PCR kit (Applied Biosystems-Ambion, CA) in a 7300 real-time PCR system (Applied Byosistems, CA). Furthermore, one multiplex nested RT-PCR were used to detect IA, IB, RSV A, RSV B, and rhinovirus.3, 4 Primers from IA, IB, RSV A and RSV B, as well as the amplification protocol, were obtained from Coiras et al.3 Primers from rhinovirus were obtained from Coiras et al.4 Metapneumovirus, parainfluenzavirus, and coronavirus were detected by using an “in-house” multiplex nested RT-PCR. The first round of amplification was carried out using specific outer primers (Table 1) according to the instructions provided with the Titan One Tube RT-PCR System (Roche, Germany). To increase sensitivity, a second round of amplification was carried out using specific inner primers (Table 1 ) and Taq DNA polymerase (Gibco BRL) in PCR buffer (1×) supplied by the manufacturer. The annealing temperature of both amplifications was 55 °C. The PCR products were analyzed using 2% agarose-TBE gel electrophoresis. The expected amplicon sizes analyzed using 2% agarose gel electrophoresis are described in Table 1.
Table 1.
Primers used for detection of respiratory viruses using two nested multiplex RT-PCRs.
| Virus | Step | Name | Sequence (5′-3′) | Sense | Amplicon size (pb) |
|---|---|---|---|---|---|
| IA, IB | RT-PCR A | FluAC1a | GAACTCRTCCYWWATSWCAAWGRRGARAT | + | IA: 721 IB: 991 |
| FluB1a | ACAGAGATAAAGAAGAGCGTCTACAA | + | |||
| FluABC2a | ATKGCGCWYRAYAMWCTYARRTCTTCAWAKGC | − | |||
| Nested PCR A | FluAB3a | GATCAAGTGAKMGRRAGYMGRAAYCCIGG | + | IA: 301 IB: 226 |
|
| FluAC4a | TCTTCAWATGCARSWSMAWKGCATGCCATC | − | |||
| FluB4a | CTTAATATGGAAACAGGTGTTGCCATATT | − | |||
| VSR A, VSR B | RT-PCR A | RSVAB1a | ATGGAGYTGCYRATCCWCARRRCAARTGCAAT | + | 737 |
| RSVAB2a | AGGTGTWGTTACACCTGCATTRACACTRAATTC | − | |||
| Nested PCR A | RSVA3a | TTATACACTCAACAATRCCAAAAAWACC | + | VSR A: 363 VSR B: 611 |
|
| RSVA4a | ATCTTCCTAACTCTTGCTRTTAATGCATTG | + | |||
| RSVB3a | AAATTCCCTGGTAATCTCTAGTAGTCTGT | − | |||
| RSVB4a | GATGCGACAGCTCTGTTGATTTACTATG | − | |||
| Rhinovirus | RT-PCR A | Rino-E1b | CTCCGGCCCCTGAATRYGGCTAA | + | 639 |
| Rino-E2b | TCIGGIARYTTCCASYACCAICC | − | |||
| Nested PCR A | Rino-I3b | ACCRASTACTTTGGGTRWCCGTG | + | 110 | |
| Rino-I4b | CTGTGTTGAWACYTGAGCICCCA | − | |||
| Metapneumovirus | RT-PCR B | Meta-E1 | CAAGGTGCAGCAATGTCTGT | + | 357 |
| Meta-E2 | TGCAATTTTGGCCTGTGTTA | − | |||
| Nested PCR B | Meta-I3 | AACCATACGGGATGGTATCAA | + | 200 | |
| Meta-I4 | GCTTGGTCTGCTTCACTGCT | − | |||
| Parainfluenzavirus | RT-PCR B | Para-E1 | TGGMTCYGGATCMTTACCAAT | + | 358 |
| Para-E2 | CAGATTSAYTGATATTGWGTTSGGT | − | |||
| Nested PCR B | Para-I3A | CTGCATTGATCTCAAAATAACT | + | 164 | |
| Para-I3B | TGCAACTAAACTGGACATAGAA | + | |||
| Para-I4 | GGRAGACATTGAGGWGCWAGA | − | |||
| Coronavirus | RT-PCR B | Coro1N | TCCACAATTTGCTGAGCTTG | + | 250 |
| Coro2N | TTCAGCAGTTGCAGGTGAAG | − | |||
| Nested PCR B | Coro3N | TTCCAAAGAGTCAGGCAACA | + | 148 | |
| Coro4N | TGCACTAGGGTTAAGAAGAGGA | − | |||
Statistical analyses
Chi-squared tests were performed using GraphPad InStat version 3.00 for Windows 95 (GraphPad Software, USA).
Results
One virus was identified in 830 cases (64.9% of the samples analyzed). IAn/H1N1 was the most frequently detected (571 cases), followed by rhinovirus (155 cases), parainfluenzavirus (50 cases), IB (37 cases) and RSV (17 cases). Neither metapneumovirus nor coronavirus were detected. Dual infections were found in only 41 cases, being IAn/H1N1 and rhinovirus the most common viruses implicated (27 cases, 3.9% of the total samples). The age of the individuals was one of the factors analyzed. While, IAn/H1N1 was more frequently detected in children aged 6–14 years than in those less than 5 years old (p < 0.0001) and in adults aged 15–30 years than in those more than 31 years old (p < 0.0001), rhinovirus and IB were detected with a similar frequency among all the groups of age. RSV was more frequently detected in children less than 2 years old than in those more than 6 years old (p = 0.05) (Table 2 ).
Table 2.
Distribution of laboratory-confirmed viral infection by age.
| 0–2 (n = 118) | 3–5 (n = 136) | 6–10 (n = 244) | 11–14 (n = 185) | 15–30 (n = 254) | 31–45 (n = 178) | 46–64 (n = 130) | 65–90 (n = 19) | ND (n = 25) | Total | |
|---|---|---|---|---|---|---|---|---|---|---|
| IAn/H1N1 | 16.1% | 41.2% | 57.4% | 60.5% | 48.0% | 31.5% | 40.8% | 10.5% | 47.8% | 44.4% |
| Rhinovirus | 15.9% | 12.6% | 9.5% | 12.5% | 14.3% | 16.0% | 15.8% | 16.7% | 9.5% | 13.5% |
| Parainfluenzavirus | 15.2% | 10.5% | 2.5% | 3.7% | 3.2% | 4.6% | 5.5% | 6.7% | 0.0% | 5.7% |
| IB | 10.7% | 10.1% | 1.8% | 0.0% | 0.9% | 3.7% | 0.8% | 0.0% | 0.0% | 3.3% |
| VRS | 4.3% | 3.3% | 0.9% | 0.0% | 0.5% | 1.9% | 0.8% | 5.6% | 0.0% | 1.5% |
The relationship between symptoms included in the clinical case definition for influenza and the respiratory virus identified is shown in Table 3 . It is worth to note that although the presence of fever, the most important symptom included in clinical influenza case definition, is more frequent in IAn/H1N1 infected-patients than in those infected with rhinovirus (p < 0.0001), other symptoms, such as malaise (p = 0.0004), myalgia (p < 0.0001), cough (p < 0.0001) and respiratory syndrome (p < 0.0001), are more frequently found in rhinovirus-infected patients than in those infected with IAn/H1N1.
Table 3.
Relationship between clinical symptoms and laboratory-confirmed viral infection.
| Fever | Headache | Malaise | Myalgie | Cough | Respiratory syndrome | |
|---|---|---|---|---|---|---|
| IAn/H1N1 (n = 546) | 96.0% | 13.9% | 25.6% | 17.9% | 25.5% | 11.5% |
| Rhinovirus (n = 150) | 86.0% | 18.7% | 48.0% | 34.7% | 44.0% | 27.3% |
| Parainfluenzavirus (n = 50) | 94.0% | 16.0% | 32.0% | 16.0% | 36.0% | 26.0% |
| IB (n = 37) | 97.3% | 10.8% | 37.8% | 21.6% | 27.0% | 18.9% |
| VRS (n = 17) | 100% | 5.9% |
The distribution of the detected virus, according to laboratory-confirmed cases, showed that although IAn/H1N1 was distributed throughout the 2009 pandemic period, the epidemic peak was observed in October and November. Rhinovirus showed a peak in May preceding the apparition of IAn/H1N1 (Fig. 1 ). Furthermore, a second rhinovirus peak is observed in September 2009 preceding the maximum detection peak of IAn/H1N1 (Fig. 1). A similar behavior was observed during the 2010–2011 influenza season, when rhinovirus and influenza virus epidemic peaks appeared one after the other (Fig. 2 ), although the influenza peak was observed later (weeks 50–52).
Fig. 1.
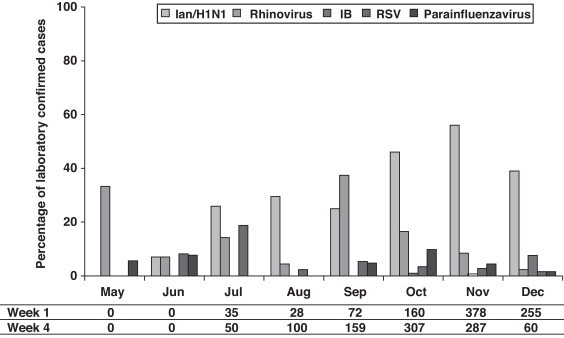
Virus detected in respiratory samples from May to December 2009 given as percentage of total samples for each month (rectangles) and number of cases/100,000 inhabitants declared by ASSN according to clinical case definition in the weeks 1 and 4 of each month (table below).
Fig. 2.
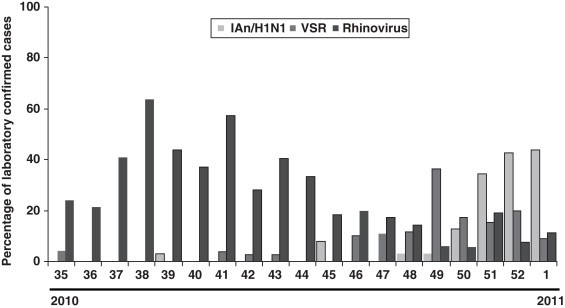
Virus detected in respiratory samples during influenza season 2010–2011 given as percentage of total samples for each week.
On the other hand, although the amount of declared cases by ASSN according to clinical case definition is low between May and August, an increase can be observed from September with rates higher than 100 cases/100,000 inhabitants (Fig. 1).
Discussion
Our study showed that, although the main detected virus was IA/H1N1v, several other respiratory viruses co-circulated during pandemic period (summer–autumn). It has been described that during winter influenza seasons, rhinovirus, RSV and influenza virus epidemic peaks happen one after the other [5, this work]. A similar behavior has been observed during 2009 flu pandemic in our region, where a rhinovirus peak (May) preceded the apparition of IAn/H1N1. The second rhinovirus peak (September) has been also reported in other European countries. It has been hypothesized that rhinovirus infection can reduce the probability of IAn/H1N1 infection and that such interference could have been the cause of a delay in the IAn/H1N1 outbreak expansion at the beginning of autumn in those countries.6
The high incidence of rhinovirus in September (second peak) supports that during weeks 37–40, these respiratory viruses were the cause of a relatively high number of cases, which were attributable to IAn/H1N1 according to the influenza case definition. Our data support that a high percentage of viral infections were clinically misdiagnosed, especially at the beginning of the pandemic (September). A reason of this clinical misdiagnosis may be the fact that major of the symptoms included in clinical influenza case definition are also presented by patients infected by other respiratory viruses, specially rhinovirus, such as has been shown in this work.
Clinical misdiagnosis during flu pandemic has been also reported by other authors7, 8 supporting the idea that the influenza case definition used during 2009 flu pandemic cannot differentiate between other viral infections. Our study offers useful information to face future pandemics caused by influenza virus indicating that differential diagnoses is always required in order to not overestimate the importance of the pandemic.
Conflict of interest
The authors declare no conflicts of interest.
Acknowledgment
JAB is a researcher from ISCIII/FICYT.
References
- 1.Tang J.W., Shetty N., Lam T.T. Features of the new pandemic influenza A/H1N1/2009 virus: virology, epidemiology, clinical and public health aspects. Curr Opin Pulm Med. 2010;16:235–241. doi: 10.1097/MCP.0b013e3283375727. [DOI] [PubMed] [Google Scholar]
- 2.Melón S., Méndez S., Iglesias B., Boga J.A., Rodríguez M., Fanjul J.L. Involvement of adenovirus in clinical mononucleosis-like syndromes in young children. Eur J Clin Microbiol Infect Dis. 2005;24:314–318. doi: 10.1007/s10096-005-1333-7. [DOI] [PubMed] [Google Scholar]
- 3.Coiras M.T., Perez-Breña P., García M.L., Casas I. Simultaneous detection of influenza A, B, and C viruses, respiratory syncytial virus, and adenoviruses in clinical samples by multiplex reverse transcription nested-PCR assay. J Med Virol. 2003;69:122–144. doi: 10.1002/jmv.10255. [DOI] [PubMed] [Google Scholar]
- 4.Coiras M.T., Aguilar J.C., García M.L., Casas I., Perez-Breña P. Simultaneous detection of fourteen respiratory viruses in clinical specimens by two multiplex reverse transcription nested-PCR assays. J Med Virol. 2004;72:484–495. doi: 10.1002/jmv.20008. [DOI] [PMC free article] [PubMed] [Google Scholar]
- 5.Ånestad G. Interference between outbreaks of respiratory syncytial virus and influenza virus infection. Lancet. 1982;1:502. doi: 10.1016/s0140-6736(82)91466-0. [DOI] [PubMed] [Google Scholar]
- 6.Casalegno J.S., Ottmann M., Duchamp M.B., Escuret V., Billaud G., Frobert E. Rhinoviruses delayed the circulation of the pandemic influenza A (H1N1) 2009 virus in France. Clin Microbiol Infect. 2010;1:326–329. doi: 10.1111/j.1469-0691.2010.03167.x. [DOI] [PubMed] [Google Scholar]
- 7.Payne R., Darton T.C., Greig J.M. Systematic telephone triage of possible ‘swine’ influenza leads to potentially serious misdiagnosis of infectious diseases. J Infect. 2009;59:371–372. doi: 10.1016/j.jinf.2009.09.005. [DOI] [PubMed] [Google Scholar]
- 8.Bicanic T., Solomon A.W., Karunaharan N., Chua F., Pope C., Pond M. Positive predictive value of the UK clinical case definition for H1N1/09 (‘swine’) influenza. J Infect. 2010;60:405–407. doi: 10.1016/j.jinf.2010.02.001. [DOI] [PubMed] [Google Scholar]