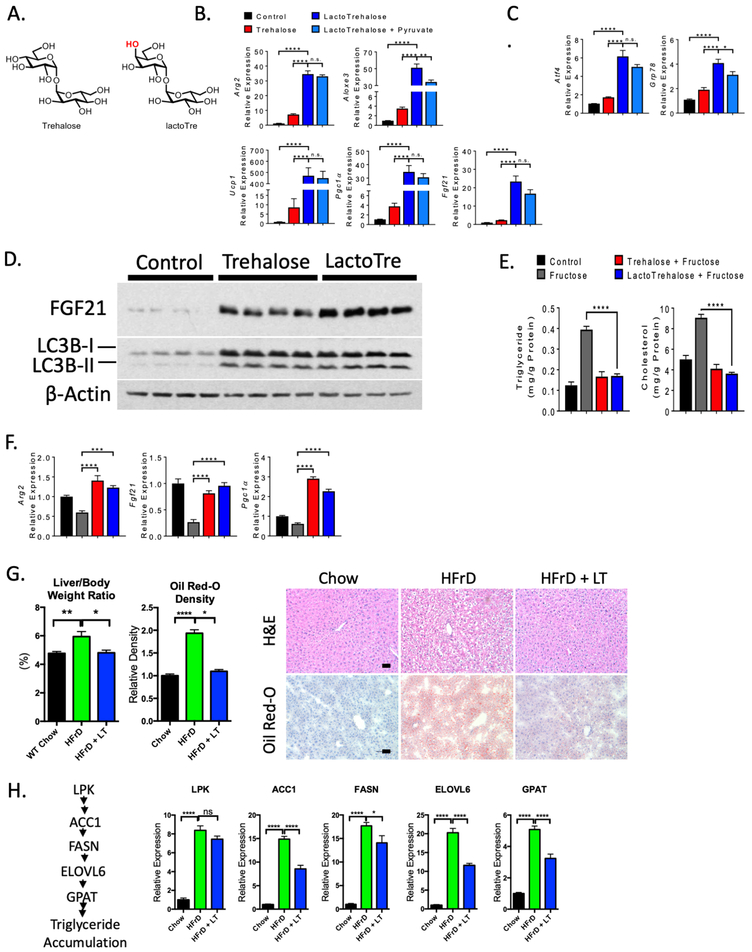
Figure 1. Enhanced hepatocyte fasting-like signaling and autophagic responses to lactotrehalose in vitro and in vivo.
A. Chair conformations of trehalose and lactotrehalose demonstrating differences only in the hydroxyl group orientation at the 4-carbon position (in red). B. and C. qRT-PCR analysis of fasting- or stress-induced factors in murine hepatocytes after treatment with or without trehalose or lactotrehalose. D. Enhanced FGF21 and LC3B-II accumulation in murine hepatocytes treated with trehalose or lactotrehalose. E. In vitro triglyceride and cholesterol quantification in serum- and glucose-starved primary murine hepatocytes treated with or without 10mM fructose 24h, with or without trehalose or lactotrehalose. F. qRT-PCR analysis showing expression of fasting-induced factors upon fructose treatment with or without 10mM trehalose 24h with or without trehalose or lactotrehalose. G. Left, Liver weight:body weight ratio in mice treated with chow or high-fructose diet (HFrD, 60% fructose, 10 days). Middle, densitometric quantification of lipid staining by oil red-O from a minimum 5 random high-powered fields per mouse liver, 3–5 mice per group. Right, H&E staining of paraffin-embedded sections and oil red-O staining of frozen sections from mice fed chow or HFrD with or without 3% lactotrehalose in water (ad libitum). Scale bar: 100 μm. H. Left, canonical de novo lipogenesis pathway in liver. Right, qRT-PCR quantification of canonical de novo lipogenesis pathway intermediaries. ns, not significantly different. *, ****, P < 0.05, or 0.0001 by two-tailed t-test with Bonferroni-Dunn post hoc correction for multiple comparisons.

