

Summary
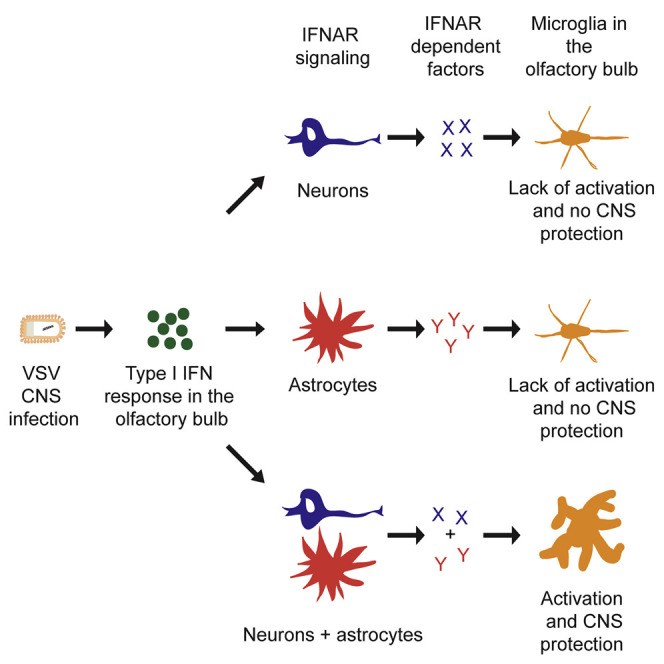
In sterile neuroinflammation, a pathological role is proposed for microglia, whereas in viral encephalitis, their function is not entirely clear. Many viruses exploit the odorant system and enter the CNS via the olfactory bulb (OB). Upon intranasal vesicular stomatitis virus instillation, we show an accumulation of activated microglia and monocytes in the OB. Depletion of microglia during encephalitis results in enhanced virus spread and increased lethality. Activation, proliferation, and accumulation of microglia are regulated by type I IFN receptor signaling of neurons and astrocytes, but not of microglia. Morphological analysis of myeloid cells shows that type I IFN receptor signaling of neurons has a stronger impact on the activation of myeloid cells than of astrocytes. Thus, in the infected CNS, the cross talk among neurons, astrocytes, and microglia is critical for full microglia activation and protection from lethal encephalitis.
Keywords: encephalitis, regulation of microglia activation, neurons, astrocytes, type I IFN receptor signaling
Graphical Abstract
Highlights
-
•
VSV infection via the olfactory route leads to accumulation of microglia in the OB
-
•
Following infection, microglia form an innate immune barrier in the OB
-
•
The microglia barrier prevents viral CNS penetration via the olfactory route
-
•
IFNAR signaling of neurons and astrocytes regulates microglia barrier formation
The mechanisms restricting viral entry into the CNS via the olfactory route were unclear. Chhatbar et al. show that intercellular communication within the olfactory bulb (OB) among neurons, astrocytes, and microglia orchestrates formation of a microglial barrier that restricts the spread of the virus into the CNS.
Introduction
Acute viral infections of the CNS are rare, but can be devastating. Rabies is a prototypic acute neurotropic zoonotic infection causing many deaths worldwide (John et al., 2015). Other zoonotic pathogens that cause encephalitis include Japanese encephalitis virus (JEV), Dengue virus (DenV), and West Nile virus (WNV) and are often associated with pathologies such as high morbidity, mortality, and post-recovery neurocognitive deficits (John et al., 2015, Sadek et al., 2010). These pathogens are shown to enter the CNS through the olfactory bulb (OB) (Kalinke et al., 2011, Koyuncu et al., 2013, van Riel et al., 2015).
Upon intranasal instillation, vesicular stomatitis virus (VSV), which is a prototype neurotropic virus closely related to rabies virus, infects olfactory sensory neurons in the nasal epithelium (Lundh et al., 1987) and moves along the axons to the OB (Reiss et al., 1998). Within the OB, neurons seem to get productively infected, whereas astrocytes are abortively infected (Pfefferkorn et al., 2015). In vivo infection of microglia with VSV has also been shown in very young mice (Chauhan et al., 2010); however, this was not observed in adult mice (Pfefferkorn et al., 2015). Protective IFN-β is induced locally within the OB, primarily in astrocytes and to a lesser extent in neurons (Detje et al., 2015, Pfefferkorn et al., 2015), and the virus is efficiently arrested in a type I interferon receptor (IFNAR)-dependent manner so that the host is protected from lethal encephalitis (Detje et al., 2009). In addition to the induction of interferon-β (IFN-β), CNS infection via the olfactory route results in recruitment of myeloid cells such as microglia (Getts et al., 2008), and peripheral immune cells such as dendritic cells (DCs) (D’Agostino et al., 2012), T cells, monocytes, and others (Steel et al., 2009) into the CNS.
Microglia are long-lived CNS parenchymal innate immune cells that arise from erythro-myeloid precursors and populate the neuroectoderm early during development (Ginhoux et al., 2010, Kierdorf et al., 2013, Schulz et al., 2012). Microglia play an essential role in homeostasis as well as in inflammatory processes within the CNS (Nayak et al., 2014, Prinz and Priller, 2014). Although a lot is known about their function during sterile inflammation, the role of microglia is less understood in viral encephalitis. During WNV encephalitis, microglia mediate synaptic loss that drives memory deficits (Vasek et al., 2016). Pharmacological inhibition of CSF-1R that results in microglia depletion revealed their protective role in coronavirus encephalitis (Wheeler et al., 2018). Thus, microglia can have both beneficial as well as detrimental roles during viral encephalitis.
Understanding the regulation of microglia responses during viral encephalitis is critical to develop new treatment strategies against viral encephalitis. It was previously shown that IFNAR signaling plays an essential role in regulating innate myeloid cell dynamics during viral encephalitis (Nayak et al., 2013). However, Nayak et al. used the ubiquitous IFNAR-deficient animals that lack IFNAR signaling on all cells. Thus, this study could not reveal the role of IFNAR signaling of different cell subsets of the CNS in the regulation of myeloid cell responses during viral encephalitis. Few studies revealed the critical role of IFNAR signaling of astrocytes in protection during viral encephalitis (Daniels et al., 2017, Hwang and Bergmann, 2018); however, the role of IFNAR signaling of neurons during viral encephalitis has not been addressed at all so far. Furthermore, intercellular communication in the CNS has not yet been addressed for viral encephalitis.
Here, we investigated the contribution of different CNS cell types in regulating myeloid cell activation during VSV encephalitis by using animals that allow deletion of IFNAR signaling on selected CNS cell subsets such as astrocyte, neurons, and microglia. We found that VSV infection via the olfactory route induces accumulation of activated microglia and monocytes in the OB via local proliferation and infiltration. Accumulated microglia form an innate immune barrier in peripheral areas of the OB, which plays a key role in restricting VSV spread within the CNS and protects against lethal encephalitis. Formation of the innate microglia barrier is regulated by IFNAR signaling of neurons and astrocytes, but not of microglia. Our data show mechanisms of regulation of microglia responses during viral encephalitis via intercellular communication.
Results
Upon Intranasal VSV Infection, Myeloid Cells Accumulate in the Glomerular Layer of the OB
To understand the response of CNS-resident myeloid cells such as microglia and monocytes upon virus infection via the olfactory route, wild-type (WT) mice were intranasally (i.n.) infected with VSV and sections of the OB were analyzed by immunohistology. Immunolabeling of Iba-1, a common marker for microglia and infiltrating monocytes, revealed that 4 and 6 days post-infection (dpi) increased numbers of Iba-1+ cells were present in the OB (Figure 1 A). Quantitation of Iba-1+ cells in the glomerular cell layer of the OB, to which olfactory sensory neurons project their axons into, and in the central region called granule cell layer (see Figure S1A for details) (Kalinke et al., 2011), showed that increased numbers of Iba-1+ cells accumulated in the glomerular layer at 4 and 6 dpi (Figure 1B) and significantly more Iba-1+ cells accumulated in the glomerular cell layer compared with the granule cell layer on 6 dpi (Figure S1B).
Figure 1.

Upon Intranasal VSV Instillation, Activated Myeloid Cells Accumulate in the Glomerular Layer of the Olfactory Bulb
C57BL/6 WT mice were intranasally (i.n.) instilled with 103 plaque-forming units (PFU) of VSV or PBS. On 4 and 6 days post-infection (dpi), animals were perfused and brains were prepared.
(A) Slices of the olfactory bulb (OB) were immunolabeled with antibodies directed against Iba-1 and Mac-3, and counterstained with DAPI, and immunofluorescence microscopy was performed.
(B) Quantitation of Iba-1+ cells in the OB glomeruli in (A) (n = 3–8, N = 2, combined data).
(C) Representative flow cytometry data of immune cells present in the CNS on 6 dpi.
(D) Quantitation of CD45hiCD11bhi myeloid cells in (C) (red marked population; n = 4–6, N = 2, combined data).
(E) Representative flow cytometry data of immune cells present in the OB, cerebrum (CB), cerebellum (CL), and brainstem (BS) on 6 dpi.
(F) Quantitation of CD45hiCD11hi myeloid cells in (E) (10 tissues pooled for OB and 5 for other regions in each experiment; N = 4, combined data).
(G) Quantitation of CD45lowCD11low and CD45+CD11b− events in (E) (10 brain areas pooled for OB and 5 for other regions in each experiment; N = 4, combined data).
(H) Three-dimensional reconstruction of the entire unsectioned OB from CX3CR1-cre-ER+/−td-tomatoSt/Wt mice on 6 dpi highlighting microglia accumulation in the periphery of OB (representative data; N = 2). Data are shown as mean ± SEM. ∗p < 0.05, ∗∗p < 0.01, and ∗∗∗p < 0.001. Scale bar in (A) is 200 μm for main panels and 10 μm for insets, and in (H) is 1 mm.
Iba-1+ cells from control animals showed small cell bodies with long and thin processes typical of resting microglia. In contrast, Iba-1+ cells from infected animals had enlarged globular shaped cell bodies without or with short and thick processes implying an activated phenotype (Figure 1A, inset). This was confirmed by immunolabeling of the activation marker Mac-3 that was detected on Iba-1+ cells of infected but not control animals (Figure 1A). Flow cytometry analysis of immune cells from the brain revealed that in control animals most CD11b+ cells expressed low levels of CD45, a characteristic feature of microglia, whereas very few cells expressed high levels of CD45 (Figure 1C). Upon VSV infection, increased percentages of CD11b+CD45hi cells were detected, further confirming accumulation of myeloid cells (Figures 1C and 1D).
To address whether the increase in myeloid cells was particularly abundant in certain brain areas, OBs, cerebrae, cerebellae, and brainstems from several animals were pooled and flow cytometry was performed. In non-infected animals, all brain areas showed low abundance of CD45hiCD11bhi cells (Figure 1E), whereas upon VSV infection only the OB showed significantly increased CD45hiCD11bhi cells (Figures 1E and 1F). There were no significant changes in CD45lowCD11blow as well as CD45+CD11b− cells (Figure 1G). In non-infected control animals, a small number of myeloid cells showed expression of the anti-inflammatory marker CD206, a C-type lectin receptor, which was downregulated upon VSV infection, whereas expression of CD86, a marker of activated myeloid cells, was upregulated on myeloid cells upon infection (Figures S1C and S1D) (Greter et al., 2015). CX3CR1, a marker expressed by myeloid cells and microglia, which is involved in microglia-neuron communication (Ransohoff and Cardona, 2010), was expressed at particularly enhanced levels in the OB of infected animals (Figures S1C and S1D). In infected animals, most of the CD45hiCD11bhi cells expressed high levels of Ly6C (Figure S1D), suggesting that many of these cells were infiltrating monocytes.
Next, we analyzed whether the accumulation of Iba-1+ cells applied to the entire OB. For this, CX3CR1-cre- ER+/− td-tomato St/Wt reporter mice were tamoxifen treated. After 8 weeks, only long-lived CNS-resident myeloid cells such as microglia were marked by td-tomato reporter expression, whereas blood monocytes were replenished by non-marked cells (Figures S1E–S1G) (Goldmann et al., 2016). Such microglia marked mice were infected i.n. with VSV and on 6 dpi light sheet microscopy was performed from the OB (Ertürk et al., 2011). Three-dimensional (3D) reconstruction of the OB from non-infected animals showed randomly distributed td-tomato expression, whereas upon VSV infection accumulation of td-tomato expressing microglia was detected in the periphery of the entire OB (Figure 1H; Video S1). Thus, immunofluorescence imaging together with flow cytometry and light sheet microscopy revealed that upon i.n. VSV infection activated myeloid cells, especially microglia, accumulated in the glomerular region of the entire OB.
Tissue clearance and light-sheet fluorescence microscopy were used to three-dimensionally image the entire unsectioned olfactory bulb from tamoxifen treated CX3CR1-cre-ER+/−td-tomatoSt/Wt animals on day 6 after PBS treatment or VSV-eGFP instillation. Red channel shows the long-lived CNS resident myeloid cells such as microglia.
Myeloid Cells Present in the OB upon VSV Infection Comprise Proliferating Microglia and Infiltrating Monocytes, which Show Distinct Gene Expression Profiles
Immunohistological studies revealed the presence of Iba-1+Ki-67+ cells in the OB 6 dpi after VSV infection, but not in controls (Figures 2A and 2B, insets; Figure S2A), suggesting that upon infection Iba-1+ cells proliferated. To address whether accumulating Iba-1+ cells were exclusively microglia or also infiltrating monocytes, immune cells from brains of VSV-infected tamoxifen-treated CX3CR1-cre- ER+/− td-tomato St/Wt reporter mice were analyzed by flow cytometry. In these animals also VSV infection led to a significant accumulation of CD45hiCD11bhi cells in the brain (Figures 2C and 2D). It is proposed that during CNS inflammation microglia can upregulate CD45 expression and become indistinguishable from infiltrating monocytes (Greter et al., 2015, Yamasaki et al., 2014). In order to verify this, expression of the td-tomato reporter was analyzed in the CD45hiCD11bhi population. Indeed, among CD45hiCD11bhi cells increased numbers of td-tomato+ cells were detected on 6 dpi compared with controls (Figures 2E and 2G). Since in these mice CNS-associated perivascular macrophages (PVMs) also remain td-tomato+ after 8 weeks of tamoxifen injection (Goldmann et al., 2016), we stained for Tmem119, a microglia-specific marker (Bennett et al., 2016), and CD206, a PVM marker (Mrdjen et al., 2018), to exclude PVMs from the analysis. In control animals, most of the cells in the CD45lowCD11blow population expressed Tmem119, whereas basically no cells in the CD45hiCD11bhi population expressed Tmem119 (Figure 2F; Figure S2B). However, upon VSV infection, there was a significant increase in the Tmem119+CD206− cells within the CD45hiCD11bhi population (Figures 2F and 2G), confirming the presence of microglia in the CD45hiCD11bhi population from infected animals. A significant increase in td-tomato−Ly6C+ events also confirmed infiltration of peripheral monocytes in the CNS (Figures 2E and 2G; Figures S2C and S2D). Bromodeoxyuridine (BrdU) labeling experiments in these mice revealed that CD45lowCD11blow cells did not show significant BrdU incorporation, whereas CD45hiCD11bhi cells showed significantly increased percentages of BrdU-positive cells in infected animals (Figures 2H and 2I). Together, these data show that upon i.n. VSV infection proliferating microglia and infiltrating monocytes accounted for the accumulation of myeloid cells within the CNS.
Figure 2.

In the OB of VSV-Infected Mice, Accumulated Myeloid Cells Comprise Proliferating Microglia and Infiltrating Monocytes
Mice were treated as described in Figure 1, and brains were removed on 6 dpi after PBS perfusion, unless otherwise stated.
(A) Slices of the OB were immunolabeled with antibodies directed against Iba-1 and Ki-67, and counterstained with DAPI, and immunofluorescence microscopy was performed.
(B) Quantitation of Iba-1+Ki-67+ cells in the OB glomeruli in (A) (n = 7–8, N = 2, combined data; p < 0.001, one-sample t test).
(C) Representative flow cytometry data of immune cells present in the CNS of CX3CR1-cre-ER+/−td-tomatoSt/Wt animals.
(D) Quantitation of CD45lowCD11blow and CD45hiCD11bhi events in (C) (n = 8, N = 2, combined data).
(E) Representative data for td-tomato reporter expression in cells from (C).
(F) Representative data for expression of Tmem119 and CD206 in CD45hiCD11bhi cells in CX3CR1-cre-ER+/−td-tomatoSt/Wt animals. Mice were not perfused for Tmem119 staining experiment.
(G) Quantitation of td-tomato+ and td-tomato− events in CD45hiCD11bhi cells from (E) and Tmem119+CD206− events in (F) (n = 5–8, N = 2, combined data).
(H) Representative data for BrdU incorporation in different myeloid cell populations (dotted line, unstained control; solid line, stained sample).
(I) Percentage of BrdU+ events in (H) (n = 6–8, N = 2, combined data). Data are shown as mean ± SEM. ∗∗p < 0.01, ∗∗∗p < 0.001; ns, not significant. Scale bar in (A) is 200 μm for main panels and 10 μm for insets.
Since we observed three different populations of myeloid cells comprising microglia and monocytes in the CNS of VSV-infected animals, we further investigated the presence of CD45hi microglia in the OB of infected animals and characterized these cells by sorting CD45lowCD11blow microglia, CD45hiCD11bhitd-tomato+ microglia, and CD45hiCD11bhitd-tomato−Ly6G− infiltrating monocytes, and performing RNA sequencing. In control animals, myeloid cells consisted mostly of CD45lowCD11blow microglia, with very few CD45hiCD11bhi cells that did not express td-tomato, suggesting that these cells were not PVMs. However, upon infection, we observed the emergence of CD45hiCD11bhitd-tomato+ cells, suggesting that upon infection a part of the CD45low microglia present in the OB upregulated CD45 and became CD45hi (Figure 3 A). RNA-sequencing (RNA-seq) analysis showed significant changes in the regulation of genes between myeloid cells from VSV-infected compared with control animals. Regulated genes were involved in IFN responses, immune responses and its regulation, responses to inflammation, antigen processing and presentation, and regulation of plasma membrane and cell surface-associated functions (Figure 3B). Principal-component analysis showed that infection induced a major change in the gene expression profiles of microglia and that microglia and monocytes present in the OB had distinct gene signatures (Figure 3C). Interestingly, even though CD45hiCD11bhi microglia in infected animals were derived mostly from CD45lowCD11blow microglia, both populations had distinct gene expression profiles with only few genes commonly regulated between them (Figure 3D).
Figure 3.

Myeloid Cell Subsets within the OB of Infected Animals Consist of CD45hi Microglia and Show Distinct Gene Expression Profiles
Tamoxifen-treated CX3CR1-cre-ER+/−td-tomatoSt/Wt mice were treated as described in Figure 1. On 6 dpi, mice were perfused and immune cells from OB were isolated. CD45lowCD11blow microglia from control animals (MG ctrl.) and CD45lowCD11blow microglia (CD45low MG inf.), CD45hiCD11bhitd-tomato+ microglia (CD45hi MG inf.), and CD45hiCD11bhitd-tomato−Ly6G− infiltrating monocytes (Mon.) from infected animals were FACS sorted.
(A) Flow cytometry data of immune cells isolated from OB. Three OBs were pooled for control animals, and five OBs were pooled for VSV-infected animals (representative data, N = 2).
(B) Expression analysis for most regulated genes from the different myeloid cell populations between control and VSV-infected animals.
(C) Principal-component analysis of different myeloid cell populations.
(D) Venn diagram describing numbers of common and different genes regulated between indicated populations compared to CD45lowCD11blow microglia of control animals.
(E) mRNA expression levels of the indicated genes in different myeloid cell populations.
Detailed expression analysis of myeloid cell-associated genes showed that transcripts for several microglia-specific genes such as Tmem119, Sall1, P2ry12, Hexb, Fcrls, Siglech, and Cx3cr1 (Bennett et al., 2016, Butovsky et al., 2014, Buttgereit et al., 2016) were enriched in the CD45lowCD11blow population from control animals but absent in the monocyte population (Figure 3E; Figure S3), confirming the identity of microglia. Interestingly, compared to CD45lowCD11blow microglia from control animals, CD45lowCD11blow microglia as well as CD45hiCD11bhitd-tomato+ microglia from infected animals showed downregulation of all of these genes (Figure 3E; Figure S3). Infiltrating monocytes showed enhanced numbers of Ccr2 transcripts compared to microglia. Additionally, these cells also showed higher expression of Nos2 and Cd86 transcripts (Figure 3E; Figure S3). Interestingly, microglia and monocytes from infected animals showed expression of the Mki67 gene, which is associated with proliferation (Figure 3E). Together, these fluorescence-activated cell sorting (FACS) and RNA-seq studies confirm the presence of CD45hi microglia in the OB upon VSV infection and show that they are distinct from CD45low microglia in terms of their gene expression during CNS infection.
Accumulation of Microglia in the OB Is Essential for the Inhibition of Virus Spread
Previously, it was shown that oral treatment of mice with the brain-penetrant CSF-1R inhibitor BLZ945 resulted in depletion of microglia (Pyonteck et al., 2013). We used this method to deplete microglia and addressed whether the accumulation of microglia was essential to arrest VSV spread via the olfactory route. BLZ945 treatment reduced the numbers of microglia in control animals as well as in VSV-infected animals as seen by immunohistology (Figures 4A and 4B). Depletion of microglia was also confirmed by flow cytometry analysis of CNS immune cells from control animals, which showed a significant decrease in the number of CD45lowCD11blow cells in BLZ945 treated animals compared to controls (Figures 4D and 4E). Flow cytometry analysis of CNS immune cells from VSV-infected animals showed a significant decrease in the number of CD45lowCD11blow cells, but not in CD45hiCD11bhi cells (Figures 4D and 4E). These data show that decreased accumulation of Iba-1+ cells observed in immunohistology (Figures 4A and 4B) was due to depletion of microglia, and not due to the lack of infiltration of blood monocytes. Along with the major decrease in the number of microglia, we also observed a minute, but statistically significant, decrease in CD45hiCD11bhi cells, suggesting depletion of some perivascular and meningeal macrophages (Figures 4D and 4E). Staining of CD11b and CSF-1R in blood cells (Figure 4C) and the presence of CD45hiCD11bhi cells in the CNS upon VSV infection (Figures 4D and 4E) showed that BLZ945 did not deplete blood monocytes or inhibit their accumulation in the CNS. CD86, CD206, and Ly6C expression of myeloid cells was comparable between vehicle- or BLZ945-treated animals, suggesting that BLZ945 treatment did not inhibit activation of myeloid cells (Figures S4A and S4B).
Figure 4.

Depletion of Microglia via CSF-1R Inhibitor Treatment during VSV Infection Leads to Increased Virus Spread within the CNS and Enhanced Mortality
WT mice were i.n. instilled with PBS or 103 PFU VSV and given vehicle or BLZ945 per os (p.o.) daily from the day of infection until 6 dpi. Mice were left alone for survival studies, or blood samples were drawn and brains were collected after perfusion on 7 dpi.
(A) Slices of the OB were immunolabeled with antibodies directed against Iba-1 and Mac-3, and counterstained with DAPI, and immunofluorescence microscopy was performed.
(B) Quantitation of Iba-1+ cells in the OB glomeruli in (A) (n = 4–6, N = 2, combined data).
(C) Representative flow cytometry data and quantitation for CSF-1R+ monocytes in the blood (n = 7–8, N = 2, combined data).
(D) Representative flow cytometry data for immune cells present in the CNS.
(E) Quantitation of CD45lowCD11blow and CD45hiCD11bhi events (black and red marked populations, respectively) in (D) (n = 4–6, N = 2, combined data).
(F) Virus titers in the OB, cerebrum (CB), cerebellum (CL), and brainstem (BS) (n = 10–11, N = 2, combined data).
(G) Survival of mice (n = 18–19 for VSV, n = 5 for PBS, N = 2, combined data). Data are shown as mean ± SEM. ∗p < 0.05, ∗∗p < 0.01. Scale bar in (A) is 200 μm.
Next, the effect of microglia depletion on the spread of VSV into the brain was tested. Animals depleted of microglia showed enhanced presence of virus in the cerebrum and significantly more virus in the cerebellum and brainstem than vehicle-treated animals (Figure 4F). However, these animals did not show detectable virus in peripheral organs such as liver, lung, and spleen (Figure S4C). These data indicated a diminished restriction of virus spread from the OB to other brain regions upon microglia depletion. In accordance with enhanced virus spread, mice depleted of microglia showed higher lethality upon VSV infection than controls (Figure 4G). Thus, after i.n. VSV infection, microglia proliferation and accumulation within the OB was required to inhibit virus spread and to protect the CNS.
IFNAR Signaling of Neurons and Astrocytes Is Required for Microglia Activation
To address whether IFNAR signaling of CNS resident cells, including microglia, was necessary to induce accumulation of activated Iba-1+ cells, we used Nes-cre +/− IFNAR fl/fl mice lacking IFNAR signaling selectively on the cells of the neuroectodermal lineage (Detje et al., 2009) and CX3CR1-cre- ER+/− IFNAR fl/fl mice after 8 weeks of tamoxifen treatment that lack IFNAR signaling selectively on long-lived CX3CR1+ cells such as microglia (Lückoff et al., 2016). Analysis of Iba-1+ cells in the OB of such uninfected mice showed a normal distribution of Iba-1+ cells with long thin processes similar to WT control animals (Figure 5 A; see Figure 1). Upon VSV infection, CX3CR1-cre- ER+/− IFNAR fl/fl mice showed increased numbers of Iba-1+ cells comparable with WT animals on 6 dpi. In contrast, in infected Nes-cre +/− IFNAR fl/fl mice, accumulation of Iba-1+ cells was impaired at 4 and 6 dpi (Fig, 5A-C). However, Iba-1+ cells did express Mac-3, which confirmed their activation (Figure 5A). Next, we analyzed the role of IFNAR signaling of astrocytes by using GFAP-cre +/− IFNAR fl/fl mice. The astrocyte-specific cre expression in these mice was confirmed by the analysis of GFAP-cre +/− Rosa26eYFP St/Wt reporter offspring, which showed YFP expression in astrocytes, but not in neurons (Figure S5). In GFAP-cre +/− IFNAR fl/fl animals, VSV infection led to enhanced expression of Mac-3 on Iba-1+ cells, but accumulation of Iba-1+ cells was impaired at 4 and 6 dpi (Figures 5A–5C). Similarly, Syn1-cre +/− IFNAR fl/fl animals lacking IFNAR signaling on neurons also showed many Iba-1+ cells that stained positive for Mac-3 (Figure 5A), but accumulation of Iba-1+ cells was also impaired upon VSV infection (Figures 5A and 5C).
Figure 5.

IFNAR Signaling of Neurons and Astrocytes, but not Microglia, Is Required for Accumulation of Myeloid Cells in the OB
Animals were treated, and brains were prepared on 4 or 6 dpi as described in Figure 1.
(A) OB slices were immunolabeled for Iba-1 and Mac-3, and counterstained with DAPI, and immunofluorescence microscopy was performed.
(B) Quantitation of Iba-1+ cells in the OB glomeruli in (A) on 4 dpi (n = 3–8, N = 2, combined data). WT data are from Figure 1.
(C) Quantitation of Iba-1+ cells in the OB glomeruli in (A) on 6 dpi (n = 5–8, N = 2, combined data). WT data are from Figure 1. Data are shown as mean ± SEM. ∗p < 0.05, ∗∗p < 0.005, ∗∗∗p < 0.0005; ns, not significant. Scale bar in (A) is 200 μm for main panels and 10 μm for insets.
In order to confirm the regulation of myeloid cell activation within the CNS by neurons and astrocytes, morphological analysis of Iba-1+ cells within the glomeruli of the OB was performed. This analysis revealed that, upon VSV infection of WT animals, myeloid cells showed increased numbers of primary processes and branching. However, the lengths of individual processes was decreased (Figures 6A and 6B), confirming activation of myeloid cells upon VSV infection. In accordance with the immunofluorescence data, myeloid cells from animals lacking IFNAR signaling on neurons or astrocytes showed a significantly diminished increase in the number of primary processes, and the length of the processes was also not significantly altered (Figures 6A and 6B), which suggested a lack of activation. In conclusion, these data confirmed that IFNAR signaling of neurons and astrocytes regulates the activation of myeloid cells that accumulate within CNS during viral encephalitis.
Figure 6.

IFNAR Signaling of Neurons and Astrocytes Regulates Activation of CNS Myeloid Cells
Animals were treated and brains were prepared on 6 dpi as described in Figure 1 for cryosectioning.
(A) OB slices were immunolabeled for Iba-1 and analyzed by confocal microscopy. Representative images of Iba-1+ myeloid cells from WT animals and from animals lacking IFNAR signaling on different CNS cell subsets.
(B) Quantification of numbers of primary processes, branching points, and process lengths of Iba-1+ myeloid cells (n = 10–28 cells from two to three animals per genotype, combined data). Data are shown as mean ± SEM. ∗∗p < 0.005, ∗∗∗p < 0.0005; ns, not significant. Scale bar in (A) is 10 μm.
Histological analysis of Ki-67 expression showed the presence of proliferating Iba-1+ cells in infected mice lacking IFNAR signaling on microglia, whereas mice lacking IFNAR signaling on astrocytes or neurons showed significantly decreased numbers of proliferating Iba-1+ cells (Figures S6A and S6B). These data suggest an essential role of IFNAR signaling of neurons and astrocytes, but not of microglia, for the induction of microglia proliferation and accumulation in the OB of VSV-infected mice. Unlike WT mice, i.n. VSV-challenged mice lacking IFNAR signaling selectively in neurons or astrocytes showed presence of virus in different CNS regions at 4 dpi (Figure S7) and succumbed to VSV infection with similar kinetics as Nes-cre +/− IFNAR fl/fl mice (Detje et al., 2009) (Figure 7 A). These mice showed high viral titers in all parts of the brain, but not in the peripheral organs tested (Figures 7B–7G). Mice lacking IFNAR signaling of microglia survived the infection and had no detectable virus in any tissue tested, similar to WT animals (Figures 7A–7G). IFNAR−/− mice died on 3 dpi with high virus loads in all tissues tested (Figures 7A–7G). These data indicated that IFNAR signaling on neurons and astrocytes is essential for the control of VSV spread within the CNS via the olfactory route, whereas IFNAR signaling of microglia is dispensible.
Figure 7.

IFNAR Signaling of Neurons and Astrocytes, but Not of Microglia, Is Essential for Survival of VSV CNS Infection
(A) Survival of animals after i.n. infection with 1,000 PFU of VSV (n = 6–14, N ≥ 2, combined data).
(B–G) Viral titers of (B) OB, (C) cerebrum, (D) cerebellum, (E) brainstem, (F) liver, and (G) spleen at the time of death or 15 dpi for surviving animals (n ≥ 3, N ≥ 2, representative data). Data are shown as mean ± SEM.
Discussion
Little is known about the mechanisms that regulate myeloid cell activation and accumulation in the CNS during virus infection. Here, we found that upon i.n. VSV instillation activated myeloid cells, especially microglia, accumulated in the glomerular layer of the OB. Depletion of microglia during infection led to enhanced virus spread in the CNS and caused lethal encephalitis. This suggests that upon CNS virus infection microglia form an innate barrier in the OB that controls virus spread via the olfactory route. IFNAR signaling of neurons and astrocytes, but not of microglia, regulated the activation of myeloid cells, and IFNAR signaling of neurons had a stronger impact on activation than IFNAR signaling of astrocytes. This was also reflected by the number of accumulated myeloid cells in the OB, local proliferation of activated myeloid cells, and protection against virus spread into the CNS and subsequent lethal disease. Thus, our results highlight the relevance of cross talk among neurons, astrocytes, and microglia for the regulation of microglia activation and its protective role during CNS virus infection.
In this study, we focused on uncovering the regulation of activation of myeloid cell subsets within the CNS such as microglia during VSV encephalitis after i.n. infection, as they may affect viral control, recovery, and functioning of the CNS post-recovery (Vasek et al., 2016, Wheeler et al., 2018). On 6 dpi, there was significant accumulation of activated proliferating microglia and infiltrating monocytes in the glomerular region of the OB as detected by immunohistology and verified by flow cytometry of genetically microglia marked mice. Light sheet microscopy of whole intact OB of microglia marked mice showed that, upon i.n. VSV infection, microglia accumulated in the glomerular region of the whole OB. These 3D data were supported by immunohistology data that also showed accumulation of Iba-1+ cells in the glomerular region of the OB. It was previously shown that VSV is arrested in the glomerular region of the OB (Detje et al., 2009). A similar observation was made in the VSV infection model for brain DC, in which CD11c-YFP mice were used to study the dynamics of DC in the OB after VSV infection. In that study, also accumulation of Iba-1+CD11c+ cells was detected, which the authors defined as DC (D’Agostino et al., 2012). However, it is possible that a part of these CD11c+ cells in fact were microglia, as recently it has been shown that microglia also express CD11c during neuroinflammation (Greter et al., 2015). In our study also the accumulation of Iba-1+ cells was detected at 4 dpi and continued at 6 dpi. Together, these data suggest that the OB is the site of immune response during pathogen entry via the olfactory route.
Although microglia express lower CD45 levels than infiltrating monocytes, it is proposed that during CNS inflammation activated microglia upregulate CD45 expression and thus solely based on CD45 expression become indistinguishable from infiltrating monocytes (Ajami et al., 2011, Greter et al., 2015, Yamasaki et al., 2014). Using genetically microglia marked mice, we found that upon CNS virus infection some microglia shifted to the CD45hi population, which we also confirmed by Tmem119 expression analysis and flow cytometry. Since microglia have been implemented to play a detrimental role in the long-term complications of encephalitis (Vasek et al., 2016), observation of two distinct microglia populations (CD45low and CD45hi) and infiltrating monocytes motivated us to characterize these cells in greater detail. Analysis of gene expression via RNA-seq of sorted myeloid cells from the OB showed that both microglia and monocytes had distinct gene expression profiles. Infection and associated responses led to extensive changes in microglia gene expression. Although both microglia and monocytes showed IFNAR stimulation as indicated by abundant induction of interferon-stimulated genes (ISGs), which are expressed upon IFNAR stimulation and have many antiviral functions, and genes involved in antigen processing and presentation, there were still significant differences in gene expression profiles of the different subpopulations. Microglia from uninfected animals showed high expression of many microglia-specific genes. While microglia-specific function of Tmem119 is not known yet, Sall1 has been identified as a negative regulator of microglia activation (Buttgereit et al., 2016). Interestingly, Sall1 was downregulated in microglia from infected animals. Thus, presumably Sall1 expression is regulated by neuro-glial cross talk during CNS infection.
We hypothesized that accumulation of microglia in the glomerular region of the OB was an innate immune defense mechanism that restricted virus spread via the olfactory route. In order to experimentally address this, we depleted microglia using a pharmacological method (Pyonteck et al., 2013) in animals i.n. instilled with VSV. This allowed depletion of microglia with high efficiency, although there was also a very minor depletion of PVMs. However, the number of blood monocytes and the accumulation of CD45hiCD11bhi cells in the CNS upon VSV infection did not differ between vehicle- and BLZ945-treated animals. For microglial maintenance, IL-34 is required and it acts as the ligand for CSF-1R, whereas CSF-1 is the ligand for monocyte development (Greter et al., 2012). Thus, specific microglia depletion could be achieved by BLZ945 inhibiting the interaction of CSF-1R with IL-34, but not with CSF-1. Increased spread and presence of virus in the brain after microglia depletion suggest that accumulated microglia in the OB provide an innate immune shield against virus entry via the olfactory route. Theoretically, it could also be possible that the enhanced virus spread in the CNS was due to the small decrease in the number of PVMs, and not due to the large decrease in the number microglia in the CNS parenchyma. However, since on 7 dpi there is no difference in the viral titers in the OB of vehicle- or BLZ945-treated animals, it is very likely that after i.n. infection not the viral entry into the CNS, but the spread of the virus in the CNS was enhanced. Similar observations were also made in other studies where depletion of microglia led to enhanced virus and lethality after coronavirus and flavivirus infections (Seitz et al., 2018, Wheeler et al., 2018). Notably, in the study by Wheeler et al., there was depletion of PVMs. However, in our as well as their study, the decrease in the numbers of PVM is very minor compared with the decrease in the number of microglia. Since the spread of the virus within the CNS is enhanced and not the entry in the CNS, it can be concluded that microglia are responsible for inhibition of virus spread within the CNS. Peripheral organs of these animals did not show detectable virus, indicating that inhibition of CSF-1R did not induce general immune suppression. Thus, our data show a direct antiviral role of microglia after viral entry via the i.n. route.
Studies have shown that IFNAR signaling within the CNS plays an essential role in regulating innate myeloid cell dynamics and immune response (Nayak et al., 2013, Prinz et al., 2008). However, the role of different CNS cell types in regulating myeloid cell activation during viral encephalitis has not been addressed in depth. Therefore, we focused on investigating this aspect in our model of VSV encephalitis after i.n. infection. Lack of Iba-1+ cell proliferation, accumulation, and activation-associated cellular morphology in animals lacking IFNAR signaling of neurons or astrocytes, but not microglia, suggest a model in which the IFN-β produced within the OB acts on neurons and astrocytes and type I IFN stimulation-induced changes in neurons and astrocytes regulate microglia functions and phenotype. This is in contrast to the study by Nayak et al., in which it was proposed that IFNAR signaling of myeloid cells was essential for their full activation and dynamics of accumulation. One of the possible reasons for the lack of microglial activation and accumulation in mice with a selective IFNAR deletion on astrocytes or neurons could be high viral titers in the CNS. Nevertheless, we would like to point out that, in all of the animals, virus is present in the OB and therefore microglia from WT animals are also exposed to high amounts of virus at least early after infection. Thus, the lack of microglia activation seen in the animals lacking IFNAR signaling of neurons and astrocytes is due to abrogated neuron-astrocyte-microglia communication.
Survival experiments with animals lacking IFNAR signaling on different cell subsets of the CNS further established that IFNAR triggering of neurons and astrocytes was essential for survival, whereas IFNAR signaling of microglia was dispensable. The lack of Iba-1+ cell accumulation and death of animals lacking IFNAR signaling on neurons or astrocytes due to encephalitis further implied an important role of microglia accumulation in restricting virus spread via the olfactory route.
In conclusion, our data indicate that upon viral infection via the i.n. route CNS-resident microglia get activated and constitute an early innate barrier in the OB against virus spread within the CNS. Formation of this innate barrier is regulated by IFNAR signaling of neurons and astrocytes and is independent of IFNAR signaling of microglia. Our data unveil a mechanism in the communication between astrocytes, neurons, and microglia during viral encephalitis that restricts viral CNS infiltration via the olfactory route.
STAR★Methods
Key Resources Table
| REAGENT or RESOURCE | SOURCE | IDENTIFIER |
|---|---|---|
| Antibodies | ||
| Anti-Ionized calcium-binding adaptor molecule 1 (Iba-1), Rabbit | Wako | Cat# 019-19741; RRID: AB_839504 |
| Anti-Mac-3, Rat | BD PharMingen | Cat# 550292; RRID: AB_393587 |
| Anti-Ki67, mouse | BD PharMingen | Cat# 550609; RRID: AB_393778 |
| Anti-β-Tubulin III, mouse | Sigma | Cat# T5076-200UL; RRID: AB_532291 |
| Anti-GFAP | DAKO | Cat# Z0334; RRID: AB_10013382 |
| Anti-mouse IgG (H+L; DyLight 594), Goat | Thermo Fisher Scientific | Cat# 35510; RRID: AB_1185569 |
| Anti-rabbit Alexa Fluor 568, Goat | Thermo Fisher Scientific | Cat# A-11011; RRID: AB_143157 |
| Anti-rabbit Alexa Fluor 488, Goat | Thermo Fisher Scientific | Cat# A-11008; RRID: AB_143165 |
| Anti-rat Alexa Fluor 555, Goat | Thermo Fisher Scientific | Cat# A-21434; RRID: AB_2535855 |
| Anti-rabbit Alexa Fluor, 647 | Thermo Fisher Scientific | Cat# A-31573; RRID: AB_2536183 |
| Anti-CD45.2 Pacific blue | Biolegend | Cat# 109820; RRID: AB_492872 |
| Anti-CD86 PE-Cy5 | Biolegend | Cat# 105016; RRID: AB_493602 |
| Anti-CD206 PE-Cy7 | Biolegend | Cat# 141720; RRID: AB_2562248 |
| Anti-Ly6C Alexaflour700 | Biolegend | Cat# 128023; RRID: AB_10643270 |
| Anti-CX3CR1 Brilliant violet 510 | Biolegend | Cat# 149025; RRID: AB_2565707 |
| Anti-Ly6G PE-Cy7 | Biolegend | Cat# 127617; RRID: AB_1877261 |
| Anti-CD11b APC-Cy7 | BD pharmingen | Cat# 557657; RRID: AB_396772 |
| Anti-Tmem119, Rabbit | Abcam | Cat# Ab210405; RRID: AB_2744673 |
| DAPI | Sigma | Cat# D9542 |
| Viruses | ||
| VSV-Indiana (Mudd-Summers isolate) | D. Kolakofsky (University of Geneva, Switzerland) | N/A |
| VSV-eGFP | Gert Zimmer, (University of Bern, Switzerland) | N/A |
| Chemicals | ||
| BLZ945 | Novartis | N/A |
| Tamoxifen | Sigma | Cat# T5648-5G |
| BrdU | Invitrogen | Cat# 00-0103 |
| Captisol® | Captisol | Cat# RC-0C7-100 |
| Percoll | Sigma | Cat# P1644-500ML |
| Collagenase from Clostridium histolyticum | Sigma | Cat# C9263-500MG |
| rDNase | MACHEREY-NAGEL | Ref# 740963 |
| Critical commercial kits | ||
| Neural tissue digestion kit (p) | Miltenyi Biotec | Cat# 130-092-628 |
| APC BrdU Flow Kit | BD biosciences | Cat# 552598 |
| Deposited Data | ||
| RAW data files for RNA-seq | NCBI Gene Expression Omnibus | GEO: GSE110188 |
| Experimental models: Cell lines | ||
| Vero cells | ATCC® | Cat# CRL-1586 |
| BHK-21 cells | ATCC® | Cat# CCL-10 |
| Experimental Models: Organisms/strains | ||
| Mouse: C57BL/6JOlaHsd also referred to as WT | Harlan-Winkelmann or Janvier | Cat# 057 (H-W) |
| Mouse: IFNAR−/− | Kamphuis et al., 2006 | N/A |
| Mouse: IFNARfl/fl | Kamphuis et al., 2006 | N/A |
| Mouse: Nes-cre+/− | The Jackson Laboratory | Cat# 003771 |
| Mouse: Syn1-cre+/− | The Jackson Laboratory | Cat# 003966 |
| Mouse: GFAP-cre+/− | NCI Mouse Repository | Cat# 01XN3 |
| Mouse: CX3CR1-cre-ER+/− | The Jackson Laboratory | Cat# 020940 |
| Mouse: Rosa26eYFPSt/St | The Jackson Laboratory | Cat# 006148 |
| Mouse: td-tomatoSt/St | The Jackson Laboratory | Cat# 007909 |
| Softwares | ||
| GraphPad Prism Version 5.0 | GraphPad software | https://www.graphpad.com/scientific-software/prism/ |
| FlowJo | FlowJo LLC | https://www.flowjo.com/solutions/flowjo/ |
| ImageJ and Plugins | NIH | https://imagej.nih.gov/ij/ |
| FiJi and Simple Neurite Tracer Plugin | NIH | https://imagej.net/Downloads |
| Imaris | Bitplane AG | http://www.bitplane.com/download |
Contact for Reagent and Resource Sharing
Further information and requests for resources and reagents should be directed to and will be fulfilled by the Lead Contact, Ulrich Kalinke (ulrich.kalinke@twincore.de).
BLZ945 was provided by Novartis, and transgenic animals used in the study, except for IFNARfl/fl, were provided under an MTA and therefore cannot be directly provided by U.K.
Experimental Models and Subject Details
Animals, tamoxifen and BrdU treatment
C57BL/6JOlaHsd mice, also referred to as wild-type (WT) mice, were purchased from Harlan-Winkelmann or Janvier. All mice used in this study are on the C57BL/6 background. In order to enable selective depletion of IFNAR on CNS cell subsets, IFNAR fl/fl mice (Kamphuis et al., 2006) were bread with Nes-cre +/− (Tronche et al., 1999), Syn1-cre +/− (Zhu et al., 2001), GFAP-cre +/− (Bajenaru et al., 2002), or CX3CR1-cre- ER+/− (Goldmann et al., 2013) mice. The absence of germline deletions for IFNAR fl/fl were verified by PCR analysis. Rosa26eYFP St/St mice (Srinivas et al., 2001) were bred with GFAP-cre +/− mice to assess the specificity of cre. In order to generate microglia specific td-tomato reporter animals, CX3CR1-cre- ER+/− mice were bread with td-tomato St/St mice (Madisen et al., 2010). IFNAR-deficient mice (IFNAR −/−) (Müller et al., 1994) were more than 20-fold backcrossed to the C57BL/6 background. Both male and female adult mice older than 8 weeks were included in experiments. Littermates were randomly assigned to experimental groups. In order to induce creER activity, animals were treated subcutaneously with 4 mg of tamoxifen (Sigma) two times with 48 h interval in between after weaning. In order to eliminate monocyte targeting, experiments were performed 8 weeks after tamoxifen treatment. In order to mark proliferating cells, animals were given 200 μl BrdU (Invitrogen) i.p. 12 hr and 3 hr before sacrifice. Animals were kept under specific pathogen-free conditions, with ad libitum food and water, in the central mouse facility of the TWINCORE and at the Helmholtz Centre for Infection Research. Animal experiments were conducted in compliance with German federal and state legislation on animal experiments.
i.n. VSV infection
For i.n. infection, mice were anesthetized with Ketamin/Rompun and a total of 10 μl containing 103 PFU of VSV in PBS were pipetted into both nostrils.
Cell lines
Pre-authenticated Vero and BHK-21 cells were purchased from ATCC®. Vero cells and BHK-21 cells were grown under standard cell culture conditions in MEM media containing 5% FCS at 37°C.
Virus
VSV-Indiana (Mudd-Summers isolate), originally obtained from D. Kolakofsky (University of Geneva, Switzerland) and VSV-eGFP kindly provided by Gert Zimmer, (University of Bern, Switzerland) (Hoffmann et al., 2010) were grown on BHK-21 cells. Virus was harvested from cell culture supernatants, and titers were determined by plaque formation on Vero cells.
Method Details
VSV preparation and plaque assay
For VSV preparation, a confluent cell layer of BHK-21 cells was infected with VSV at MOI of 0.01 in MEM medium with 2% FCS for 1 h. Then, the medium was aspirated and cells were overlaid with fresh MEM medium containing 5% FCS. After 48 h the supernatant was harvested and centrifuged at 300 g for 6 min to remove cell debris. The virus stock was frozen at −80°C and the titer was determined via plaque assay.
Measurement of infectious viral particles in supernatants was done by directly diluting supernatants in media. For measurement of infectious viral particles in organs, tissues were prepared at the indicated time points after infection, transferred to Lysing Matrix tubes (MP biomedicals), and kept with either 500 μL MEM medium (5% FCS) (small tissues), or 1000 μL (big tissues). Samples were frozen at −80°C until plaque assay was performed. Then, the samples were thawed and homogenized for 30 s (4 m/sec) in a sample homogenizer (MP biomedicals). For OB, 500 μL of medium was added to organ homogenate before samples were used in plaque assay. Serial 10-fold dilutions of homogenates were transferred onto Vero cell monolayer in 6-well plates and incubated for 1 h at 37°C. Monolayers were overlaid with 2 mL of MEM containing 1% methylcellulose and incubated for 24 h at 37°C. Then the overlay was removed, and the monolayer was fixed and stained using 0.5% crystal violet.
Perfusion of mice
In order to determine the viral load in mouse organs, perform immunohistochemistry and to isolate CNS immune cells organs had to be freed of circulating blood in order to prevent falsification of results by virus particles or immune cells from the blood. Therefore, mice were anesthetized using ketamine∖xylasine mixture and horizontally pinned to a preparation block. The thorax was opened up and an incision was made to the diaphragm. The right lobe including the ribs was removed and a butterfly needle was inserted into the lower right ventricle. An incision was made to the lower left ventricle to allow blood to drain from the circulation system. PBS was flushed through the blood circulation system by gravitation and preferably the heartbeat of the mouse. When brains were taken for histology approximately 15 mL of 4% PFA was flushed after PBS to fix the organs. Perfusion was completed within approximately 5 min and afterward the organs were extracted and were further used for virus titer determination, immunohistology or isolation of immune cells from CNS.
Immunofluorescence microscopy
Immunolabelling was performed as described previously (Skripuletz et al., 2015). Brains were post fixed overnight after removal from animals. 7 μm sections were cut using microtome. Slices were dried overnight at 37°C and stored at room temperature. For immunolabelling, slices were deparaffinised in xylene followed by rehydration in ethanol gradient and incubation in PBS for 5 minutes. Antigen retrieval was done by boiling slices in citrate buffer for 5 min followed by 20 min incubation. Non-specific binding of antibodies was blocked by incubation with 10% goat serum and 0.1% Triton X-100 in PBS for 1 h. Slices were incubated with following primary antibodies at 4°C overnight: Iba-1 (rabbit, 1:300) and Mac-3 (rat IgG, 1:500), for proliferation Ki67 (mouse IgG, 1:50). Next day slices were washed with PBS to remove excess antibodies which was followed by incubation with secondary antibodies for 1 h at room temperature at a dilution of 1:500. This was followed by washing 3 times with PBS. Slices were mounted in mowiol containing DAPI (4’, 6-diamidino-2-phenylindole) to counter stain nucleus. Pictures were taken on a BX61 microscope (Olympus). Original pictures were adjusted for brightness, contrast and color balance and post processed using ImageJ software (NIH). Cell counting was done using cell counter Plugin of ImageJ (Video S2). The exact procedure to use the Plugin is also given at the link: https://imagej.nih.gov/ij/plugins/cell-counter.html. The Plugin can also be downloaded using this link. Quantification of glial cells was performed for proliferating myeloid cells (double staining with Iba-1/Ki-67) and the total myeloid cell numbers (Iba-1+). Immunopositive cells with identified nucleus (counterstaining with 4’, 6-diamidino-2-phenylindole (DAPI) for immunofluorescence) were counted and expressed as number of cells per mm2 area.
Confocal microscopy and image analysis
For immunostaining 30-μm serial cryosections were prepared for immunofluorescence staining. Briefly, sections were blocked with PBS containing 5% bovine serum albumin and permeabilized with 0.1% Triton X-100 in blocking solution. Primary antibody Iba-1 (1:500), Anti-β-Tubulin III antibody (1:500) for neuronal cells and anti-GFAP antibody for detection of astrocytes (1:500) were added and incubated for 48 hours at 4°C. After washing, secondary antibodies goat anti-mouse IgG (H+L; DyLight 594) or goat anti rabbit Alexa Fluor 568 (1:500) was added for 24 hours at 4°C. Nuclei were counterstained with DAPI and mounted in fluorescence mounting medium. For morphological examination of microglia, tissue sections were analyzed on a confocal laser scanning microscope (LSM 780, Zeiss) using a 40x oil objective (Plan Apochromat, NA 1.4), laser excitation at 405 and 561 nm and LSM software ZEN 2012. To obtain z stacks of individual microglia images were acquired with a lateral resolution of 75 × 75 nm and incrementally steps of 150 nm in axial direction. 80-150 images were collected for each z stack depending on the length of process extensions. Image restoration of 3D data were performed with Huygens deconvolution software (SVI) and displayed as maximum intensity projection. Quantification of microglial processes was done using the Simple Neurite Tracer Plugin by FiJi (Longair et al., 2011).
Tissue clearance and 3D imaging
Animals were infected with VSV-eGFP as described. After perfusion, OBs and the immediately adjacent cerebral tissue were dissected and post-fixed overnight in 4% PFA at 4°C. Tissue was then cleared following the CUBIC clearance protocol (Susaki et al., 2015). Imaging was performed using a light-sheet fluorescence microscope (Ultramicroscope, LaVision Biotec) with 1.6x magnification, 10 μm z-intervals and 5% overlap between tiles (Ertürk and Bradke, 2013, Ertürk et al., 2011). TIF files were stitched using the ImageJ ‘Grid/collection stitching’ Plugin (Preibisch et al., 2009). Image files were 3D rendered and visualized using Imaris software.
BLZ945 treatment
For administration to mice, BLZ945 was formulated in 20% Captisol at a concentration of 12.5 mg/ml. For in vivo dosing, mice received 200 mg per kg body weight BLZ945 or vehicle (20% Captisol) by oral gavage once daily from 0 dpi until 6 dpi.
Isolation of CNS immune cells, flow cytometry and sorting
CNS immune cells were isolated using density gradient centrifugation after digestion of brains with neural tissue digestion kit (p) following manufacturer’s protocol for flow cytometry and with collagenase-D and DNase for sorting. Harvested brains were added to gentleMACS C tubes (Miltenyi Biotec) with 2 mL of digestion mixture. Tissue disruption was done in C tubes using gentleMACS Dissociator (Miltenyi Biotec) using program for brain. This was followed by digestion for 30 minutes. After digestion, enzymes were removed by PBS wash and pelleting of digested tissues by centrifugation. Percoll solutions of different densities were prepared in PBS using percoll. 4 mL 70% Percoll solution was added to the pellet and homogenization was done using needle and syringe to remove any clumps. This was underlayed a 30% and 37% percoll gradient using a long spinal cord needle and syringe. Gradients with tissues were centrifuged for 30 min, 500 g, RT, minimum brakes to separate the immune cells from myelin and other debris. Myelin and percoll from top of the cells were sucked off with vacuum being careful not to disturb the immune cell layer present between 37% and 70% percoll layer. Cell layer was transferred to fresh tubes using 1 mL micropipette and filled with MACS buffer to 15 mL. This was followed by centrifugation for 5 min at 300 g. Supernatant was removed with approximately 500 μl left to resuspend the pellet. Resuspended pellet was transfer to a centrifuge tubes and used for staining. Following antibodies were used for staining: CD45.2 Pacific blue, CD86 PE-Cy5, CD206 PE-Cy7, Ly6C Alexaflour700, CX3CR1 Brilliant violet 510, Ly6G PE-Cy7, CD11b APC-Cy7, and Rabbit Tmem119. BrdU staining was done using APC BrdU Flow Kit according to manufacturer’s protocol using 2 μl of anti-BrdU antibody. For Tmem119 staining anti-Rabbit Alexa-647 secondary was used. Data were acquired on an LSRII flow cytometer (BD Biosciences) and analyzed with FlowJo software. Cells were sorted on FACSAria fusion sorter (Becton Dickinson).
RNA-seq FACS-sorted cells were sequenced on Illumina HiSeq RNA-Seq. Sequences from single-end 50 bp mouse samples were provided in FASTQ format and sequence quality control was assessed using the program FastQC (Andrews, 2010). Reads were aligned to the GRCm38 mouse genome assembly using STAR aligner and the number of reads mapping to each gene were counted using HTSeq-count (Anders et al., 2015). Filtering of the data included the exclusion of genes which did not present at least 10 counts in all the replicates. Normalization and differential analysis were performed using DESeq2 (Love et al., 2014) and genes that did not achieve 10 counts in all three replicates were filtered out. Pairwise comparison between the different conditions and populations was performed for each time point. Differential gene expression analysis were based on the negative binomial distribution and subsequent Wald statistical test (Love et al., 2014) and genes with false discovery rate (FDR) < 0.05 were considered to show significant differential gene expression. To asses overall similarities between samples the principle component analysis (PCA) was performed. The top differentially regulated genes depicted in the heatmap were subjected to rlog normalization and clustered using k means. Genes with a FDR < 0.05 and a minimum of two-fold change were shown in the Venn diagrams generated by using the Bioconductor package VennDiagram.
Quantification and Statistical Analysis
Data are shown as mean ± s.e.m. details about the number of technical (n) and biological replicates (N) is described for each dataset in corresponding figure legends. Cell numbers and viral titers were compared by the two tailed Mann–Whitneyˆ U test or by Kruskal-Wallis test unless otherwise stated in figure legends. For survival analysis, the Mantel–Cox survival analysis with log-rank statistics was used. For morphological analysis of microglia from each genotype 10–28 cells were investigated combined from two to three animals. Data represent the mean values of each analyzed cell. P value of 0.05 was considered statistically significant. For statistical analysis, the software package GraphPad Prism Version 5.0 was used.
Data Availability
The RNA-seq data generated in this paper have been deposited in the NCBI Gene Expression Omnibus and are accessible through GEO Series accession number GSE110188 (https://www.ncbi.nlm.nih.gov/geo/query/acc.cgi?acc=GSE110188).
Acknowledgments
We would like to thank Andreas Pavlou for help with microglia depletion experiments. This study was supported by a bilateral project of the German Center for Neurodegenerative Diseases and the Helmholtz Centre for Infection Research (to F.B., M.S., and U.K.), the Helmholtz Zukunftsthema “Immunology & Inflammation” (ZT-0027) (to U.K.), and the Niedersachsen-Research Network on Neuroinfectiology (N-RENNT) of the Ministry of Science and Culture of Lower Saxony, Germany (to M.S. and U.K.). M.P. is supported by the DFG (SFB/TRR167 “NeuroMac”). We would like to acknowledge the assistance of the Cell Sorting Core Facility of the Hannover Medical School supported in part by Braukmann-Wittenberg-Herz-Stiftung and DFG.
Author Contributions
C.C. designed and performed all experiments, analyzed data, and wrote the paper. C.N.D. performed plaque assays and survival experiments. E.G. performed and contributed to flow cytometry experiments. K.B. contributed to flow cytometry and sorting, microglia depletion experiments, and data analysis. J. Spanier and L.G. contributed to microglia depletion experiments. D.A.E. performed light sheet microscopy. M.J.C.J. performed RNA-seq analysis of microglia. N.M. and M.A.K. performed morphological analysis of microglia. J. Sutton provided BLZ945. C.K.P. contributed to flow cytometry experiments and data analysis. V.G. contributed to immunofluorescence microscopy experiments and data analysis. M.P. provided the CX3CR1-cre- ER+/− mouse, provided funding for RNA-seq analysis of microglia, contributed to data discussion, suggested experiments, and provided critical insights. F.B. provided td-tomato St/St mouse, contributed to light sheet microscopy data, and secured funding. M.S. and U.K. conceived the idea, secured funding, designed experiments, discussed data, and wrote the paper.
Declaration of Interests
The authors declare no competing interests.
Published: October 2, 2018
Footnotes
Supplemental Information includes seven figures and two videos and can be found with this article online at https://doi.org/10.1016/j.celrep.2018.09.003.
Contributor Information
Martin Stangel, Email: stangel.martin@mh-hannover.de.
Ulrich Kalinke, Email: ulrich.kalinke@twincore.de.
Supplemental Information
References
- Ajami B., Bennett J.L., Krieger C., McNagny K.M., Rossi F.M. Infiltrating monocytes trigger EAE progression, but do not contribute to the resident microglia pool. Nat. Neurosci. 2011;14:1142–1149. doi: 10.1038/nn.2887. [DOI] [PubMed] [Google Scholar]
- Anders S., Pyl P.T., Huber W. HTSeq—a Python framework to work with high-throughput sequencing data. Bioinformatics. 2015;31:166–169. doi: 10.1093/bioinformatics/btu638. [DOI] [PMC free article] [PubMed] [Google Scholar]
- Andrews (2010). FastQC: a quality control tool for high throughput sequence data. http://www.bioinformatics.babraham.ac.uk/projects/fastqc/.
- Bajenaru M.L., Zhu Y., Hedrick N.M., Donahoe J., Parada L.F., Gutmann D.H. Astrocyte-specific inactivation of the neurofibromatosis 1 gene (NF1) is insufficient for astrocytoma formation. Mol. Cell. Biol. 2002;22:5100–5113. doi: 10.1128/MCB.22.14.5100-5113.2002. [DOI] [PMC free article] [PubMed] [Google Scholar]
- Bennett M.L., Bennett F.C., Liddelow S.A., Ajami B., Zamanian J.L., Fernhoff N.B., Mulinyawe S.B., Bohlen C.J., Adil A., Tucker A. New tools for studying microglia in the mouse and human CNS. Proc. Natl. Acad. Sci. USA. 2016;113:E1738–E1746. doi: 10.1073/pnas.1525528113. [DOI] [PMC free article] [PubMed] [Google Scholar]
- Butovsky O., Jedrychowski M.P., Moore C.S., Cialic R., Lanser A.J., Gabriely G., Koeglsperger T., Dake B., Wu P.M., Doykan C.E. Identification of a unique TGF-β-dependent molecular and functional signature in microglia. Nat. Neurosci. 2014;17:131–143. doi: 10.1038/nn.3599. [DOI] [PMC free article] [PubMed] [Google Scholar]
- Buttgereit A., Lelios I., Yu X., Vrohlings M., Krakoski N.R., Gautier E.L., Nishinakamura R., Becher B., Greter M. Sall1 is a transcriptional regulator defining microglia identity and function. Nat. Immunol. 2016;17:1397–1406. doi: 10.1038/ni.3585. [DOI] [PubMed] [Google Scholar]
- Chauhan V.S., Furr S.R., Sterka D.G., Jr., Nelson D.A., Moerdyk-Schauwecker M., Marriott I., Grdzelishvili V.Z. Vesicular stomatitis virus infects resident cells of the central nervous system and induces replication-dependent inflammatory responses. Virology. 2010;400:187–196. doi: 10.1016/j.virol.2010.01.025. [DOI] [PubMed] [Google Scholar]
- D’Agostino P.M., Kwak C., Vecchiarelli H.A., Toth J.G., Miller J.M., Masheeb Z., McEwen B.S., Bulloch K. Viral-induced encephalitis initiates distinct and functional CD103+ CD11b+ brain dendritic cell populations within the olfactory bulb. Proc. Natl. Acad. Sci. USA. 2012;109:6175–6180. doi: 10.1073/pnas.1203941109. [DOI] [PMC free article] [PubMed] [Google Scholar]
- Daniels B.P., Jujjavarapu H., Durrant D.M., Williams J.L., Green R.R., White J.P., Lazear H.M., Gale M., Jr., Diamond M.S., Klein R.S. Regional astrocyte IFN signaling restricts pathogenesis during neurotropic viral infection. J. Clin. Invest. 2017;127:843–856. doi: 10.1172/JCI88720. [DOI] [PMC free article] [PubMed] [Google Scholar]
- Detje C.N., Meyer T., Schmidt H., Kreuz D., Rose J.K., Bechmann I., Prinz M., Kalinke U. Local type I IFN receptor signaling protects against virus spread within the central nervous system. J. Immunol. 2009;182:2297–2304. doi: 10.4049/jimmunol.0800596. [DOI] [PubMed] [Google Scholar]
- Detje C.N., Lienenklaus S., Chhatbar C., Spanier J., Prajeeth C.K., Soldner C., Tovey M.G., Schlüter D., Weiss S., Stangel M., Kalinke U. Upon intranasal vesicular stomatitis virus infection, astrocytes in the olfactory bulb are important interferon Beta producers that protect from lethal encephalitis. J. Virol. 2015;89:2731–2738. doi: 10.1128/JVI.02044-14. [DOI] [PMC free article] [PubMed] [Google Scholar]
- Ertürk A., Bradke F. High-resolution imaging of entire organs by 3-dimensional imaging of solvent cleared organs (3DISCO) Exp. Neurol. 2013;242:57–64. doi: 10.1016/j.expneurol.2012.10.018. [DOI] [PubMed] [Google Scholar]
- Ertürk A., Mauch C.P., Hellal F., Förstner F., Keck T., Becker K., Jährling N., Steffens H., Richter M., Hübener M. Three-dimensional imaging of the unsectioned adult spinal cord to assess axon regeneration and glial responses after injury. Nat. Med. 2011;18:166–171. doi: 10.1038/nm.2600. [DOI] [PubMed] [Google Scholar]
- Getts D.R., Terry R.L., Getts M.T., Müller M., Rana S., Shrestha B., Radford J., Van Rooijen N., Campbell I.L., King N.J. Ly6c+ “inflammatory monocytes” are microglial precursors recruited in a pathogenic manner in West Nile virus encephalitis. J. Exp. Med. 2008;205:2319–2337. doi: 10.1084/jem.20080421. [DOI] [PMC free article] [PubMed] [Google Scholar]
- Ginhoux F., Greter M., Leboeuf M., Nandi S., See P., Gokhan S., Mehler M.F., Conway S.J., Ng L.G., Stanley E.R. Fate mapping analysis reveals that adult microglia derive from primitive macrophages. Science. 2010;330:841–845. doi: 10.1126/science.1194637. [DOI] [PMC free article] [PubMed] [Google Scholar]
- Goldmann T., Wieghofer P., Müller P.F., Wolf Y., Varol D., Yona S., Brendecke S.M., Kierdorf K., Staszewski O., Datta M. A new type of microglia gene targeting shows TAK1 to be pivotal in CNS autoimmune inflammation. Nat. Neurosci. 2013;16:1618–1626. doi: 10.1038/nn.3531. [DOI] [PubMed] [Google Scholar]
- Goldmann T., Wieghofer P., Jordão M.J., Prutek F., Hagemeyer N., Frenzel K., Amann L., Staszewski O., Kierdorf K., Krueger M. Origin, fate and dynamics of macrophages at central nervous system interfaces. Nat. Immunol. 2016;17:797–805. doi: 10.1038/ni.3423. [DOI] [PMC free article] [PubMed] [Google Scholar]
- Greter M., Lelios I., Pelczar P., Hoeffel G., Price J., Leboeuf M., Kündig T.M., Frei K., Ginhoux F., Merad M., Becher B. Stroma-derived interleukin-34 controls the development and maintenance of langerhans cells and the maintenance of microglia. Immunity. 2012;37:1050–1060. doi: 10.1016/j.immuni.2012.11.001. [DOI] [PMC free article] [PubMed] [Google Scholar]
- Greter M., Lelios I., Croxford A.L. Microglia versus myeloid cell nomenclature during brain inflammation. Front. Immunol. 2015;6:249. doi: 10.3389/fimmu.2015.00249. [DOI] [PMC free article] [PubMed] [Google Scholar]
- Hoffmann M., Wu Y.J., Gerber M., Berger-Rentsch M., Heimrich B., Schwemmle M., Zimmer G. Fusion-active glycoprotein G mediates the cytotoxicity of vesicular stomatitis virus M mutants lacking host shut-off activity. J. Gen. Virol. 2010;91:2782–2793. doi: 10.1099/vir.0.023978-0. [DOI] [PubMed] [Google Scholar]
- Hwang M., Bergmann C.C. Alpha/beta interferon (IFN-α/β) in astrocytes mediates protection against viral encephalomyelitis and regulates IFN-γ-dependent responses. J. Virol. 2018;92 doi: 10.1128/JVI.01901-17. e01901-17. [DOI] [PMC free article] [PubMed] [Google Scholar]
- John C.C., Carabin H., Montano S.M., Bangirana P., Zunt J.R., Peterson P.K. Global research priorities for infections that affect the nervous system. Nature. 2015;527:S178–S186. doi: 10.1038/nature16033. [DOI] [PMC free article] [PubMed] [Google Scholar]
- Kalinke U., Bechmann I., Detje C.N. Host strategies against virus entry via the olfactory system. Virulence. 2011;2:367–370. doi: 10.4161/viru.2.4.16138. [DOI] [PubMed] [Google Scholar]
- Kamphuis E., Junt T., Waibler Z., Forster R., Kalinke U. Type I interferons directly regulate lymphocyte recirculation and cause transient blood lymphopenia. Blood. 2006;108:3253–3261. doi: 10.1182/blood-2006-06-027599. [DOI] [PubMed] [Google Scholar]
- Kierdorf K., Erny D., Goldmann T., Sander V., Schulz C., Perdiguero E.G., Wieghofer P., Heinrich A., Riemke P., Hölscher C. Microglia emerge from erythromyeloid precursors via Pu.1- and Irf8-dependent pathways. Nat. Neurosci. 2013;16:273–280. doi: 10.1038/nn.3318. [DOI] [PubMed] [Google Scholar]
- Koyuncu O.O., Hogue I.B., Enquist L.W. Virus infections in the nervous system. Cell Host Microbe. 2013;13:379–393. doi: 10.1016/j.chom.2013.03.010. [DOI] [PMC free article] [PubMed] [Google Scholar]
- Longair M.H., Baker D.A., Armstrong J.D. Simple Neurite Tracer: open source software for reconstruction, visualization and analysis of neuronal processes. Bioinformatics. 2011;27:2453–2454. doi: 10.1093/bioinformatics/btr390. [DOI] [PubMed] [Google Scholar]
- Love M.I., Huber W., Anders S. Moderated estimation of fold change and dispersion for RNA-seq data with DESeq2. Genome Biol. 2014;15:550. doi: 10.1186/s13059-014-0550-8. [DOI] [PMC free article] [PubMed] [Google Scholar]
- Lückoff A., Caramoy A., Scholz R., Prinz M., Kalinke U., Langmann T. Interferon-beta signaling in retinal mononuclear phagocytes attenuates pathological neovascularization. EMBO Mol. Med. 2016;8:670–678. doi: 10.15252/emmm.201505994. [DOI] [PMC free article] [PubMed] [Google Scholar]
- Lundh B., Kristensson K., Norrby E. Selective infections of olfactory and respiratory epithelium by vesicular stomatitis and Sendai viruses. Neuropathol. Appl. Neurobiol. 1987;13:111–122. doi: 10.1111/j.1365-2990.1987.tb00175.x. [DOI] [PubMed] [Google Scholar]
- Madisen L., Zwingman T.A., Sunkin S.M., Oh S.W., Zariwala H.A., Gu H., Ng L.L., Palmiter R.D., Hawrylycz M.J., Jones A.R. A robust and high-throughput Cre reporting and characterization system for the whole mouse brain. Nat. Neurosci. 2010;13:133–140. doi: 10.1038/nn.2467. [DOI] [PMC free article] [PubMed] [Google Scholar]
- Mrdjen D., Pavlovic A., Hartmann F.J., Schreiner B., Utz S.G., Leung B.P., Lelios I., Heppner F.L., Kipnis J., Merkler D. High-dimensional single-cell mapping of central nervous system immune cells reveals distinct myeloid subsets in health, aging, and disease. Immunity. 2018;48:380–395.e6. doi: 10.1016/j.immuni.2018.01.011. [DOI] [PubMed] [Google Scholar]
- Müller U., Steinhoff U., Reis L.F., Hemmi S., Pavlovic J., Zinkernagel R.M., Aguet M. Functional role of type I and type II interferons in antiviral defense. Science. 1994;264:1918–1921. doi: 10.1126/science.8009221. [DOI] [PubMed] [Google Scholar]
- Nayak D., Johnson K.R., Heydari S., Roth T.L., Zinselmeyer B.H., McGavern D.B. Type I interferon programs innate myeloid dynamics and gene expression in the virally infected nervous system. PLoS Pathog. 2013;9:e1003395. doi: 10.1371/journal.ppat.1003395. [DOI] [PMC free article] [PubMed] [Google Scholar]
- Nayak D., Roth T.L., McGavern D.B. Microglia development and function. Annu. Rev. Immunol. 2014;32:367–402. doi: 10.1146/annurev-immunol-032713-120240. [DOI] [PMC free article] [PubMed] [Google Scholar]
- Pfefferkorn C., Kallfass C., Lienenklaus S., Spanier J., Kalinke U., Rieder M., Conzelmann K.K., Michiels T., Staeheli P. Abortively infected astrocytes appear to represent the main source of interferon beta in the virus-infected brain. J. Virol. 2015;90:2031–2038. doi: 10.1128/JVI.02979-15. [DOI] [PMC free article] [PubMed] [Google Scholar]
- Preibisch S., Saalfeld S., Tomancak P. Globally optimal stitching of tiled 3D microscopic image acquisitions. Bioinformatics. 2009;25:1463–1465. doi: 10.1093/bioinformatics/btp184. [DOI] [PMC free article] [PubMed] [Google Scholar]
- Prinz M., Priller J. Microglia and brain macrophages in the molecular age: from origin to neuropsychiatric disease. Nat. Rev. Neurosci. 2014;15:300–312. doi: 10.1038/nrn3722. [DOI] [PubMed] [Google Scholar]
- Prinz M., Schmidt H., Mildner A., Knobeloch K.P., Hanisch U.K., Raasch J., Merkler D., Detje C., Gutcher I., Mages J. Distinct and nonredundant in vivo functions of IFNAR on myeloid cells limit autoimmunity in the central nervous system. Immunity. 2008;28:675–686. doi: 10.1016/j.immuni.2008.03.011. [DOI] [PubMed] [Google Scholar]
- Pyonteck S.M., Akkari L., Schuhmacher A.J., Bowman R.L., Sevenich L., Quail D.F., Olson O.C., Quick M.L., Huse J.T., Teijeiro V. CSF-1R inhibition alters macrophage polarization and blocks glioma progression. Nat. Med. 2013;19:1264–1272. doi: 10.1038/nm.3337. [DOI] [PMC free article] [PubMed] [Google Scholar]
- Ransohoff R.M., Cardona A.E. The myeloid cells of the central nervous system parenchyma. Nature. 2010;468:253–262. doi: 10.1038/nature09615. [DOI] [PubMed] [Google Scholar]
- Reiss C.S., Plakhov I.V., Komatsu T. Viral replication in olfactory receptor neurons and entry into the olfactory bulb and brain. Ann. N Y Acad. Sci. 1998;855:751–761. doi: 10.1111/j.1749-6632.1998.tb10655.x. [DOI] [PubMed] [Google Scholar]
- Sadek J.R., Pergam S.A., Harrington J.A., Echevarria L.A., Davis L.E., Goade D., Harnar J., Nofchissey R.A., Sewell C.M., Ettestad P., Haaland K.Y. Persistent neuropsychological impairment associated with West Nile virus infection. J. Clin. Exp. Neuropsychol. 2010;32:81–87. doi: 10.1080/13803390902881918. [DOI] [PubMed] [Google Scholar]
- Schulz C., Gomez Perdiguero E., Chorro L., Szabo-Rogers H., Cagnard N., Kierdorf K., Prinz M., Wu B., Jacobsen S.E., Pollard J.W. A lineage of myeloid cells independent of Myb and hematopoietic stem cells. Science. 2012;336:86–90. doi: 10.1126/science.1219179. [DOI] [PubMed] [Google Scholar]
- Seitz S., Clarke P., Tyler K.L. Pharmacologic depletion of microglia increases viral load in the brain and enhances mortality in murine models of Flavivirus-induced encephalitis. J. Virol. 2018;92 doi: 10.1128/JVI.00525-18. e00525-18. [DOI] [PMC free article] [PubMed] [Google Scholar]
- Skripuletz T., Salinas Tejedor L., Prajeeth C.K., Hansmann F., Chhatbar C., Kucman V., Zhang N., Raddatz B.B., Detje C.N., Sühs K.W. The antiviral drug ganciclovir does not inhibit microglial proliferation and activation. Sci. Rep. 2015;5:14935. doi: 10.1038/srep14935. [DOI] [PMC free article] [PubMed] [Google Scholar]
- Srinivas S., Watanabe T., Lin C.S., William C.M., Tanabe Y., Jessell T.M., Costantini F. Cre reporter strains produced by targeted insertion of EYFP and ECFP into the ROSA26 locus. BMC Dev. Biol. 2001;1:4. doi: 10.1186/1471-213X-1-4. [DOI] [PMC free article] [PubMed] [Google Scholar]
- Steel C.D., Hahto S.M., Ciavarra R.P. Peripheral dendritic cells are essential for both the innate and adaptive antiviral immune responses in the central nervous system. Virology. 2009;387:117–126. doi: 10.1016/j.virol.2009.01.032. [DOI] [PMC free article] [PubMed] [Google Scholar]
- Susaki E.A., Tainaka K., Perrin D., Yukinaga H., Kuno A., Ueda H.R. Advanced CUBIC protocols for whole-brain and whole-body clearing and imaging. Nat. Protoc. 2015;10:1709–1727. doi: 10.1038/nprot.2015.085. [DOI] [PubMed] [Google Scholar]
- Tronche F., Kellendonk C., Kretz O., Gass P., Anlag K., Orban P.C., Bock R., Klein R., Schütz G. Disruption of the glucocorticoid receptor gene in the nervous system results in reduced anxiety. Nat. Genet. 1999;23:99–103. doi: 10.1038/12703. [DOI] [PubMed] [Google Scholar]
- van Riel D., Verdijk R., Kuiken T. The olfactory nerve: a shortcut for influenza and other viral diseases into the central nervous system. J. Pathol. 2015;235:277–287. doi: 10.1002/path.4461. [DOI] [PubMed] [Google Scholar]
- Vasek M.J., Garber C., Dorsey D., Durrant D.M., Bollman B., Soung A., Yu J., Perez-Torres C., Frouin A., Wilton D.K. A complement-microglial axis drives synapse loss during virus-induced memory impairment. Nature. 2016;534:538–543. doi: 10.1038/nature18283. [DOI] [PMC free article] [PubMed] [Google Scholar]
- Wheeler D.L., Sariol A., Meyerholz D.K., Perlman S. Microglia are required for protection against lethal coronavirus encephalitis in mice. J. Clin. Invest. 2018;128:931–943. doi: 10.1172/JCI97229. [DOI] [PMC free article] [PubMed] [Google Scholar]
- Yamasaki R., Lu H., Butovsky O., Ohno N., Rietsch A.M., Cialic R., Wu P.M., Doykan C.E., Lin J., Cotleur A.C. Differential roles of microglia and monocytes in the inflamed central nervous system. J. Exp. Med. 2014;211:1533–1549. doi: 10.1084/jem.20132477. [DOI] [PMC free article] [PubMed] [Google Scholar]
- Zhu Y., Romero M.I., Ghosh P., Ye Z., Charnay P., Rushing E.J., Marth J.D., Parada L.F. Ablation of NF1 function in neurons induces abnormal development of cerebral cortex and reactive gliosis in the brain. Genes Dev. 2001;15:859–876. doi: 10.1101/gad.862101. [DOI] [PMC free article] [PubMed] [Google Scholar]
Associated Data
This section collects any data citations, data availability statements, or supplementary materials included in this article.
Supplementary Materials
Tissue clearance and light-sheet fluorescence microscopy were used to three-dimensionally image the entire unsectioned olfactory bulb from tamoxifen treated CX3CR1-cre-ER+/−td-tomatoSt/Wt animals on day 6 after PBS treatment or VSV-eGFP instillation. Red channel shows the long-lived CNS resident myeloid cells such as microglia.
Data Availability Statement
The RNA-seq data generated in this paper have been deposited in the NCBI Gene Expression Omnibus and are accessible through GEO Series accession number GSE110188 (https://www.ncbi.nlm.nih.gov/geo/query/acc.cgi?acc=GSE110188).