

Highlights
-
•
Risk assessment for entry of zoonotic bat-borne viruses into the European Union.
-
•
Comparison of relative risk of incursion of five viruses by four routes.
-
•
An Ebola outbreak similar to 2013–2016 posed the highest risk of introduction.
-
•
Relative risk to countries varied due to extent of global trade and human travel.
-
•
Model provides a horizon scanning tool for use when available data is limited.
Abstract
This paper presents a quantitative assessment model for the risk of entry of zoonotic bat-borne viruses into the European Union (EU). The model considers four routes of introduction: human travel, legal trade of products, live animal imports and illegal import of bushmeat and was applied to five virus outbreak scenarios. Two scenarios were considered for Zaire ebolavirus (wEBOV, cEBOV) and other scenarios for Hendra virus, Marburg virus (MARV) and Middle East Respiratory Syndrome Coronavirus (MERS-CoV). The use of the same framework and generic data sources for all EU Member States (MS) allows for a relative comparison of the probability of virus introduction and of the importance of the routes of introduction among MSs.
According to the model wEBOV posed the highest risk of an introduction event within the EU, followed by MARV and MERS-CoV. However, the main route of introduction differed, with wEBOV and MERS-CoV most likely through human travel and MARV through legal trade of foodstuffs. The relative risks to EU MSs as entry points also varied between outbreak scenarios, highlighting the heterogeneity in global trade and travel to the EU MSs. The model has the capability to allow for a continual updating of the risk estimate using new data as, and when, it becomes available.
The model provides an horizon scanning tool for use when available data are limited and, therefore, the absolute risk estimates often have high uncertainty. Sensitivity analysis suggested virus prevalence in bats has a large influence on the results; a 90% reduction in prevalence reduced the risk of introduction considerably and resulted in the relative ranking of MARV falling below that for MERS-CoV, due to this parameter disproportionately affecting the risk of introduction from the trade route over human travel.
1. Introduction
Bats are natural reservoir hosts for many viruses which are recognised as serious potential threats to human and/or animal health (Calisher et al., 2006). The bat-borne viruses emerging in the African, Asian and Australian continents have come to the fore more recently with regards to their threat to human health and pandemic potential. Since 2003 there have been a number of large-scale human outbreaks of bat-borne diseases e.g. Zaire ebolavirus (EBOV) and Severe Acute Respiratory Syndrome (SARS) in Western Africa and Asia respectively, whilst a significant number of human cases of Nipah virus (NiV) are reported in Bangladesh every year (IEDCR, 2014). Pteropid bats are known to be the natural host of Hendra virus (HeV) (Halpin et al., 2000), a member of the same genus (Henipavirus) as Nipah virus. Since 1994 HeV has been responsible for seven human cases in Australia, four of which were fatal (Smith et al., 2016). Bats have also been linked with Marburg virus (MARV) (Towner et al., 2007), and, more tenuously, with the emerging Middle East Respiratory Syndrome Coronavirus (MERS-CoV) (Memish et al., 2013). Within the European Union (EU), zoonotic incidents of bat-borne viruses have been restricted to European bat lyssavirus types 1 and 2 which have been responsible for less than 10 human cases since 1977 (Fooks et al., 2003). To date, there have only been a few isolated reports of introduction of bat-borne viruses (e.g. MARV, SARS, MERS-CoV) from outside the EU mainly through entry of infected humans (Puzelli et al., 2013, Desenclos et al., 2004, WHO 2008, Reuss et al., 2014). However, these incidents illustrate that introduction can occur and support the need for some level of surveillance activity to assess the probability of when and where further incursions may take place.
For most bat-borne zoonotic diseases, primary transmission routes for human infection include direct or indirect contact with bat bodily fluids (Leroy et al., 2009, Luby et al., 2006), or via intermediate animal hosts (Parashar et al., 2000, Hanna et al., 2006). Onward transmission of disease is then possible via human-to-human contact or contact with contaminated fomites or the environment, with nosocomial infections being particularly important in some instances (Baron et al., 1983, Chowell et al., 2014). Disease introduction into the EU could therefore potentially occur from a number of routes, including human travel, illegal and legal importation of food products and transport of live animals. These routes have previously been associated with incursion of other viruses into the EU. For example, human travel and immigration are thought to be the primary reasons why individual Member States (MSs) have a high prevalence of the same Human Immunodeficiency Virus (HIV) subtypes as their historical African colonies (Faria et al., 2012). Classical rabies has been detected in imported domestic pets (Suárez-Rodríguez et al., 2013, McQuiston et al., 2008) and avian influenza (H5N1 type A) has been detected in illegal imports of Crested Hawk Eagles from Thailand into Belgium (Van Borm et al., 2005). In the case of trade, illegal importation of food products has been a suggested route of origin for the foot and mouth disease epidemic in the UK in 2001 (Defra, 2001), whilst legal trade in fresh produce, such as fruit and vegetables, has been associated with norovirus (Hjertqvist et al., 2006) and hepatitis A outbreaks (Dentinger et al., 2001). Virus specific transmission characteristics may influence the relative importance of these potential routes of disease introduction.
In terms of government financial resource allocation, it is important to develop methods to assist in efficient targeting of surveillance activities e.g. to inform which pathogen(s) are most likely to enter the EU, where they are most likely to enter and what scenarios would have the most impact with regards to human or animal health and welfare or trade implications. To address these issues, a number of relative risk ranking tools have previously been developed, such as the EU wide DISCONTOOLS (2016) and the UK specific D2R2 (Gibbens et al., 2016). However, these tools are qualitative and are generally based on chosen criteria rather than a defined quantitative assessment. There is, therefore, benefit in a quantitative model that can utilises freely available numerical data from datasets on trade and human travel such as Eurostat (2014) and FaoStat (2014).
To address this need, a generic quantitative risk assessment framework for the entry of bat-borne zoonotic viruses to the EU was developed (Simons et al., 2016), considering the pathways: human travel, live animal movement, legal trade of food products and illegal trade of bushmeat. Using current knowledge of virus characteristics such as environmental survival and host incubation periods, the framework was parameterised for NiV, to provide an assessment of the relative risks of transmission through the known pathways of introduction into the EU. In this paper the model framework is parameterised for a number of other virus outbreak scenarios (MARV, EBOV, HeV and MERS-CoV) and the relative probabilities of introduction to EU MSs are compared and discussed. The impact of uncertainty in the parameter estimates is also investigated though scenario analyses.
2. Materials & methods
2.1. Overview
The entry assessment model parameterised for NiV (Simons et al., 2016), was re-parameterised for five outbreak scenarios (MARV, EBOV, HeV and MERS-CoV), to compare and assess the relative risk of introduction to the 28 EU MSs for these 5 viruses of concern. For EBOV two different outbreak scenarios were considered: 1) Disease geographically distributed in Western Africa, where the human cases are on a similar scale to that observed in the 2014 West Africa outbreak (wEBOV) (i.e. epidemic situation), 2) Disease geographically distributed in Central Africa, where human outbreaks have previously been relatively limited (cEBOV) (i.e. non-epidemic situation). It is acknowledged that the link between bats and MERS-CoV is more tenuous than initially thought when it first emerged (Memish et al., 2013), but the virus was included here to provide an example of a respiratory coronavirus circulating within the Middle East area. Recent evidence of replication and shedding of MERS-CoV in experimentally infected Jamaican fruit bats (Artibeus jamaicensis) (Munster et al., 2016) and discovery of closely related MERS-like CoV (Anthony et al., 2017) further support the hypothesis that bats are ancestral reservoirs for MERS-CoV. As neither live EBOV nor MERS-CoV virus has been isolated from bats a very low prevalence of infection in bats was assumed. Different prevalence values for all the viruses were considered in the scenario analysis.
The assessment was conducted following the World Organisation for Animal Health (OIE) code for import risk analysis (OIE, 2004). Under traditional OIE guidelines, there are three components of risk assessment: entry, exposure and consequence. This model only considered the entry assessment (i.e. it ceases at the point at which virus is released into the EU) and did not consider subsequent potential exposure of the virus to humans, livestock or wildlife on entry to the EU.
2.2. Model framework
The model has been discussed in detail by Simons et al. (2016). Briefly, the main outputs of the model were a relative estimate of the annual probability of at least one introduction event into each EU MS, j, PV(j), and an overall estimate of the probability of at least one introduction event for the EU as a whole. This estimate took into account factors such as the probability an individual unit is infected (or contaminated) in the exporting country, the survival of the virus over the duration of the journey, whether or not the animal/human displays clinical signs and the annual volume of products being imported. The model equations for the various routes are described by Simons et al. (2016). The model was coded in the R software package and is deterministic; as such no stochastic variability of specific parameters was considered in the baseline model.
The relative risk estimate was derived by combining the probability of at least one introduction event from each of the routes included in the model (Fig. 1 ) from all the potential exporting countries to produce an overall probability for each MS:
| (1) |
where R is the total number of routes considered for the virus (human travel (r = 1), live animal movement (r = 2), legal trade of ‘at risk’ products (r = 3), illegal trade of bushmeat (r = 4)) and Pr(j) is the probability of at least one introduction event via route r to MS j per year. The average number of years to an introduction event was calculated, YV(j) = 1/PV(j). In addition the 28 EU MSs were ranked according to their probability of disease introduction, ZV(j) = {1:28} by comparing the average number of years, YV(j), to an introduction event for each route and MS and ranking the MSs from 1 to 28 accordingly. This provided an indication of where in the EU an introduction event is more likely. Note that the average number of years to an introduction event is based on the input data provided and so does not account for subsequent changes in future years of model factors such as trade patterns or disease prevalence; e.g. for wEBOV it would be assumed that the same number of cases will occur in Western Africa every year as in 2014.
Fig. 1.

Overview of model framework up to the point of entry to the EU.
The model considered the four primary routes of introduction based on extensive literature reviews (Simons et al., 2014). While other potential routes exist such as direct exposure from bats through natural migration or accidental exposure via aeroplane strikes, they were not considered here for the viruses of concern. However, as the model framework is adaptable, and Eq. (1) is multiplicative with respect to the routes, the choice of routes can be amended and these pathways can be considered in the future, as and when appropriate data become available.
2.3. Parameterisation for individual viruses
The model was parameterised for HeV, MARV, MERS-CoV, wEBOV and cEBOV. The genus Ebolavirus includes five species, each with a single member virus (Kuhn et al., 2013). Due to the potential differences in parameters for the different viruses only Ebola virus (from species Zaire ebolavirus) was parameterised here.
The model considered the probability of introduction to EU MSs from ‘exporting countries’, that is, those in which virus was strongly expected to be circulating in humans, livestock or wildlife (Fig. 2 ). This was determined from peer-reviewed publications of where the viruses had been reported. For livestock and wildlife, including bats, only positive test results for isolation of live virus or detection of viral RNA were considered (active bat infection). Countries that had reported positive seroprevalence or those which had reported a human case known to have arisen from recent travel to another country were not considered as an ‘exporting country’.
Fig. 2.

Maps highlighting the exporting countries used in the model for each virus under consideration: NiV (Bangladesh, India, Malaysia, Singapore, Cambodia, East Timor, Indonesia, Thailand); HeV (Australia); MARV (Uganda, Angola, Democratic Republic of Congo, Gabon, Kenya); MERS (Saudi Arabia, United Arab Emirates, Qatar, Jordan, Oman, Kuwait, Iran, Lebanon); wEBOV (Sierra Leone, Liberia, Guinea); cEBOV (Democratic Republic of Congo, Gabon, Republic of Congo).
The full details of the generic model parameters are presented in Simons et al. (2016). In this section an overview of the data sources used to parameterise each route is presented.
Human travel: Passenger travel data from exporting countries to EU MSs were obtained from the Eurostat dataset aviapaexcc (Eurostat, 2014). For EBOV, MARV and HeV for which outbreaks are sporadic, nHinf(k) was estimated using the average number of cases per outbreak over a 15 year period. This value was assumed by the authors to encompass all relevant historical data. However, as human cases of MERS-CoV have been reported regularly since March 2012, nHinf(k) was calculated by dividing the number of reported cases by the number of reporting years assuming a constant rate per year. To account for differences in prevalence between passenger types e.g. business, visiting family, and tourist etc., the baseline prevalence of infection in the exporting country was weighted by the average passenger duration of stay (days) in the exporting country. The ratio of passenger types was assumed to be the same for each exporting country. The sub-clinically infected population was estimated by multiplying the prevalence of infection in passenger type i, θ(i,k) by the incubation period of the virus. Passenger detail such as healthcare employees potentially exposed to infected patients or eco-tourists with the intention of visiting bat caves was not accounted for here although it is acknowledged that these factors could influence the risk outcome as has been documented (WHO, 2008).
Legal trade: To determine whether a product was considered contaminated, the concentration of virus on the product on arrival to an EU MS was estimated where Cmin is a threshold viral load upon arrival at the EU MS, below which the product was considered not to be contaminated. Note, that this value was set to 1 log10 TCID50 for all viruses as a worst case scenario. The model considered the prevalence of contamination in at risk raw products (see Table 1 for definition), the initial concentration of virus on a raw product in the exporting country and any reduction in viral load between initial contamination of the raw product and arrival in the EU MS, including the effect of processing. The default estimate for the prevalence of contamination in raw products, pGraw(k), was based on the estimated prevalence of active virus shedding in bats, pBInf(k), the contact rate of the bat with the product, pBcontact(k) and seasonality of virus shedding, i.e. the proportion of the year that bats can shed the virus. Data on volume of trade from exporting countries to EU MSs were obtained from FaoStat (2014).
Table 1.
Summary of virus specific parameter estimates for NiV, HeV, MARV, MERS-CoV and EBOV viruses (see Appendix A for further information and references).
| Parameter | Values |
||||
|---|---|---|---|---|---|
| Description | NiV | HeV | MARV | MERS-CoV | EBOV |
| Exporting countries with evidence of virus in human, livestock or wildlife (k) | Bangladesh, India, Malaysia, Singapore, Cambodia, East Timor, Indonesia, Thailand | Australia | Uganda, Angola, Democratic Republic of Congo, Gabon, Kenya | Saudi Arabia, United Arab Emirates, Qatar, Jordan, Oman, Kuwait, Iran, Lebanon | wEBOV (Sierra Leone, Liberia, Guinea) cEBOV(Democratic Republic of Congo, Gabon, Republic of Congo) |
| Estimated number of human infections in exporting country k, in one year, nHinf(k) for the scenario | Bangladesh = 27, India = 66, all other countries = 0 | Australia = 1 (‘rounded up’) | DRC = 154, Uganda = 8, Angola = 374, all other countries = 0 | Saudi Arabia = 340, UAE = 24, Jordan = 6, Qatar = 4, Oman = 2, all other countries = 0 | West Africa = 16,125, DRC = 75, Gabon = 65, ROC = 79 |
| Average time to clinical symptoms of the virus (days), TIP(k) | 9 | 12.8 | 7 | 5.5 | 8.82 |
| Legal Trade – of at risk products | FaoStat section 8-fruits and derived productsa; pig and pig products | FaoStat section 8-fruits and derived productsa | FaoStat section 8-fruits and derived productsa | FaoStat section 8-fruits and derived productsa; camel meat and milk | As for NiV |
| Prevalence of active bat infection in exporting country k, PBInf(k) | 0.20% | 0.47% | 0.29% | 0.10% | 0.10% |
| Proportion of the year bats may shed active virus, Pseason(k) | 0.33 | 0.33 | 0.5 | 0.33 | 0.5 |
| Initial viral load on product, C0(x)∼logNormal(a,b) | Mean = 2 log10 TCID50/ml, Variance = 2.25 log10 TCID50/ml |
Mean = 4.6 log10 TCID50/ml Variance = 1 log10 TCID50/ml |
Mean = 3.12 log10 TCID50/ml Variance = 1 log10 TCID50/ml |
Mean = 5 log10 TCID50 eq/ml Variance = 1 log10 TCID50/ml |
Mean = 3 log10 TCID50/ml Variance = 1 log10 TCID50/ml |
| Half-life of virus in environment, pre-harvesting (h), CHLenv(k,l) | 6.15 | 2.9 | 72 | 0.77 | 72 |
| Half-life of virus during transport (4 °C) (h), CHLtrans(j,k,l,m) | 308 | 268 | 144 | 72 | 168 |
| Minimum Viral load to consider product contaminated in EU MS, Cmin | 1 log10 TCID50 | 1 log10 TCID50 | 1 log10 TCID50 | 1 log10 TCID50 | 1 log10 TCID50 |
| Live animals: animal species with evidence of infection including serology s | Non-human primate, pig, dog, cat, ferret | Pig, dog, cat, horse | Non-human primate | Dromedary camel | Non-human primate, pig, dog, duiker, rodent, shrew, |
| Probability bushmeat is of species s, pBMSp(s) | 1.5% Bats, 98.5% other species | 1.5% Bats, 98.5% other species | 1.5% Bats, 6% nonhuman primates, 92.5% other species | 1.5% Bats, 98.5% other species (red meat could = camel from Middle East) | 1.5% Bats, 6% nonhuman primates, 75% rodents and duikers, 17.5% other species |
FAO fruits and derived products see: http://www.fao.org/es/faodef/fdef08e.htm for definition and classification of commodities.
Bushmeat: In this model bushmeat was assumed to enter an EU MS via aircraft passenger luggage. The volume of contaminated bushmeat entering the EU was estimated by combining the probability of a passenger of type i bringing in bushmeat from exporting country k, pBM(i,j,k), and the probability that a consignment of bushmeat was contaminated. The actual number of bushmeat consignments entering the EU from country k was estimated based on the number of bushmeat consignments seized in the EU MS, Nseized(i,j,k), and an under-reporting factor accounting for the proportion of passengers luggage that were searched. The under-reporting factor was estimated to be 0.5% based on literature (Falk et al., 2013) and assuming targeted testing of passengers occurs (Simons et al., 2016).The model did not account for any virus reduction that may occur from processing bushmeat such as smoking or salting and assumed that the possibility of luggage being searched for bushmeat was the same for each exporting country.
Live animals: This route considered the number of animals of species s arriving from an exporting country k in one year and the prevalence of live animal infection of species s in the exporting country to give the probability that at least one infected animal entered a MS. Numbers of live animal exports from exporting countries to EU MSs were obtained from the trans-European TRAde Control and Expert System (TRACES) database which provides data on the number of animals that are brought into the EU and issued with a Common Veterinary Entry Document (TRACES, 2014).
Virus specific parameter estimates used in the model are given in Table 1. Estimates for NiV are also provided for comparison (Simons et al., 2016). Further information (including references) on these estimates is provided in Appendix A.
The model developed here is deterministic for ease of use in an outbreak situation where rapid parameterisation and data availability for all EU MSs are key requirements. Uncertainty and variability in the model were previously considered for NiV by implementing a series of analyses using alternative parameter values (Simons et al., 2016). It was found that while some scenarios had an impact on the absolute values of probability of introduction of NiV, the relative rankings, of both routes and MSs were more robust. However, the estimate for the prevalence of NiV in bats had considerable impact on the average number of years to an EU introduction of NiV relative to the baseline model and much lower estimates for this prevalence were the only scenarios to have an impact on the relative ranking between the routes. Given this, and the complexity involved in assessing multiple uncertainties between multiple scenarios, the scenarios considered here were a 90% and 99% reduction in the virus prevalence in bats as these reductions both had considerable impact in the previous model for NiV; smaller reductions in virus prevalence had little impact.
3. Results
At the EU level the probability of viral introduction was ranked highest for wEBOV with an overall average prediction of at least one introduction event occurring in one year (Table 2 ), primarily via human travel and associated illegal importation of bushmeat.
Table 2.
The expected number of years to EU entry for different viruses, by individual route and all routes combined for the baseline model. Results for 90% and 99% reduction in virus prevalence in bats are shown in brackets respectively for Legal Trade, Bushmeat and all routes (the model assumes no effect on human travel and live animal routes).
| Scenario | Human travel | Legal trade | Bushmeat | Live animals | All routes |
|---|---|---|---|---|---|
| NiV | 540 | 12 (115, 1147) | 70 (682, 5915) | 51,649 | 10 (83, 344) |
| HeV | 3202 | 45 (441, 4403) | 123 | 39,299 | 33 |
| (1220, 11,546) | (292, 1535) | ||||
| MARV | 18 | 3 (25, 242) | 5 (25, 44) | 295,015 | 2 (8, 12) |
| MERS-CoV | 4 | 8.00E+11 | 191 (681, 917) | N/Aa | 4 (4, 4) |
| (7.1e12, 2.9e13) | |||||
| wEBOV | 1 | 6 (58, 578) | 3 (3, 3) | 923 | 1 (1, 1) |
| cEBOV | 19 | 240 | 37 (60, 64) | 8259 | 12 (14, 15) |
| (2397, 23,962) |
The model returned a N/A results due to the probability of introduction being too low to compute.
In relative terms, and given the uncertainties in the absolute value estimates, MARV and MERS-CoV were of a comparable risk whilst the overall probability of introduction was lowest for HeV.
A 90% or 99% reduction in virus prevalence in the exporting country bat population only affected the risk estimates for the legal trade and bushmeat routes. Consequently, for EBOV and MERS-CoV, which had a relatively high probability of introduction from human travel, the decrease in risk from trade and bushmeat was not sufficient to affect the overall probability of disease introduction. For HeV and NiV, however, where the legal trade and bushmeat routes posed the highest risk in the baseline model the decrease in overall risk was substantial. Human travel replaced legal trade and bushmeat as the route with the highest associated probability for HeV, MARV and NiV introduction when the virus prevalence in bats was reduced by 99% (90% for MARV).
The number of imports of live animals was low for all exporting countries resulting in a relatively low probability of introduction via this route for all viruses (Table 2). Only dromedary camels (Camelus dromedaries) have been shown to be a risk factor for MERS-CoV transmission (Azhar et al., 2014), but as there is no legal trade of live camelids to the EU from countries reporting cases of MERS-CoV, the risk from live animals was considered to be negligible.
Within the EU, individual MSs demonstrated different relative probabilities for the various pathogens when the probabilities for all the routes of introduction were combined for each MS (Fig. 3 ). The probability of introduction for MERS-CoV was quite high across most of the EU MSs, but for other viruses it was mainly focussed in a few MSs, usually in Western Europe with the probability of introduction for MSs from Eastern Europe and Scandinavia generally being much lower (Fig. 3). Overall, the probability of introduction was highest for individual viruses in those MSs with strong historical links to relevant exporting countries, e.g. the United Kingdom (UK) for NiV and France for cEBOV. Such links usually correspond to a relatively large volume of human travel or legal trade movements between the countries. It should be noted that this analysis does not consider movement within the EU after the initial entry.
Fig. 3.

Average number of years until an introduction event to EU MSs for different viruses; clockwise from top left; NiV, HeV, MERS-CoV, cEBOV, wEBOV and MARV across all routes. Scale shows increasing number of years until an introduction event from left (dark red) to right (light green). (For interpretation of the references to colour in this figure legend, the reader is referred to the web version of this article.)
The countries are ranked according to the probability of introduction for each virus in Table 3 . Overall there was a relatively wide variation in the relative ranking of many of the MSs between the different viruses. Different distributions of risk scores were observed between routes but considering the relative ranking of the MSs (1–28), the UK, France, Germany and the Netherlands generally have the highest probability of introduction for all viruses considered here.
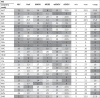
Table 3.
Relative ranking of EU MSs by expected number of years until entry of virus. Minimum, maximum and range in EU MS ranking across all viruses are shown. Columns are highlighted with lower ranking or smaller range in ranking of EU MS having darker grey shades.
 |
4. Discussion
The entry assessment described here shows the potential for application of a quantitative model framework for any pathogens, using zoonotic bat-borne viruses as an example. Although a scarcity of data for virus specific parameters resulted in a high degree of uncertainty in the absolute risk values presented, the main strengths of this model lie in the estimates of relative risks between routes of entry and those MSs which are at greater risk of virus introduction. The model has the capability to allow for a continual updating of the risk estimate using new research data as, and when, it becomes available. Any increase in the model risk estimate output would allow the stakeholder to consider employing suitable risk reduction strategies or heightened surveillance providing a rapid and cost-effective response.
Of particular value was the model's ability to illustrate the relative importance of the different routes of entry between viruses; legal trade of foodstuffs was more important for HeV, NiV and MARV while human travel was more important for MERS-CoV and both EBOV scenarios. These differences could be partly attributed to the virus specific parameters. For example rapid decay of MERS-CoV influenced the relative risk of the transmission pathways; the half-life of MERS-CoV is very short compared to the other viruses (48 min at pre-harvest temperatures (van Doremalen et al., 2013) so it is unlikely to persist in high numbers on any produce imported via legal trade or in contaminated bushmeat.
The probability of introduction to the EU via the pathways under consideration here varies across the EU at MS level; the UK, France, Germany and the Netherlands often had the highest probability of introduction for all viruses considered. In general those countries which ranked the highest, with regard to probability of introduction (Table 3) corresponded to those with the highest population and the highest ‘disposable income’ (calculated as gross domestic product (GDP) derived from purchasing power parity) (see Appendix B). Other contributory factors could include immigration population densities and trade partner characteristics, both of which frequently have a historical basis. The Netherlands was an exception to this in that it ranked highly in the probability of virus introduction yet only 8th for population density and 7th for GDP (See Appendix B). One explanation for this could be that the Netherlands is serving as a hub for travellers and trade entering the EU and that a reasonable proportion entering the Netherlands are going onto other European countries. It is also possible that more Dutch people, compared to other EU MSs, travel to countries with these viruses. Data from Uganda suggest that in 2012 the Netherlands was the 15th most popular country of origin for tourist arrivals, the only European countries with more arrivals were the United Kingdom and Germany, but Dutch tourists represented a higher proportion of their population (Republic of Uganda, 2013).
Freely available statistical data on trade and human travel for Western Europe were, in general, more complete than for Eastern European MSs. Data for countries such as Estonia, Latvia and Lithuania were lacking for some routes resulting in a low ranking for these countries which may not be a true reflection of the actual risk. It is difficult to determine whether this is a true data gap or if the route genuinely has a low probability of introduction for these countries. This was a particular problem for cEBOV where twelve countries were lacking data for specific routes and, therefore, equally ranked as 22.5.
The generic parameters for which EU wide datasets exist have a relatively high degree of completeness although there is a concern that potentially high risk low volume trade products e.g. camel milk may be under-recorded therefore underestimating the risk via these trade products. Virus specific parameters depend more upon focussed research studies and peer reviewed literature and rely upon detection of pathogens in reporting countries. Uncertainty in these virus parameters, in particular, the prevalence of infection in bats in the exporting country, and viral persistence during processing and storage may limit the application of the model by introducing considerable uncertainty. The sensitivity analysis of virus prevalence in bats demonstrated that the results for the relative importance of the routes for EBOV and MERS were quite robust with human travel remaining the route with the highest probability of introduction. With regards to HeV, NiV and MARV, however the sensitivity to the variation in prevalence indicates that further data for this particular parameter would strengthen the model results; this is particularly true of MARV where a 90% reduction in virus prevalence changed the risk ranking order of the routes of introduction. Note that this analysis is to consider the uncertainty about the true prevalence in bats, as such it has no impact on the parameterisation of the human prevalence, which is based on human outbreak data.
It should be noted that the parameterisation of this model uses the best available data at the current time. Some parameters are subject to high uncertainty and the probability of introduction of different viruses will be dynamic, changing over time if a virus spreads amongst different animal species populations or if new human outbreaks occur. Simons et al. previously demonstrated that changes in the exporting country (e.g. if China were to get NiV in the future) or ‘at risk’ product types can have a large effect on the model outputs (Simons et al., 2016). We have demonstrated here that changes in the virus prevalence in bats in the exporting country can have an impact on the average number of years to EU entry for the different viruses and on the relative ranking of the individual routes of entry. We have also highlighted the differences in probabilities for two Ebola scenarios; a relatively small non-epidemic human outbreak and a large epidemic scale outbreak. It is acknowledged that the viruses considered here could have differing sensitivity to stochastic variability of specific parameters given the complex dynamics between the routes and viruses. Alternative scenarios could, therefore, be considered in the future.
All risk pathways were given equal weight within the model as the model predicts probability of introduction not risk of human/animal exposure and consequence as stated in the OIE risk assessment (OIE, 2004). For example, the model results suggest that the legal trade (fruit) route has a high probability of introduction for HeV, although human infection from consumption of contaminated fruit is not a proven transmission route for this virus. This route was considered in the model based on the knowledge that fruit bats are known to consume raw fruit in orchards (Eby and Lunney, 2002) and date palm sap is a known route of transmission for NiV (another henipavirus) (Luby et al., 2006, Khan et al., 2012, Nahar et al., 2014). Similarly, there is currently no evidence of human-to-human transmission of HeV but as this has occurred for the Bangladesh strain of NiV (Gurley et al., 2007) it is plausible that this could occur with or without mutation and adaptation of currently identified strains. Real-time application of the model would allow for removal or addition of pathways if future scientific work provides suitable input data or if trade patterns between third countries and the EU alter. Thus, all pathways were assessed for completeness according to the dogma ‘absence of evidence is not evidence of absence’.
Whilst EU wide trade controls are implicitly accounted for within the model parameters, risk mitigation procedures put in place by individual MSs such as targeted sampling are not taken into account. It is possible that there have already been introduction events of the diseases under consideration here within the EU, but these have remained undetected due to lack of subsequent human/animal infection and/or onward transmission within the individual MS. For example, although the importation of MERS-CoV cases to the EU remains possible, an ECDC risk assessment determined that the risk of sustained human-to-human transmission is low (ECDC, 2015a). However, the outbreak of MERS-CoV in South Korea demonstrated that the potential exists for a serious risk of onward human spread, with >185 cases arising from the importation of 1 human index case (Su et al., 2015).
Validation of such a model presented here is difficult as there are few independent resources for which to compare the results. However, it is of relevance that the five MSs suggested to have the highest probability of introduction of MERS-CoV by the model (Germany, UK, Italy, France and the Netherlands) have already had imported human cases of this pathogen (ECDC, 2014). The model results are also consistent with other reports which predict more imported cases of MERS-CoV to arrive into the EU (ECDC 2014, WHO 2014a, Bialek et al., 2014, Poletto et al., 2014). All cases reported outside of the Middle East have had a recent travel history to the Middle East or contact with a case that had travelled from this region (Su et al., 2015). This is in line with the highest probability of introduction for MERS-CoV predicted by this model to be via human travel (Table 2).
Overall, the approach developed here provides a high-level horizon scanning tool for the probability of introduction of bat-borne zoonotic viruses into the EU. The virus scenario with the highest probability was the wEBOV scenario with an overall average prediction of just under one introduction event per year, primarily via human travel. Due to the wide scope of the model, which necessitated using global datasets sometimes with incomplete data, there was a high degree of uncertainty in the absolute risk values presented. A general lack of data on virus specific parameters also contributed to this uncertainty. Thus, the main strengths of this model lie in the comparison of the relative risks between viruses and routes of entry. Whilst there have been several risk assessments carried out for the introduction of individual pathogens into the EU (Rolin et al., 2013, Durand et al., 2013, Mur et al., 2014, Snary et al., 2012) this model was able to assess a range of viruses and could be adapted for other pathogens, as it has the advantage of easy access to a number of relevant databases. The model also allows for a continual updating of the risk estimate enabling the stakeholder to respond in a rapid and risk appropriate manner, for example, by implementing risk-based surveillance and control strategies.
Funding
This work was funded by the European Commission Seventh Framework Programme under ANTIGONE (Global Onset of Novel Epidemics) with project number 278976. Additional funding was provided by the UK Department for Environment, Food and Rural Affairs (Defra) under project SE4213.
Appendix A. Virus specific parameterisation
A.1. Ebola
A.1.1. Human travel
Number of human infections in exporting country, nHinf(k). Prior to 2014, human outbreaks of Ebola had been confined to the Sub-Saharan Congo rainforest basin with Uganda, Sudan, Gabon, Democratic Republic of Congo (DRC) and Republic of Congo (ROC) having the most frequent occurrence of infection; in total there had been ∼22 confirmed outbreaks resulting in fatal cases (Table A1 ). The beginning of 2014 saw the largest recorded outbreak of Ebola emerge in Western Africa with Sierra Leone, Liberia and Guinea being the countries most affected. Due to the potential differences in parameters for the different viruses only Ebola virus (from species Zaire ebolavirus), EBOV, is parameterised here. The number of cases per outbreak estimated over a 15 year period was used for nHinf(k).This is estimated at 16,125 for West Africa, 75 for the DRC, 65 for Gabon and 79 for ROC.
Table A1.
Historical review of EBOV outbreaks to the present day (as of November 2016).
| Date | Country | Number of cases | Number dead | Strain | Likely source | Exposure to: | Human-to human transmission? |
|---|---|---|---|---|---|---|---|
| 1972 | DRC (Zaire) | 2 | 1 | Zaire? | Retrospective identification from 1977 case | ||
| 1976 | DRC (Zaire) | 318 | 280 | Zaire | Index case had bought antelope and monkey bushmeat prior to infection | Infected needles, nosocomial infections | Not with ease |
| 1976 | Sudan | 284 | 151 | Sudan | Original cases in factory - not related to exposure to wild living animals | High number of nosocomial infections | Not with ease |
| 1977 | DRC (Zaire) | 1 | 1 | Zaire | No overt link to 1976 outbreak | 1 fatal case 3 unrelated and unconfirmed cases | |
| 1979 | Sudan | 34 | 22 | Sudan | Index case in same factory as 1976 | Not with ease | |
| 1980 | Kenya | 1 | 0 | Zaire | Near Mount Elgon | 13 yr old girl unknown source - no virus isolated but elevated Ab titre | No secondary transmission |
| 1989/90 | USA | 0 | 0 | Reston | Cynomolgus monkeys imported from Philippines | 4 animal handlers infected but no symptoms | |
| 1992 | Cote D'Ivoire | 0 | 0 | Cote D'Ivoire | Chimpanzee deaths in wild | ||
| 1992 | Italy | 0 | 0 | Reston | Cynomolgus monkeys imported from Philippines | ||
| 1994/95 | Cote D'Ivoire | 1 | 0 | Cote D'Ivoire | Chimpanzee deaths in wild and infection in human performing autopsy | ||
| 1994 | Gabon | 52 | 31 | Zaire | Exposure to dead Chimpanzee? | Deaths in various gold mining camps in rain forest | |
| 1995 | DRC | 315 | 254 | Zaire | Charcoal worker/farmer 1st case | Nosocomial infection and relatives | |
| 1996 | Gabon | 31 | 21 | Zaire | Dead chimpanzee in forest was eaten by hunters | 19 human cases directly infected | Family members |
| 1996 | Gabon | 60 | 45 | Zaire | Dead chimp found to also be infected | Hunter at logging camp | Yes |
| 1996 | South Africa | 2 | 1 | Zaire | Healthcare worker travelled from Gabon to S. Africa | Transmission to a nurse who died | |
| 1996 | USA | 0 | 0 | Reston | Cynomolgus monkeys imported from Philippines | ||
| 2000 | Uganda | 425 | 224 | Sudan | Index cases had attended burials prior to infection | Nosocomial infection high numbers | |
| 2001/2002 | Gabon | 65 | 53 | Zaire | Unusually high number of animals found dead in rainforest mainly NHP | Same outbreak over the border. Epidemiological evidence of 6 different introductions of Ebola virus each related to a hunting episode | At least 2 duikers,2 chimps and 2 gorilla carcasses were suspected of involvement in infection of 6 human index patients. |
| 2001/2002 | Republic of Congo | 59 | 44 | Zaire | Unusually high number of animals found dead in rainforest mainly NHP | Index cases reported contact with NHP, duikers and porcupines. Ebov was detected in gorilla carcass butchered by index case | At least 2 duikers,2 chimps and 2 gorilla carcasses were suspected of involvement in infection of 6 human index patients. |
| 2002/2003 | Republic of Congo | 143 | 128 | Gorillas and duikers suspected of infecting 3 human index patients. | |||
| 2003 | Republic of Congo | 35 | 29 | Poaching though source of infection not clearly identified | |||
| 2004 | Sudan | 17 | 7 | Sudan | Simultaneous outbreaks of measles | ||
| 2005 | DRC | 12 | 10 | Zaire | |||
| 2007 | DRC | 264 | 187 | Zaire | Preceded by massive fruit bat migration which was hunted by villagers | Putative index case bought freshly killed bats from hunters | |
| 2007/2008 | Uganda | 149 | 37 | Bundibugyo | |||
| 2008/2009 | DRC | 32 | 14 | Zaire | Index case believed to be girl who died from post-abortion haemorrhage | ||
| 2011 | Uganda | 1 | 1 | Sudan | |||
| 2012 | Uganda | 24 | 17 | Sudan | similar to 2000 | ||
| 2012 | DRC | 57 | 29 | Bundibugyo | Similar to 2007 | ||
| 2012/2013 | Uganda | 7 | 4 | Sudan | Similar to 2011 | ||
| 2014 | West Africa | 28,616 | 11,310 | Zaire | Hunting/child bitten by bat | Yes - high percentage of nosocomial transmission | |
| 2014 | DRC | 71 | 43 | Zaire | Preparation of bushmeat | Most closely related to 1995 strain |
Time to clinical signs, TIP(k). The recognised incubation period for EBOV disease is 2–21 days (Del Rio et al., 2014). A review of epidemiological parameters from Ebola outbreaks including incubation period has recently been published (Van Kerkhove et al., 2015). Using a sum of all the estimated means divided by the number of studies the time to clinical signs used is 8.82 for EBOV only (Table A2 ).
Table A2.
Adapted table from Van Kerkhove et al. (2015) showing estimated time to clinical signs during EBOV outbreaks.
| Year | Virus | Estimate | Range | Study number | Ref |
|---|---|---|---|---|---|
| 1976 | Zaire | 6.3 | 318 | (Commission, 1978) | |
| 1976 | Zaire | 5.99 | 5.8–6.18 | 262 | (Camacho et al., 2014) |
| 1995 | Zaire | 7 | 1–15 | 27 | (Dowell et al., 1999) |
| 1995 | Zaire | 6.2 | 5–8 | 5 | (Bwaka et al., 1999) |
| 1995 | Zaire | 5.3 | – | 315 | (Chowell et al., 2004) |
| 1995 | Zaire | 10 | – | 291 | (Lekone and Finkenstadt, 2006) |
| 1995 | Zaire | 12.7 | – | 23 | (Eichner et al., 2011) |
| 1995 | Zaire | 7.8 | 2–19 | 23 | (Ndambi et al., 1999) |
| 2000 | Sudan | 12 | 2–21 | 425 | (Okware et al., 2002) |
| 2000 | Sudan | 3.35 | – | 425 | (Chowell et al., 2004) |
| 2000–01 | Sudan | 12 | 1–12 | 425 | (Francesconi et al., 2003) |
| 2007 | Bundibugyo | 6.3 | – | 56 | (MacNeil et al., 2010) |
| 2007 | Bundibugyo | 7 | 2–20 | 192 | (Wamala et al., 2010) |
| 2014–15 | Zaire | 9.31 | 2–21 | 20 | (Althaus et al., 2015) |
| 2014–15 | Zaire | 9.4 | – | 500 | (Team, 2014) |
| 2014–15 | Zaire | 11.4 | – | 155 | (Team, 2014) |
| 2014–15 | Zaire | 9 | – | 1798 | (Team, 2015) |
| 2014–15 | Zaire | 9.9 | 9–11 | 193 | (Faye et al., 2015) |
| 2014–15 | Zaire | 12 | – | – | (Rivers et al., 2014) |
| 2014–15 | Zaire | 10 | – | – | (Rivers et al., 2014) |
| Total | All | 8.6 | |||
| Total | Zaire | 8.82 |
A.1.2. Legal trade import
Bat infection prevalence in exporting country, pBinf(k). Evidence of EBOV infection in bats (Epomops franqueti, Hypsignathus monstrosus, and Myonycteris torquata) is currently based on seroprevalence and presence of viral RNA.
Table A3 shows the relevant papers that have attempted isolation of EBOV. Combined, 1033 bats were tested with 0 testing positive for viral shedding of Ebola. As such the prevalence of EBOV in bats for this model was assumed to be 0.1%.
Table A3.
Detection of EBOV in bats.
| Positive bat species | Country | Sample taken | Test | Number tested | Number positive | Number shedding | Prevalence | Ref. |
|---|---|---|---|---|---|---|---|---|
| Unknown | DRC (Zaire) | Spleen, liver, kidney, heart | Virus isolation | 8 | 0 | 0 | 0 | (Germain, 1976) |
| Numerous | DRC | Liver, kidney and spleen/serum | Virus isolation and IFA | 463 | 0 | 0 | 0 | (Breman et al., 1999) |
| Unknown | DRC | Liver, spleen/Serum | Virus isolation/ELISA | 539 | 0 | 0 | 0 | (Leirs et al., 1999) |
| Epomops franqueti, Myonycteris torquata, Epomophorus gambianus, Micropteropus pusillus | CAR | Spleen, liver, kidney | RT-PCR (virus isolation only carried out on RT-PCR positive) | 23 | 0 | 0 | 0 | (Morvan et al., 1999) |
| Epomops franqueti, Hypsignathus monstrosus, Myonycteris torquata, | Gabon/ROC | Serum/liver & spleen | ELISA/RT-PCR | 679 | 16/13 | Not attempted | – | (Leroy et al., 2005) |
| Epomops franqueti, Hypsignathus monstrosus, Myonycteris torquata, | Gabon/Congo | Serum | IgG ELISA | 1390 | 40 | Not attempted | – | (Pourrut et al., 2007) |
| Epomops franqueti, Hypsignathus monstrosus, Myonycteris torquata, Micropteropus pusillus, Mops condylurus, Rousettus aegyptiacus | Gabon/Congo | Serum/liver & spleen | ELISA/ RT-PCR | 1468 | 95/0 | Not attempted | – | (Pourrut et al., 2009) |
| Eidolon helvum | Ghana | Serum | Indirect fluorescent + western blotting (insufficient material for RT-PCR) | 262 | 1 (Zaire) | Not attempted | – | (Hayman et al., 2010) |
| Epomops franqueti, Hypsignathus monstrosus, Epomophorus gambianus | Ghana | Serum | ELISA WB | 88 | 5 (Zaire) | Not attempted | – | (Hayman et al., 2012) |
| Various | China | Serum/pharyngeal & faecal swabs | ELISA/RT-PCR | 843/143 | 10/0 (Zaire) | Not attempted | – | (Yuan et al., 2012) |
| Rousettus leschenaultii, Cynopterus sp, Megaderma lyra, Macroglossus sobrinus | Bangladesh | Serum/throat, urine/faecal swab | ELISA WB/ RT-PCR | 273 | 5 (R. leschenaultii)by ELISA none by PCR | Not attempted | – | (Olival et al., 2013) |
Product types (l): The potential for EBOV to act as a foodborne pathogen has been addressed (Bausch, 2011). Parallels have been drawn between the emergence of the Reston strain of EBOV in domestic pigs in the Philippines in 2008 and the 1998–1999 outbreak of NiV in Malaysia and Singapore. Both imported fruit products and live pigs/pig products were therefore considered as potential risk factors for the introduction of EBOV into the EU.
Proportion of the year bats may shed active EBOV virus, pseason(k). Seasonal climate has been found to be associated with human EBOV outbreaks (Ng et al., 2014). Increased great ape mortality has frequently been reported during the dry seasons of July and December (Pourrut et al., 2007) and the biannual birthing periods of the bat species identified as potential natural reservoirs also occur during the dry seasons when fruit is scarce (Langevin and Barclay, 1990). In the absence of more definitive data the proportion of the year in which bats are presumed to be infectious is estimated as 0.5.
Initial viral load on raw product, c0(x). The initial concentration of EBOV on the raw product is assumed to be equivalent to that shed by bats. As there have been no successful virus isolation attempts from bats, values are extrapolated from experimental evidence. Nasal washes and oral and rectal swabs from pigs challenged via mucosal exposure with 1 × 10⁶ PFU of the Zaire strain of EBOV had infectious titres ranging from 1 × 10² to 1 × 10³ TCID50/ml (Kobinger et al., 2011). Infectivity of mucosal wash fluids obtained from monkeys experimentally infected with the Reston strain of EBOV ranged from <0.7 log10 PFU/ml at initial infection to a maximum of 2.9 log10 PFU/ml in terminal animals (Jahrling et al., 1996). Based on these data the initial viral load used here follows a log normal distribution with mean 3 log10 TCID50/ml (variance = 1 log10 TCID50/ml in the absence of any other data).
Virus decay in the environment and during transport, CHLenv(j,k), CHLtrans(j,k). In a study on the survival of filoviruses in liquids and on solid substrates the half-life of EBOV was calculated to range from 6.6 to 11.5 days at +4 °C in tissue culture media and sera respectively and 3 days at room temperature (Piercy et al., 2010). No virus could be recovered from any solid substrate stored at room temperature but at +4 °C the virus had a half-life of ∼5.5 days on glass and ∼7 days on plastic substrates. From the data available, a mean half-life of 7 days (168 h) is used as an estimate for virus reduction during transport at +4 °C and virus reduction pre-harvesting is estimated at 3 days (72 h) using liquid media data.
Minimum Viral load to consider product contaminated in EU MS, Cmin. Experimental infection of bats with the Zaire strain of EBOV was achieved with an inoculation dose of 104.6 FFU (fluorescent focus forming units) (Swanepoel et al., 1996). Non-human primates (NHP) have been shown to be uniformly susceptible to intramuscular inoculation of 1000 PFU of the Zaire strain of EBOV (Geisbert et al., 2003, Smith and Wang, 2013). However, doses as low as 50 PFU were sufficient to cause infection in Rhesus Macaques (Kortepeter et al., 2011) and 100 PFU of a guinea pig adapted strain of the virus was used to experimentally infect baboons (Ignatiev et al., 2000). Johnson and colleagues (Johnson et al., 1995) reported using a dose of 400 PFUs to infect rhesus monkeys with EBOV by inhalation. In another experiment, three out of four orally inoculated rhesus monkeys were infected when using a dose of 5.2 log10 of EBOV (Jaax et al., 1995). Rhesus Macaques were aerosol challenged with calculated doses between 743 and 274,000 PFU of EBOV delivered as a small-particle aerosol (Twenhafel et al., 2013) whilst a lethal dose of 100 LD50 in African green monkeys and 20–50 LD50 in baboons has been demonstrated (Ryabchikova et al., 1999). As a worst case scenario it is assumed that Cmin = 1 log10 TCID50.
A.1.3. Live animals
Species of animal, s. Detection of EBOV by serology and PCR in animals has been recently summarised by Pigott et al. (2014). Dogs and pigs are, so far, the only domestic animals identified as species that can be infected with EBOV (Weingartl et al., 2013, Allela et al., 2005). Although dogs can be asymptomatically infected, they may excrete infectious viral particles in urine, faeces, and saliva for a short period before virus clearance. Pigs have been shown to be susceptible to both the Reston and Zaire strains of Ebola. Conversely, the Zaire strain is also capable of transmission from pigs to Cynomolgus macaques without direct contact (Weingartl et al., 2012). Pigs, challenged with EBOV via mucosal exposure, replicated the virus to high titres mainly in the respiratory tract with shedding observed from oronasal mucosa up to 14 days post-exposure. Transmission to cohabiting naïve pigs was also observed (Kobinger et al., 2011).
Animal species in which evidence of natural/experimental EBOV infection has been demonstrated and considered as potentially capable of introducing EBOV into the EU include: pig, domestic dog, Lord Derby's Scaly-tailed Squirrel, Duiker, Non-human primates, small rodents and the shrew (Morvan et al., 1999) . Bat species include: Epomops franqueti, Hypsignathus monstrosus, Micropteropus pusillus, Mops (Mops) condylurus, & Hipposideros gigas, Myonycteris (Myonycteris) torquata, Rousettus (Rousettus) aegyptiacus, Rousettus (Rousettus) amplexicaudatus.
A.1.4. Illegal trade import: bushmeat
Species of bushmeat, pBMSp(s). Previous published studies on bushmeat in Europe have not identified bats among seizures of bushmeat sampled (Falk et al., 2013, Chaber et al., 2010). A study on the species of bushmeat items confiscated at US ports of entry between 2005 and 2010, suggested that bats accounted for around 1.5% of all bushmeat (Bair-Brake et al., 2013). Thus, in the absence of other information, we assume that 1.5% of bushmeat is bats. The same study suggested that around 6% of bushmeat is derived from NHP and 50% from rodents. Rodents and blue Duikers made up 75% of the total number of bushmeat carcasses detected at Paris Roissy-Charles de Gaulle airport from sub-Saharan Africa (Chaber et al., 2010). Despite being herbivorous, duikers have been known to eat the flesh of decomposing carcasses and could become infected with EBOV via this transmission route (Rouquet et al., 2005).
A.2. Hendra
A.2.1. Human travel
Number of human infection in exporting country, nHinf(k)
Human cases of HeV have been restricted to the state of Queensland in Australia (Table A4 ). Hendra virus was first described in 1994 since which time 7 human infections have occurred in 45 separate outbreaks with a 57% case fatality rate. No human cases have been reported for the last 6 years (since 2009) which is attributed to horse keepers/vets greater awareness of the disease and an equine vaccination programme. The number of human infections in exporting country k in one year is assumed to be 1.
Table A4.
Historical review of HeV human cases.
| Date | Country | Number of cases | Number dead | Likely source | Exposure to | Human-to human transmission? |
|---|---|---|---|---|---|---|
| 1994 | Queensland | 1 | 1 | Infected horse | Farmer assisted in autopsy of horse. Died 13 months post infection | No |
| 1994 | Queensland | 2 | 1 | Infected horse | Death of horse trainer and severe illness in stable-hand both with close contact with sick horses | No |
| 2004 | Queensland | 1 | 0 | Infected horse | Veterinarian tested positive for Hendra virus after performing a post mortem | No |
| 2008 | Queensland | 2 | 1 | Infected horse | Veterinarian and veterinary nurse were infected after close contact with sick horse. The vet died. | No |
| 2009 | Queensland | 1 | 1 | Infected horse | Veterinarian died after exposure to Hendra infected horse | No |
Time to clinical signs, TIP(k). Estimates of average time to clinical signs in humans can be seen in Table A5 . Taking an average of all the estimates available, a value of 12.8 days was used for the average time to clinical symptoms of HeV.
Table A5.
Estimates of average times to clinical symptoms for human HeV cases (days).
| Patient | Average time to clinical symptoms (days) | Ref |
|---|---|---|
| Patient 1 1994 | No accurate data | |
| Patient 1 1995 | 7 | (Selvey et al., 1995) |
| Patient 2 1995 | 8 | (Selvey et al., 1995) |
| Patient 1 2004 | 7 | (Hanna et al., 2006) |
| Patient 1 2008 | 9 or 16 | (Playford et al., 2010) |
| Patient 2 2008 | 11 | (Playford et al., 2010) |
| Patient 1 2009 | 21 (19)a | (Ausvet, 2009) |
Patient received antiviral treatment which may delay symptoms 1–2 days.
A.2.2. Legal trade import
Bat infection prevalence in exporting country, pBinf(k)
In 2011 HeV RNA was detected in up to two-thirds of pooled-urine samples from bats near HeV cases in horses (Plowright et al., 2015). Variable virus excretion has been reported in urine, with prevalence in pooled urine samples collected under roosting flying-foxes ranging from 3–33% in the one-in-four sampling events that yielded positive results. Subsequent studies have detected excretion spikes as high as 60% on rare occasions (Field et al., 2011). Based on documented evidence of virus isolation (Table A6 ) the prevalence of HeV in bats was assumed to be 0.47%.
Table A6.
Detection of HeV in bats.
| Positive bat species | Country | Sample taken | Test | Number tested | Number positive | Number shedding | Prevalence | Ref. |
|---|---|---|---|---|---|---|---|---|
| P. alecto, P. poliocephalus, P. conspicillatus, P. scapulatus | Australia | Uterine fluids | Virus isolation | 4 | 4 | 4 | targeted surveillance no mention of how many | (Halpin et al., 1996) |
| Pteropus poliocephalus and Pteropus alecto | Australia | Tissue samples | Virus isolation | 465 | 2 | 2 | sampling of recently captured sick or injured wild bats | (Halpin et al., 2000) |
| P. alecto, P. poliocephalus, P. conspicillatus, P. scapulatus | Australia | Pooled urine | RT-PCR | 1672 | 45a | – | (Field et al., 2011) | |
| P. alecto, P. poliocephalus, P. conspicillatus | Australia | Pooled Urine | Virus isolation | 45a samples +ve by q-PCR; 30 of these picked for isolation | 4 | 4 | (Smith et al., 2011) | |
| Chalinobus, Miniopterus australis, Nyctophilus, P. alecto, P. poliocephalus, P. conspicillatus, P. scapulatus, Saccolaimus flaviventris, Scotorepens, Synconycterus | Australia | Tissues & serum | RT-qPCR | 310 | 20 | _ | (Goldspink et al., 2015) |
samples are the same reported in different articles.
Product types, l. Whilst there is currently no evidence of human HeV infection as a result of contaminated fruit consumption it is plausible that this could occur with or without mutation and adaptation of currently identified strains. This framework models only the possibility that fruit products contaminated with HeV could enter the EU. All products in the FAOStat database recorded under section 8 – Fruits and derived products, are therefore included.
Proportion of the year bats may shed active HeV virus, pseason(k). Flying foxes appear to excrete HeV at any time of year and spillover in horses can occur in any month but the majority of equine cases (94 confirmed or possible cases as of December 2015 (Smith et al., 2016)) have occurred from June to September suggesting that there is a greater risk of infection at this time (Field et al., 2011). There was an initial coincidence of HeV outbreaks with birthing seasons of Australian fruit bat species and the isolation of HeV from the uterine fluid and aborted foetus of a P. poliocephalus bat indicated that this may be a significant route of infection for horses (Fogarty et al., 2008). However, there now appears to be a temporal clustering of spillovers during the winter period with 35/51 spillovers to June 2014 occurring in June, July and August (Goldspink et al., 2015). The proportion of the year that bats are assumed to shed active virus is therefore estimated to be ∼4 months or 0.33 of 1 year.
Initial viral load on raw product, c0(x): the initial concentration of HeV on the raw product is assumed to be equivalent to that shed by bats. Virus has been detected in the urine, faeces, saliva and birthing fluids of experimentally infected flying-foxes (Williamson et al., 2000, Williamson et al., 1998, Halpin et al., 2011), and in the urine, uterine fluid and foetal tissue of naturally infected free-living flying-foxes (Halpin et al., 2000, Field et al., 2011). Whilst these studies report on prevalence of virus there are no data on quantification of virus in bats available. However, in experimental inoculations of pigs virus titres of 4.6 log10 TCID50/ml were found in nasal swab samples (Li et al., 2010a). Based on these data the initial viral load on the raw product follows a log normal distribution with mean 4.6 log10 TCID50/ml (variance = 1 log10 TCID50/ml in the absence of any other data).
Virus decay in the environment and during transport, Cenv(j,k), Ctrans(j,k): Using an exponential decay model the half-life of Hendra virus under laboratory conditions was calculated to be 1.85 min, 50.2 and 308 h. for 56, 22 and 4 °C respectively (Scanlan et al., 2014). More recent modelling predictions using the same data calculated half-lives of 3.5 s, 2.9 h and 268 h using a Weibull distribution (Martin et al., 2015). When incubated in P. alecto urine (pH ∼7) HeV had a half-life of 19 h. at 22 °C and 3 h at 37 °C (Fogarty et al., 2008). The half-life in mango flesh ranged from 0.3 h. at pH3 to 22 h. at pH5 at 22 °C (Fogarty et al., 2008). The calculation of 2.9 h at 22 °C was assumed to be the most accurate for this scenario and this value was therefore used for virus decay in the environment; a value of 268 h was used for decay during transport consistent with the modelling prediction using Weibull distribution.
Minimum Viral load to consider product contaminated in EU MS, Cmin Uniform disease occurred with an inoculation value of 3.4 × 10⁶ PFU of HeV for guinea pigs and 6.6 × 10⁷ PFU for Landrace pigs whereas an inoculate dose of 2 × 10⁷ PFU in Minipigs did not cause uniform fatality (Li et al., 2010b). Horses in a vaccine efficacy study were challenged oronasally with 2 × 10⁶ TCID50 in experimental infection with Hendra (Marsh et al., 2011, Middleton et al., 2014) while cats orally challenged with 5 × 10³ TCID50 succumbed to disease after a 9 day incubation period (Hooper et al., 1997). As a worst case scenario it is assumed that Cmin = 1 log10 TCID50.
A.2.3. Live animals
Species of animal, s. Horses are moved internationally for competition, breeding, slaughter and as companion animals. All horses being permanently exported to Europe from Australia must complete a 30 day pre-export isolation at an approved quarantine stable in Australia. In horses, the incubation period is estimated to be 5–16 days although the incubation period in one horse may have been 31 days (DoH, 2012). Evidence suggests that horses have the potential to excrete virus in nasal secretions up to 2 days before showing signs of infection (Kung et al., 2013) and should be considered as potentially infectious from 72 h prior to onset of clinical signs of disease. Virus is recoverable from infected horse's urine and saliva for at least 21 days. Transmission of HeV or NiV via semen has not been investigated, although the likelihood of a stallion being infected, clinically healthy and having semen collected for export is considered remote (MAF, 2000).
Experimental inoculation of pigs has indicated that they could be a potential host for HeV (Li et al., 2010b). In a serological survey of 100 swine herds in Queensland, Australia (Black et al., 2001) no HeV antibodies were found in the 500 tested serum samples. Two dogs have tested positive for HeV antibodies on properties where horses developed HeV infection in July 2011 and July 2013. Although the source of exposure for the dogs cannot be definitively ascertained, horse-to-dog transmission is the most plausible scenario. Experimental Hendra virus infections have been performed in horses, cats, ferrets, hamsters, African Green monkeys and guinea pigs all of which developed fatal diseases. Cats from Australia are prohibited from entering the UK unless they are accompanied by a certificate from the Australian Veterinary Authorities confirming that they had not been on a holding where HeV has been confirmed during the 60 days prior to export. Pigs, dogs, cats and horses are all considered in the model.
A.2.4. Illegal trade import: bushmeat
Species of bushmeat, pBMSp(s). Bushmeat is part of the traditional diet of indigenous Australian people whilst Australian game meat plays a part in modern Australian cuisine. Some of the animals that were traditionally hunted for meat are now endangered and protected including the flying foxes (in New South Wales and Queensland) although Aboriginal people are excluded from protection laws and have the legal right to hunt native animals for their own consumption.
A study reported on the species of bushmeat items confiscated at US ports of entry between 2005 and 2010, suggested that bats accounted for around 1.5% of all bushmeat (Bair-Brake et al., 2013). Thus, in the absence of other information, we assume that 1.5% of bushmeat is bats.
A.3. Marburg
A.3.1. Human travel
Number of human infections in exporting country, nHinf(k)
Since 1980 MARV outbreaks have originated in Kenya, the DRC, Angola and Uganda (Table A7 ).
Table A7.
Historical review of MARV virus outbreaks to the present day (as of November 2014) (the 2 Koltsovo laboratory infections which occurred in the former Soviet Union have not been included here).
| Date | Country | Number of cases | Number dead | Likely source | Exposure to | Human-to human transmission? | Ref. |
|---|---|---|---|---|---|---|---|
| 1967 | Europe | 31 | 7 | Imported African green monkeys (Chlorocebus aethiops) from Uganda | Blood, organs, cell cultures | Yes | (Kissling et al., 1970) |
| 1975 | South Africa | 3 | 1 | Unknown - possibly from Zimbabwe | Visited Sinoia caves 8–9 days prior to onset of symptoms | Yes | (Gear et al., 1975) |
| 1980 | Kenya | 2 | 1 | Kitum Cave (<70 miles from Lake Kyoga where 1967 monkeys originated) | Possible bat excretions | Yes | (Smith et al., 1982) |
| 1987 | Kenya | 1 | 1 | Kitum Cave (<70 miles from Lake Kyoga where 1967 monkeys from) | Possible bat excretions | No | (Johnson et al., 1996) |
| 1998–2000 | DRC | 154 | 128 | Mine workers in Goroumbwa cave | Possible bat excretions | Yes | (Bausch et al., 2006) |
| 2004–2005 | Angola | 374 | 329 | Unknown | Mostly index cases were children possibly from administration of vaccine using contaminated equipment | Yes | (Fisher-Hoch, 2005) |
| 2007 | Uganda | 4 | 2 | Mine workers in Kitaka cave | Possible bat excretions | Possibly | (Towner et al., 2007) |
| 2008 | USA/Netherlands | 2 | 1 | Visit to Python cave in Maramagambo Forest | Possible bat excretions | No | (WHO, 2008) |
| 2012 | Uganda | 20 | 9 | Same strain as 2007 outbreak | 99.3% similar to sequence from bat | Yes | (Amman et al., 2014) |
| 2014 | Uganda | 1 | 1 | No consumption of bushmeat or contact with bats | Healthcare worker | No | (WHO, 2014b) |
Time to clinical signs, TIP(k). Data from secondary cases of MARV in Kenya place the median incubation period at 9 days. However the incubation period in index cases following exposure to a reservoir source is calculated as having a mean of 9.8 days (Timen et al., 2009, Amman et al., 2012) with a range of 3–15 days. Based on documented cases of exposure and subsequent infection MARV was calculated to have an incubation period ranging from 3 to 21 days (typically 5–10 days) the range being modulated by factors such as infectious dose and possibly by route of infection (Brauburger et al., 2012). Using data available from historical Marburg cases with precise exposure dates (n = 18), the median incubation rate for Marburg was calculated by Pavlin to be 7 days with no significant difference between primary and secondary cases (Pavlin, 2014). The value of 7 days is used in the model.
A.3.2. Legal trade import
Bat infection prevalence in exporting country, pBinf(k). The estimate for the prevalence of MARV in bats is based on published information from peer reviewed publications on the isolation of active MARV (Table A8 ). The number of bats actively shedding virus is taken as a percentage of the entire pool tested as it is assumed that if no RNA is detectable then virus isolation would be highly unlikely as a direct correlation between RNA levels and the ability to isolate virus has been demonstrated (Towner et al., 2009). Due to the uncertainty surrounding this parameter, the prevalence of active virus shedding in bats was assumed to be pBInfW(k) = 0.29% as a worst case scenario.
Table A8.
Detection of MARV in bats.
| Positive bat species | Country | Sample taken | Number tested | Number shedding | Prevalence | Concentration | Ref. |
|---|---|---|---|---|---|---|---|
| Rousettus aegyptiacus | Uganda | liver/spleen tissue | 1622 (40 RT-PCR pos) | 7 | 0.40% | ∼(>2000 TCID50/ml) | (Amman et al., 2012) |
| Rousettus aegyptiacus | Uganda | liver/spleen tissue | 611 (31 RT-PCR pos) | 5 | 0.80% | 1 × 10⁵ pfu/ml | (Towner et al., 2009) |
| Rhinolophus eloquens, Rousettus aegyptiacus, Miniopterus inflatus | Democratic Republic of the Congo | pooled tissue | 381 (12 RT-PCR pos) | 0 | 0 | (Swanepoel et al., 2007), | |
| Rousettus aegyptiacus | Gabon & Republic of Congo | liver/spleen tissue | 1138 (4 RT-PCR pos) | 0 | 0 | (Towner et al., 2007) | |
| Rousettus aegyptiacus | Gabon | liver/spleen tissue | 1257 (9 RT-PCR pos) | No virus isolation attempted due to low viral load | – | (Maganga et al., 2011) | |
| Rousettus aegyptiacus | Kenya | faecal & oral swabs/liver, spleen & lung | 272 (1 RT-PCR pos) | No virus isolation attempted due to low viral load | – | (Kuzmin et al., 2010) | |
| Rousettus aegyptiacus, Hypsignathus monstrosus, Epomops franqueti, Micropteropus pusillus | Gabon/ROC | liver/spleen tissue | 1438 (0 RT-PCR pos) | No virus isolation attempted due to low viral load | – | (Pourrut et al., 2009) | |
| Rousettus aegyptiacus | Uganda | liver/spleen tissue | 400 (53 RT-PCR pos) | 9 | 2.25% | (Amman et al., 2014) |
Product types, l. MARV has been isolated from Rousettus aegypticus, a fruit bat which is known to discard hard particles in their food at foraging sites (Herzig-Straschil and Robinson, 1978). They are known to consume various fruit crops produced for human consumption such as date, fig, apricot and peach. A recent paper succeeded in isolating MARV from both oral and rectal secretions of R. aegyptiacus experimentally infected with virus demonstrating potential avenues for viral shedding (Amman et al., 2015). Thus all products in the FAOStat database recorded under section 8 – Fruits and derived products, are included.
Proportion of the year bats may shed active MARV virus, pseason(k). Retrospective analysis of historical human infections found there was a temporal clustering of infections coinciding with the seasonal pulses in virus circulation in R. aegyptiacus covering 6 months of the year in total (Amman et al., 2012). The observation of these distinct pulses of virus infection in older juvenile bats appears to coincide with the peak bi-annual birthing seasons. Thus the proportion of the year that bats are presumed to be infectious with MARV is 0.5.
Initial viral load on raw product, c0(x): the initial concentration of MARV on the raw product is assumed to be equivalent to that shed by bats. Successful isolation of MARV roughly correlated with tissue samples that had RT-PCR Ct values of 30 or less (>2000 TCID50/ml) (Amman et al., 2012). The highest RNA level, measured using Ct values, corresponded to an approximate infectious titre of 1 × 10⁵ pfu/ml (Towner et al., 2009).
Measurements of concentrations of MARV in experimentally infected guinea pig saliva, urine and faeces showed a virus concentration of 2.3–3.3 log LD50 (median lethal dose) (Chupurnova et al., 2000). The LD50 was calculated to be 5 × 10⁻² TCID50 of virus for wild type mice (Qiu et al., 2014). However, it should be noted that this will be a rodent adapted strain of the virus. The virus has also been found to be excreted at high levels of up to 106 guinea pig infectious doses in urine of experimentally challenged monkeys (Simpson, 1969).
Marburg virus was isolated from oral secretions of R. aegyptiacus experimentally infected with virus from a naturally infected bat of the same species (Amman et al., 2015). Viral loads were measured by qRT-PCR analysis of viral RNA and reported as mean TCID50 equivalents. Marburg virus positive oral swabs were obtained on day 4–14 post infection with highest viral loads detected on day 8 (1.32 × 10³ TCID50/ml equivalents) and cleared from oral secretions by day 14. Based on these data the initial viral load on the raw product follows a log normal distribution with mean 3.12 log10 TCID50/ml (variance = 1 log10 TCID50/ml in the absence of any other data).
Virus decay in the environment and during transport, Cenv(j,k), Ctrans(j,k): In a study on the survival of filoviruses in liquids and on solid substrates the half-life of Marburg virus in liquid media was calculated to be between 5.1 and 6.6 days at +4 °C and ∼3 days at room temperature (Piercy et al., 2010). No virus could be recovered from any solid substrate stored at room temperature but at +4 °C the virus had a half-life of ∼4.5–5.5 days on glass and ∼4.5–10 days on plastic substrates depending on the media in question. From the data available, a mean half-life of 6 days (144 h) is used as an estimate for virus reduction during transport at +4 °C and virus reduction pre-harvesting is estimated at 3 days (72 h) using liquid media data.
Minimum Viral load to consider product contaminated in EU MS, Cmin: Evidence of experimental infection in rodents is not considered here as these models generally use adapted viruses obtained through sequential passage in the rodent species as the wild-type virus does not cause uniform lethality (Bray, 2001). A single intramuscular injection of a common marmoset with as little as 10 PFU of virus has resulted in fatal haemorrhagic disease (Carrion et al., 2011) whilst 1000 PFU has proven to be a uniformly lethal dose of virus (Thi et al., 2014, Geisbert et al., 2007, Hensley et al., 2011, Smith et al., 2013). However doses as low as 2–14 PFU and 99–705 PFU have been reported as causing disease by viral inhalation. The doses were equally fatal but symptoms were delayed by one day in the lower dose group (Alves et al., 2010). When bats were experimentally infected by subcutaneous inoculation with a dose of 104 TCID50 MARV there was evidence of infection in all bats although no clinical signs were observed. As a worst case scenario it is assumed that Cmin = 1 log10 TCID50.
A.3.3. Live animals
Species of animals (s): All species of NHPs were considered as susceptible to MARV due to previous research (Simpson, 1969).
A.3.4. Illegal trade import: bushmeat
Species of bushmeat, pBMSp(s). Previous published studies on bushmeat in Europe have not identified bats among seizures of bushmeat sampled (Chaber et al., 2010, Falk et al., 2013). A study reported on the species of bushmeat items confiscated at US ports of entry between 2005 and 2010, suggested that bats accounted for around 1.5% of all bushmeat (Bair-Brake et al., 2013). Thus, in the absence of other information, we assume that 1.5% of bushmeat is bats. The same study suggested that around 6% of bushmeat is derived from NHP which is of relevance here as MARV has been previously transmitted from NHP to humans.
A.4. MERS
A.4.1. Human travel
Number of human infections in exporting country, nHinf(k). Sporadic cases have occurred in Europe and the rest of the world but the index case of these outbreaks has always recently travelled to the Middle East. A large number of cases reported in Saudi Arabia have been nosocomial; the recent outbreak of MERS-CoV in South Korea illustrates the role the hospital environment can play in the spread of pathogens (Park et al., 2015). The number of human infections (Table A9 ) were taken as the total number (as at November 18th 2016) divided by the period of time over which the infections have been recorded.
Table A9.
Global incidence of laboratory confirmed MERS-CoV cases as of 18th November 2016.
| Date of onset/most recent case | Country | Number of cases | Number dead |
|---|---|---|---|
| 18/11/2016 | Saudi Arabia | 1484 | 617 |
| 16/06/2016 | UAE | 84 | 12 |
| 13/06/2016 | Qatar | 16 | 5 |
| 23/09/2016 | Jordan | 35 | 14 |
| 31/05/2015 | Oman | 6 | 3 |
| 19/09/2015 | Kuwait | 4 | 2 |
| 22/04/2014 | Egypt | 1 | 0 |
| 17/03/2014 | Yemen | 1 | 1 |
| 22/04/2014 | Lebanon | 1 | 0 |
| 18/03/2015 | Iran | 6 | 2 |
| 25/09/2014 | Turkey | 1 | 1 |
| 12/09/2016 | Austria | 2 | 0 |
| 06/02/2013 | UK | 4 | 3 |
| 07/03/2015 | Germany | 3 | 2 |
| 08/05/2013 | France | 2 | 1 |
| 27/05/2013 | Italy | 1 | 0 |
| 08/04/2014 | Greece | 1 | 1 |
| 05/05/2014 | The Netherlands | 2 | 0 |
| 16/05/2013 | Tunisia | 3 | 1 |
| 23/05/2014 | Algeria | 2 | 1 |
| 09/04/2014 | Malaysia | 1 | 1 |
| 01/02/2015 | Philippines | 3 | 0 |
| 01/05/2014 | United States of America | 2 | 0 |
| 02/07/2015 | South Korea | 185 | 36 |
| 30/05/2015 | China | 1 | 0 |
| 30/07/2016 | Thailand | 3 | 0 |
Time to clinical signs, TIP(k). The incubation period of MERs-CoV has been estimated using data from exposure of secondary cases to the index case in a hospital outbreak (Assiri et al., 2013) and using traveller-related clusters (Cauchemez et al., 2014). The median incubation period for confirmed cases in the hospital outbreak was 5.2 days (95% CI 1.9 - 14.7), and 5.5 days (95% CI 3.6–10.2) for travel related clusters in the UK, France, Italy and Tunisia (Fisher-Hoch, 2005). A figure of 5.3 days is used in this model.
A.4.2. Legal trade import
Bat infection prevalence in exporting country, pBinf(k). Growing serological and molecular evidence suggests that the dromedary camel (Camelus dromedarius) is an intermediate species for MERS-CoV (ECDC, 2015b) but the virus is hypothesised to have originated from bats. A MERS-CoV sequence identical to that of the virus isolated from an index-case patient was detected in a faecal pellet from a Taphozous perforatus bat sample (Table A10 ) collected near the home of an index case in an area which is an important date palm production area in Saudi Arabia (Memish et al., 2013). As yet no evidence has been found of actual infection in chiropteran populations.
Table A10.
Detection of MERS-CoV in bats.
| Positive bat species | Country | Sample taken | Test | Number tested | Number positive | Number shedding | Ref. |
|---|---|---|---|---|---|---|---|
| Rhinopoma hardwickii, Rhinopoma microphyllum, Taphozous perforatus, Pipistrellus kuhlii, Eptesicus bottae, Eidolon helvum, and Rosettus aegyptiacus | Saudi Arabia | Throat swab, faeces, urine, serum | PCR | 110 individual bats and 732 roost faeces samples | 1 | 0 | (Memish et al., 2013) |
Product types, l. Some human cases of MERS-CoV infection have had gastrointestinal symptoms including diarrhoea and vomiting. Coronaviruses have been demonstrated to survive on fresh produce over a period of days (Yepiz-Gomez et al., 2013, Mullis et al., 2012). Thus, it is possible that fruit and vegetables contaminated with coronavirus may be potential vehicles for transmission to humans. Infected bats (or other animals) contaminating raw fruit via saliva or urine whilst foraging for food is considered a risk and thus all products in the FAOStat database recorded under section 8 – Fruits and derived products, are included.
Other legal imports considered as potential risk commodities are camel meat and camel milk. MERS-CoV RNA and antibodies have been detected in milk collected from actively shedding dromedary camels in Qatar providing evidence of the potential for virus transmission (Reusken et al., 2014a). Camel milk imports from UAE to the UK began in 2014 and are transported by plane as a chilled product. The operation is stated to have obtained ISO 2000 certification for both the farm and dairy processing facilities to fulfil the EU import requirements. There have been 6 consignments in 2014 comprising of:
| Product | Description | Amount |
|---|---|---|
| Milk and Cream | UHT, Sterilisation, HTST | 1600 Kg |
| Powder form, containing added sugar | UHT, Sterilisation, HTST | 30 Kg |
| Added sugar | UHT, Sterilisation, HTST | 200 Kg |
The products are described as having undergone sterilisation and UHT. Camel milk samples, spiked with MERS-CoV, has been shown to be depleted of infectious virus after undergoing heat treatment for 30 min at 63 °C (van Doremalen et al., 2014). There is evidence of only one certificate in TRACES of camelid meat imports into the EU since 2000. This documents 1.183 Kg of wild game camel meat imported from Australia in 2013.
Proportion of the year bats may shed active MERS-CoV virus, pseason(k). Although there is no evidence of viral shedding in bats to observe any seasonal fluctuations, analysis of human infections since the first reporting of MERS-CoV found there was a temporal clustering of infections with a sharp rise in the number of cases in April and May and a smaller peak in August-September. The birthing period for Taphozous perforates is in April and May. In line with the peak in human infections in Saudi Arabia the proportion of the year that the source is presumed to be infectious with MERS-CoV is 4 months or 0.33.
Initial viral load on raw product, c0(x): Experimental infection of common marmosets with 5.2 × 10⁶ TCID50 MERS-CoV exhibited viral loads of ∼6 log10 TCID50 eq/g in nasal mucosa 6 days after challenge (Falzarano et al., 2014). Respiratory samples gave higher values than blood or other tissues. Camels inoculated with doses of 107 TCID50 gave viral titre of maximum of 6 log10 TCID50 eq/ml of nasal swab samples (Adney et al., 2014). Based on these data the initial viral load on the raw product follows a log normal distribution with mean 5 log10 TCID50eq/ml (variance = 1 log10 TCID50/ml in the absence of any other data).
Virus decay in the environment and during transport, Cenv(j,k), Ctrans(j,k): The stability of MERS-CoV (isolate HCoV-EMC/2012) was evaluated under three different environmental conditions (van Doremalen et al., 2013). The mean half-life was calculated as: 0.947 (h) at 20 °C 40% humidity and 0.708 h at 30 °C 30% humidity indicating that temperature influences the environmental decay of the virus. In liquid matrices MERS-CoV was found to have a half-life of ∼10 h in milk at +22 °C and 72 h at +4 °C (van Doremalen et al., 2014).
The mean half-life for MERS-CoV in the environment was taken to be 0.773 h, as it was assumed to most accurately mimic a real-life situation whereby fruit contaminated by either infected bat saliva or urine would then be exposed to temperatures of ∼30 °C prior to harvesting (assuming a peak shedding prevalence in April/May and Aug/Sep time). However, after harvest when the fruit is assumed to be kept at +4 °C during transport the average half-life time of 72 h, as calculated from milk, is used as virus survival time is assumed to be more similar between solid and liquid matrices at this temperature than at 30 °C.
Minimum Viral load to consider product contaminated in EU MS, Cmin. The only animal models found to be naturally permissive to infection are non-human primates. Rhesus macaques challenged with 1 × 10⁷ TCID50 (de Wit et al., 2013) and 6.5 × 10⁷ TCID50 (Yao et al., 2014) showed MERS-CoV related pathology and had detectable levels of viral RNA. Challenge with a total viral dose of 5.2 × 10⁶ TCID50 caused a severe partially lethal disease in the common marmoset (Callithrix jacchus) (Falzarano et al., 2014). Camels inoculated with doses of 107 TCID50 gave viral titre of maximum of 6 log10 TCID50 eq/ml of nasal swab samples (Adney et al., 2014). As a worst case scenario it is assumed that Cmin = 1 log10 TCID50.
A.4.3. Live animals
Species of animal, (s). There has been documented evidence of MERS-CoV viral RNA (Chu et al., 2014), virus specific antibodies (Alagaili et al., 2014, Briese et al., 2014, Corman et al., 2014, Meyer et al., 2014, Reusken et al., 2014b) and virus isolation (Raj et al., 2014, Hemida et al., 1993) in dromedary camels, both from countries in the Arabian Peninsula and the African continent. According to the EC (Commission Regulation (EC) No 206/2010) no camel imports are allowed from the Arabian Peninsula or countries in Africa where antibodies to the MERS-CoV has been detected in camel sera. However, there is no evidence of camels from approved 3rd countries being tested for the Mers-CoV and, as this virus is suspected of being circulating in camels for some time, it is not impossible that they could be harbouring the coronavirus too. Only dromedary camels were considered as ‘at risk’ for live animal imports to the EU.
A.4.4. Illegal trade import: bushmeat
Species of bushmeat, pBMSp(s): Bats, or camel meat, illegally imported as bushmeat from the Arabian Peninsula and Africa could be of potential risk in the transmission of the MERS-CoV. As has previously been stated, in the absence of other information, we assume that 1.5% of bushmeat is bats. It is possible that camel meat could be present in generic ‘red meat’ illegally imported as bushmeat from the Arabian Peninsula.
Appendix B
Table B1.
Total population and gross domestic product (GDP) derived from purchasing power parity (PPP).
| MS (ISO3) | Population | Population (rank) | GDP(PPP) | GDP(PPP) (rank) |
|---|---|---|---|---|
| DEU | 80,889,505 | 1 | 3,704,911 | 1 |
| FRA | 66,206,930 | 2 | 2,571,970 | 2 |
| GBR | 64,510,376 | 3 | 2,565,070 | 3 |
| ITA | 61,336,387 | 4 | 2,128,762 | 4 |
| ESP | 46,404,602 | 5 | 1,541,156 | 5 |
| POL | 37,995,529 | 6 | 940,179 | 6 |
| ROU | 19,910,995 | 7 | 803,313 | 11 |
| NLD | 16,854,183 | 8 | 477,949 | 7 |
| BEL | 11,225,207 | 9 | 437,803 | 8 |
| GRC | 10,957,740 | 10 | 394,485 | 14 |
| CZE | 10,510,566 | 11 | 386,300 | 12 |
| PRT | 10,397,393 | 12 | 319,599 | 13 |
| HUN | 9,861,673 | 13 | 295,209 | 16 |
| SWE | 9,689,555 | 14 | 283,555 | 9 |
| AUT | 8,534,492 | 15 | 253,309 | 10 |
| BGR | 7,226,291 | 16 | 243,786 | 20 |
| DNK | 5,639,565 | 17 | 224,893 | 15 |
| FIN | 5,463,596 | 18 | 218,441 | 18 |
| SVK | 5,418,506 | 19 | 150,155 | 19 |
| IRL | 4,612,719 | 20 | 120,040 | 17 |
| HRV | 4,236,400 | 21 | 89,897 | 21 |
| LTU | 2,929,323 | 22 | 78,336 | 22 |
| SVN | 2,062,218 | 23 | 61,790 | 23 |
| LVA | 1,990,351 | 24 | 54,307 | 25 |
| EST | 1,313,645 | 25 | 45,525 | 26 |
| CYP | 1,153,658 | 26 | 35,397 | 27 |
| LUX | 556,074 | 27 | 26,368 | 24 |
| MLT | 427,404 | 28 | 12,332 | 28 |
a Worldbank data 2014 http://data.worldbank.org/data-catalog/Population-ranking-table.
b Worldbank data 2014 in millions of international dollars http://databank.worldbank.org/data/download/GDP_PPP.pdf.
References
- Adney D.R. Replication and shedding of MERS-CoV in upper respiratory tract of inoculated dromedary camels. Emerging Infect. Dis. 2014;20(12):1999–2005. doi: 10.3201/eid2012.141280. [DOI] [PMC free article] [PubMed] [Google Scholar]
- Alagaili A.N. Middle East respiratory syndrome coronavirus infection in dromedary camels in Saudi Arabia. Mbio. 2014;5(2) doi: 10.1128/mBio.00884-14. [DOI] [PMC free article] [PubMed] [Google Scholar]
- Allela L. Ebola virus antibody prevalence in dogs and human risk. Emerging Infect. Dis. 2005;11(3):385–390. doi: 10.3201/eid1103.040981. [DOI] [PMC free article] [PubMed] [Google Scholar]
- Althaus C.L. Ebola virus disease outbreak in Nigeria: transmission dynamics and rapid control. Epidemics. 2015;11:80–84. doi: 10.1016/j.epidem.2015.03.001. [DOI] [PubMed] [Google Scholar]
- Alves D.A. Aerosol exposure to the angola strain of Marburg virus causes lethal viral hemorrhagic fever in Cynomolgus macaques. Vet. Pathol. 2010;47(5):831–851. doi: 10.1177/0300985810378597. [DOI] [PubMed] [Google Scholar]
- Amman B.R. Seasonal pulses of Marburg virus circulation in juvenile Rousettus aegyptiacus bats coincide with periods of increased risk of human infection. Plos Pathog. 2012;8(10) doi: 10.1371/journal.ppat.1002877. [DOI] [PMC free article] [PubMed] [Google Scholar]
- Amman B.R. Marburgvirus resurgence in Kitaka mine bat population after extermination attempts, Uganda. Emerging Infect. Dis. 2014;20(10):1761–1764. doi: 10.3201/eid2010.140696. [DOI] [PMC free article] [PubMed] [Google Scholar]
- Amman B.R. Oral shedding of Marburg virus in experimentally infected Egyptian fruit bats (Rousettus aegyptiacus) J. Wildlife Dis. 2015;51(1):113–124. doi: 10.7589/2014-08-198. [DOI] [PMC free article] [PubMed] [Google Scholar]
- Anthony S.J., G.K., Menachery V.D., Goldstein T., Ssebide B., Mbabazi R., Navarrete-Macias I., Liang E., Wells H., Hicks A., Petrosov A., Byarugaba D.K., Debbink K., Dinnon K.H., Scobey T., Randell S.H., Yount B.L., Cranfield M., Johnson C.K., Baric R.S., Lipkin W.I., Mazet J.A. Further evidence for bats as the evolutionary source of Middle East respiratory syndrome coronavirus. MBio. 2017;8(2) doi: 10.1128/mBio.00373-17. [DOI] [PMC free article] [PubMed] [Google Scholar]
- Assiri A. Hospital outbreak of Middle East respiratory syndrome coronavirus. New Engl. J. Med. 2013;369(5):407–416. doi: 10.1056/NEJMoa1306742. [DOI] [PMC free article] [PubMed] [Google Scholar]
- Ausvet, Progress audit of Biosecurity Queensland response activities at Cawarral in August 2009.
- Azhar E.I. Evidence for Camel-to-Human Transmission of MERS coronavirus. New Engl. J. Med. 2014;370(26):2499–2505. doi: 10.1056/NEJMoa1401505. [DOI] [PubMed] [Google Scholar]
- Bair-Brake H., Bell T., Higgins A., Bailey N., Duda M., Shapiro S., Eves H.E., Marano N., Galland G. Is that a rodent in your luggage? A mixed method approach to describe bushmeat importation into the United States. Zoonoses Public Health. 2013;61:97–104. doi: 10.1111/zph.12050. [DOI] [PubMed] [Google Scholar]
- Baron R.C., McCormick J.B., Zubeir O.A. Ebola virus disease in southern Sudan: hospital dissemination and intrafamilial spread. Bull. World Health Org. 1983;61(6):997–1003. [PMC free article] [PubMed] [Google Scholar]
- Bausch D.G. Marburg hemorrhagic fever associated with multiple genetic lineages of virus. New Engl. J. Med. 2006;355(9):909–919. doi: 10.1056/NEJMoa051465. [DOI] [PubMed] [Google Scholar]
- Bausch D.G. Ebola virus as a foodborne pathogen? Cause for consideration, but not Panic. J. Infect. Dis. 2011;204(2):179–181. doi: 10.1093/infdis/jir201. [DOI] [PubMed] [Google Scholar]
- Bialek S.R. First confirmed cases of Middle East respiratory syndrome coronavirus (MERS-CoV) infection in the United States, updated information on the epidemiology of MERS-CoV infection, and guidance for the public, clinicians, and public health authorities - May 2014. Morbidity Mortality Weekly Rep. 2014;63(19):431–436. [PMC free article] [PubMed] [Google Scholar]
- Black P.F. Serological examination for evidence of infection with Hendra and Nipah viruses in Queensland piggeries. Aust. Vet. J. 2001;79(6):424–426. doi: 10.1111/j.1751-0813.2001.tb12989.x. [DOI] [PubMed] [Google Scholar]
- Brauburger K. Forty-five years of marburg virus research. Viruses-Basel. 2012;4(10):1878–1927. doi: 10.3390/v4101878. [DOI] [PMC free article] [PubMed] [Google Scholar]
- Bray M. The role of the Type I interferon response in the resistance of mice to filovirus infection. J. Gen. Virol. 2001;82:1365–1373. doi: 10.1099/0022-1317-82-6-1365. [DOI] [PubMed] [Google Scholar]
- Breman J.G. A search for Ebola virus in animals in the Democratic Republic of the Congo and Cameroon: ecologic, virologic, and serologic surveys, 1979-1980. J. Infect. Dis. 1999;179:S139–S147. doi: 10.1086/514278. [DOI] [PubMed] [Google Scholar]
- Briese T. Middle East respiratory syndrome coronavirus quasispecies that include homologues of human isolates revealed through whole-genome analysis and virus cultured from dromedary camels in Saudi Arabia. Mbio. 2014;5(3) doi: 10.1128/mBio.01146-14. [DOI] [PMC free article] [PubMed] [Google Scholar]
- Bwaka M.A. Ebola hemorrhagic fever in Kikwit, Democratic Republic of the Congo: clinical observations in 103 patients. J. Infect. Dis. 1999;179:S1–S7. doi: 10.1086/514308. [DOI] [PubMed] [Google Scholar]
- Calisher C.H., Childs J.E., Field H.E., Holmes K.V., Schountz T. Bats: important reservoir hosts of emerging viruses. Clinical Microbiology Reviews. 2006;19(3):531–545. doi: 10.1128/CMR.00017-06. [DOI] [PMC free article] [PubMed] [Google Scholar]
- Camacho A. Potential for large outbreaks of Ebola virus disease. Epidemics. 2014;9:70–78. doi: 10.1016/j.epidem.2014.09.003. [DOI] [PMC free article] [PubMed] [Google Scholar]
- Carrion R., Jr. A small nonhuman primate model for filovirus-induced disease. Virology. 2011;420(2):117–124. doi: 10.1016/j.virol.2011.08.022. [DOI] [PMC free article] [PubMed] [Google Scholar]
- Cauchemez S. Middle East respiratory syndrome coronavirus: quantification of the extent of the epidemic, surveillance biases, and transmissibility. Lancet Infect. Dis. 2014;14(1):50–56. doi: 10.1016/S1473-3099(13)70304-9. [DOI] [PMC free article] [PubMed] [Google Scholar]
- Chaber A.-L. The scale of illegal meat importation from Africa to Europe via Paris. Conserv. Lett. 2010;3(5):317–323. [Google Scholar]
- Chowell G. The basic reproductive number of Ebola and the effects of public health measures: the cases of Congo and Uganda. J. Theor. Biol. 2004;229(1):119–126. doi: 10.1016/j.jtbi.2004.03.006. [DOI] [PubMed] [Google Scholar]
- Chowell G. Synthesizing data and models for the spread of MERS-CoV, 2013: key role of index cases and hospital transmission. Epidemics. 2014;9:40–51. doi: 10.1016/j.epidem.2014.09.011. [DOI] [PMC free article] [PubMed] [Google Scholar]
- Chu D.K.W. MERS coronaviruses in dromedary camels, Egypt. Emerging Infect. Dis. 2014;20(6):1049–1053. doi: 10.3201/eid2006.140299. [DOI] [PMC free article] [PubMed] [Google Scholar]
- Chupurnova T.S., Pisanko V.A., Bakulina L.F., Zhukov V.A., Chupurnova A.A. Assay for level of Marburg virus in blood and isolates from experimentally infected animals. Vopr. Virusol. 2000;45(2):18–20. [PubMed] [Google Scholar]
- Commission I. Ebola haemorrhagic fever in Zaire, 1976. Bull. World Health Organ. 1978;56:271–293. [PMC free article] [PubMed] [Google Scholar]
- Corman V.M. Antibodies against MERS coronavirus in dromedary camels, Kenya, 1992-2013. Emerging Infect. Dis. 2014;20(8):1319–1322. doi: 10.3201/eid2008.140596. [DOI] [PMC free article] [PubMed] [Google Scholar]
- de Wit E. Middle East respiratory syndrome coronavirus (MERS-CoV) causes transient lower respiratory tract infection in rhesus macaques. Proc. Natl. Acad. Sci. U.S.A. 2013;110(41):16598–16603. doi: 10.1073/pnas.1310744110. [DOI] [PMC free article] [PubMed] [Google Scholar]
- Defra, Origin of the UK foot and mouth disease epidemic 2001, 2002.
- Del Rio C., Mehta A.K., Lyon G.M., Guarner J. Ebola hemorrhagic fever in 2014: the tale of an evolving epidemic. Ann. Intern. Med. 2014 doi: 10.7326/M14-1880. Aug 19. PubMed PMID:25133433. [DOI] [PubMed] [Google Scholar]
- Dentinger C.M. An outbreak of hepatitis A associated with green onions. J. Infect. Dis. 2001;183(8):1273–1276. doi: 10.1086/319688. [DOI] [PubMed] [Google Scholar]
- Desenclos J.C. Introduction of SARS in France, March-April, 2003. Emerging Infect. Dis. 2004;10(2):195–200. doi: 10.3201/eid1002.030351. [DOI] [PMC free article] [PubMed] [Google Scholar]
- DISCONTOOLS, 2016 http://www.discontools.eu/AboutDiscontools/AboutDiseaseDatabase.
- DoH, A., Hendra virus. National guidelines for public health units. 2012.
- Dowell S.F. Transmission of Ebola hemorrhagic fever: a study of risk factors in family members, Kikwit, Democratic Republic of the Congo, 1995. J. Infect. Dis. 1999;179:S87–S91. doi: 10.1086/514284. [DOI] [PubMed] [Google Scholar]
- Durand B. Identification of hotspots in the European Union for the introduction of four zoonotic Arboviroses by live animal trade. Plos One. 2013;8(7) doi: 10.1371/journal.pone.0070000. [DOI] [PMC free article] [PubMed] [Google Scholar]
- Eby, P. and D. Lunney, Managing the Grey-Headed Flying-Fox as a Threatened Species in NSW. 2002. 286.
- ECDC. Updated rapid risk assessment. Severe respiratory disease associated with Middle East respiratory syndrome coronavirus (MERS-CoV). Ninth update, 24 April 2014 October 2014]; Available from: http://www.ecdc.europa.eu/en/publications/Publications/Middle-East-respiratory-syndrome-coronavirus-risk-assessment-25-April-2014.pdf.
- ECDC, Severe respiratory disease associated with MERS-CoV 11 June 2015 Stockholm. 2015.
- ECDC, Severe respiratory disease associated with Middle East respiratory syndrome coronavirus (MERS-CoV) 21st update, 21 October 2015. 2015.
- Eichner M., Dowell S.F., Firese N. Incubation period of ebola hemorrhagic virus subtype zaire. Osong Public Health Res. Perspect. 2011;2(1):3–7. doi: 10.1016/j.phrp.2011.04.001. [DOI] [PMC free article] [PubMed] [Google Scholar]
- Eurostat. Statistics database. 2014 January Available from: http://epp.eurostat.ec.europa.eu/portal/page/portal/statistics/search_database.
- Falk H. Illegal import of bushmeat and other meat products into Switzerland on commercial passenger flights. Revue Scientifique Et Technique-Office International Des Epizooties. 2013;32(3):727–739. doi: 10.20506/rst.32.2.2221. [DOI] [PubMed] [Google Scholar]
- Falzarano D. Infection with MERS-CoV causes lethal pneumonia in the common marmoset. Plos Pathog. 2014;10(8) doi: 10.1371/journal.ppat.1004250. [DOI] [PMC free article] [PubMed] [Google Scholar]
- FaoStat. Trade data. 2014 Januray Available from: http://faostat.fao.org/site/342/default.aspx.
- Faria N.R. Phylogeographical footprint of colonial history in the global dispersal of human immunodeficiency virus type 2 group A. J. Gen. Virol. 2012;93:889–899. doi: 10.1099/vir.0.038638-0. [DOI] [PMC free article] [PubMed] [Google Scholar]
- Faye O. Chains of transmission and control of Ebola virus disease in Conakry, Guinea, in 2014: an observational study. Lancet Infect. Dis. 2015;15(3):320–326. doi: 10.1016/S1473-3099(14)71075-8. [DOI] [PMC free article] [PubMed] [Google Scholar]
- Field H. Hendra virus infection dynamics in Australian fruit bats. Plos One. 2011;6(12) doi: 10.1371/journal.pone.0028678. [DOI] [PMC free article] [PubMed] [Google Scholar]
- Fisher-Hoch S.P. Lessons from nosocomial viral haemorrhagic fever outbreaks. Br. Med. Bull. 2005;73-74:123–137. doi: 10.1093/bmb/ldh054. [DOI] [PubMed] [Google Scholar]
- Fogarty R. Henipavirus susceptibility to environmental variables. Virus Res. 2008;132(1-2):140–144. doi: 10.1016/j.virusres.2007.11.010. [DOI] [PMC free article] [PubMed] [Google Scholar]
- Fooks A.R. European bat lyssaviruses: an emerging zoonosis. Epidemiol. Infect. 2003;131(3):1029–1039. doi: 10.1017/s0950268803001481. [DOI] [PMC free article] [PubMed] [Google Scholar]
- Francesconi P. Ebola hemorrhagic fever transmission and risk factors of contacts, Uganda. Emerging Infect. Dis. 2003;9(11):1430–1437. doi: 10.3201/eid0911.030339. [DOI] [PMC free article] [PubMed] [Google Scholar]
- Gear J.S.S. Outbreak of Marburg virus disease in Johannesburg. Br. Med. J. 1975;4(489-493) doi: 10.1136/bmj.4.5995.489. [DOI] [PMC free article] [PubMed] [Google Scholar]
- Geisbert T.W. Pathogenesis of Ebola hemorrhagic fever in Cynomolgus macaques - evidence that dendritic cells are early and sustained targets of infection. Am. J. Pathol. 2003;163(6):2347–2370. doi: 10.1016/S0002-9440(10)63591-2. [DOI] [PMC free article] [PubMed] [Google Scholar]
- Geisbert T.W. Marburg virus Angola infection of rhesus macaques: pathogenesis and treatment with recombinant nematode anticoagulant protein c2. J. Infect. Dis. 2007;196:S372–S381. doi: 10.1086/520608. [DOI] [PMC free article] [PubMed] [Google Scholar]
- Germain M. Proceedings of an International Colloquium on Ebola Virus Infection and Other Haemorrhagic Fevers held in Antwerp, Belgium, 6-8 December, 1977. 1976. Collection of mammals and arthropods during the epidemic of haemorrhagic fever in Zaire. [Google Scholar]
- Gibbens J.C., F.A., Houston C.W., Lester H., Gauntlett F.A. D2R2: an evidence-based decision support tool to aid prioritisation of animal health issues for government funding. Vet. Rec. 2016 doi: 10.1136/vr.103684. [DOI] [PubMed] [Google Scholar]
- Goldspink L.K., Edson D.W., Vidgen M.E., Bingham J., Field H.E., Smith C.S. Natural Hendra virus infection in flying-foxes - tissue tropism and risk factors. Plos One. 2015;10(6) doi: 10.1371/journal.pone.0128835. [DOI] [PMC free article] [PubMed] [Google Scholar]
- Gurley E.S. Person-to-person transmission of Nipah virus in a Bangladeshi community. Emerging Infect. Dis. 2007;13(7):1031–1037. doi: 10.3201/eid1307.061128. [DOI] [PMC free article] [PubMed] [Google Scholar]
- Halpin K. Isolation of Hendra virus from Pteropid bats: a natural reservoir of Hendra virus. J. Gen. Virol. 2000;81:1927–1932. doi: 10.1099/0022-1317-81-8-1927. [DOI] [PubMed] [Google Scholar]
- Halpin K. Pteropid bats are confirmed as the reservoir hosts of Henipaviruses: a comprehensive experimental study of virus transmission. Am. J. Trop. Med. Hyg. 2011;85(5):946–951. doi: 10.4269/ajtmh.2011.10-0567. [DOI] [PMC free article] [PubMed] [Google Scholar]
- Halpin K., Young P., Field H. Identification of likely natural hosts for equine morbillivirus. Communicable Dis. Intell. 1996;20(22):476. [Google Scholar]
- Hanna J.N. Hendra virus infection in a veterinarian. Med. J. Aust. 2006;185(10):562–564. doi: 10.5694/j.1326-5377.2006.tb00692.x. [DOI] [PMC free article] [PubMed] [Google Scholar]
- Hayman D.T.S. Long-term survival of an urban fruit bat seropositive for Ebola and Lagos bat viruses. Plos One. 2010;5(8) doi: 10.1371/journal.pone.0011978. [DOI] [PMC free article] [PubMed] [Google Scholar]
- Hayman D.T.S. Demography of straw-colored fruit bats in Ghana. J. Mammal. 2012;93(5):1393–1404. doi: 10.1644/11-MAMM-A-270.1. [DOI] [PMC free article] [PubMed] [Google Scholar]
- Hemida M.G. Seroepidemiology of Middle East respiratory syndrome (MERS) coronavirus in Saudi Arabia (1993) and Australia (2014) and characterisation of assay specificity. Eurosurveillance. 2014;19(23):2–7. doi: 10.2807/1560-7917.es2014.19.23.20828. [DOI] [PMC free article] [PubMed] [Google Scholar]
- Hensley L.E. Pathogenesis of Marburg hemorrhagic fever in Cynomolgus Macaques. J. Infect. Dis. 2011;204:S1021–S1031. doi: 10.1093/infdis/jir339. [DOI] [PubMed] [Google Scholar]
- Herzig-Straschil B.R., Robinson G.A. On the ecology of the fruit bat, rousettus aegyptiacus leachi (A. Smith, 1829) in the Tsitsikama Coastal National Park. Koedoe. 1978;21(1):101–110. [Google Scholar]
- Hjertqvist M., Johansson A., Svensson N., Abom P.E, Magnusson C., Olsson M., Hedlund k.O., Andersson Y. Four outbreaks of norovirus gastroenteritis after consuming raspberries, Sweden, June-August 2006. Euro Surveill. 2006;11(36):3038. doi: 10.2807/esw.11.36.03038-en. [DOI] [PubMed] [Google Scholar]
- Hooper P.T., Westbury H.A., Russell G.M. The lesions of experimental equine morbillivirus disease in cats and guinea pigs. Vet. Pathol. 1997;34(4):323–329. doi: 10.1177/030098589703400408. [DOI] [PubMed] [Google Scholar]
- IEDCR. Nipah situation in 2014. October Update on February 28, 2014. Available from: http://www.iedcr.org/pdf/files/nipah/Nipah%20Infection_27.02.2014.pdf.
- Ignatiev G.M. Immune and pathophysiological processes in baboons experimentally infected with Ebola virus adapted to guinea pigs. Immunol. Lett. 2000;71(2):131–140. doi: 10.1016/s0165-2478(99)00169-8. [DOI] [PubMed] [Google Scholar]
- Jaax N. Transmission of Ebola virus (Zaire strain) to uninfected control monkeys in a biocontainment laboratory. Lancet. 1995;346(8991-2):1669–1671. doi: 10.1016/s0140-6736(95)92841-3. [DOI] [PubMed] [Google Scholar]
- Jahrling P.B. Experimental infection of Cynomolgus macaques with Ebola-Reston filoviruses from the 1989-1990 US epizootic. Arch. Virol. 1996:115–134. doi: 10.1007/978-3-7091-7482-1_11. [DOI] [PubMed] [Google Scholar]
- Johnson E. Lethal experimental infections of Rhesus-monkeys by aerosolized Ebola-virus. Int. J. Exp. Pathol. 1995;76(4):227–236. [PMC free article] [PubMed] [Google Scholar]
- Johnson E.D. Characterization of a new Marburg virus isolated from a 1987 fatal case in Kenya. Arch. Virol. 1996;11:101–114. doi: 10.1007/978-3-7091-7482-1_10. [DOI] [PubMed] [Google Scholar]
- Khan S.U., Gurley E.S., Hossain M.J., Nahar N., Sharker MAY, Luby S.P. A randomized controlled trial of interventions to impede date palm sap contamination by bats to prevent Nipah virus transmission in Bangladesh. Plos One. 2012;7(8) doi: 10.1371/journal.pone.0042689. [DOI] [PMC free article] [PubMed] [Google Scholar]
- Kissling R.E., Murphy F.A., Henderson B.E. Marburg virus. Ann. New York Acad. Sci. 1970;174(2):932–945. doi: 10.1111/j.1749-6632.1970.tb45614.x. [DOI] [PubMed] [Google Scholar]
- Kobinger G.P. Replication, pathogenicity, shedding, and transmission of Zaire Ebolavirus in Pigs. J. Infect. Dis. 2011;204(2):200–208. doi: 10.1093/infdis/jir077. [DOI] [PubMed] [Google Scholar]
- Kortepeter M.G. Real-time monitoring of cardiovascular function in Rhesus macaques infected with Zaire Ebolavirus. J. Infect. Dis. 2011;204:S1000–S1010. doi: 10.1093/infdis/jir337. [DOI] [PubMed] [Google Scholar]
- Kuhn J.H. Virus nomenclature below the species level: a standardized nomenclature for laboratory animal-adapted strains and variants of viruses assigned to the family Filoviridae. Arch. Virol. 2013;158(6):1425–1432. doi: 10.1007/s00705-012-1594-2. [DOI] [PMC free article] [PubMed] [Google Scholar]
- Kung N., McLaughlin A., Taylor M., Moloney B., Wright T., Field H. Hendra virus and horse owners - risk perception and management. Plos One. 2013;8(11) doi: 10.1371/journal.pone.0080897. [DOI] [PMC free article] [PubMed] [Google Scholar]
- Kuzmin I.V. Marburg virus in fruit bat, Kenya. Emerging Infect. Dis. 2010;16(2):352–354. doi: 10.3201/eid1602.091269. [DOI] [PMC free article] [PubMed] [Google Scholar]
- Langevin P., Barclay R.M.R. Hyspignathus monstrosus. Mamm. Species. 1990;357:1–4. [Google Scholar]
- Leirs H. Search for the Ebola virus reservoir in Kikwit, Democratic Republic of the Congo: reflections on a vertebrate collection. J. Infect. Dis. 1999;179:S155–S163. doi: 10.1086/514299. [DOI] [PubMed] [Google Scholar]
- Lekone P.E., Finkenstadt B.F. Statistical inference in a stochastic epidemic SEIR model with control intervention: Ebola as a case study. Biometrics. 2006;62(4):1170–1177. doi: 10.1111/j.1541-0420.2006.00609.x. [DOI] [PubMed] [Google Scholar]
- Leroy E.M. Fruit bats as reservoirs of Ebola virus. Nature. 2005;438(7068):575–576. doi: 10.1038/438575a. [DOI] [PubMed] [Google Scholar]
- Leroy E.M. Human Ebola outbreak resulting from direct exposure to fruit bats in Luebo, Democratic Republic of Congo, 2007. Vector-Borne Zoonotic Dis. 2009;9(6):723–728. doi: 10.1089/vbz.2008.0167. [DOI] [PubMed] [Google Scholar]
- Li J. Dissemination of Cefotaxime-M-Producing Escherichia coli isolates in poultry farms, but not swine farms, in China. Foodborne Pathog. Dis. 2010;7(11):1387–1392. doi: 10.1089/fpd.2010.0581. [DOI] [PubMed] [Google Scholar]
- Li M., Embury-Hyatt C., Weingartl H.M. Experimental inoculation study indicates swine as a potential host for Hendra virus. Vet. Res. 2010;41(3) doi: 10.1051/vetres/2010005. [DOI] [PMC free article] [PubMed] [Google Scholar]
- Luby S.P. Foodborne transmission of Nipah virus, Bangladesh. Emerging Infect. Dis. 2006;12(12):1888–1894. doi: 10.3201/eid1212.060732. [DOI] [PMC free article] [PubMed] [Google Scholar]
- MacNeil A. Proportion of deaths and clinical features in Bundibugyo Ebola virus infection, Uganda. Emerging Infect. Dis. 2010;16(12):1969–1972. doi: 10.3201/eid1612.100627. [DOI] [PMC free article] [PubMed] [Google Scholar]
- MAF, Import Risk Analysis: Horses and Horse Semen. Biosecurity Authority, Ministry of Agriculture and Forestry, Wellington, New Zealand, 2000.
- Maganga G.D. Is Marburg virus enzootic in Gabon? J. Infect. Dis. 2011;204:S800–S803. doi: 10.1093/infdis/jir358. [DOI] [PubMed] [Google Scholar]
- Marsh G.A. Experimental infection of horses with Hendra virus/Australia/Horse/2008/Redlands. Emerging Infect. Dis. 2011;17(12):2232–2238. doi: 10.3201/eid1712.111162. [DOI] [PMC free article] [PubMed] [Google Scholar]
- Martin G., P.R., Chen C., Kault D., Selleck P., Skerratt L.F. Hendra virus survival does not explain spillover patterns and implicates relatively direct transmission routes from flying foxes to horses. J Gen Virol. 2015;96(6):1229–1237. doi: 10.1099/vir.0.000073. [DOI] [PMC free article] [PubMed] [Google Scholar]
- McQuiston J.H. Importation of dogs into the United States: Risks from rabies and other zoonotic diseases. Zoonoses Public Health. 2008;55(8-10):421–426. doi: 10.1111/j.1863-2378.2008.01117.x. [DOI] [PubMed] [Google Scholar]
- Memish Z.A., Mishra N., Olival K.J. Middle East respiratory syndrome coronavirus in bats, Saudi Arabia. Emerging Infect. Dis. 2013;19(11):1819–1823. doi: 10.3201/eid1911.131172. [DOI] [PMC free article] [PubMed] [Google Scholar]
- Meyer B. Antibodies against MERS coronavirus in dromedaries, United Arab Emirates, 2003 and 2013. Emerging Infect. Dis. 2014;20(4):552–559. doi: 10.3201/eid2004.131746. [DOI] [PMC free article] [PubMed] [Google Scholar]
- Middleton D. Hendra virus vaccine, a one health approach to protecting horse, human, and environmental health. Emerging Infect. Dis. 2014;20(3):372–379. doi: 10.3201/eid2003.131159. [DOI] [PMC free article] [PubMed] [Google Scholar]
- Morvan J.M. Identification of Ebola virus sequences present as RNA or DNA in organs of terrestrial small mammals of the Central African Republic. Microbes Infect. 1999;1(14):1193–1201. doi: 10.1016/s1286-4579(99)00242-7. [DOI] [PubMed] [Google Scholar]
- Mullis L. Stability of bovine coronavirus on lettuce surfaces under household refrigeration conditions. Food Microbiol. 2012;30(1):180–186. doi: 10.1016/j.fm.2011.12.009. [DOI] [PMC free article] [PubMed] [Google Scholar]
- Munster V.J., Adney D.R., van Doremalen N. Replication and shedding of MERS-CoV in Jamaican fruit bats (Artibeus jamaicensis) Sci. Rep. 2016;6 doi: 10.1038/srep21878. [DOI] [PMC free article] [PubMed] [Google Scholar]
- Mur L., Martínez-López B., Costard S. Modular framework to assess the risk of African swine fever virus entry into the European Union. BMC Vet. Res. 2014;10 doi: 10.1186/1746-6148-10-145. [DOI] [PMC free article] [PubMed] [Google Scholar]
- Nahar N., Mondal U.K., Hossain M.J. Piloting the promotion of bamboo skirt barriers to prevent Nipah virus transmission through date palm sap in Bangladesh. Global Health Promotion. 2014;21(4):7–15. doi: 10.1177/1757975914528249. [DOI] [PMC free article] [PubMed] [Google Scholar]
- Ndambi R. Epidemiologic and clinical aspects of the Ebola virus epidemic in Mosango, Democratic Republic of the Congo, 1995. J. Infect. Dis. 1999;179:S8–S10. doi: 10.1086/514297. [DOI] [PubMed] [Google Scholar]
- Ng S., Basta N.E., Cowling B.J. Association between temperature, humidity and Ebolavirus disease outbreaks in Africa, 1976 to 2014. Eurosurveillance. 2014;19(35):16–26. doi: 10.2807/1560-7917.es2014.19.35.20892. [DOI] [PubMed] [Google Scholar]
- OIE . OIE; Paris, France: 2004. Handbook on Import Risk Analysis for Animals and Animal Products. [Google Scholar]
- Okware S.I. An outbreak of Ebola in Uganda. Trop. Med. Int. Health. 2002;7(12):1068–1075. doi: 10.1046/j.1365-3156.2002.00944.x. [DOI] [PubMed] [Google Scholar]
- Olival K.J. Ebola virus antibodies in fruit bats, Bangladesh. Emerging Infect. Dis. 2013;19(2):270–273. doi: 10.3201/eid1902.120524. [DOI] [PMC free article] [PubMed] [Google Scholar]
- Parashar U.D. Case-control study of risk factors for human infection with a new zoonotic paramyxovirus, Nipah virus, during a 1998-1999 outbreak of severe encephalitis in Malaysia. J. Infect. Dis. 2000;181(5):1755–1759. doi: 10.1086/315457. [DOI] [PubMed] [Google Scholar]
- Park H.Y. Epidemiological investigation of MERS-CoV spread in a single hospital in South Korea, May to June 2015. Eurosurveillance. 2015;20(25):2–6. doi: 10.2807/1560-7917.es2015.20.25.21169. [DOI] [PubMed] [Google Scholar]
- Pavlin B.I. Calculation of incubation period and serial interval from multiple outbreaks of Marburg virus disease. BMC Res. Notes. 2014;7:906. doi: 10.1186/1756-0500-7-906. [DOI] [PMC free article] [PubMed] [Google Scholar]
- Piercy T.J. The survival of filoviruses in liquids, on solid substrates and in a dynamic aerosol. J. Appl. Microbiol. 2010;109(5):1531–1539. doi: 10.1111/j.1365-2672.2010.04778.x. [DOI] [PubMed] [Google Scholar]
- Pigott D.M. Mapping the zoonotic niche of Ebola virus disease in Africa. Elife. 2014;3 doi: 10.7554/eLife.04395. [DOI] [PMC free article] [PubMed] [Google Scholar]
- Playford E.G. Human Hendra virus encephalitis associated with equine outbreak, Australia, 2008. Emerging Infect. Dis. 2010;16(2):219–223. doi: 10.3201/eid1602.090552. [DOI] [PMC free article] [PubMed] [Google Scholar]
- Plowright R.K., Eby P., Hudson P.J. Ecological dynamics of emerging bat virus spillover. Proce. R. Soc. B-Biol. Sci. 2015;282(1798) doi: 10.1098/rspb.2014.2124. [DOI] [PMC free article] [PubMed] [Google Scholar]
- Poletto C. Assessment of the Middle East respiratory syndrome coronavirus (MERS-CoV) epidemic in the Middle East and risk of international spread using a novel maximum likelihood analysis approach. Eurosurveillance. 2014;19(23):13–22. doi: 10.2807/1560-7917.es2014.19.23.20824. [DOI] [PubMed] [Google Scholar]
- Pourrut X., Souris M., Towner J.S. Spatial and temporal patterns of Zaire ebolavirus antibody prevalence in the possible reservoir bat species. J. Infect. Dis. 2007;196:S176–S183. doi: 10.1086/520541. [DOI] [PubMed] [Google Scholar]
- Pourrut X. Large serological survey showing cocirculation of Ebola and Marburg viruses in Gabonese bat populations, and a high seroprevalence of both viruses in Rousettus aegyptiacus. BMC Infect. Dis. 2009;9 doi: 10.1186/1471-2334-9-159. [DOI] [PMC free article] [PubMed] [Google Scholar]
- Puzelli S. Investigation of an imported case of Middle East respiratory syndrome coronavirus (MERS-CoV) infection in Florence, Italy, May to June 2013. Eurosurveillance. 2013;18(34):2–5. doi: 10.2807/1560-7917.es2013.18.34.20564. [DOI] [PubMed] [Google Scholar]
- Qiu X. Establishment and characterization of a lethal mouse model for the Angola strain of Marburg virus. J. Virol. 2014;88(21):12703–12714. doi: 10.1128/JVI.01643-14. [DOI] [PMC free article] [PubMed] [Google Scholar]
- Raj V.S. Isolation of MERS coronavirus from a dromedary camel, Qatar, 2014. Emerging Infect. Dis. 2014;20(8) doi: 10.3201/eid2008.140663. [DOI] [PMC free article] [PubMed] [Google Scholar]
- Republic of Uganda, Ministry of Tourism, Wildlife and Antiquities 2013 Sector statistical abstract. 2013.
- Reusken C.B. Middle East respiratory syndrome coronavirus (MERS-CoV) RNA and neutralising antibodies in milk collected according to local customs from dromedary camels, Qatar, April 2014. Eurosurveillance. 2014;19(23):8–12. doi: 10.2807/1560-7917.es2014.19.23.20829. [DOI] [PubMed] [Google Scholar]
- Reusken C.B.E.M. Geographic distribution of MERS coronavirus among dromedary camels, Africa. Emerging Infect. Dis. 2014;20(8):1370–1374. doi: 10.3201/eid2008.140590. [DOI] [PMC free article] [PubMed] [Google Scholar]
- Reuss A. Contact investigation for imported case of Middle East respiratory syndrome, Germany. Emerging Infect. Dis. 2014;20(4):620–625. doi: 10.3201/eid2004.131375. [DOI] [PMC free article] [PubMed] [Google Scholar]
- Rivers C.M. Modeling the impact of interventions on an epidemic of Ebola in Sierra Leone and Liberia. PLoS Curr. 2014;6 doi: 10.1371/currents.outbreaks.fd38dd85078565450b0be3fcd78f5ccf. [DOI] [PMC free article] [PubMed] [Google Scholar]
- Rolin A.I., Berrang-Ford L., Kulkarni M.A. The risk of Rift Valley fever virus introduction and establishment in the United States and European Union. Emerging Microbes Infect. 2013;2 doi: 10.1038/emi.2013.81. [DOI] [PMC free article] [PubMed] [Google Scholar]
- Rouquet P. Wild animal mortality monitoring and human Ebola outbreaks, Gabon and Republic of Congo, 2001-2003. Emerging Infect. Dis. 2005;11(2):283–290. doi: 10.3201/eid1102.040533. [DOI] [PMC free article] [PubMed] [Google Scholar]
- Ryabchikova E.I., Kolesnikova L.V., Luchko S.V. An analysis of features of pathogenesis in two animal models of Ebola virus infection. J. Infect. Dis. 1999;179:S199–S202. doi: 10.1086/514293. [DOI] [PubMed] [Google Scholar]
- Scanlan J.C., Kung N.Y., Selleck P.W., Field H.E. Survival of Hendra virus in the environment: modelling the effect of temperature. Eco Health. 2014 doi: 10.1007/s10393-014-0920-4. Published online. [DOI] [PMC free article] [PubMed] [Google Scholar]
- Selvey L.A. Infection of humans and horses by a newly described morbillivirus. Med. J. Aust. 1995;162(12):642–645. doi: 10.5694/j.1326-5377.1995.tb126050.x. [DOI] [PubMed] [Google Scholar]
- Simons R.R., H.V., Gale P., Kosmider R.D., Breed A.C., Snary E.L. A generic quantitative risk assessment framework for the entry of bat-borne zoonotic viruses into the European Union. Plos One. 2016;11(10) doi: 10.1371/journal.pone.0165383. [DOI] [PMC free article] [PubMed] [Google Scholar]
- Simons R.R.L. Potential for introduction of bat-borne zoonotic viruses into the EU: a review. Viruses-Basel. 2014;6(5):2084–2121. doi: 10.3390/v6052084. [DOI] [PMC free article] [PubMed] [Google Scholar]
- Simpson D.I.H. Marburg agent disease: in monkeys. Trans. R. Soc. Trop. Med. Hyg. 1969;63(3):303–309. doi: 10.1016/0035-9203(69)90002-9. [DOI] [PubMed] [Google Scholar]
- Smith C.S. Twenty years of Hendra virus: laboratory submission trends and risk factors for infection in horses. Epidemiol. Infect. 2016;144(15):3176–3183. doi: 10.1017/S0950268816001400. [DOI] [PMC free article] [PubMed] [Google Scholar]
- Smith D.H. Marburg-virus disease in Kenya. Lancet. 1982;1(8276):816–820. doi: 10.1016/s0140-6736(82)91871-2. [DOI] [PubMed] [Google Scholar]
- Smith I. Identifying Hendra virus diversity in Pteropid bats. Plos One. 2011;6(9) doi: 10.1371/journal.pone.0025275. [DOI] [PMC free article] [PubMed] [Google Scholar]
- Smith I., Wang L.-F. Bats and their virome: an important source of emerging viruses capable of infecting humans. Curr. Opin. Virol. 2013;3(1):84–91. doi: 10.1016/j.coviro.2012.11.006. [DOI] [PMC free article] [PubMed] [Google Scholar]
- Smith L.M. Interferon-beta therapy prolongs survival in Rhesus macaque models of Ebola and Marburg hemorrhagic Fever. J. Infect. Dis. 2013;208(2):310–318. doi: 10.1093/infdis/jis921. [DOI] [PMC free article] [PubMed] [Google Scholar]
- Snary E.L. Qualitative release assessment to estimate the likelihood of Henipavirus entering the United Kingdom. Plos One. 2012;7(2) doi: 10.1371/journal.pone.0027918. [DOI] [PMC free article] [PubMed] [Google Scholar]
- Su S. MERS in South Korea and China: a potential outbreak threat? Lancet. 2015;385(9985):2349–2350. doi: 10.1016/S0140-6736(15)60859-5. [DOI] [PMC free article] [PubMed] [Google Scholar]
- Suárez-Rodríguez B, Santos S., Saravia G., Sánchez-Gómez A., Sierra M.J., Amela C., Gutierrez-Avila G., Jané M., Canales A.J., Ripalda J., Lopaz M.A., Sáez J.L., García-Villacieros E., Echevarría J.E., Vázquez S., Rodríguez-Valín E., Simón F. case of rabies in a dog imported to Spain from Morocco in June 2013. Temporary loss of rabies free Certificate. Rabies Bull. Europe. 2013;37(2):5–9. [Google Scholar]
- Swanepoel R. Experimental inoculation of plants and animals with Ebola virus. Emerging Infect. Dis. 1996;2(4):321–325. doi: 10.3201/eid0204.960407. [DOI] [PMC free article] [PubMed] [Google Scholar]
- Swanepoel R. Studies of reservoir hosts for Marburg virus. Emerging Infect. Dis. 2007;13(12):1847–1851. doi: 10.3201/eid1312.071115. [DOI] [PMC free article] [PubMed] [Google Scholar]
- Team W.E.R. Ebola virus disease in West Africa–the first 9 months of the epidemic and forward projections. New. Engl. J. Med. 2014;371:1481–1495. doi: 10.1056/NEJMoa1411100. [DOI] [PMC free article] [PubMed] [Google Scholar]
- Team W.E.R. West African Ebola epidemic after one year–slowing but not yet under control. New. Engl. J. Med. 2015;372:584–587. doi: 10.1056/NEJMc1414992. [DOI] [PMC free article] [PubMed] [Google Scholar]
- Thi E.P. Marburg virus infection in nonhuman primates: Therapeutic treatment by lipid-encapsulated siRNA. Sci. Transl. Med. 2014;6(250) doi: 10.1126/scitranslmed.3009706. [DOI] [PMC free article] [PubMed] [Google Scholar]
- Timen A. Response to imported case of Marburg hemorrhagic fever, the Netherlands. Emerging Infect. Dis. 2009;15(8):1171–1175. doi: 10.3201/eid1508.090051. [DOI] [PMC free article] [PubMed] [Google Scholar]
- Towner J.S. Marburg virus infection detected in a common African bat. Plos One. 2007;2(8) doi: 10.1371/journal.pone.0000764. [DOI] [PMC free article] [PubMed] [Google Scholar]
- Towner J.S. Isolation of genetically diverse Marburg viruses from Egyptian fruit bats. Plos Pathogens. 2009;5(7) doi: 10.1371/journal.ppat.1000536. [DOI] [PMC free article] [PubMed] [Google Scholar]
- TRACES. Trade control and expert system. 2014 January Available from: https://webgate.ec.europa.eu/sanco/traces/.
- Twenhafel N.A. Pathology of experimental aerosol Zaire Ebolavirus infection in Rhesus macaques. Vet. Pathol. 2013;50(3):514–529. doi: 10.1177/0300985812469636. [DOI] [PubMed] [Google Scholar]
- Van Borm S. Highly pathogenic H5N1 influenza virus in smuggled Thai eagles, Belgium. Emerging Infect. Dis. 2005;11(5):702–705. doi: 10.3201/eid1105.050211. [DOI] [PMC free article] [PubMed] [Google Scholar]
- van Doremalen N. Stability of Middle East Respiratory syndrome coronavirus in milk. Emerging Infect. Dis. 2014;20(7):1263–1264. doi: 10.3201/eid2007.140500. [DOI] [PMC free article] [PubMed] [Google Scholar]
- van Doremalen N., Bushmaker T., Munster V.J. Stability of Middle East respiratory syndrome coronavirus (MERS-CoV) under different environmental conditions. Eurosurveillance. 2013;18(38):7–10. doi: 10.2807/1560-7917.es2013.18.38.20590. [DOI] [PubMed] [Google Scholar]
- Van Kerkhove M.D. A review of epidemiological parameters from Ebola outbreaks to inform early public health decision-making. Sci. Data. 2015;2 doi: 10.1038/sdata.2015.19. [DOI] [PMC free article] [PubMed] [Google Scholar]
- Wamala J.F. Ebola Hemorrhagic fever associated with novel virus strain, Uganda, 2007-2008. Emerging Infect. Dis. 2010;16(7):1087–1092. doi: 10.3201/eid1607.091525. [DOI] [PMC free article] [PubMed] [Google Scholar]
- Weingartl H.M. Transmission of Ebola virus from pigs to non-human primates. Nature. 2012;2(811):1. doi: 10.1038/srep00811. [DOI] [PMC free article] [PubMed] [Google Scholar]
- Weingartl H.M., Nfon C., Kobinger G. Review of Ebola virus infections in domestic animals. Dev. Biol. 2013;135:211–218. doi: 10.1159/000178495. [DOI] [PubMed] [Google Scholar]
- WHO. Case of Marburg haemorrhagic fever imported into the Netherlands from Uganda. 2008 January Available from: http://www.who.int/csr/don/2008_07_10/en/.
- WHO, Marburg virus disease - Uganda. 2014.
- WHO. MERS-CoV summary updates. 2014 [cited 2014 September Available from: http://www.who.int/csr/disease/coronavirus_infections/archive_updates/en/.
- Williamson M.M. Transmission studies of Hendra virus (equine morbillivirus) in fruit bats, horses and cats. Aust. Vet. J. 1998;76(12):813–818. doi: 10.1111/j.1751-0813.1998.tb12335.x. [DOI] [PubMed] [Google Scholar]
- Williamson M.M. Experimental Hendra virus infection in pregnant guinea-pigs and fruit bats (Pteropus poliocephalus) J. Comp. Pathol. 2000;122(2-3):201–207. doi: 10.1053/jcpa.1999.0364. [DOI] [PubMed] [Google Scholar]
- Yao Y. An animal model of MERS produced by infection of Rhesus macaques with MERS coronavirus. J. Infect. Dis. 2014;209(2):236–242. doi: 10.1093/infdis/jit590. [DOI] [PMC free article] [PubMed] [Google Scholar]
- Yepiz-Gomez M.S., Gerba C.P., Bright K.R. Survival of respiratory viruses on fresh produce. Food Environ. Virol. 2013;5(3):150–156. doi: 10.1007/s12560-013-9114-4. [DOI] [PMC free article] [PubMed] [Google Scholar]
- Yuan J. Serological evidence of Ebolavirus infection in bats, China. Virol. J. 2012;9 doi: 10.1186/1743-422X-9-236. [DOI] [PMC free article] [PubMed] [Google Scholar]