Abstract
Maf1 is a conserved inhibitor of RNA polymerase III (Pol III) that influences phenotypes from metabolic efficiency to lifespan. Here, we present a 3.3 Å cryo-EM structure of yeast Maf1 bound to Pol III, establishing that Maf1 sequesters Pol III elements involved in transcription initiation and binds the mobile C34 WH2 domain, sealing off the active site. The Maf1 binding site overlaps with that of TFIIIB in the pre-initiation complex.
Keywords: RNA polymerase III, Pol III, Maf1, transcription repression, electron cryo-microscopy
RNA polymerase III transcribes tRNAs, 5S ribosomal RNA, U6 spliceosomal RNA and other small, folded RNAs involved in fundamental cellular processes. Transcription of tRNAs and 5S rRNA consumes an estimated 15% of the nucleotides used by dividing cells for RNA synthesis1. Upregulation of Pol III transcription is also required for oncogenic transformation2–5. Pol III transcription is hence tightly regulated in response to stress and growth signals, and several signaling pathways converge to modulate Pol III function, including its central negative regulator Maf12,6. Maf1 is conserved across eukaryotes, and has been studied in yeast, flies, worms, plants, parasites and mammalian systems (reviewed in 7,8). Modulation of Maf1 levels or its phosphorylation status has been reported to affect life span in S. pombe9, worms10, and fruit flies11, although the underlying mechanisms appear to be complex and deletion of Maf1 has opposing effects in different animals. Whole body knockout of Maf1 in mice results in a striking lean body composition and resistance to diet-induced obesity12. These phenotypes are partly due to metabolic inefficiencies driven by a futile cycle of tRNA synthesis and degradation12–14. Maf1 expression also promotes differentiation of certain cell types15.
Maf1 activity is regulated by phosphorylation in response to stress and nutrient availability1,6. Phosphosites are located in an internal, poorly conserved region. Dephosphorylated Maf1 accumulates in the nucleus and binds Pol III1. Crystal structures of human16 and plant17 Maf1, and a low resolution (~20 Å) electron-microscopy reconstruction of Maf1 bound to Pol III16 have been described, however, despite its central role in organismal physiology and in Pol III regulation, the precise mechanism of Maf1-mediated repression remains elusive. Here, we present a 3.3 Å cryo-EM reconstruction of the S. cerevisiae Maf1-Pol III complex, which differs from the previous proposed model of Maf1 binding and explains the molecular mechanism of Pol III inhibition.
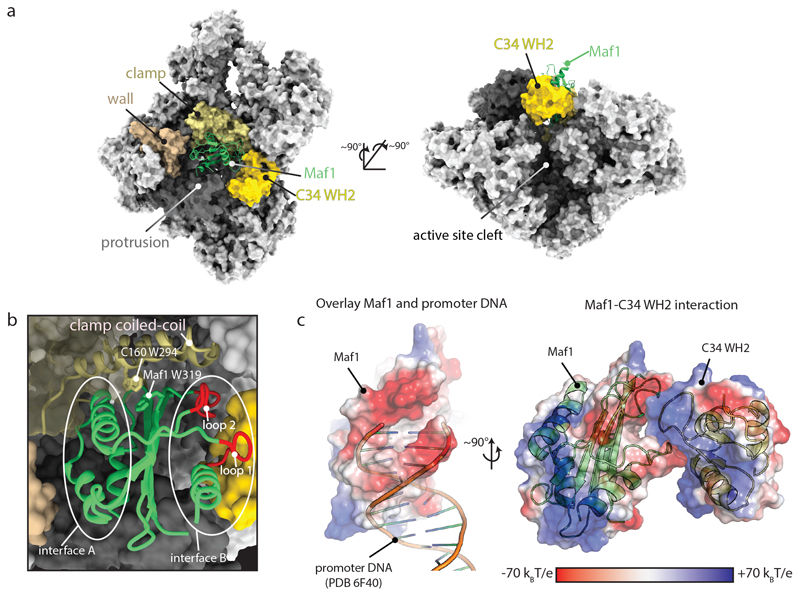
We assembled a complex of yeast Pol III and a recombinant Maf1 construct lacking an internal non-conserved region that is predicted to be disordered (Maf1-id, Δ64-194). Maf1-id is phosphoregulated normally and is active in Pol III repression in vivo18 and shows improved solubility at low salt, which was critical for the formation of a stable Maf1-Pol III complex. A cryo-EM reconstruction at 3.25 Å was determined that allowed atomic modeling (Fig. 1, Extended Data Fig. 1 and 2, Suppl. Table 1). The Pol III core was resolved at better than 3 Å, while local resolution for Maf1 density varied between 3.6 and 4.3 Å (Extended Data Fig. 1). Yeast Maf1 contains a central beta sheet sandwiched by three helices on one side (interface A) and a single helix and two loops on the other side (interface B) (Fig. 1) and is very similar to human Maf116 with a Cα rmsd of 2.4 Å. Maf1 binds Pol III between the protrusion domain, the wall domain and the clamp coiled-coil helices, with the Maf1 interface A oriented towards the wall (Fig. 1). A prominent tryptophan residue (W294 in C160) of the Pol III clamp coiled-coil inserts into a central furrow of Maf1, where it stacks with Maf1 W319 (Fig. 1b). Interestingly, C160 W294 is part of a Pol III-specific, highly conserved ‘template strand pocket’19 involved in DNA unwinding and transcription initiation. Maf1 W319 is invariantly conserved (Extended Data Fig. 3), and an aromatic amino acid (W or Y) in the template strand pocket (C160 W294) is also conserved19, suggesting that the aromatic stacking interaction may stabilize Maf1 binding.
Fig. 1. Structure of the Maf1-Pol III complex.
a, Pol III is shown as a surface and Maf1 in ribbon representation. Maf1 (green) is bound between the clamp (ochre), wall (beige), protrusion (dark grey) and C34 WH2 domain (yellow). b, Close-up of the Maf1 binding site, with elements referred to in the text labelled. c, Maf1 loops 1 and 2 mimic DNA and bind the mobile C34 WH2 domain.
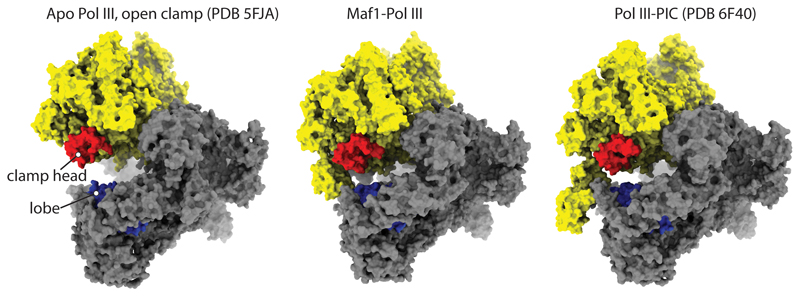
On the opposite side of the wall, the mobile C34 winged helix 2 (WH2) domain becomes ordered and interacts with Maf1 interface B. Concomitant with the ordering of the C34 WH2, Pol III adopts a closed clamp state, resembling the pre-initiation complex (PIC)19–21 (Extended Data Fig. 4).
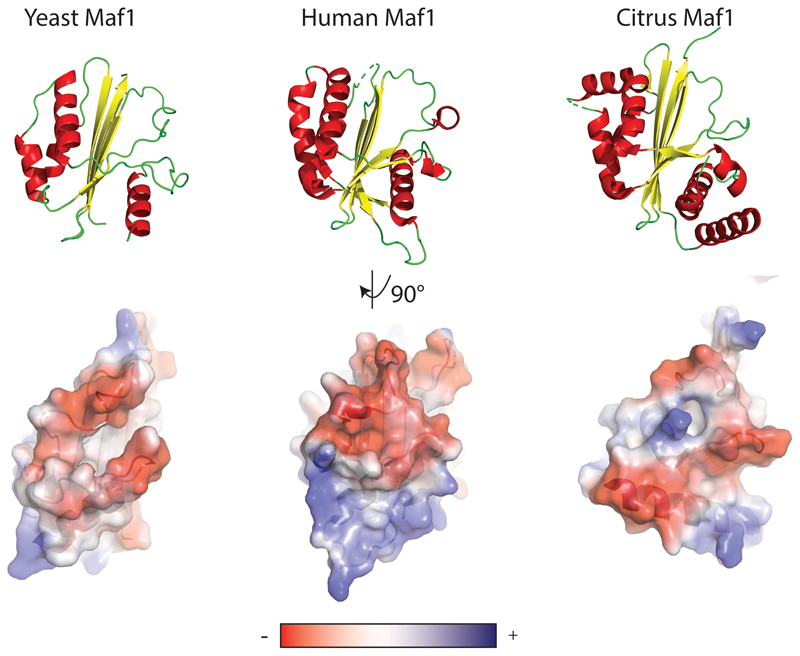
Mapping the electrostatic potential of Maf1 reveals a striking feature of interface B. Two loops, comprising residues 247-256 (loop 1) and residues 306-315 (loop 2), are negatively charged (Fig. 1c). Superposition of the Maf1-Pol III with the Pol III PIC (PDB 6F4020) shows that the DNA partially overlaps with these loops, and that interface B is a near-perfect mimic of one turn of B-DNA backbone (Fig. 1c). The C34 WH2 binds this interface by inserting its positively charged ’wing’ between the two loops. Comparison to Homo sapiens and Citrus sinensis Maf1 shows a good conservation of loop 1 and of the negative charge in loop 2, arguing that the mechanism of inhibition is also conserved (Extended Data Fig. 3 and 5).
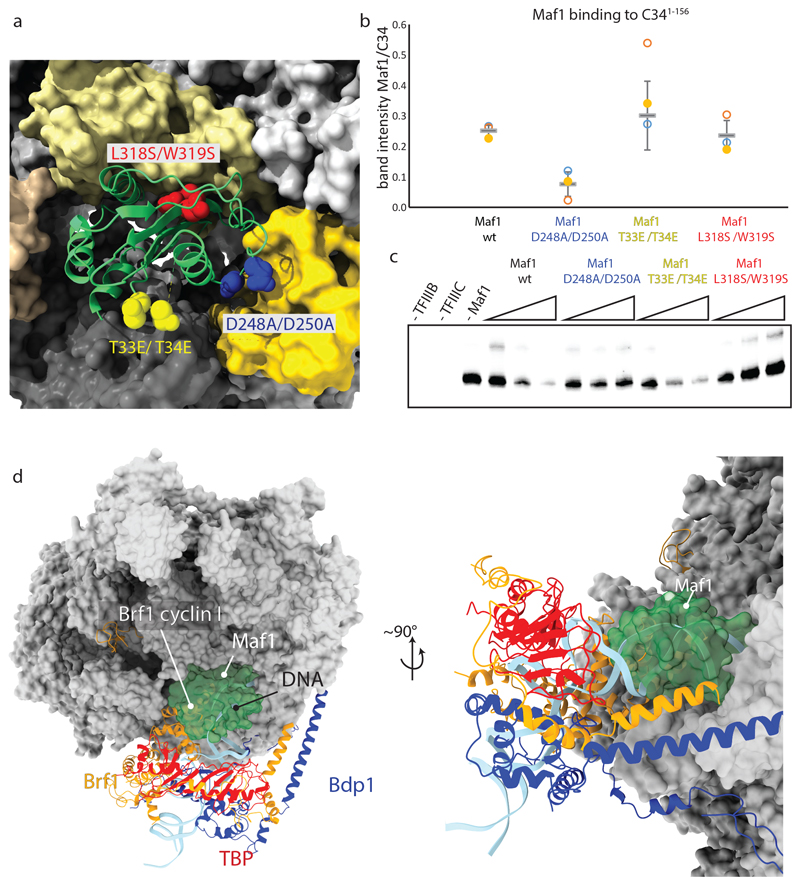
To validate the structure, we generated three mutants of Maf1 that we expected to show reduced binding to Pol III (Fig. 2a). Maf1 L318S/W319S disrupts the aromatic stacking and hydrophobic interaction between the Pol III clamp coiled-coil and the Maf1 furrow. Maf1 T33E/T34E should cause a clash between Maf1 and the Pol III protrusion. A previously described D248A/D250A variant18 reduces the negative charge in the DNA-mimicking loop 1. In pull-down assays with recombinant C341-156, which comprises the two N-terminal C34 WH domains, only the Maf1 D248A/D250A mutant showed reduced binding, as expected (Fig. 2b). In an in vitro transcription assay, the D248A/D250A and L318S/W319S mutants show impaired transcription inhibition at increasing concentrations of Maf1 (Fig. 2c), highlighting the importance of the aromatic stacking interaction and the DNA-mimicking acidic loops. This is in line with the finding that the D248A/D250A mutant is inactive in vivo18. However, the T33E/T34E mutant inhibits transcription similarly as the wild-type protein, indicating that the bulkier amino acids at these positions can be accommodated.
Fig. 2. Structure-guided mutagenesis confirms the mechanism of transcription inhibition.
a, Location of the introduced mutations. b, Quantification of Maf1-id binding to C34 1-156 as determined from three independent pull-down experiments. The centerlines represent the mean and vertical error bars represent the standard deviation of the mean. c, In vitro transcription assay using the His-tDNA template comparing inhibition efficiency of Maf1-id wt and Maf1-id mutant proteins. Data for panels b and c are available as source data. d, Maf1 clashes with TFIIIB and DNA in the PIC. Superposition of the Maf1-Pol III structure reported here and the Pol III pre-initiation complex (PDB 6F40) in two views. Maf1 is shown in green transparent surface and TFIIIB and promoter DNA in ribbon representation.
To establish how binding of Maf1 inhibits transcription initiation, we overlaid the structure of Maf1-Pol III with the Pol III PIC19–21 and note that Maf1 clashes extensively with the cyclin I domain of the Brf1 subunit of TFIIIB and with the double-stranded DNA near the upstream edge of the transcription bubble (Fig. 2d). This explains why binding of Maf1 and TFIIIB is mutually exclusive16. Moreover, Maf1 induces allosteric changes that closely mimic the PIC state and sequesters residues involved in establishing contacts with promoter DNA. Specifically, the protrusion, the template strand pocket and the C34 WH2 ‘wing’ are all bound by Maf1, and the active site cleft is sealed off due to ordering of the C34 WH2 (Fig. 1).
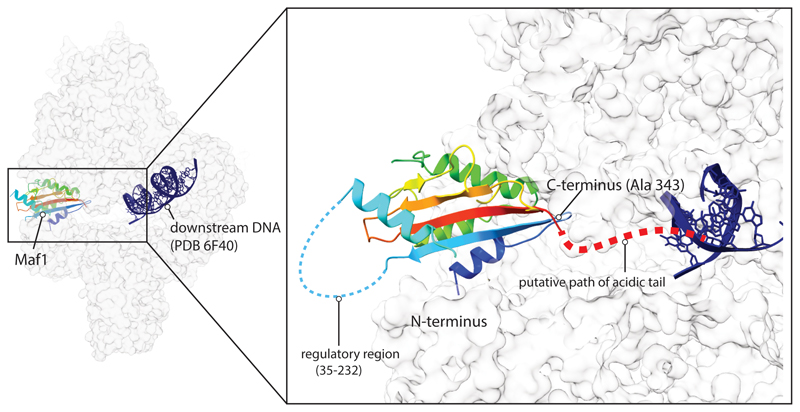
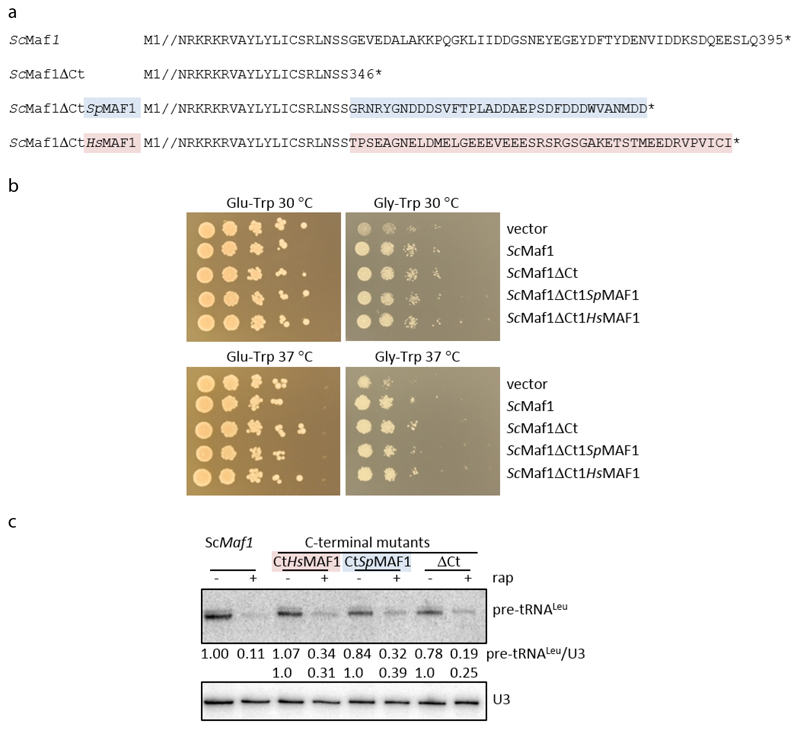
The C-terminus of Maf1 is acidic in different species but its sequence is poorly conserved22 and is disordered in all available structures16,17, but the orientation of Maf1 relative to Pol III suggests that the C-terminus may project into the active site cleft (Extended Data Fig. 6). We wondered if this contributes to transcription inhibition by repelling nucleic acids and deleted the acidic tail or exchanged it with the corresponding region of S. pombe or H. sapiens Maf1. However, the effects were subtle since yeast cell growth on both fermentable and non-fermentable carbon sources and transcriptional repression appear normal in these mutants (Extended Data Fig. 7).
We also note that the regulatory internal region, which is disordered and is subject to phosphorylation by TORC1, Sch9 and/or PKA1,6 is located on the solvent-exposed side of Maf1 (Extended Data Fig. 6). Maf1 can hence likely serve as a substrate to those kinases even in complex with Pol III.
The structure presented here differs from a previous low-resolution (~20 Å) cryo-EM study16, where Maf1 was reported to bind Pol III on top of the clamp. The authors proposed that Maf1 achieves transcription repression by an allosteric mechanism, namely through rearrangement of the C82/C34/C31 heterotrimer, thereby locking Pol III in a conformation that is unable to bind TFIIIB. While we do also observe allosteric effects affecting the heterotrimer (namely ordering of the C34 WH2 domain), the near-atomic resolution of our cryo-EM map and biochemical validation of our structure clearly establish that Maf1 binds between the clamp, wall and protrusion domains, and achieves transcription repression through direct competition with TFIIIB.
Methods
Protein purification
Pol III was purified as described 23, but buffer exchanged into a buffer containing K2SO4 instead of (NH4)2SO4.
Maf1-id was expressed from a pETM11 vector in BL21 Star (DE3) pRARE E. coli cells in TB medium. Expression was induced with 500 μM IPTG at 25 °C overnight. Cells were pelleted for 5 min at 12,000 g and re-suspended in 3 mL lysis buffer (0.5M NaCl, 50 mM Tris pH 7.5, 2 mM β-mercaptoethanol (BME), 20% glycerol, 10 μg/mL DNase I, 1 x protease inhibitors (SIGMAFAST protease inhibitor cocktail EDTA free), 30 mM imidazole, 2 mM MgCl2) per gram of pellet. Cells were lysed in an Emulsiflex-C3 homogenizer and the lysate cleared by centrifugation for 1 h at 30,000 g. The supernatant was incubated with 5 mL Ni-NTA resin (Qiagen) for 2 h. Beads were recovered and washed with 100 mL His-A buffer (1 M NaCl, 50 mM Tris pH 7.5, 2 mM BME, 5% glycerol, 30 mM imidazole) and 50 mL His-A low salt (His-A but with 150 mM NaCl) and eluted with 50 mL His-B (200 mM NaCl, 2 mM BME, 5% glycerol, 300 mM imidazole). The eluate was supplemented with 1 mg of TEV protease and dialysed against 2 L of TEV-cleavage buffer (100 mM NaCl, 5 % glycerol, 1 mM DTT, 50 mM Tris pH 7.5) overnight. Cleaved protein was passed over 5 mL of Ni-NTA beads pre-equilibrated in TEV cleavage buffer. Full-length Maf1 and Maf1-id were further purified over a MonoQ HiTrap column and eluted with gradient from 100 mM NaCl to 500 mM NaCl over 20 CVs. Maf1-id was buffer exchanged in a spin concentrator to 100 mM NaCl, 1 mM TCEP, 15 mM HEPES, concentrated to 30 mg/mL and flash-frozen in liquid nitrogen. Maf1-id mutations were generated using the QuickChange mutagenesis protocol.
Brf1-TBP and Bdp1 and TFIIIC were purified as described 20,24.
C341-156 was expressed from a pETM11 vector with an N-terminal his-tag and purified over Ni-NTA, as described for Maf1. The eluate was loaded onto a 5 mL Heparin FF column and eluted with a linear gradient from 100 mM NaCl to 1 M NaCl over 20 CV. Peak fractions were concentrated and applied to a Superdex 75 gel filtration column pre-equilibrated in 150 mM NaCl, 20 mM HEPES pH 7.5 and 5 mM DTT. The purified protein was concentrated to 35 mg/mL and flash-frozen in liquid nitrogen.
EM sample preparation
180 μg Pol III and a five-fold molar excess of Maf1-id were incubated overnight in binding buffer in a total volume of 48 μL (40 mM K2SO4, 15 mM HEPES pH 7.5 and 2.5 mM DTT). The sample was then diluted to 1.8 mL in the same buffer but containing 3 mM of BS3 crosslinker and 2.3 μM Maf1 to prevent dissociation. The sample was crosslinked for 2h at room temperature, quenched with 50 mM Tris pH 7.5, concentrated to ~60 μL and applied to a Superose 6 INCREASE 3.2/300 column equilibrated in EM buffer (150 mM (NH4)2SO4, 15 mM HEPES pH 7.5, 10 mM DTT). A peak fraction eluting at 1.4 mL was diluted to 0.15 mg/mL and used for grid preparation. 2.5 μL of sample were applied to Quantifoil Cu 2/1 + 2 nm Carbon grids that were glow-discharged in a Pelco EasyGlow instrument. Access sample was blotted away in a Vitrobot Mark IV set to 4 °C and 100 % humidity for 6 seconds with a blot force of 2 and the grid was plunge-frozen in liquid ethane.
Electron microscopy
Cryo-EM data was collected on a Titan Krios microscope with a Gatan Quantum energy filter and a K2 Summit direct detector in counting mode at a magnification of 130 000x and a pixel size of 1.041 Å /px. 10520 movies with 40 frames each and an accumulated dose of 60.5 e-/Å2 were collected, acquiring 8 images per hole.
Movies were pre-processed on the fly using Warp 1.05 25. The model parameters for motion correction and CTF estimation were set to 5×5×40 and 5×5×1, respectively. Particles were picked with BoxNet2_20180602 without re-training, using an expected particle diameter of 250 Å. Particles were extracted in a 360 pixel box, normalized and the contrast inverted. Filters in Warp were set to exclude particles from micrographs with lower than 6 Å estimated resolution based on CTF fitting, with a larger than 1.7 Å movement per frame in the first third of the movie, and with fewer than 50 particles per micrograph. However, very few micrographs did not satisfy these criteria (125 excluded micrographs, ~1% of the collected data), indicating high quality of the sample. Warp was also used for denoising of micrographs as shown in Extended Data Fig. 1.
Particle classification
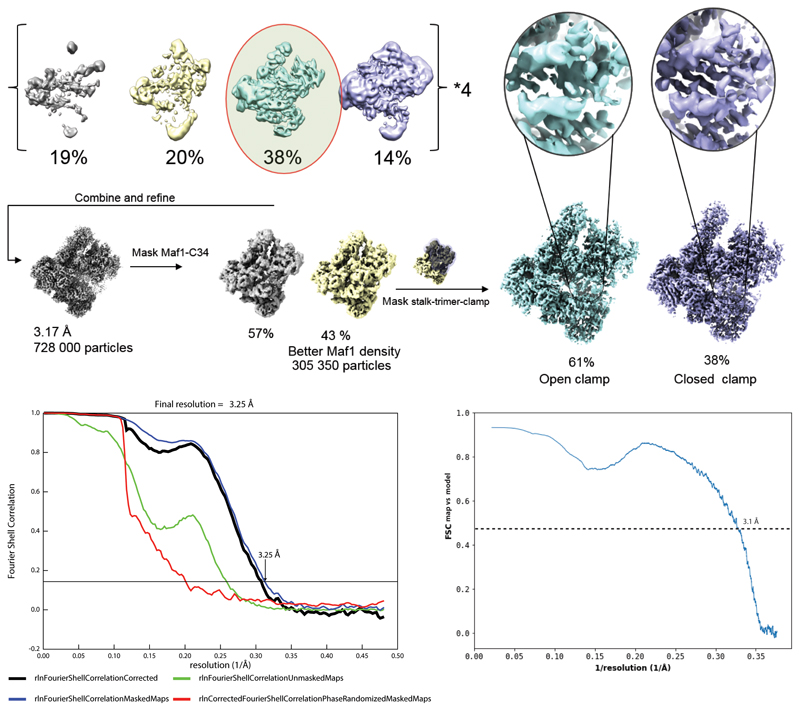
Due to the large number of particles (1 688 795), the dataset was divided into four batches and each was classified by 3D classification in RELION 3.0 using a 60 Å low-pass filtered model of apo Pol III (PDB 5FJ9) as the reference. The best class of each batch was retained, yielding a dataset of 728 000 particles. All batches were combined and refined.
The resulting map showed density for Maf1 and an adjacent density corresponding to C34 WH2, but at a lower threshold. Using a classification focused on this region the Maf1-C34WH2 density could be improved (305 000 particles). Finally, a masked classification focusing on the stalk, trimer and clamp separated an open clamp state and a closed clamp state. Density for Maf1 was poor in the open clamp state, but clear separation of beta-sheets and sidechain density were visible in the closed clamp state.
Two rounds of CTF refinement improved the resolution from 3.4 Å to 3.25 Å. Starting from the 305 000 particle set, we also performed MultiBody refinement implemented in RELION 3, using two masks. The first covered the core of Pol III and the heterodimer, and the second covered the stalk, clamp, heterotrimer and Maf1. The resulting bodies were sharpened using the relion_postprocess program, yielding maps at 3.34 Å (core) and 3.74 Å (stalk-trimer-clamp) resolution. This significantly improved side-chain density in the heterotrimer and clamp.
Model building and refinement
For model building, PDB 6EU3 (apo-Pol III closed conformation at 3.3 Å resolution) was used as a starting point and combined with the C34 WH2 domain from PDB 6F40. A homology model of yeast Maf1 was generated with PHYRE2 26 and fitted into the density. The model was manually adjusted in COOT 27.
To improve model coordinates, we used the maps obtained by MultiBody refinement and corrected minor sequence register shifts that were present in the starting model and could be detected due to the higher quality of the MultiBody maps. Progress of model building was monitored by real-space refinement in PHENIX 28 of partial models, namely the heterodimer, the heterotrimer-clamp region, and Maf1 against respective maps obtained from MultiBody refinement. Finally, the refined models were combined and refined in another round of real-space refinement against the locally filtered 3.25 Å consensus map obtained using the relion_postprocess program. MolProbity and PHENIX model validation statistics show good stereochemistry and excellent correlation between the map and the model (correlation coefficient of 0.81, and a FSC of 0.5 of the simulated model map with the experimental map of 3.1 Å, see Extended Data Fig. 2).
Maf1-C34 pulldown
His-tagged C341-156 (180 μg) was incubated with an equimolar amount of wild-type and mutant Maf1 proteins for 1h, and then diluted tenfold in IP buffer (50 mM NaCl, 20 mM HEPES pH 7.5 and 5 mM DTT). The sample was applied to a small gravity column containing 50 μL of Ni-NTA beads which was then washed with 1.5 mL of IP buffer. Proteins were eluted in 100 μL of elution buffer (300 mM imidazole, 200 mM NaCl, 50 mM Tris pH 7.5) and analysed by SDS-PAGE. Binding was quantified by measuring band intensities using the ImageLab software, and the relative intensity of Maf1 bands to C34 bands in the eluted fraction was calculated. The experiment was repeated three times using the same protein batches.The mean values and standard deviations were calculated in Microsoft Excel.
In Vitro Transcription
15-μl transcription reactions contained 2 pmol tRNAHis hybridized DNA oligonucleotides (template-strand 5’AAAATGCCATCTCCTAGAATCGAACCAGGGTTTCATCGCCACA-CGATGTGTACTAACCACTATACTAAGATGGCGACTTTTCAATGGAGAACTGTTGTATTACGGGCTCGAGTAATAC 3’ and non-template strand 5'-GTATTACTCGAGCC-CGTAATACAACAGTTCTCCATTGAAAAGTCGCCATCTTAGTATAGTGGTTAGTACACATCGTTGTGGCCGATGAAACCCTGGTTCGATTCTAGGAGATGGCATTTT-3'), 4 pmol TFIIIC, 4 pmol TFIIIB, 3 pmol Pol III, and either 8, 16 and 24 pmol Maf1-id wt or mutants in 20 mM HEPES pH 7.5, 60 mM (NH4)2SO4, 10 mM MgSO4, 10% glycerol, 10 mM DTT, 120 μM of each ATP, GTP, and CTP as well as 10 μCi of [α-32P]UTP (Hartmann). Maf1 wt or mutant proteins were added to the DNA before TFIIIC as well as pre-incubated with Pol III. In vitro transcription was performed at RT for 1 hr before phenol/chloroform extraction and precipitation. The RNA was then subjected to electrophoresis in denaturing 12% polyacrylamide gels. The gels were exposed to phosphorimaging screens (Fujifilm) for capturing digital images.
Yeast Phenotypes and Northern blotting
Standard cloning methods were used to delete the non-conserved acidic C-terminus of full-length S. cerevisiae Maf1 in pRS31429 and to substitute the corresponding regions of S. pombe and human Maf1. After transformation into a W303 maf1Δ::natMX strain, growth was monitored on media containing glucose or glycerol and northern analysis was performed as reported previously29.
Extended Data
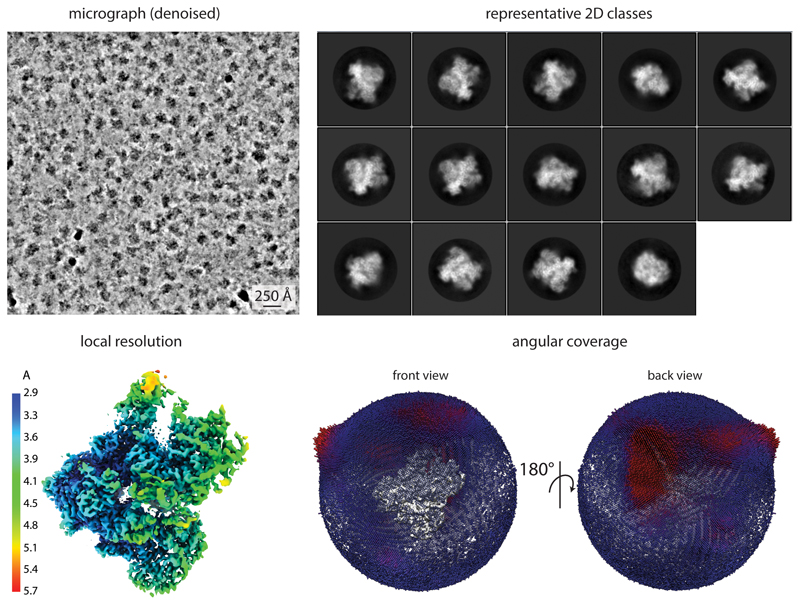
Extended Data Fig. 1. Cryo-EM data quality.
Representative micrograph denoised using Warp 25, 2D classes, EM density colored by local resolution, and angular distribution coverage.
Extended Data Fig. 2. Particle classification strategy and model validation.
Top panel: Micrographs were divided into four batches and classified using 3D classification in RELION with a 60 Å low-pass filtered map of Pol III as a reference. The best class of each batch was retained, batches were combined and refined. Focused classification using a mask on Maf1 yielded one class with improved Maf1 occupancy. Lastly, focused classification using a mask on the stalk-heterotrimer-clamp module separated an open clamp state with poorly resolved Maf1 density from a closed-clamp state with clear separation of the Maf1 β-strands and side-chain density. Bottom panel: FSC curves showing the correlation between independent half maps (left) and the correlation between the sharpened experimental map and a simulated model map (right).
Extended Data Fig. 3. Multiple sequence alignment of Maf1.
Shown are sequences of loop 1, loop 2 and W319 from distantly related species. Functionally important sites based on mutant studies are boxed in red.
Extended Data Fig. 4. Comparison of the Pol III conformation in apo-Pol III, Maf1-Pol III and the Pol III-PIC.
Maf1-Pol III adopts a similar conformation as the Pol III-PIC (note the distance between the lobe (blue) and clamp head (red)).
Extended Data Fig. 5. Comparison of Maf1 structures from S. cerevisiae, H. sapiens and C. sinensis.
Top panel: Structures shown in ribbon representation with α-helices colored in red and β-sheets colored in yellow. Bottom panel: surface representation colored by electrostatic potential from negative (red) to positive (blue) potential.
Extended Data Fig. 6. A model of the disordered regions in Maf1.
The phospho-regulatory region of Maf1 is accessible in the Maf1-Pol III structure, whereas the acidic tail emerges in the direction of the DNA binding cleft. The downstream DNA (PDB 6f40) has been superimposed with the Maf1-Pol III structure to help visualization. Maf1 is colored from N-terminus (blue) to C-terminus (red). Putative paths of the disordered regions are indicated, with the internal, phospho-regulated region located away from the Pol III interface, whereas the acidic C-terminal tail projects towards the DNA binding cleft, where it might help to repel nucleic acids.
Extended Data Fig. 7. The C-terminus of ScMaf1 is not obligatory for Maf1 function.
a, Amino acid sequences of wild-type ScMaf1 and the various ScMaf1 C-terminal mutants are shown from the end of conserved domain C (Pluta et al., 2001) through the acidic terminal region (where present). Amino acid sequences from residue 2 through 326 are represented by //. ScMaf1ΔCt terminates at residue 346 while ScMaf1ΔCtSpMAF1 and ScMaf1ΔCtHsMAF1 proteins contain the terminal amino acids from S. pombe (35 residues, colored in blue) and human (45 residues, colored in pink) MAF1 proteins appended to ScMaf1ΔCt.
b, The respiratory defect of the maf1Δ::natMX vector only strain, poor growth on glycerol, is rescued by wild-type ScMaf1 and the three ScMaf1 C-terminal variants. Ten-fold serial dilutions of maf1Δ:: natMX strains containing pRS314 vector, pRS314ScMaf1 or pRS314ScMaf1 C-terminal variants grown at 30 and 37°C on media with glucose (left panels) and glycerol (right panels) as the carbon source.
c, Northern analysis of Pol III transcription and repression shows that the C-terminus of ScMaf1 is not required for the Maf1 repression function in yeast. maf1Δ:: natMX strains containing pRS314ScMaf1 or pRS314ScMaf1 C-terminal variants (ScMaf1ΔCt, ScMaf1ΔCtSpMAF1 and ScMaf1ΔCtHsMAF) were treated with rapamycin or drug vehicle for 1 h. The relative level of Pol III transcription is reported by the amount of pre-tRNALeu transcript normalized to U3 snRNA, expressed relative to the untreated wild-type strain and indicated below each lane.
Supplementary Material
Acknowledgements
This work was supported by an ERC Advanced Grant (ERC-2013-AdG340964-POL1PIC) to C.W.M. and R.W., a National Institutes of Health Grant (GM120358) to I.M.W. and an EMBL International PhD program award to M.K.V. We thank M. Girbig for help with transcription assays and critical reading of the manuscript and F. Weis for EM support. We are thankful to T. Hoffmann and J. Pecar for maintaining the high performance computing environment for EM data processing at EMBL.
Footnotes
Reporting Summary
Further information on experimental design is available in the Nature Research Reporting Summary linked to this article.
Data Availability
The cryo-EM map of the Maf1-Pol III complex has been deposited to the Electron Microscopy Data Bank (EMDB) under the accession code EMD-10595. The coordinates of the corresponding model have been deposited to the Protein Data Bank (PDB) under accession code 6TUT. Source data for Fig. 2b and 2c are available with the paper online.
Author Contributions
The project was conceived by C.W.M., I.M.W and R.D.M and supervised by C.W.M.. M.K.V. designed, carried out and analyzed experiments, data processing and model building. F.B performed transcription assays. W.J.H.H. collected cryo-EM data. R.W. was responsible for yeast fermentation. M.K.V. and C.W.M. prepared the manuscript with input from the other authors. R.D.M. performed functional analysis of the acidic tail.
Competing Interests
The authors declare no competing interests.
References
- 1.Moir RD, Willis IM. Regulation of pol III transcription by nutrient and stress signaling pathways. Biochim Biophys Acta - Gene Regul Mech. 2013;1829:361–375. doi: 10.1016/j.bbagrm.2012.11.001. [DOI] [PMC free article] [PubMed] [Google Scholar]
- 2.Grewal SS. Why should cancer biologists care about tRNAs? tRNA synthesis, mRNA translation and the control of growth. Biochim Biophys Acta. 2015;1849:898–907. doi: 10.1016/j.bbagrm.2014.12.005. [DOI] [PubMed] [Google Scholar]
- 3.Zhong Q, et al. The significance of Brf1 overexpression in human hepatocellular carcinoma. Oncotarget. 2016;7:6243–6254. doi: 10.18632/oncotarget.6668. [DOI] [PMC free article] [PubMed] [Google Scholar]
- 4.Gouge J, et al. Redox Signaling by the RNA Polymerase III TFIIB-Related Factor Brf2. Cell. 2015;163:1375–1387. doi: 10.1016/j.cell.2015.11.005. [DOI] [PMC free article] [PubMed] [Google Scholar]
- 5.Palian BM, et al. Maf1 Is a Novel Target of PTEN and PI3K Signaling That Negatively Regulates Oncogenesis and Lipid Metabolism. PLoS Genet. 2014;10 doi: 10.1371/journal.pgen.1004789. [DOI] [PMC free article] [PubMed] [Google Scholar]
- 6.Willis IM, Moir RD. Signaling to and from the RNA Polymerase III Transcription and Processing Machinery. Annu Rev Biochem. 2018;87:75–94. doi: 10.1146/annurev-biochem-062917-012624. [DOI] [PMC free article] [PubMed] [Google Scholar]
- 7.Willis IM. Maf1 phenotypes and cell physiology. Biochim Biophys Acta - Gene Regul Mech. 2018;1861:330–337. doi: 10.1016/j.bbagrm.2017.11.009. [DOI] [PMC free article] [PubMed] [Google Scholar]
- 8.Boguta M, Leniewska E. Novel layers of RNA polymerase III control affecting tRNA gene transcription in eukaryotes. Open Biol. 2017;7 doi: 10.1098/rsob.170001. 170001. [DOI] [PMC free article] [PubMed] [Google Scholar]
- 9.Shetty M, et al. Maf1-dependent transcriptional regulation of tRNAs prevents genomic instability and is associated with extended lifespan. Aging Cell. 2019:1–13. doi: 10.1111/acel.13068. [DOI] [PMC free article] [PubMed] [Google Scholar]
- 10.Cai Y, Wei Y. Stress resistance and lifespan are increased in C. elegans but decreased in S. cerevisiae by mafr-1 / maf1 deletion. Oncotarget. 2016;7:10812–10826. doi: 10.18632/oncotarget.7769. [DOI] [PMC free article] [PubMed] [Google Scholar]
- 11.Filer D, et al. RNA polymerase III limits longevity downstream of TORC1. Nature. 2017;552:263–267. doi: 10.1038/nature25007. [DOI] [PMC free article] [PubMed] [Google Scholar]
- 12.Bonhoure N, et al. Loss of the RNA polymerase III repressor MAF1 confers obesity resistance. Genes Dev. 2015;29:934–947. doi: 10.1101/gad.258350.115. [DOI] [PMC free article] [PubMed] [Google Scholar]
- 13.Willis IM, Moir RD, Hernandez N. Metabolic programming a lean phenotype by deregulation of RNA polymerase III. Proc Natl Acad Sci. 2018;115:12182–12187. doi: 10.1073/pnas.1815590115. [DOI] [PMC free article] [PubMed] [Google Scholar]
- 14.Bonhoure N, et al. Chronic repression by MAF1 supports futile RNA cycling as a mechanism for obesity resistance. bioRxiv. 2019 doi: 10.1101/775353. 775353. [DOI] [Google Scholar]
- 15.Chen CY, et al. Maf1 and Repression of RNA Polymerase III-Mediated Transcription Drive Adipocyte Differentiation. Cell Rep. 2018;24:1852–1864. doi: 10.1016/j.celrep.2018.07.046. [DOI] [PMC free article] [PubMed] [Google Scholar]
- 16.Vannini A, et al. Molecular basis of RNA polymerase III transcription repression by Maf1. Cell. 2010;143:59–70. doi: 10.1016/j.cell.2010.09.002. [DOI] [PubMed] [Google Scholar]
- 17.Soprano AS, et al. Crystal Structure and Regulation of the Citrus Pol III Repressor MAF1 by Auxin and Phosphorylation. Structure. 2017;25:1360–1370.e4. doi: 10.1016/j.str.2017.07.004. [DOI] [PubMed] [Google Scholar]
- 18.Moir RD, Lee J, Willis IM. Recovery of RNA polymerase III transcription from the glycerol-repressed state. J Biol Chem. 2012;287:30833–30841. doi: 10.1074/jbc.M112.378828. [DOI] [PMC free article] [PubMed] [Google Scholar]
- 19.Abascal-Palacios G, Ramsay EP, Beuron F, Morris E, Vannini A. Structural basis of RNA polymerase III transcription initiation. Nature. 2018;553:301–306. doi: 10.1038/nature25441. [DOI] [PubMed] [Google Scholar]
- 20.Vorländer MK, Khatter H, Wetzel R, Hagen WJH, Müller CW. Molecular mechanism of promoter opening by RNA polymerase III. Nature. 2018;553:295–300. doi: 10.1038/nature25440. [DOI] [PMC free article] [PubMed] [Google Scholar]
- 21.Han Y, Yan C, Fishbain S, Ivanov I, He Y. Structural visualization of RNA polymerase III transcription machineries. Cell Discov. 2018 doi: 10.1038/s41421-018-0044-z. [DOI] [PMC free article] [PubMed] [Google Scholar]
- 22.Pluta K, et al. Maf1p, a Negative Effector of RNA Polymerase III in Saccharomyces cerevisiae. Mol Cell Biol. 2001;21:5031–5040. doi: 10.1128/MCB.21.15.5031-5040.2001. [DOI] [PMC free article] [PubMed] [Google Scholar]
- 23.Moreno-Morcillo M, et al. Solving the RNA polymerase I structural puzzle. Acta Crystallogr Sect D Biol Crystallogr. 2014;70:2570–2582. doi: 10.1107/S1399004714015788. [DOI] [PMC free article] [PubMed] [Google Scholar]
- 24.Male G, et al. Architecture of TFIIIC and its role in RNA polymerase III pre-initiation complex assembly. Nat Commun. 2015;6 doi: 10.1038/ncomms8387. 7387. [DOI] [PMC free article] [PubMed] [Google Scholar]
- 25.Tegunov D, Cramer P. Real-time cryo-electron microscopy data preprocessing with Warp. Nat Methods. 2019 doi: 10.1038/s41592-019-0580-y. [DOI] [PMC free article] [PubMed] [Google Scholar]
- 26.Kelly LA, Mezulis S, Yates C, Wass M, Sternberg M. The Phyre2 web portal for protein modelling, prediction, and analysis. Nat Protoc. 2015;10:845–858. doi: 10.1038/nprot.2015.053. [DOI] [PMC free article] [PubMed] [Google Scholar]
- 27.Brown A, et al. Tools for macromolecular model building and refinement into electron cryo-microscopy reconstructions. Acta Crystallogr Sect D Biol Crystallogr. 2015;71:136–153. doi: 10.1107/S1399004714021683. [DOI] [PMC free article] [PubMed] [Google Scholar]
- 28.Adams PD, et al. PHENIX: A comprehensive Python-based system for macromolecular structure solution. Acta Crystallogr Sect D Biol Crystallogr. 2010;66:213–221. doi: 10.1107/S0907444909052925. [DOI] [PMC free article] [PubMed] [Google Scholar]
- 29.Liao Y, Moir RD, Willis IM. Interactions of Brf1 peptides with the tetratricopeptide repeat-containing subunit of TFIIIC inhibit and promote preinitiation complex assembly. Mol Cell Biol. 2006;26:5946–56. doi: 10.1128/MCB.00689-06. [DOI] [PMC free article] [PubMed] [Google Scholar]
Associated Data
This section collects any data citations, data availability statements, or supplementary materials included in this article.


