Abstract
The anti-cancer drug target poly(ADP-ribose) polymerase 1 (PARP1) and its close homologue, PARP2, are early responders to DNA damage in human cells1,2. Upon binding to genomic lesions, these enzymes utilise NAD+ to modify a plethora of proteins with mono- and poly(ADP-ribose) signals that are important for subsequent chromatin decompaction and repair factor recruitment3,4. These post-translational modification events are predominantly serine-linked and require HPF1, an accessory factor that is specific for DNA damage response and switches the amino-acid specificity of PARP1/2 from aspartate/glutamate to serine residues5–10. Here, we report a co-structure of HPF1 bound to the catalytic domain of PARP2 that, in combination with NMR and biochemical data, reveals a composite active site formed by residues from both PARP1/2 and HPF1. We further show that the assembly of this new catalytic centre is essential for DNA damage-induced protein ADP-ribosylation in human cells. In response to DNA damage and NAD+ binding site occupancy, the HPF1-PARP1/2 interaction is enhanced via allosteric networks operating within PARP1/2, providing an additional level of regulation in DNA repair induction. As HPF1 forms a joint active site with PARP1/2, our data implicate HPF1 as an important determinant of the response to clinical PARP inhibitors.
HPF1 structure
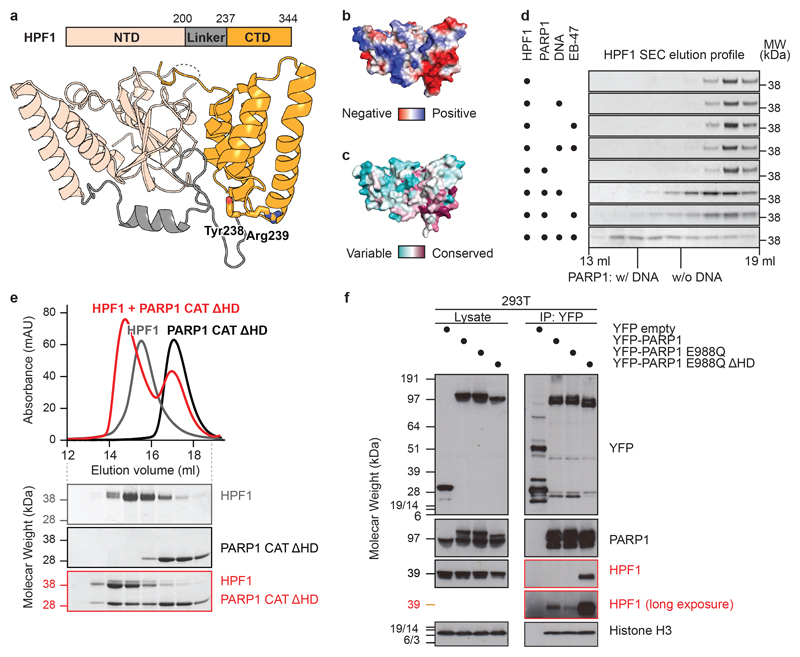
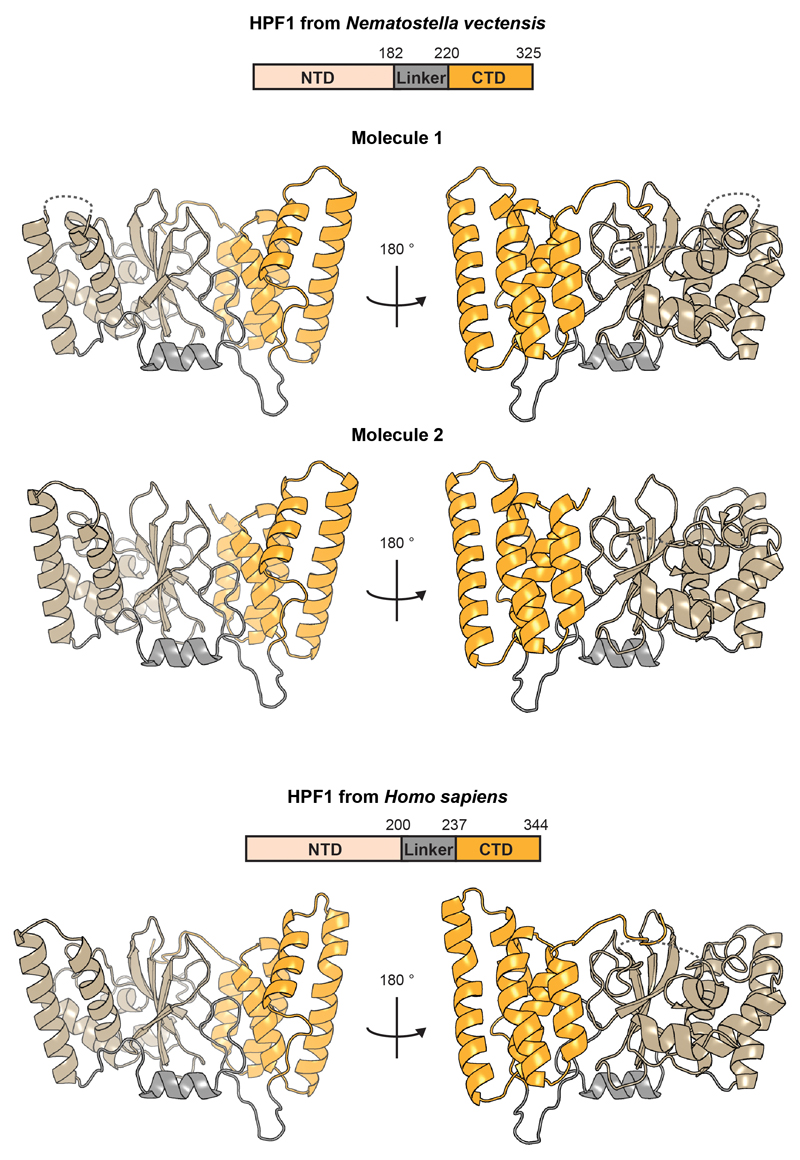
We solved crystal structures of HPF1, from both Nematostella vectensis (full-length) and Homo sapiens (Δ1-36; Fig. 1a). The structures, both at 2.1 Å, reveal two tightly-associated domains without known structural homologues connected via an elaborate linker. By mapping surface electrostatics and sequence conservation onto the human HPF1 structure, we identified a conserved acidic “corner” of the C-terminal domain (CTD) as a putative functional site (Fig. 1b and c). Notably, this region harbours Tyr238 and Arg239, previously identified as important for the HPF1-PARP1/2 interaction5 (Fig. 1a).
Fig 1. HPF1 structure and regulation of the HPF1-PARP1 interaction.
a, Domain organisation and crystal structure of human HPF1 (for statistics, see Extended Data Table 1). Additional views and Nematostella vectensis HPF1 structure appear in Extended Data Fig. 1.
b and c, Surface electrostatic potential and amino-acid residue conservation mapped onto HPF1 surface.
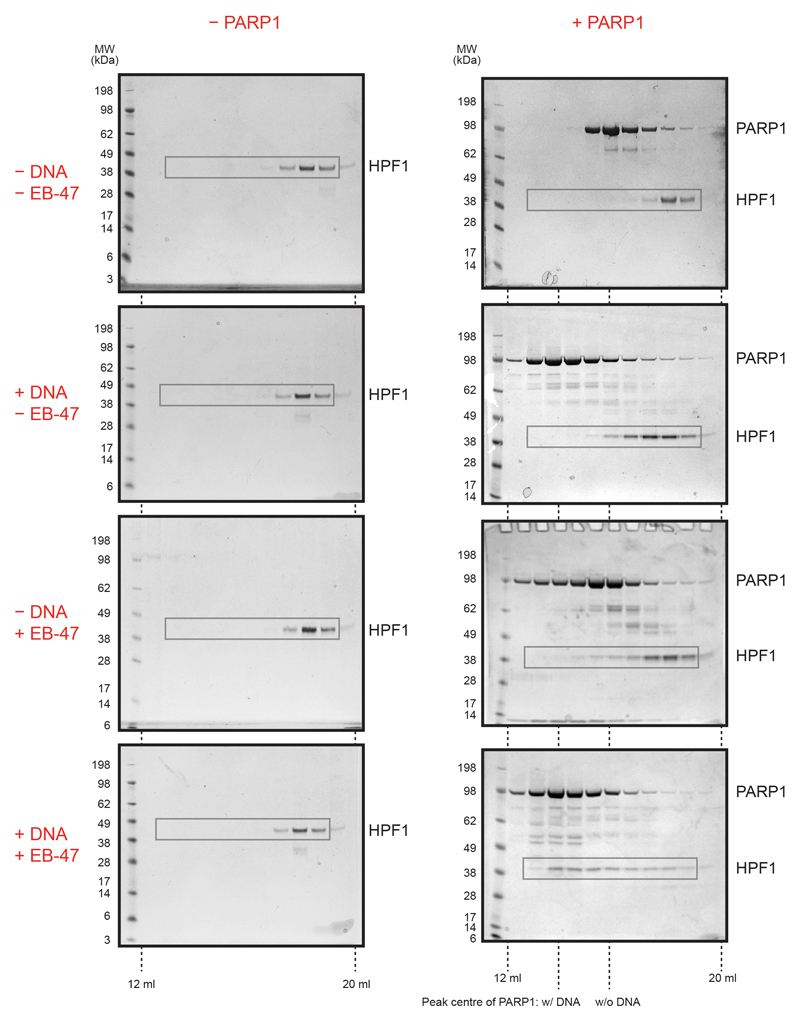
d, SDS-PAGE analysis of analytical SEC fractions of HPF1 +/− indicated factors (for uncropped gels, see Extended Data Fig. 2). The centres of the PARP1 peaks +/− DNA are indicated.
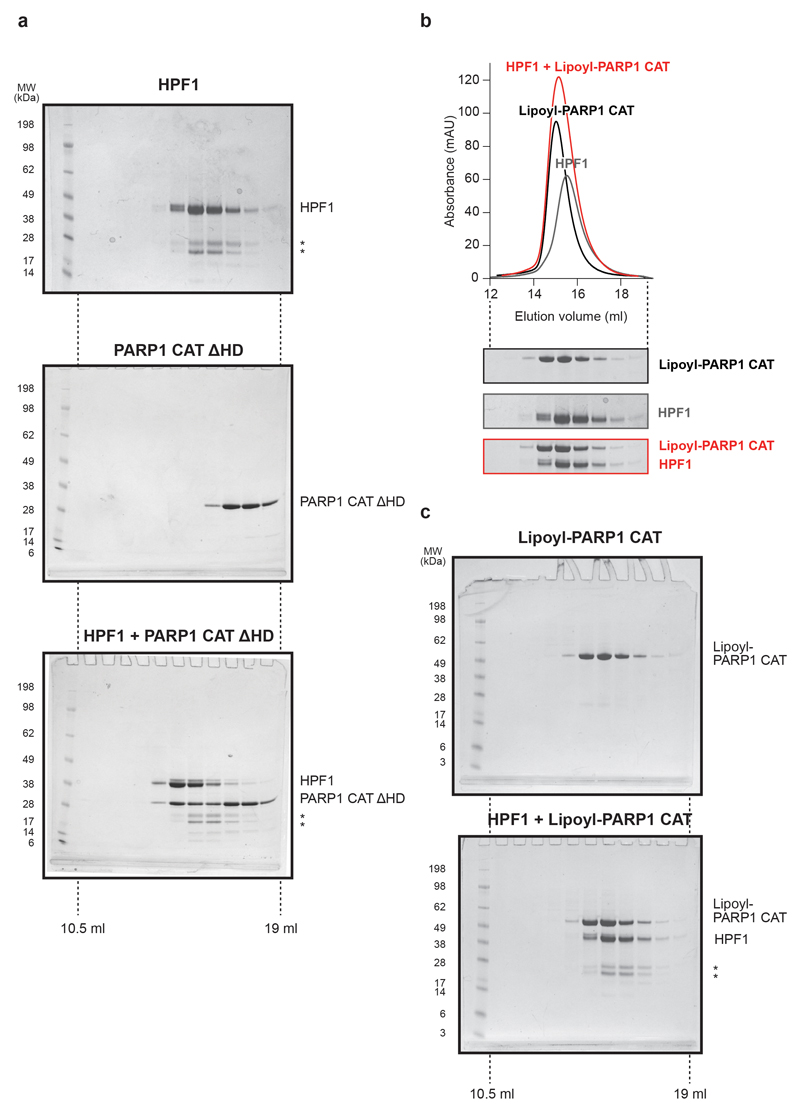
e, Analytical SEC of the HPF1-PARP1 CAT ΔHD interaction (for uncropped gels, see Extended Data Fig. 3a).
f, PARP1 co-immunoprecipitation (IP) from 293T cells treated with olaparib and H2O2.
Experiments in d-f were performed independently three times with similar results.
Regulation of HPF1-PARP1 interaction
We previously showed that PARP1 and PARP2 co-immunoprecipitate with HPF1 from cells and demonstrated a direct PARP1-HPF1 interaction with recombinant proteins using a pull-down assay5. However, further in vitro analysis with analytical size-exclusion chromatography (SEC) did not reveal any shift in the HPF1 elution upon adding PARP1 (Fig. 1d). This suggests that the interaction is transient and likely low-affinity. However, since HPF1 was previously seen to modulate PARP1 activity at a low, micromolar concentration in in vitro ADP-ribosylation assays5,7,11, we reasoned that the interaction might become stabilised when PARP1 is bound to one of the additional factors present in the assay reactions but absent in the initial SEC runs: an activating DNA or the substrate NAD+. Indeed, addition of either a short DNA duplex or the NAD+ analogue EB-47 resulted in a PARP1-dependent shift of HPF1 towards higher molecular weight fractions, indicative of a stronger interaction (Fig. 1d). The effect is particularly pronounced in the presence of both DNA and EB-47.
Interestingly, in recent studies performed with PARP1, PARP2, and PARP3 in the absence of HPF1, both DNA binding and NAD+ site occupancy were shown to affect the same structural element: the helical subdomain (HD)12–16, which is the hallmark of the DNA repair-associated PARPs17. In particular, DNA binding was seen to locally unfold the HD, relieving a steric blockage of NAD+ binding12,14,16. We hypothesised that binding of HPF1 to PARP1/2 is similarly inhibited by the HD and that the stabilising effect of DNA and the NAD+ analogue is linked with their ability to modulate the HD. In line with our hypothesis, the analytical SEC of HPF1 with the catalytic domain (CAT) of PARP1 lacking the HD demonstrated formation of a high-affinity complex in the absence of DNA or EB-47 (Fig. 1e).
In order to test the relevance of the HD-mediated inhibition in vivo, we expressed PARP1 with and without the HD in human 293T cells. To restrict ADP-ribosylation by the constitutively active ΔHD construct13,15 and exclude indirect, poly(ADP-ribose)-mediated interactions, we introduced the additional mutation E988Q, which limits PARP1 activity to mono-ADP-ribosylation18. Co-immunoprecipitation showed that PARP1 E988Q ΔHD pulls down dramatically increased HPF1 amounts compared to the full-length protein (Fig. 1f). This indicates that, also in cellular context, HPF1 binding to PARP1/2 is inhibited by the HD and thus likely regulated by factors that affect HD stability, especially DNA breaks and NAD+. This mechanism could ensure that HPF1, which is present in cells at a significantly lower level than PARP1 (Gibbs-Seymour et al., 2016), is only localised to active, DNA-bound PARP1/2 molecules.
HPF1-PARP1/2 structural analysis
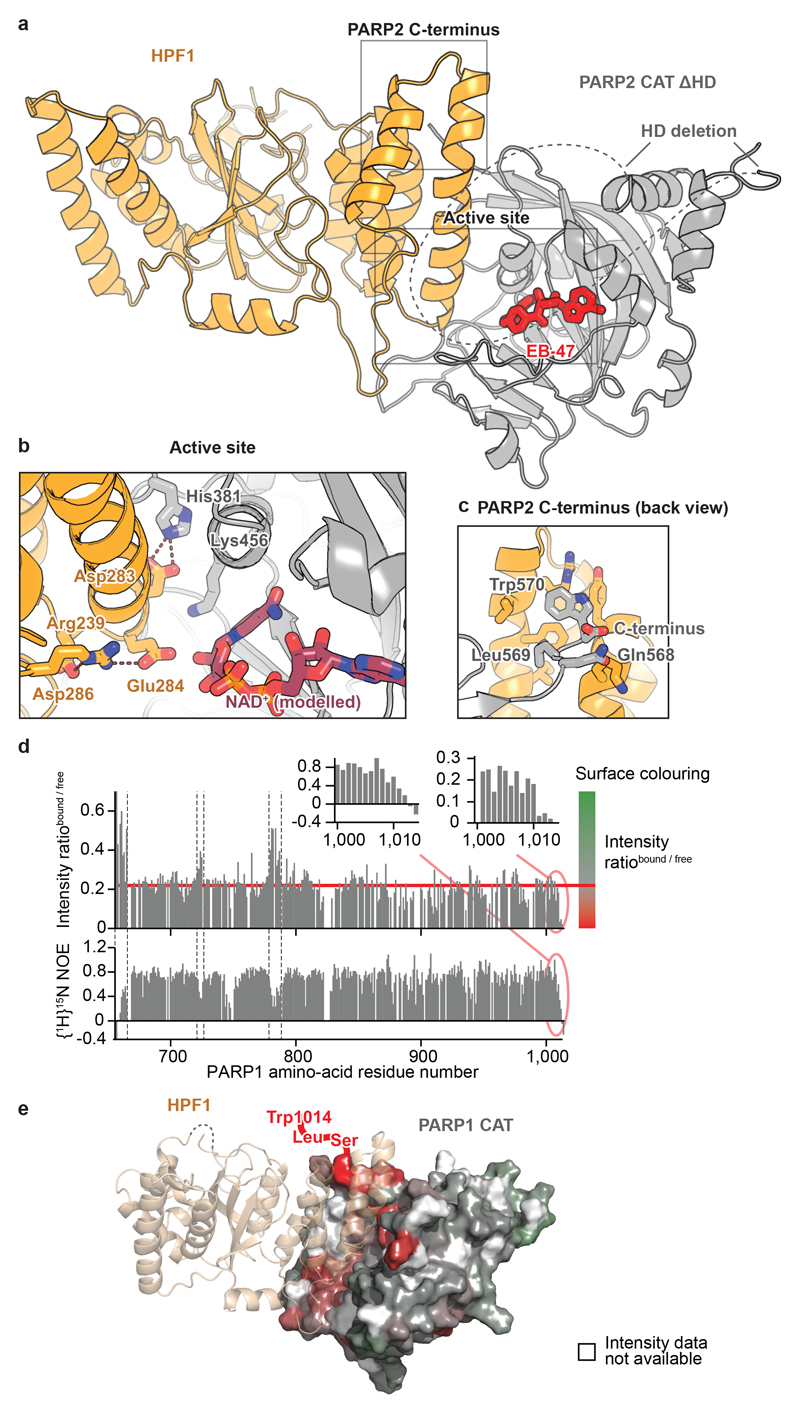
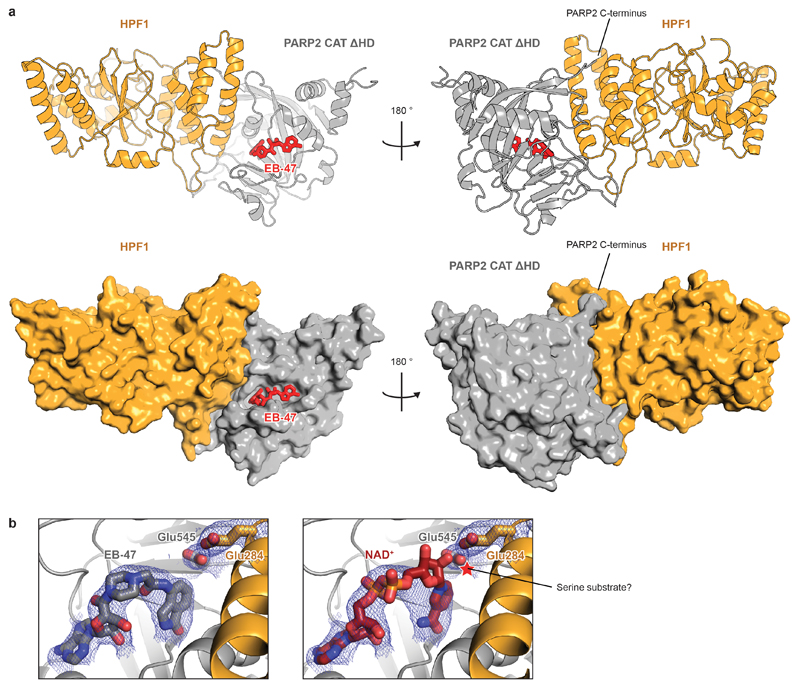
Following attempts to co-crystallise human HPF1 Δ1-36 with the previously described CAT ΔHD fragments of PARP1 and PARP214,16, we solved a structure of the HPF1-PARP2 CAT ΔHD complex bound to EB-47 at 3.0-Å resolution (Fig. 2a). Strikingly, the structure shows that PARP2 and HPF1 form a joint active site. Stabilised by the interaction between Asp283 of HPF1 and His381 of PARP2 (equivalent to His826 in PARP1), Glu284 of HPF1 is positioned at the very core of the enzyme, in close proximity to the C1" carbon of NAD+ modelled in place of EB-47 (Fig. 2b). Additionally, the two extreme C-terminal residues of PARP2, Leu569 and Trp570 (PARP1 Leu1013 and Trp1014), dock at the back of the HPF1 CTD (Fig. 2c).
Fig 2. Crystal and solution structural analysis of the HPF1-PARP1/2 interaction.
a, Structure of the human HPF1-PARP2 CAT ΔHD complex (for statistics, see Extended Table 1). Additional representations appear in Extended Data Fig. 4a.
b, Active site of the HPF1-PARP2 complex. NAD+ was modelled by alignment with Protein Data Bank (PDB) ID 6BHV. An additional view with electron density appears in Extended Data Fig. 4b.
c, PARP2 C-terminus bound to HPF1.
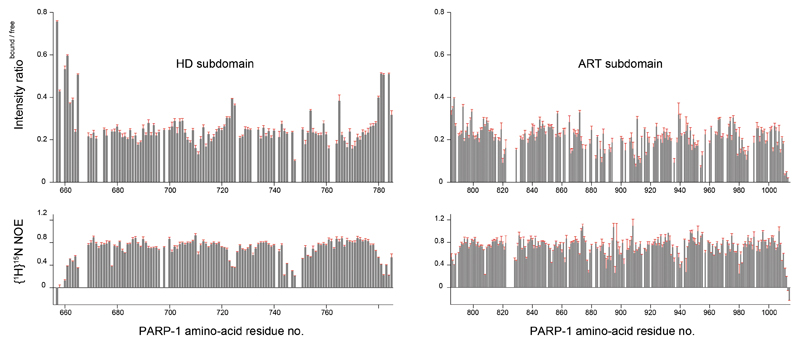
d, Backbone amide signal intensity ratios from 15N-1H-TROSY spectra of 15N-labelled PARP1 CAT +/− HPF1 (top) and steady-state {1H}15N NOE values for free 15N-labelled PARP1 CAT (bottom). An intensity ratio of approx. 0.22 (horizontal red line) is interpreted as that resulting from slower overall molecular tumbling of the complex. Values < 0.22 indicate HPF1 binding, while values > 0.22 correspond to flexible regions (shown between dashed lines in the main plot). On the right, colour ramps used in e are defined. Expansions including error bars appear in Extended Data Fig. 5, and TROSY spectra used for assignments and binding analysis in Extended Data Fig. 6 and 7, respectively.
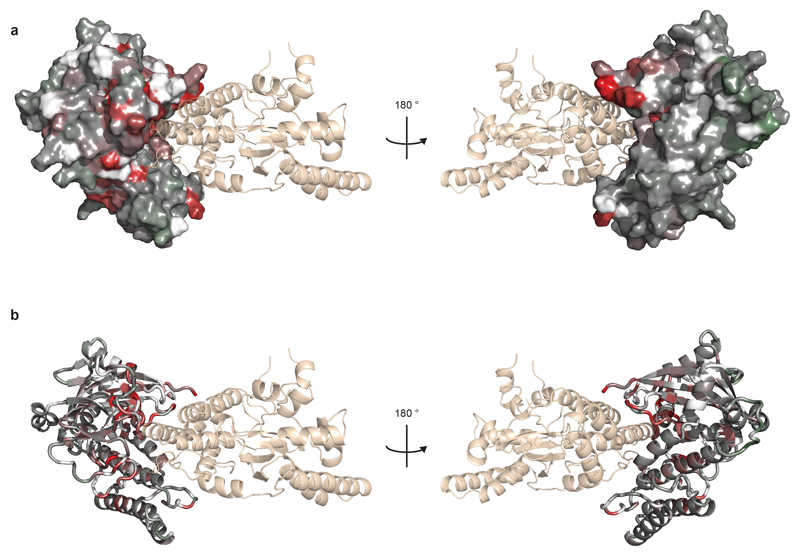
e, Model of the HPF1-PARP1 CAT interaction obtained by superposing the ART subdomain of PARP1 from Protein Data Bank (PDB) ID 4DQY with that of PARP2 in the HPF1-PARP2 CAT ΔHD structure. The PARP1 surface is coloured by intensity ratio values as defined in d. Residues for which no unique intensity ratio could be measured (prolines and those whose amide signal is missing or overlapped for free PARP1 CAT) are in white. PARP1 C-terminus, which is absent in most structures, is shown schematically. Additional views appear in Extended Data Fig. 8.
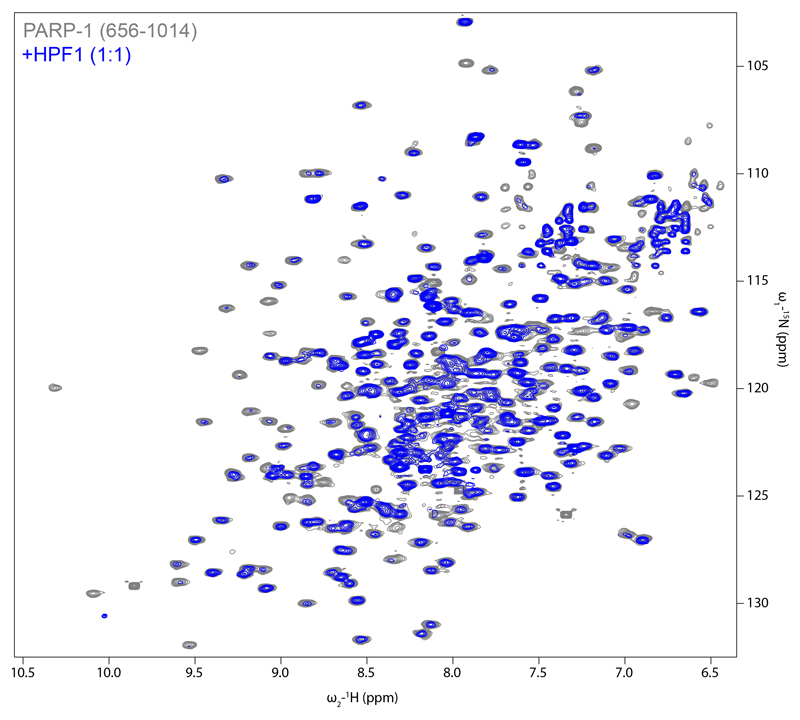
In order to demonstrate that PARP1 interacts with HPF1 in the same manner as PARP2, we turned to NMR. Addition of HPF1 to 15N-labelled PARP1 CAT domain caused intensity reductions for PARP1 CAT domain 1H-15N amide group signals (Fig. 2d, top graph). We hypothesised that the decreased tumbling rate caused by the interaction results in a uniform contribution to these intensity losses, upon which further effects are superimposed. Residues of PARP1 CAT that have higher values of the bound:free intensity ratio correspond to flexible regions (as detected by 15N relaxation experiments; Fig. 2d, bottom graph), while residues affected by HPF1 binding show lower values of the bound:free intensity ratio or disappear altogether. The intensity losses in these latter cases are proxies for chemical shift changes upon HPF1 binding, which we could not detect directly. Notably, signals from the extreme C-terminus (1011-1014) are severely reduced in intensity despite its high flexibility in the free CAT, providing a particularly clear indication that these residues interact with HPF1. Overall mapping of the intensity ratio data onto a model of the HPF1-PARP1 CAT complex shows that PARP1 interacts with HPF1 in approximately the manner seen for PARP2 in our crystal structure (Fig. 2e).
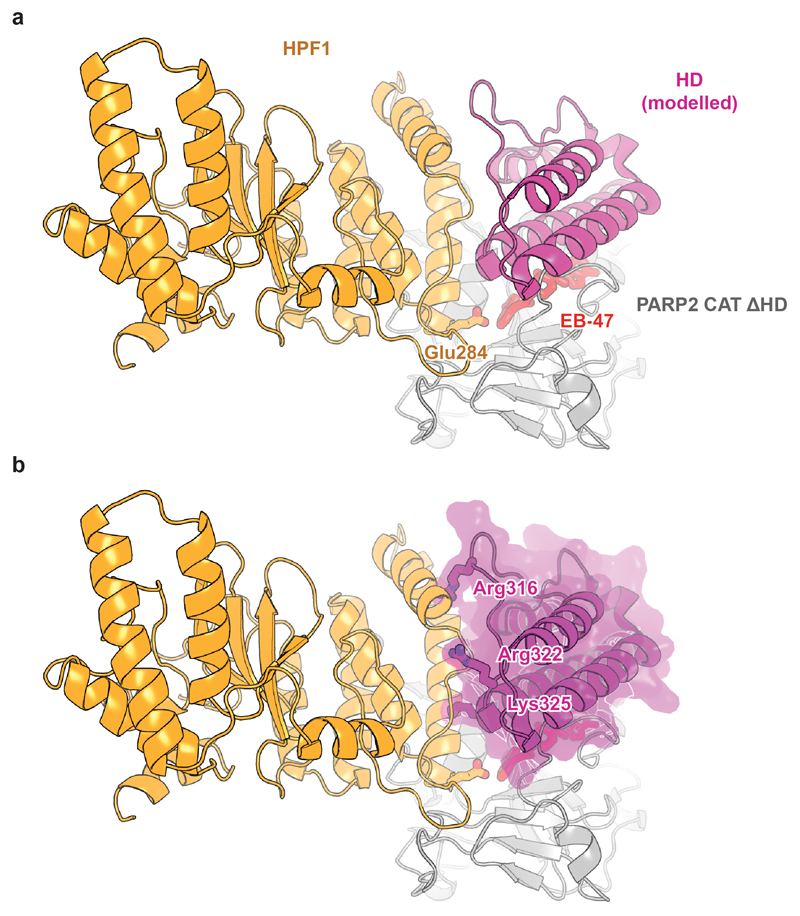
For our NMR analyses, we used PARP1 CAT containing the HD, which showed no detectable interaction with HPF1 in analytical SEC (Extended Data Fig. 3b). These results demonstrate that, although the interaction is much weaker, PARPs are able to bind to HPF1 in the presence of the HD, in line with structural alignments that show only minor steric clashes (Extended Data Fig. 9). This near-compatibility is necessary in cells, where HPF1 encounters native PARP1/2 containing the HD that is possibly only subtly modulated by allosteric signals.
HPF1 mutational analysis
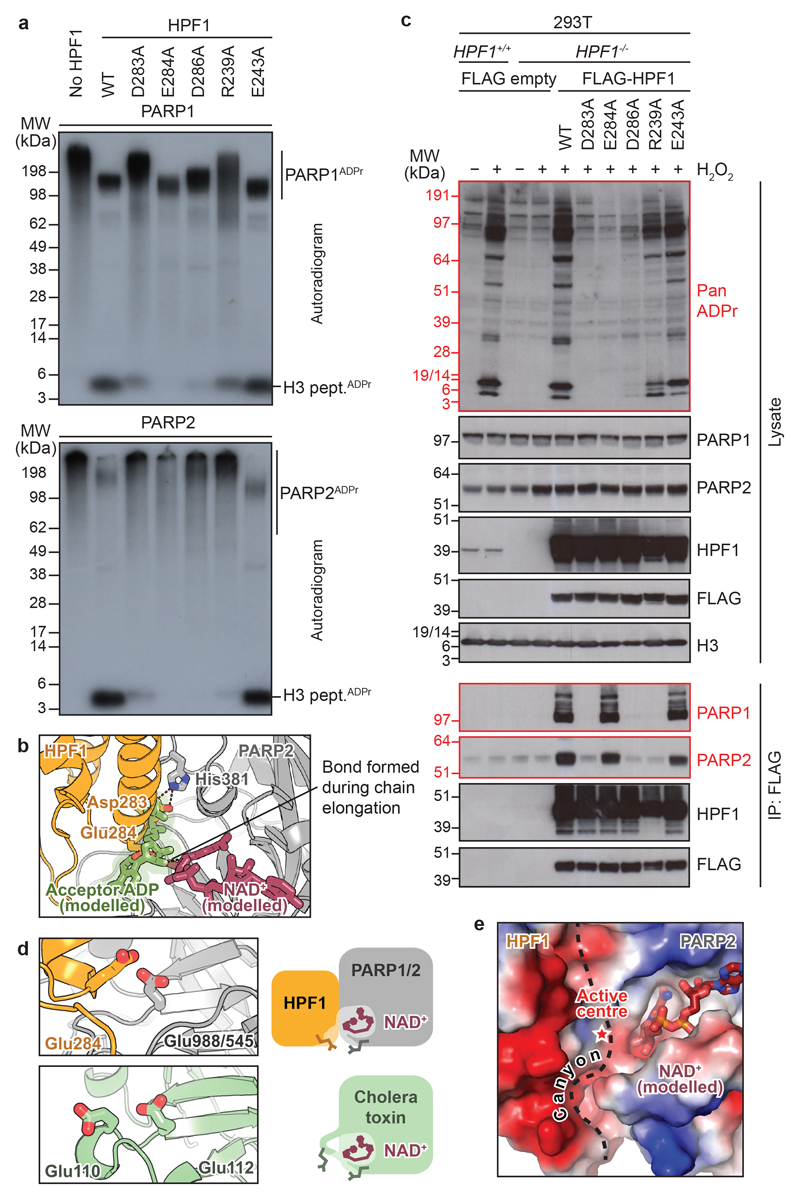
We next validated the functional significance of the observed binding mode of HPF1. We first used the in vitro radioactive ADP-ribosylation assays on a H3 peptide substrate7,11,18 to test the effects of mutations in the conserved acidic corner of HPF1 that binds at the PARP active site (Fig. 2b). Alanine substitutions in Asp283, Asp286, and Arg239 greatly reduced the catalytic activity, while a complete loss of serine-ADP-ribosylation was observed for the E284A mutant (Fig. 3a). In contrast, mutating Glu243, an HPF1 residue located outside the PARP interface, did not affect the modification. Of note, results were comparable for PARP1- and PARP2-catalysed reactions, confirming their conserved interaction with HPF1.
Fig 3. DNA damage-induced ADP-ribosylation depends on functional HPF1.
a, Radioactive ADP-ribosylation assay of PARP1 and PARP2 +/− HPF1 (WT or mutant).
b, Active site of the HPF1-PARP2 complex with modelled-in acceptor ADP fragment, positioned by alignment with PDB:1A26.
c, HPF1 complementation and co-immunoprecipitation (IP) in 293T cells +/− H2O2. The “Pan ADPr” reagent recognises both mono and poly(ADP-ribose).
d, Structural alignment of the HPF1-PARP2 CAT ΔHD complex (top) and cholera toxin subunit A1 (PDB:1XTC; bottom).
e, Surface electrostatics mapped onto the HPF1-PARP2 CAT ΔHD complex surface. The interface between HPF1 and PARP2 is indicated with a dashed line.
Experiments in a and c were performed independently three times with similar results.
In the above assay, as in previous experiments5,8, the smear corresponding to PARP1/2 auto-modified with poly(ADP-ribose) was diminished upon addition of WT HPF1 (Fig. 3a). In order to understand how HPF1 limits poly(ADP-ribose) chain formation, we aligned our co-structure with the carba-NAD+-bound chicken PARP1 structure, which represents the elongation step of this reaction19. In the latter structure, His826 of PARP1 interacts with the second phosphate of the ADP fragment of the carba-NAD+ that mimics the acceptor ADP-ribose, while in our structure the equivalent His381 interacts with Asp283 of HPF1 (Fig. 3b). We conclude that poly(ADP-ribose) chain formation is sterically mutually exclusive at any given moment with serine-ADP-ribosylation. Although the initial HPF1-assisted serine modification events appear essential for normal ADP-ribosylation upon DNA damage8, the number and length of the ADP-ribose modifications are likely regulated by the relative quantities of HPF1-PARP1/2 complexes and free, activated PARP1/2 molecules.
The HPF1 mutants that impair serine-ADP-ribosylation in the radioactive assay generally also decreased the inhibitory effect of HPF1 on PARP auto-modification – with the notable exception of the E284A mutant, which showed no serine-ADP-ribosylation and yet efficiently limited PARP1 smearing, suggesting it can still interact with PARP1. Thus, while the effects of the D283A, D286A, and R239A mutations can be explained as the destabilisation of the HPF1-PARP1/2 interaction, Glu284 might play a role in either serine substrate recruitment or catalysis itself. These conclusions were corroborated in vivo by overexpressing the WT and mutant FLAG-tagged forms of HPF1 in HPF1 knock-out 293T cells (Fig. 3c). In the absence of exogenous HPF1, the HPF1+/+ but not HPF1-/- cells showed a DNA damage-dependent ADP-ribosylation pattern (Fig. 3c) similar to that previously observed, with histone proteins and PARP1 as major substrates8. This pattern could be fully restored in the HPF1-deficient cells by overexpressing WT and E243A FLAG-HPF1, or partially by overexpressing the R239A mutant. Little or no compensation was seen with the D283A, E284A, and D286A variants. These results generally correlated with those from co-immunoprecipitation, where most mutants showing impaired complementation lost PARP1/2 binding. However, two mutants clearly deviated from this trend: R239A and E284A. R239A showed partial complementation despite losing all PARP1/2 binding – this suggests that the HPF1-PARP interaction can be weak/transient and still produce detectable ADP-ribosylation levels. More strikingly, the E284A mutant, although inactive, still retained the full interaction with PARP1 and PARP2. Taken together, these results validate the PARP-binding interface of HPF1 observed in the crystal, while also implicating Glu284 in substrate recruitment or catalysis.
HPF1 complements the PARP1/2 active site
In order to explore the potential role of Glu284 of HPF1, we compared PARP1 with other ADP-ribosylating enzymes. Two functions have been suggested as important for catalysing this reaction: 1) stabilisation of the oxacarbenium ion that develops in the process of weakening the C1"-to-nicotinamide bond, and 2) activation, through general-base catalysis, of the nucleophile that attacks the C1" carbon to form the new bond 18,20,21. The latter function is dispensable when the substrate is an aspartate or glutamate residue that is deprotonated at neutral pH18,19,21,22, but efficient serine ADP-ribosylation would likely require catalytic deprotonation. Both of the functions can be fulfilled by negatively-charged carboxylic amino acid residues. Indeed, the arginine-specific subclass of cholera toxin-like ADP-ribosyl transferases (ARTCs) possesses a conserved glutamate dyad that has been suggested to serve precisely these roles23. PARPs, however, canonically contain only a single catalytic glutamate, exemplified by Glu988 of PARP1 or Glu545 of PARP2, 18,21,22. We hypothesised that serine-ADP-ribosylation, like arginine-ADP-ribosylation, involves two negatively-charged residues that could share the two main catalytic tasks. Structural alignment of the HPF1-PARP2 CAT ΔHD complex with the arginine-specific A1 subunit of cholera toxin24 demonstrates that while Glu545 of PARP2 and Glu112 of the cholera toxin subunit A1 occupy equivalent positions, PARPs do not possess a residue that would correspond to the second glutamate of cholera toxin (Glu110; Fig. 3d). Strikingly, this approximate position is occupied by Glu284 of HPF1 in the HPF1-PARP complex, leading to the formation of a composite active site. Of note, while E988Q PARP1 is still able to catalyse relatively efficient serine-ADP-ribosylation in the presence of WT HPF111, E284A HPF1 does not produce any detectable serine-ADP-ribosylation in conjunction with WT PARP1, suggesting Glu284 is the key catalytic residue of the compound enzyme (Fig. 3a).
Beyond its role in catalysis, HPF1 appears also to recognise the region on the substrate protein where modification will occur. Mapping electrostatic potential onto the surface of the complex allowed us to identify a putative peptide-binding canyon that is formed at the interface of HPF1 and PARP1/2 and is strongly negatively-charged on the HPF1 side (Fig. 3e). This site seems perfectly suited for binding Lys-Ser (KS) motifs that are highly enriched among serine-ADP-ribosylation substrates in vivo6,7,10,25.
HPF1-binding motifs in PARP1/2
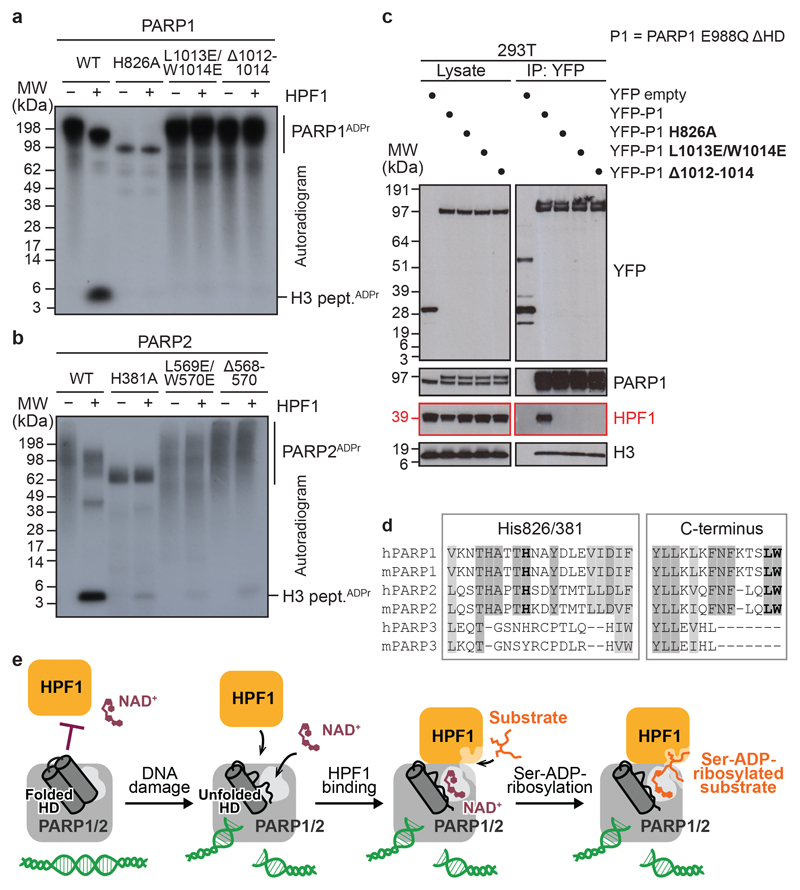
We went on to perform an in vitro and in vivo analysis of the residues on the PARP surface of the interaction interface. We probed the importance of His826 of PARP1, His381 of PARP2, and the PARP1/2 C-terminus with suitable deletion and substitution mutations. All these mutations led to severely impaired serine-ADP-ribosylation of the histone H3 peptide in vitro with both PARP1 and PARP2 (Fig. 4a and b). The H826A and H381A mutations additionally resulted in limited PARP auto-modification independent of HPF1, consistent with the importance of this residue not only for HPF1 binding, but also poly(ADP-ribose) chain elongation19. Finally, these results were corroborated in vivo in WT 293T cells using the YFP-PARP1 ΔHD E988Q construct introduced in Fig. 1f. Mutant variants harbouring H826A, L1013E/W1013E, or Δ1012-1014 mutations lost HPF1 binding (Fig. 4c). These findings confirm that the interaction with HPF1 depends on two conserved regions that distinguish PARP1 and PARP2 from PARP3: the His-containing loop that is important for both poly(ADP-ribose) chain elongation and serine-ADP-ribosylation, and the Leu-Trp sequence at the extreme C-terminus that is required only for the latter (Fig. 4d). The mutations in the Leu-Trp motif allow a separation of function that will be useful in future analyses.
Fig 4. HPF1-interacting PARP1/2 residues and model of DNA damage-induced ADP-ribosylation.
a, b, Radioactive ADP-ribosylation assay of PARP1 or PARP2 mutants +/− HPF1.
c, PARP1 co-immunoprecipitation (IP) from 293T cells treated with olaparib and H2O2.
d, Fragments of a multiple-sequence alignment of human (h) and mouse (m) PARP1, PARP2, and PARP3. Invariant (dark grey) and highly conserved (light grey) residues across at least four of the analysed proteins are highlighted. His826/381 (human PARP1/2 numbering) and the extreme C-terminal Leu-Trp motif are shown in bold.
e, Proposed model of HPF1-PARP1/2-dependent ADP-ribosylation upon DNA damage. The inhibition of HPF1 and NAD+ binding to PARP1/2 is relieved upon PARP1/2 binding to DNA breaks, leading to the formation of a composite HPF1-PARP active site capable of recruiting and modifying KS (shown) or other serine-based substrate motifs.
Experiments in a-c were performed independently three times with similar results.
Discussion
Findings over recent years led to the striking conclusion that, when it comes to DNA-damage signalling, both PARP1 and PARP2 are incomplete enzymes in need of the accessory factor HPF15,8. The above analysis suggests that this need arises because PARP1/2 have what is effectively a “half-finished” active site. By going beyond the usual architecture of an adaptor-enzyme complex – where an adaptor mediates substrate recruitment but does not take part in catalysis – the HPF1-PARP interaction results in a new, composite enzyme in which both PARP1/2 and HPF1 contribute substrate binding and catalytic residues. This situation is similar to the regulation of small GTPases by GTPase-activating proteins (GAPs), which famously contribute a missing catalytic residue, termed the arginine finger, to the GTPase active site26. To our knowledge, the activation of PARP1 and PARP2 by the “glutamate finger” of HPF1 (Glu284) is the first example of an analogous mechanism for an enzyme that catalyses protein post-translational modification. One implication of this intimate involvement of HPF1 is that some of the conclusions drawn from previous in vitro experiments performed with PARP1 alone – in particular some of the in vitro-identified modification sites – might be artificial, at least in the context of DNA repair. Using the composite HPF1-PARP1/2 enzyme overcomes this problem, allowing reconstitution of native-like DNA damage-dependent ADP-ribosylation in vitro.
The division of catalytic and substrate binding elements between HPF1 and PARP1/2 implies that the serine-ADP-ribosylation activity only occurs upon HPF1-PARP interaction, which is partially inhibited by the HD of PARPs. We propose that this serves a regulatory role in vivo, with ADP-ribose signalling being kept “on hold” until suitable cues, such as PARP binding to DNA damage, alleviate this inhibition by destabilising the HD (Fig. 4e). We previously reported dramatic sensitivity of HPF1 knock-out cells to PARP1 inhibitors5. The key role played by HPF1 in shaping the joint active site, as well as the allosteric link, via the HD, between HPF1 and DNA- and NAD+/inhibitor-binding sites on PARP1 suggest that HPF1 might directly affect PARP inhibition and trapping, and thus the response to clinical PARP inhibitors. Finally, following recent studies of the serine-specific ADP-ribose glycohydrolase ARH311,27–29, the current report completes the initial structural and mechanistic characterisation of ADP-ribosylation synthesis and reversal in the context of DNA damage.
Materials and methods
Plasmids and mutagenesis
The gene for Nematostella vectensis HPF1 (UniProt A7RS11) was codon-optimised for Escherichia coli expression, synthesised, and subcloned into pET28a with a C-terminal His6-tag. The gene encoding human HPF1 was recloned from pDONR2115 into pET28a for E. coli expression as an N-terminally His6-tagged protein. pET28a plasmids encoding N-terminally His6-tagged human PARP1 (UniProt P09874-1) and PARP2 (UniProt Q9UGN5-2), full-length and CAT ΔHD truncations, were gifts from John M. Pascal (University of Montreal)13,14,16,30. For human cell culture expression, genes for HPF1, PARP1, and PARP2 were cloned from pDONR2215 into the YFP- and FLAG-tag-conferring destination vectors using the LR Clonase II Enzyme Mix (Thermo Fisher). The HD deletion introduced in YFP-PARP1 was the same as published previously for His-tagged variant14. The construct used for human PARP1 CAT (residues 656-1014) expression for NMR and analytical SEC in Extended Fig. 3b was obtained using a codon-optimised (for E. coli) sequence for human PARP1 and a pET28 vector containing a sequence for N-terminally-His6-tagged Geobacillus stearothermophilus di-hydrolipoamide acetyltransferase (UniProt P11961) lipoyl-binding domain; the resultant protein product contained a TEV cleavage site between lipoyl-binding domain and PARP1656-1014. Site-directed mutagenesis was performed using QuikChange Lightning (Agilent) and Q5 (NEB) kits.
Expression and purification of unlabelled recombinant proteins
All recombinant proteins except for isotope-labelled PARP656-1014 for NMR and selenomethionine (SeMet)-substituted HPF1 from N. vectensis were expressed using E. coli Rosetta (DE3) cells in Lysogeny Broth (LB) supplemented with 50 μg/ml kanamycin, 34 μg/ml chloroamphenicol, and – for PARP1 and PARP2 production – 10 mM benzamide. Protein synthesis was induced at OD600 of 0.9 with 0.5 mM IPTG and allowed to proceed overnight at 18 °C. SeMet-substituted HPF1 from N. vectensis was expressed in the same way in B834-DE3 cells in M9 minimal medium containing SeMet. Cells were resuspended in lysis buffer (25 mM HEPES, pH 8, 500 mM NaCl, 0.5 mM Tris(2-carboxyethyl)phosphine hydrochloride (TCEP) and 2.5 U/ml benzonase (Novagen)) and lysed with EmulsiFlex-C5 homogeniser (Avestin). Purification, performed on an ÄKTA FPLC system (GE Healthcare Life Sciences) at 4 °C, always began with Ni-nitrilotriacetic (Ni-NTA) affinity chromatography. After lysate application, the HisTrap FF column (GE Healthcare Life Sciences) was washed with lysis buffer supplemented with, first, 50 mM imidazole and, second, NaCl to a total concentration of 1000 mM, followed by elution of bound protein with the addition of 250 mM imidazole. For HPF1 used in radioactive ADP-ribosylation assays, NiNTA was directly followed by size-exclusion chromatography (SEC) on a Superdex 200 column (GE Healthcare Life Sciences) in 25 mM HEPES, pH 8, 200 mM NaCl, 1 mM EDTA, 0.1 mM TCEP. For HPF1 used in other experiments, as well as for all PARP1 and PARP2 preparations, an additional chromatography step was introduced between NiNTA and SEC. For this purpose, NiNTA eluate was diluted 5-fold with 25 mM Tris, pH 7, 100 mM NaCl, 0.5 mM TCEP, applied either to HiTrap Q column (GE Healthcare Life Sciences) (for HPF1) or to a HiTrap Heparin column (GE Healthcare Life Sciences) (for PARP1/2) equilibrated in the same buffer, and eluted with a linear NaCl gradient to 1000 mM. Proteins were concentrated using Vivaspin devices (Sartorius) and concentration was determined using absorbance at 280 nm.
Expression and purification of isotope-labelled PARP1656-1014
Samples of uniformly 15N-labelled PARP1656-1014, or containing 15N labelling of single residue types lysine, arginine, leucine and isoleucine, or [2H,15N,13C] labelled PARP1656-1014 were expressed using E. coli BL21 (DE3) cells in M9 minimal media, supplemented with either 1g/l 15NH4Cl (Sigma-Aldrich ISOTECH), 0.1 g/l L-Lysine-α-15N dihydrochloride, (Cambridge Isotope Laboratories), L-Arginine-15N4 hydrochloride (Sigma-Aldrich) L-Leucine-15N or L-Isoleucine-15N, or 1g/l 15NH4Cl and 4 g/l 13C6,2H7-glucose (all from Cambridge Isotope Laboratories). Selective labelling of lysine and arginine residues was performed as previously described31. For selective 15N labelling of leucine and isoleucine residues, expression media were also supplemented with 0.1g/l of all non-target proteinogenic amino acids (all from Sigma-Aldrich) as previously described32. [2H,15N,13C] labelled PARP1656-1014 was expressed as previously described33. 50 μg ml-1 kanamycin was added to all expression media. Expression was induced with 2 mM IPTG when the OD600 of the cells was 0.9 and cells were incubated overnight at 30 °C. After centrifugation, cells were resuspended in 50 mM HEPES, pH 8, 500 mM NaCl, 0.5 mM TCEP, 1mM PMSF, 2.5 U/ml benzonase, and protease inhibitor mix (1 tablet Roche EDTA-free cOmplete Protease Inhibitor Cocktail per 50 ml buffer) and lysis was performed using a cell disruptor. Cleared lysate was incubated with nickel-nitriloacetic acid (Ni-NTA) agarose resin (Qiagen) for 90 minutes at 4 °C. The resin was washed with 150 ml HEPES, pH 8.0, 500 mM NaCl, 0.5 mM TCEP, 1 mM PMSF and bound protein was eluted using the same buffer containing 300 mM imidazole. Elution fractions were pooled and cleaved overnight with a His-tagged TEV protease overnight and Ni-NTA was used to remove TEV protease and His-tagged lipoyl domain. Cleavage by TEV protease left an N-terminal G scar on PARP1656-1014. Following cleavage, the PARP1656-1014 was purified by size exclusion chromatography using a HiLoad 26/20 Superdex 75 prep grade column (GE Healthcare) in 50 mM HEPES, pH 8.0, 150 mM NaCl, 0.5 mM TCEP. Finally, fractions containing pure 15N-labelled PARP1656-1014 were pooled and buffer exchanged into 50 mM [2H11] Tris pH 7.0, 50 mM NaCl, and 2 mM [2H10] DTT (deuterated Tris and DTT both from Cambridge Isotope Laboratories) for NMR spectroscopy.
Analytical size-exclusion chromatography (SEC)
Analytical SEC analysis presented in Fig. 1d was performed using a 10/300 GL Superose 6 column (GE Healthcare Life Sciences) equilibrated in 10 mM HEPES, pH 8, 200 mM NaCl, 1 mM EDTA, 0.2 mM TCEP. Each analysed sample had a volume of 500 μl and contained 2.5 μM full-length human His6-tagged-HPF1, 0.5 mM histone H3 peptide (residues 1-20, ARTKQTARKSTGGKAPRKQLA), and the additives indicated in the figure at the following concentrations: full-length human His6-PARP1 at 5 μM; a DNA duplex (5' ATCAGATAGCATCTGTGCGGCCGCTTAGGG 3' and 5' CCCTAAGCGGCCGCACAGATGCTATCTGAT 3') at 3 μM; EB-47 (Santa Cruz Biotechnology) at 100 μM. Analytical SEC analysis presented in Fig. 1e and Extended Fig. 3 was performed using a 10/300 GL Superdex 200 Increase column (GE Healthcare Life Sciences) equilibrated in 10 mM HEPES, pH 8, 200 mM NaCl, 0.2 mM TCEP. Each analysed sample had a volume of 500 μl l and contained the indicated proteins at the following concentrations: full-length human His6-HPF1 at 25 μM; His6-lipoyl-PARP1 CAT at 40 μM; His6-PARP1 CAT ΔHD at 40 μM. In both experimental series, 0.75-ml fractions were collected and analysed by SDS-PAGE.
Crystallisation, data collection, structure solution, refinement, and analysis
All protein crystals were grown at room temperature by the vapour diffusion method in sitting drops of 200-400 nl containing 50% v/v reservoir and 50% v/v protein solution in gel filtration buffer. Crystals of SeMet-substituted full-length HPF1-His6 from N. vectensis were obtained using 0.2 M imidazole malate pH 5.5, 15% v/v PEG600 as reservoir and a 300-μM protein solution. Crystals of native N. vectensis HPF1 were grown in drops containing 0.2 M sodium malonate dibasic monohydrate, 20% w/v PEG 3350 mixed with the protein at 1650 μM. Crystals of human HPF1 were grown by mixing 33% glycerol ethoxylate and 0.23 M lithium citrate tribasic tetrahydrate and His6-HPF1 Δ1-36 at 300 μM. Cryo protection of all HPF1 crystals was performed in 20% v/v glycerol in mother liquor. The HPF1-PARP2 CAT ΔHD co-crystals were grown by mixing 0.1 M MES pH 6, 25% v/v pentaerythritol propoxylate (5/4 PO/OH) with the protein sample containing: 540 μM human His6-HPF1 Δ1-36, 540 μM human His6-PARP2 CAT ΔHD (PARP2 lacking residues 1-217 and 241-334 according to isoform 2 numbering), 1 mM EB-47 (Santa Cruz Biotechnology), 1.5 mM histone H3 peptide (1-20), 2% v/v DMSO. The co-crystals were cryo-protected in 0.1 M imidazole-MES buffer at pH 6.5, 20% v/v PEG500 MME, 10% w/v PEG 20,000, 30 mM MgCl2, and 30 mM CaCl2.
X-ray diffraction data were collected using synchrotron radiation at Diamond Light Source (Rutherford Appleton Laboratory, Harwell, UK) at 100 K at beamlines I03 (SeMet N. vectensis HPF1, human HPF1, and HPF1-PARP2 CAT ΔHD complex) and I04 (native N. vectensis HPF1). We used X-ray wavelength of 0.9796 Å (SeMet N. vectensis HPF1), 0.9199 Å (native N. vectensis HPF1), 0.9787 Å (human HPF1), and 0.9762 Å (HPF1-PARP2 CAT ΔHD complex). The initial HPF1 model was built from anomalous data obtained from SeMet N. vectis HPF1 crystals integrated using XDS34, followed by POINTLESS35 to verify the space group identity and then scaled with AIMLESS35. Anomalous phasing was carried out with AUTOSOL36 using the single wavelength anomalous dispersion (SAD) method, which produced an initial model and a density-modified map using RESOLVE37. X-ray data from native crystals were processed with the XIA2 platform38 and phase information was obtained using the molecular replacement method with PHASER39. Atomic models were improved following consecutive cycles of manual building in COOT40 and structure refinement in REFMAC541 and PHENIX REFINE42. For the HPF1-PARP2 CAT ΔHD structure, we used reference model restraints in PHENIX REFINE with our human HPF1 and previously published PARP2 CAT ΔHD (PDB:5DSY) structures as reference models, and we relied on FEM maps43 during manual rebuilding. The structures were refined to good Ramachandran statistics without outliers except for the HPF1-PARP2 CAT ΔHD structure, which contains 0.37% outliers. Structural alignments and analyses, as well as figure preparation, were carried out using PyMol (Molecular Graphics System, Version 1.8 Schrödinger, LLC). Sequence conservation mapping was performed using ConSurf 201644. For multiple-sequence alignments, MAFFT 745 was used.
Radioactive ADP-ribosylation assays
22.5 μM histone H3 peptide comprising residues 1-20 (custom synthesis with Genscript) was incubated at room temperature with 1 μM PARP1 or PARP2 in the presence or absence of 1.5 μM HPF1. The reaction buffer contained 50 mM Tris, 100 mM NaCl, pH 8.0, 1 μM DNA duplex (5' ATCAGATAGCATCTGTGCGGCCGCTTAGGG 3' and 5' CCCTAAGCGGCCGCACAGATGCTATCTGAT 3'), and 100 μM NAD+ spiked with 32P-NAD+ from Perkin Elmer. The modification reaction proceeded for 20 minutes before addition of SDS-PAGE loading dye and sample boiling. The samples were resolved by SDS-PAGE and analysed by autoradiography.
Cell culture, co-immunoprecipitation, and immunoblotting
Human 293T cells were cultured in DMEM (Sigma Aldrich) supplemented with 10% FBS (Thermo Scientific) and 1% penicillin/streptomycin (Thermo Scientific). Cells were grown at 37 °C and 5% CO2. 293T WT and HPF1-/- cell lines were used as previously described (Palazzo et al. 2018, Fontana et al. 2017, Gibbs-Seymour et al. 2016). Cells were transfected with indicated plasmids using Polyfect transfection reagent (Qiagen) for 24 hours according to the Qiagen Quick-Start protocol. To induce DNA damage, 2 mM H2O2 in DPBS was added to cells for 10 minutes at 37 °C. Cells were lysed on ice in Triton X-100 buffer (1% Triton X-100, 100 mM NaCl, 50 mM Tris-HCl pH 8.0) supplemented with 2 μM olaparib (Cayman Chemical), 2 μM PARG inhibitor PDD00017273 (Sigma Aldrich), 1x phosphatase (Roche) and protease (Roche) inhibitor mixes and 0.1% Benzonase (Sigma Aldrich).
Co-immunoprecipitation of FLAG-tagged constructs was carried out using Anti-FLAG M2 Affinity Gel (Fisher Scientifc). For co-immunoprecipitation of YFP-tagged constructs GFP-Trap Magnetic Agarose (Chromotek) was used. In both cases, co-immunoprecipitation was carried out for 2 hours. Western blotting was carried out as previously described11. HPF1 antibody was custom-produced. Anti-pan-ADP-ribose binding reagent is a primary rabbit antibody-like reagent that recognizes all forms of ADP-ribose. Non-conjugated primary antibodies were detected with HRP-conjugated secondary antibodies against the corresponding species.
The following antibodies were used in the study (supplier, catalogue number, clone number, lot number, dilution): primary anti-GFP (Abcam, ab290, polyclonal, GR3270983-1, 1:5,000), primary anti-PARP1 (Abcam, ab32138, E102, GR29754-56, 1:5,000), primary anti-H3 (EMD, Millipore, 07-690, polyclonal, 3068449, 1:50,000), primary Pan-ADPr binding agent (EMD Millipore, MABE1016, recombinant, 3223347, 1:1,500), primary anti-PARP2 (Enzo Life Scienes, ALX-804-639-L001, 4G8, 07101905, 1:500), primary anti-FLAG (Sigma Aldrich, A8592-1MG, 2M, SLBD9930, 1:50,000), primary anti-HPF1 (DC Biosciences, custom-made, polyclonal against peptide RELPETDADLKRIC, n/a, 1:250), secondary anti-mouse (Agilent, P0447, polyclonal, 20070514, 1:2,000), secondary anti-rabbit (Agilent, P0399, polyclonal, 20058714, 1:2,000).
NMR Spectroscopy
All NMR measurements were performed on in-house Bruker Avance III 600 MHz or Avance III HD 800 MHz spectrometers or the Avance III HD 950 MHz spectrometer at the MRC Biomedical NMR Centre, all equipped with 5 mm 1H-13C-15N cryogenic probes. All NMR samples were prepared using 50 mM [2H11] Tris pH 7.0, 50 mM NaCl and 2 mM [2H10] DTT in 95:5 H2O/2H2O. Data were processed using the programmes MddNMR46, NMRPIPE47, and TopSpin (Bruker BioSpin GmbH, Germany), and analysed using the programme CcpNMR Analysis 2.4.248.
Backbone amides of PARP1656-1014 were assigned mainly using data from TROSY-based HNCA, HN(CO)CA, HNCACB and HN(CO)CACB triple-resonance spectra49,50 recorded with non-uniform sampling at 30 °C from a 0.2 mM [2H,15N, 13C] labelled PARP1656-1014 sample. The assignment process was aided by using data from two-dimensional [15N,1H] HSQC spectra recorded at 30 °C from PARP1656-1014 samples selectively labelled with either 15N-lysine, 15N-arginine, 15N-leucine or 15N-isoleucine, and assignments were transferred to 25 °C by careful comparison of TROSY spectra aided by analysing three-dimensional 15N-1H HSQC-NOESY spectra (τm = 70 ms) from a 0.4 mM 15N-labelled sample recorded at 25 °C. Assignments at 25 °C (Extended Data Fig. 6) were made for 96.7% of 343 non-proline backbone amide groups, as well as for Cα in 95.8% and Cβ in 87.5% of all 360 residues (amide group signals were consistently missing from all spectra for residues 823-827). Backbone amide peak intensities in spectra of bound and unbound PARP1656-1014 were measured at 25 °C in two-dimensional 15N-1H-TROSY spectra from samples containing either 0.15 mM 15N-labelled PARP1656-1014 only, or 0.15 mM 15N-labelled PARP1656-1014 and natural abundance 0.15 mM full-length HPF1. 15N{1H} steady state NOEs were measured using a previously described pulse sequence51 using a 0.4 mM 15N-labelled sample at 25 °C and a saturation time of 7 seconds. Error bars were derived as previously described52.
Extended Data
Extended Data Figure 1. Structures of HPF1 from Nematostella vectensis and Homo sapiens.
Ribbon diagrams of HPF1 structures coloured according to domain organisation. All three structures are shown in corresponding orientations based on a structural alignment. For Nematostella vectensis HPF1, which crystallised with two molecules in the asymmetric unit, both molecules are shown.
Extended Data Figure 2. Analytical size-exclusion chromatography analysis of HPF1-PARP1 interaction.
Uncropped SDS-PAGE gels with fractions from analytical size-exclusion chromatography. HPF1 was analysed in the presence or absence of PARP1 and either alone or with a short DNA duplex and/or the NAD+ analogue EB-47. Images from Fig. 1d are identical with areas marked with grey rectangles. Note the changed elution profile of PARP1 itself in the presence of DNA and EB-47, especially the shift in the peak centre on addition of DNA, possibly reflecting PARP1 oligomerisation.
Extended Data Figure 3. Analytical size-exclusion chromatography of HPF1-PARP1 CAT interaction.
a, Uncropped gels with fractions from analytical size-exclusion chromatography shown in Fig. 1e.
b, Analytical size-exclusion chromatography analysis of PARP1 CAT binding to HPF1. PARP1 CAT was used with its lipoyl tag (see Materials and Methods) uncleaved to allow it to be distinguished from HPF1, which has approximately the same molecular weight and elution profile as PARP1 CAT (data not shown). For uncropped gels, see the HPF1 gel in a and two gels in c.
c, Uncropped gels for the analysis shown in b.
Contaminants of HPF1 are marked with *
Extended Data Figure 4. Structure of the HPF1-PARP2 CAT ΔHD complex.
a, Ribbon diagrams and surface representations of the HPF1-PARP2 CAT ΔHD complex. The bound NAD+ analogue, EB-47, is shown as sticks.
b, Structural diagrams of the HPF1-PARP2 active site with the catalytic residues Glu284 (HPF1) and Glu545 (PARP2, equivalent to Glu988 in PARP1) and bound/modelled ligands shown as sticks and feature-enhanced modified σ-weighted electron density 2Fo – Fc map (FEM) contoured at 1σ. Left, the original EB-47-bound structure. Right, the same view with NAD+ modelled in place of EB-47 by alignment with Protein Data Bank (PDB) ID 6BHV (electron density belongs to EB-47). Glu284 side-chain carboxylate group of HPF1 is located 4.5-6 Å away from the C1" of the modelled NAD+. A tentative location of a serine substrate between NAD+ and Glu284 is indicated.
Extended Data Figure 5. Backbone amide signal intensity ratios for PARP1 CAT +/- HPF1.
Expansions of the histograms shown in Fig. 2d, showing backbone amide signal intensity ratios derived from 15N-1H-TROSY spectra of 15N-labelled PARP1656-1014 measured +/- HPF1 (top) and steady-state {1H}15N NOE values for free 15N-labelled PARP1656-1014 (bottom), plotted as a function of PARP1 amino-acid sequence for the HD subdomain (left) and the ART subdomain (i.e. the CAT domain without the HD) (right). Error estimates (in red) were calculated by taking the r. m. s. noise intensity in each spectrum as the measurement error, with the error in intensity ratios propagated according to the standard formula σA/B = (A/B)[(σA/A)2 + (σB/B)2]1/2.
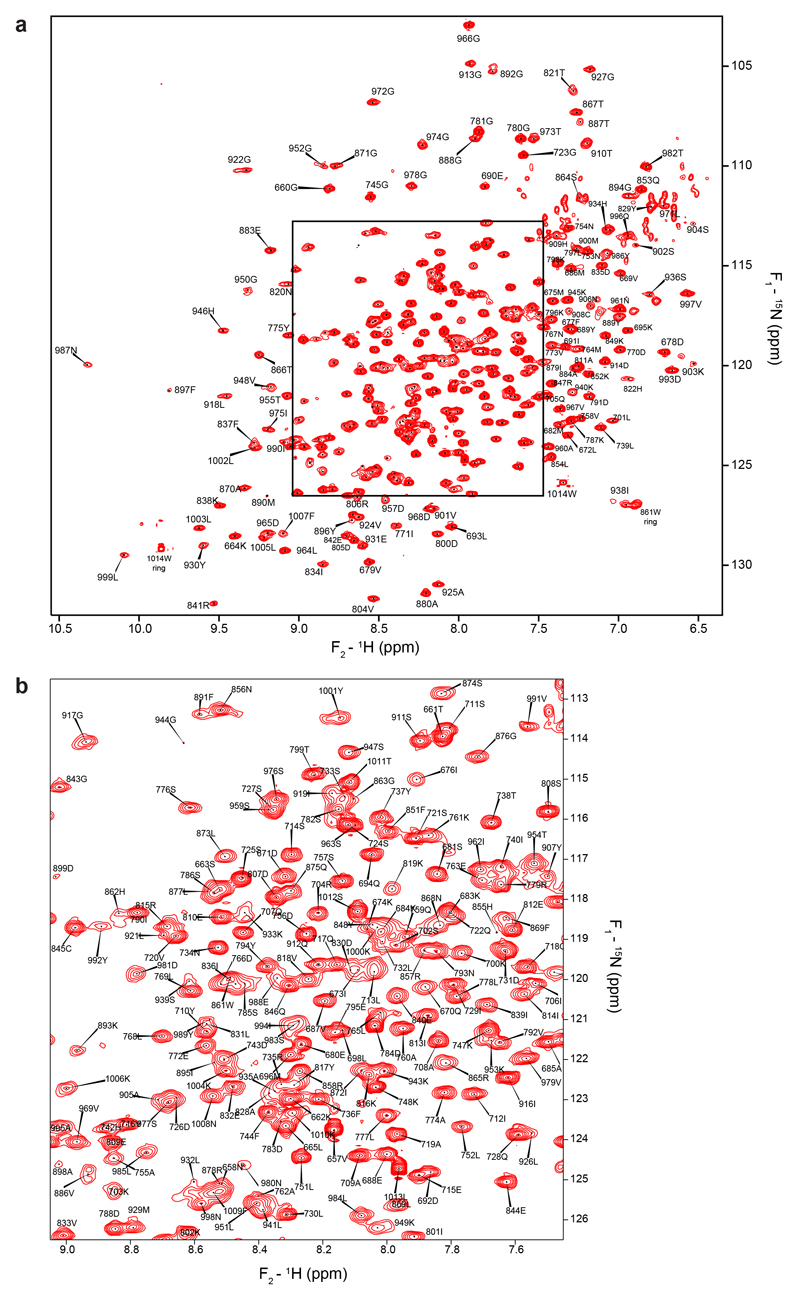
Extended Data Figure 6. Backbone amide NH signal assignments for PARP1 CAT.
a, [15N,1H] TROSY spectrum of 15N-labelled human PARP-1656-1014 recorded at 800 MHz and 25°C, showing backbone amide NH signal assignments. Protein concentration was 400 μM in 50 mM [2H11] Tris pH 7.0, 50 mM NaCl and 2 mM [2H10] DTT in 95:5 H2O/2H2O.
b, Expansion of the most crowded region of the spectrum shown in a.
Extended Data Figure 7. [15N,1H] TROSY spectra of PARP1 CAT +/- HPF1.
[15N,1H] TROSY spectra of human PARP1656-1014 in the absence (grey) or presence (blue) of human full-length HPF1 at a 1:1 ratio, recorded at 800 MHz and 25 °C. Protein concentrations were 150 μM, samples contained 50 mM [2H11] Tris pH 7.0, 50 mM NaCl and 2 mM [2H10] DTT in 95:5 H2O/2H2O. The spectra were acquired, processed and contoured identically.
Extended Data Figure 8. Model of the HPF1-PARP1 CAT interaction.
Additional views of the model of the HPF1-PARP1 CAT interaction shown in Fig. 2e. The complex is shown in the same orientations with PARP1 in surface (a) and ribbon (b) representation. Colouring of PARP1 CAT is according to the scale defined in Fig. 2e. HPF1 is coloured beige (“wheat”) and shown in semi-transparent ribbon representation.
Extended Data Figure 9. Structure of the HPF1-PARP2 CAT ΔHD complex with modelled HD subdomain.
Ribbon diagrams of the HPF1-PARP2 CAT ΔHD complex with the PARP2 HD modelled in based on a structural alignment between the PARP2 CAT ΔHD fragment and a previous PARP2 CAT structure that includes the HD (PDB: 4zzx). Glu284 and EB-47 are shown in stick representation for orientation. The HD is shown in ribbon representation (a) and as a semi-transparent space-filling model (b). In b, examples of prominent side-chains that might clash with HPF1 if this HD positioning were maintained are labelled and shown in stick representation.
Extended Data Table 1. Data collection and refinement statistics for crystal structures described in the study.
Values in parentheses are for the highest resolution shell.
|
N. vectensis HPF1 (SeMet SAD) PDB ID: 6TVH |
N. vectensis HPF1 (Native) PDB ID: 6TX1 |
H. sapiens HPF1 PDB ID: 6TX2 |
H. sapiens HPF1-PARP2 CAT ΔHD PDB ID: 6TX3 |
|
|---|---|---|---|---|
| Data collection | ||||
| Space group | H 3 | H 3 | P 65 | P 61 |
| Cell dimensions | ||||
| a, b, c (Å) | 88.95, 88.95, 224.10 | 89.16, 89.16, 223.00 | 115.10, 115.10, 90.39 | 115.62, 115.62, 143.61 |
| a, b, g (°) | 90, 90, 120 | 90 90 120 | 90 90 120 | 90 90 120 |
| Wavelength (Å) | 0.9796 | 0.9199 | 0.9787 | 0.9762 |
| Resolution (Å) | 72.85-2.65 (2.78-2.65) | 72.97-2.09 (2.13-2.09) | 99.68-2.09 (2.13-2.09) | 100.13-2.96 (3.01-2.96) |
| Rmerge | 0.09 (0.91) | 0.13 (1.74) | 0.17 (2.67) | 0.07 (1.20) |
| CC1/2 | 1.00 (0.04) | 1.00 (0.70) | 1.00 (0.79) | 1.00 (0.96) |
| I / sI | 16.3 (2.0) | 8.1 (1.1) | 11.5 (1.2) | 14.0 (1.2) |
| Completeness (%) | 97.5 (83.3) | 99.99 (99.80) | 99.71 (98.94) | 100.0 (99.35) |
| Redundancy | 9.9 (7.7) | 9.7 (9.7) | 19.66 (18.68) | 10.41 (10.77) |
| Refinement | ||||
| Resolution (Å) | 72.85-2.65 (2.75 -2.65) | 63.48-2.09 (2.17-2.09) | 57.55-2.09 (2.17-2.09) | 41.07-2.96 (3.07-2.96) |
| No. reflections | 37220 (3000) | 39121 (2686) | 40174 (2658) | 22155 (2955) |
| Rwork / Rfree | 0.22 (0.34)/ 0.29 (0.38) | 0.21 (0.31) / 0.27 (0.37) | 0.19 (0.29) / 0.21 (0.31) | 0.23 (0.52) / 0.26 (0.54) |
| No. atoms | 4835 | 4996 | 2679 | 4518 |
| Protein | 4820 | 4697 | 2478 | 4479 |
| Ligand/ion | 0 | 0 | 1 | 39 |
| Water | 15 | 299 | 200 | 0 |
| B-factors | 76.47 | 49.98 | 47.30 | 154.0 |
| Protein | 76.53 | 50.12 | 46.84 | 154.1 |
| Ligand/ion | N/A | N/A | 47.62 | 146.9 |
| Water | 55.25 | 47.87 | 53.00 | N/A |
| R.m.s. deviations | ||||
| Bond lengths (Å) | 0.005 | 0.009 | 0.008 | 0.009 |
| Bond angles (°) | 1.05 | 1.07 | 0.92 | 1.59 |
Acknowledgements
We thank Johannes Rack and Josip Ahel for comments on the manuscript; Edward Bartlett, Aksel Saukko-Paavola, Rebecca Hughes, and Valentina Zorzini for help with biochemical experiments; Edward Lowe and Marion Schuller for help with X-ray diffraction data collection; Tim Clausen and Antonia Vogel for discussions; John M. Pascal (University of Montreal) for sharing reagents; Diamond Light Source for access to and excellent assistance at beamlines I03, I04, I04-1, and I24 throughout the project [proposal numbers mx9306 mx18069]; Francis Crick Institute for access to the MRC Biomedical NMR Centre [the Francis Crick Institute receives core funding from Cancer Research UK (FC001029), the UK Medical Research Council (FC001029), and the Wellcome Trust (FC001029)].
Work in Ivan Ahel’s group is funded by the Wellcome Trust [grant numbers 101794 and 210634], BBSRC [BB/R007195/1] and Cancer Research UK [C35050/A22284]. Work in David Neuhaus’s group is supported by the Medical Research Council [grant U105178934]. Work in Dragana Ahel’s group is funded by the Cancer Research UK Career Development Fellowship [grant number 16304]. MJS is supported by an EMBO Long-Term Fellowship [ALTF 879-2017]. TEHO and WJH are supported by an LMB/AstraZeneca BlueSkies postdoctoral fellowship [BSF22].
Footnotes
Conflict of interest
The authors declare no conflicts of interest.
Data availability
Crystallography atomic coordinates and structure factors were deposition in the Protein Data Bank (PDB) with accession codes 6TVH, 6TX1, 6TX2, and 6TX3. All other source data is included in the paper and any further information will be provided upon reasonable request.
Author contributions
IA conceived the project with input from MJS, DN, and DA. PF and AA solved the NvHPF1 structure. LB and MJS solved the HsHPF1 structure. MJS solved the HPF1-PARP2 structure and conducted biochemical experiments with assistance of LB and KZ. FZ conducted in vivo experiments. DN, TEHO, J-CY and WJH conducted NMR analysis. MJS, IA, and DN wrote the manuscript with assistance of all authors.
References
- 1.Gupte R, Liu Z, Kraus WL. PARPs and ADP-ribosylation: recent advances linking molecular functions to biological outcomes. Genes & development. 2017;31:101–126. doi: 10.1101/gad.291518.116. [DOI] [PMC free article] [PubMed] [Google Scholar]
- 2.Pascal JM. The comings and goings of PARP-1 in response to DNA damage. DNA repair. 2018;71:177–182. doi: 10.1016/j.dnarep.2018.08.022. [DOI] [PMC free article] [PubMed] [Google Scholar]
- 3.Martin-Hernandez K, Rodriguez-Vargas JM, Schreiber V, Dantzer F. Expanding functions of ADP-ribosylation in the maintenance of genome integrity. Seminars in cell & developmental biology. 2017;63:92–101. doi: 10.1016/j.semcdb.2016.09.009. [DOI] [PubMed] [Google Scholar]
- 4.Liu C, Vyas A, Kassab MA, Singh AK, Yu X. The role of poly ADP-ribosylation in the first wave of DNA damage response. Nucleic acids research. 2017;45:8129–8141. doi: 10.1093/nar/gkx565. [DOI] [PMC free article] [PubMed] [Google Scholar]
- 5.Gibbs-Seymour I, Fontana P, Rack JGM, Ahel I. HPF1/C4orf27 Is a PARP-1-Interacting Protein that Regulates PARP-1 ADP-Ribosylation Activity. Molecular cell. 2016;62:432–442. doi: 10.1016/j.molcel.2016.03.008. [DOI] [PMC free article] [PubMed] [Google Scholar]
- 6.Leidecker O, et al. Serine is a new target residue for endogenous ADP-ribosylation on histones. Nature chemical biology. 2016;12:998–1000. doi: 10.1038/nchembio.2180. [DOI] [PMC free article] [PubMed] [Google Scholar]
- 7.Bonfiglio JJ, et al. Serine ADP-Ribosylation Depends on HPF1. Molecular cell. 2017;65:932–940 e936. doi: 10.1016/j.molcel.2017.01.003. [DOI] [PMC free article] [PubMed] [Google Scholar]
- 8.Palazzo L, et al. Serine is the major residue for ADP-ribosylation upon DNA damage. eLife. 2018;7 doi: 10.7554/eLife.34334. [DOI] [PMC free article] [PubMed] [Google Scholar]
- 9.Crawford K, Bonfiglio JJ, Mikoc A, Matic I, Ahel I. Specificity of reversible ADP-ribosylation and regulation of cellular processes. Critical reviews in biochemistry and molecular biology. 2018;53:64–82. doi: 10.1080/10409238.2017.1394265. [DOI] [PubMed] [Google Scholar]
- 10.Larsen SC, Hendriks IA, Lyon D, Jensen LJ, Nielsen ML. Systems-wide Analysis of Serine ADP-Ribosylation Reveals Widespread Occurrence and Site-Specific Overlap with Phosphorylation. Cell reports. 2018;24:2493–2505 e2494. doi: 10.1016/j.celrep.2018.07.083. [DOI] [PubMed] [Google Scholar]
- 11.Fontana P, et al. Serine ADP-ribosylation reversal by the hydrolase ARH3. eLife. 2017;6 doi: 10.7554/eLife.28533. [DOI] [PMC free article] [PubMed] [Google Scholar]
- 12.Langelier MF, Planck JL, Roy S, Pascal JM. Structural basis for DNA damage-dependent poly(ADP-ribosyl)ation by human PARP-1. Science. 2012;336:728–732. doi: 10.1126/science.1216338. [DOI] [PMC free article] [PubMed] [Google Scholar]
- 13.Langelier MF, Riccio AA, Pascal JM. PARP-2 and PARP-3 are selectively activated by 5' phosphorylated DNA breaks through an allosteric regulatory mechanism shared with PARP-1. Nucleic Acids Res. 2014;42:7762–7775. doi: 10.1093/nar/gku474. [DOI] [PMC free article] [PubMed] [Google Scholar]
- 14.Dawicki-McKenna JM, et al. PARP-1 Activation Requires Local Unfolding of an Autoinhibitory Domain. Molecular cell. 2015;60:755–768. doi: 10.1016/j.molcel.2015.10.013. [DOI] [PMC free article] [PubMed] [Google Scholar]
- 15.Langelier MF, Eisemann T, Riccio AA, Pascal JM. PARP family enzymes: regulation and catalysis of the poly(ADP-ribose) posttranslational modification. Current opinion in structural biology. 2018;53:187–198. doi: 10.1016/j.sbi.2018.11.002. [DOI] [PMC free article] [PubMed] [Google Scholar]
- 16.Langelier MF, Zandarashvili L, Aguiar PM, Black BE, Pascal JM. NAD(+) analog reveals PARP-1 substrate-blocking mechanism and allosteric communication from catalytic center to DNA-binding domains. Nature communications. 2018;9 doi: 10.1038/s41467-018-03234-8. 844. [DOI] [PMC free article] [PubMed] [Google Scholar]
- 17.Ame JC, Spenlehauer C, de Murcia G. The PARP superfamily. BioEssays : news and reviews in molecular, cellular and developmental biology. 2004;26:882–893. doi: 10.1002/bies.20085. [DOI] [PubMed] [Google Scholar]
- 18.Marsischky GT, Wilson BA, Collier RJ. Role of glutamic acid 988 of human poly-ADP-ribose polymerase in polymer formation. Evidence for active site similarities to the ADP-ribosylating toxins. The Journal of biological chemistry. 1995;270:3247–3254. doi: 10.1074/jbc.270.7.3247. [DOI] [PubMed] [Google Scholar]
- 19.Ruf A, de Murcia G, Schulz GE. Inhibitor and NAD+ binding to poly(ADP-ribose) polymerase as derived from crystal structures and homology modeling. Biochemistry. 1998;37:3893–3900. doi: 10.1021/bi972383s. [DOI] [PubMed] [Google Scholar]
- 20.Bell CE, Eisenberg D. Crystal structure of diphtheria toxin bound to nicotinamide adenine dinucleotide. Biochemistry. 1996;35:1137–1149. doi: 10.1021/bi9520848. [DOI] [PubMed] [Google Scholar]
- 21.Ruf A, Mennissier de Murcia J, de Murcia G, Schulz GE. Structure of the catalytic fragment of poly(AD-ribose) polymerase from chicken. Proceedings of the National Academy of Sciences of the United States of America. 1996;93:7481–7485. doi: 10.1073/pnas.93.15.7481. [DOI] [PMC free article] [PubMed] [Google Scholar]
- 22.Kleine H, et al. Substrate-assisted catalysis by PARP10 limits its activity to mono-ADP-ribosylation. Molecular cell. 2008;32:57–69. doi: 10.1016/j.molcel.2008.08.009. [DOI] [PubMed] [Google Scholar]
- 23.Laing S, Unger M, Koch-Nolte F, Haag F. ADP-ribosylation of arginine. Amino acids. 2011;41:257–269. doi: 10.1007/s00726-010-0676-2. [DOI] [PMC free article] [PubMed] [Google Scholar]
- 24.Zhang RG, et al. The three-dimensional crystal structure of cholera toxin. Journal of molecular biology. 1995;251:563–573. doi: 10.1006/jmbi.1995.0456. [DOI] [PubMed] [Google Scholar]
- 25.Hendriks IA, Larsen SC, Nielsen ML. An Advanced Strategy for Comprehensive Profiling of ADP-ribosylation Sites Using Mass Spectrometry-based Proteomics. Molecular & cellular proteomics : MCP. 2019;18:1010–1026. doi: 10.1074/mcp.TIR119.001315. [DOI] [PMC free article] [PubMed] [Google Scholar]
- 26.Ahmadian MR, Stege P, Scheffzek K, Wittinghofer A. Confirmation of the arginine-finger hypothesis for the GAP-stimulated GTP-hydrolysis reaction of Ras. Nature structural biology. 1997;4:686–689. doi: 10.1038/nsb0997-686. [DOI] [PubMed] [Google Scholar]
- 27.Rack JGM, et al. (ADP-ribosyl)hydrolases: Structural Basis for Differential Substrate Recognition and Inhibition. Cell chemical biology. 2018;25:1533–1546 e1512. doi: 10.1016/j.chembiol.2018.11.001. [DOI] [PMC free article] [PubMed] [Google Scholar]
- 28.Wang M, et al. Structure-function analyses reveal the mechanism of the ARH3-dependent hydrolysis of ADP-ribosylation. The Journal of biological chemistry. 2018;293:14470–14480. doi: 10.1074/jbc.RA118.004284. [DOI] [PMC free article] [PubMed] [Google Scholar]
- 29.Pourfarjam Y, et al. Structure of human ADP-ribosyl-acceptor hydrolase 3 bound to ADP-ribose reveals a conformational switch that enables specific substrate recognition. The Journal of biological chemistry. 2018;293:12350–12359. doi: 10.1074/jbc.RA118.003586. [DOI] [PMC free article] [PubMed] [Google Scholar]
- 30.Langelier MF, Planck JL, Servent KM, Pascal JM. Purification of human PARP-1 and PARP-1 domains from Escherichia coli for structural and biochemical analysis. Methods in molecular biology. 2011;780:209–226. doi: 10.1007/978-1-61779-270-0_13. [DOI] [PubMed] [Google Scholar]
- 31.Chae Y-K. Recommendations for the Selective Labeling of [15N]-Labeled Amino Acids without Using Auxotrophic Strains. Journal of the Korean Magnetic Resonance Society. 2000;4:133–139. [Google Scholar]
- 32.Tong KI, Yamamoto M, Tanaka T. A simple method for amino acid selective isotope labeling of recombinant proteins in E. coli. Journal of biomolecular NMR. 2008;42:59–67. doi: 10.1007/s10858-008-9264-0. [DOI] [PubMed] [Google Scholar]
- 33.Marley J, Lu M, Bracken C. A method for efficient isotopic labeling of recombinant proteins. Journal of biomolecular NMR. 2001;20:71–75. doi: 10.1023/a:1011254402785. [DOI] [PubMed] [Google Scholar]
- 34.Kabsch W. Xds. Acta crystallographica Section D, Biological crystallography. 2010;66:125–132. doi: 10.1107/S0907444909047337. [DOI] [PMC free article] [PubMed] [Google Scholar]
- 35.Evans P. Scaling and assessment of data quality. Acta crystallographica Section D, Biological crystallography. 2006;62:72–82. doi: 10.1107/S0907444905036693. [DOI] [PubMed] [Google Scholar]
- 36.Terwilliger TC, et al. Decision-making in structure solution using Bayesian estimates of map quality: the PHENIX AutoSol wizard. Acta crystallographica Section D, Biological crystallography. 2009;65:582–601. doi: 10.1107/S0907444909012098. [DOI] [PMC free article] [PubMed] [Google Scholar]
- 37.Terwilliger TC, Berendzen J. Automated MAD and MIR structure solution. Acta crystallographica Section D, Biological crystallography. 1999;55:849–861. doi: 10.1107/s0907444999000839. [DOI] [PMC free article] [PubMed] [Google Scholar]
- 38.Winter G. xia2: an expert system for macromolecular crystallography data reduction. Journal of applied crystallography. 2010;43:186–190. [Google Scholar]
- 39.Storoni LC, McCoy AJ, Read RJ. Likelihood-enhanced fast rotation functions. Acta crystallographica Section D, Biological crystallography. 2004;60:432–438. doi: 10.1107/S0907444903028956. [DOI] [PubMed] [Google Scholar]
- 40.Emsley P, Cowtan K. Coot: model-building tools for molecular graphics. Acta crystallographica Section D, Biological crystallography. 2004;60:2126–2132. doi: 10.1107/S0907444904019158. [DOI] [PubMed] [Google Scholar]
- 41.Murshudov GN, Vagin AA, Dodson EJ. Refinement of macromolecular structures by the maximum-likelihood method. Acta crystallographica Section D, Biological crystallography. 1997;53:240–255. doi: 10.1107/S0907444996012255. [DOI] [PubMed] [Google Scholar]
- 42.Afonine PV, et al. Joint X-ray and neutron refinement with phenix. refine. Acta Crystallographica Section D: Biological Crystallography. 2010;66:1153–1163. doi: 10.1107/S0907444910026582. [DOI] [PMC free article] [PubMed] [Google Scholar]
- 43.Afonine PV, et al. FEM: feature-enhanced map. Acta crystallographica Section D, Biological crystallography. 2015;71:646–666. doi: 10.1107/S1399004714028132. [DOI] [PMC free article] [PubMed] [Google Scholar]
- 44.Ashkenazy H, et al. ConSurf 2016: an improved methodology to estimate and visualize evolutionary conservation in macromolecules. Nucleic acids research. 2016;44:W344–350. doi: 10.1093/nar/gkw408. [DOI] [PMC free article] [PubMed] [Google Scholar]
- 45.Katoh K, Rozewicki J, Yamada KD. MAFFT online service: multiple sequence alignment, interactive sequence choice and visualization. Briefings in bioinformatics. 2019;20:1160–1166. doi: 10.1093/bib/bbx108. [DOI] [PMC free article] [PubMed] [Google Scholar]
- 46.Orekhov VY, Jaravine VA. Analysis of non-uniformly sampled spectra with multi-dimensional decomposition. Progress in nuclear magnetic resonance spectroscopy. 2011;59:271–292. doi: 10.1016/j.pnmrs.2011.02.002. [DOI] [PubMed] [Google Scholar]
- 47.Delaglio F, et al. NMRPipe: a multidimensional spectral processing system based on UNIX pipes. Journal of biomolecular NMR. 1995;6:277–293. doi: 10.1007/BF00197809. [DOI] [PubMed] [Google Scholar]
- 48.Vranken WF, et al. The CCPN data model for NMR spectroscopy: development of a software pipeline. Proteins: Structure, Function, and Bioinformatics. 2005;59:687–696. doi: 10.1002/prot.20449. [DOI] [PubMed] [Google Scholar]
- 49.Salzmann M, Pervushin K, Wider G, Senn H, Wuthrich K. TROSY in triple-resonance experiments: new perspectives for sequential NMR assignment of large proteins. Proceedings of the National Academy of Sciences of the United States of America. 1998;95:13585–13590. doi: 10.1073/pnas.95.23.13585. [DOI] [PMC free article] [PubMed] [Google Scholar]
- 50.Eletsky A, Kienhofer A, Pervushin K. TROSY NMR with partially deuterated proteins. Journal of biomolecular NMR. 2001;20:177–180. doi: 10.1023/a:1011265430149. [DOI] [PubMed] [Google Scholar]
- 51.Lakomek NA, Ying J, Bax A. Measurement of (1)(5)N relaxation rates in perdeuterated proteins by TROSY-based methods. Journal of biomolecular NMR. 2012;53:209–221. doi: 10.1007/s10858-012-9626-5. [DOI] [PMC free article] [PubMed] [Google Scholar]
- 52.Farrow NA, et al. Backbone dynamics of a free and phosphopeptide-complexed Src homology 2 domain studied by 15N NMR relaxation. Biochemistry. 1994;33:5984–6003. doi: 10.1021/bi00185a040. [DOI] [PubMed] [Google Scholar]


