Abstract
Background
Advanced confounder-corrected chemical shift–encoded MRI-derived proton density fat fraction (PDFF) is a leading parameter for fat fraction quantification in nonalcoholic fatty liver disease (NAFLD). Because of the limited availability of this MRI technique, there is a need to develop and validate alternative parameters to assess liver fat.
Purpose
To assess relationship of quantitative US parameters to MRI PDFF and to develop multivariable quantitative US models to detect hepatic steatosis and quantify hepatic fat.
Materials and Methods
Adults with known NAFLD or who were suspected of having NAFLD were prospectively recruited between August 2015 and February 2019. Participants underwent quantitative US and chemical shift–encoded MRI liver examinations. Liver biopsies were performed if clinically indicated. The correlation between seven quantitative US parameters and MRI PDFF was evaluated. By using leave-one-out cross validation, two quantitative US multivariable models were evaluated: a classifier to differentiate participants with NAFLD versus participants without NAFLD and a fat fraction estimator. Classifier performance was summarized by area under the receiver operating characteristic curve and area under the precision-recall curve. Fat fraction estimator performance was evaluated by correlation, linearity, and bias.
Results
Included were 102 participants (mean age, 52 years ± 13 [standard deviation]; 53 women), 78 with NAFLD (MRI PDFF ≥ 5%). A two-variable classifier yielded a cross-validated area under the receiver operating characteristic curve of 0.89 (95% confidence interval: 0.82, 0.96) and an area under the precision-recall curve of 0.96 (95% confidence interval: 0.93, 0.99). The cross-validated fat fraction predicted by a two-variable fat fraction estimator was correlated with MRI PDFF (Spearman ρ = 0.82 [P < .001]; Pearson r = 0.76 [P < .001]). The mean bias was 0.02% (P = .97), and 95% limits of agreement were ±12.0%. The predicted fat fraction was linear with MRI PDFF (R 2 = 0.63; slope, 0.69; intercept, 4.3%) for MRI PDFF of 34% or less.
Conclusion
A multivariable quantitative US approach yielded excellent correlation with MRI proton density fat fraction for hepatic steatosis assessment in nonalcoholic fatty liver disease.
© RSNA, 2020
Summary
A multivariable quantitative US approach showed feasibility as an accurate method for hepatic steatosis assessment in nonalcoholic fatty liver disease compared with MRI proton density fat fraction.
Key Results
■ A multivariable quantitative US approach had an area under the receiver operating curve of 0.89 for diagnosis of nonalcoholic fatty liver disease.
■ Hepatic fat fraction estimates from quantitative US were correlated with confounder-corrected chemical shift–encoded MRI proton density fat fractions (Spearman rank correlation coefficient ρ = 0.82 [P < .001]; Pearson linear correlation coefficient r = 0.76 [P < .001]) and were linear to proton density fat fractions up to 34%.
Introduction
Nonalcoholic fatty liver disease (NAFLD) affects approximately 25% of the human population (1,2) and may soon overtake hepatitis C as the leading cause of liver transplantation (3). The earliest and characteristic histologic feature of NAFLD is hepatic steatosis, defined as the accumulation of fat droplets within hepatocytes. Steatosis can lead to nonalcoholic steatohepatitis, a more rapidly progressive variant of NAFLD. Nonalcoholic steatohepatitis occurs in 20% of adults with NAFLD, and can contribute to development of fibrosis, cirrhosis, and even hepatocellular carcinoma (1,2). Liver biopsy is the current reference standard for NAFLD diagnosis (4). Proton density fat fraction (PDFF) measured at confounder-corrected chemical shift–encoded MRI is an accurate, repeatable, and reproducible noninvasive method for hepatic steatosis quantification (5–7). However, chemical shift–encoded MRI is not routinely available.
There is a critical need to develop noninvasive, widely available, accurate, and cost-effective methods to assess steatosis. US is a promising modality for this purpose, but conventional US is limited by its qualitative nature, system and operator dependency, and modest accuracy (4). Various methods have been investigated to extract quantitative information from US to improve steatosis assessment (8–16), each with its own strengths and weaknesses. For example, the hepatorenal index is accurate for steatosis assessment (8), but it depends on the right kidney being normal and disease-free. The right kidney is not always visible on US images. Controlled attenuation parameter is a nonimaging quantitative index used for steatosis assessment (9,10), but this technique is proprietarily owned by FibroScan (Echosens, Paris, France), and is not available on most US systems. Notably, most existing methods use only one parameter to quantify steatosis. A multivariable approach may be beneficial. Exploring new parameters can facilitate the development of multivariable approaches.
A variety of quantitative US parameters can be extracted by using two quantitative US techniques: spectral analysis and envelope statistics (17). Example parameters include attenuation coefficient (AC, in decibels per centimeter-megahertz), backscatter coefficient (BSC, in 1 per centimeter-steradian), Lizzi-Feleppa slope, intercept, and midband, and envelope statistics parameters (eg, k and μ). AC is an objective measure of the spatial rate of US energy loss in tissue, whereas BSC is an objective measure of the fraction of US energy returned from tissue. AC and BSC represent two fundamental system-independent quantitative US parameters (18–22). Linear regression of log-transformed BSC against frequency yields the Lizzi-Feleppa slope, intercept, and midband (23,24). Fitting a homodyned K distribution to the envelope yields the k parameter (the ratio of coherent to incoherent backscatter signal energy) and the μ parameter (the number of scatterers per resolution cell) (25). Among those parameters, AC and BSC have been shown to be strongly correlated with steatosis, whereas to our knowledge others have not been studied in humans for steatosis assessment.
The purpose of our study was therefore to examine the correlation between MRI PDFF and quantitative US parameters (Appendix E1 [online]). We sought to develop a multivariable quantitative US approach to diagnose nonalcoholic fatty liver disease and quantify hepatic fat by comparing with MRI as the standard of reference.
Materials and Methods
Our prospective, cross-sectional study was Health Insurance Portability and Accountability Act–compliant and institutional review board approved. Written informed consent was obtained. Our study was supported in part by Siemens Healthineers (Munich, Germany) through a research grant and US scanner loan. The authors had control of the data and information submitted for publication. Some study participants were previously reported in work by Han et al (20–22), which assessed the repeatability and reproducibility of AC and BSC measurements.
Study Participants and Design
Research participants were consecutively and prospectively recruited from the University of California, San Diego NAFLD Research Center between August 2015 and February 2019 by a hepatologist (R.L., with >10 years of experience). Inclusion criteria were age 18 years or older, with known NAFLD or suspected of having NAFLD, and willingness and ability to participate. Exclusion criteria were clinical, laboratory, or histologic evidence of a liver disease other than NAFLD, excessive alcohol consumption (≥14 and ≥7 drinks per week for men and women, respectively), steatogenic or hepatoxic medication use, and missing MRI or quantitative US data. Demographic and anthropometric data were recorded by research coordinators (nonauthors). The primary end point of the study was the diagnostic accuracy of multivariable quantitative US for diagnosing and quantifying hepatic steatosis.
US Data Acquisition
All participants underwent US liver examinations by using a US system (Siemens S3000; Siemens Healthineers) with a 4C1 (1–4 MHz nominal) transducer and/or 6C1HD transducer (1–6 MHz nominal) by one or two of six registered diagnostic medical sonographers. To eliminate potentially confounding physiologic effects on quantitative US data, participants were asked to fast for 4 hours prior to the US examinations. Each participant underwent at least one but up to four same-day examinations. The multiple examinations were performed as part of separate studies that assessed the repeatability and reproducibility of the measurements of two quantitative US parameters, AC and BSC (20–22).
During each examination, a sonographer made at least 10 data acquisitions in the same location in the right liver lobe by using a lateral intercostal approach. Participants were positioned in the dorsal decubitus position with the right arm at maximum abduction. Before the first data acquisition, system settings were adjusted for each participant to optimize right hepatic lobe visualization and to identify a region of the parenchyma without major vasculatures. Settings remained constant for the subsequent acquisitions in the examination. Each acquisition consisted of a single operator button press that recorded a B-mode image and the underlying radiofrequency data. Acquisitions were repeated during separate shallow expiration breath-holds separated by about 15 seconds. After completion of the liver acquisitions, a calibrated reference phantom (CIRS, Norfolk, Va) with known AC and BSC was imaged by using the same method without changing the system settings.
Quantitative US Parameter Computation
Quantitative US parameters were computed offline on a personal computer by using an open-source software tool (in Matlab 2016a; Mathworks, Natick, Mass) (19). First, a trained image analyst (A.S.B., with 2 years of experience) selected five acquisitions in no specific order but excluded acquisitions that appeared to be degraded by participant breathing or rib shadowing. The analyst drew a freehand field of interest within the margins of the liver boundary on the corresponding five B-mode images. No efforts were made to exclude the vessels. A biomedical engineer (A.H., with 10 years of experience) then analyzed the field of interest in each of the five selected acquisitions by using custom software to compute AC (18,19), BSC (18,19), k parameter (25), and μ parameter (25). AC and BSC were computed between 2.3 and 3.1 MHz, a bandwidth around the center frequencies of both transducers (ie, best signal-to-noise ratio). Lizzi-Feleppa slope, intercept, and midband were obtained by using linear regression of 10log10(BSC) against frequency. For each quantitative US parameter, the five measurements per examination were averaged to yield a single value. Multiexamination data were used for reproducibility analysis, but only the first examination in each participant was used for steatosis assessment.
US acquisition and quantitative US parameter computation were made without knowing the MRI results.
Chemical Shift–encoded MRI and PDFF
All participants underwent contemporaneous chemical shift–encoded liver MRI by using a 3.0-T system (Signa HD; GE Healthcare, Waukesha, Wis). The order between MRI and quantitative US examinations was not controlled. The chemical shift–encoded MRI method used magnitude reconstruction, as described previously (26,27). A low flip angle (10°) relative to repetition time (≥120 msec) was used to minimize T1 bias. Six two-dimensional gradient-recalled-echo images were acquired at successive nominally out-of-phase and in-phase echo times, with an imaging matrix of 192–224 × 128–192 and an 8–10-mm slice thickness. PDFF maps were reconstructed automatically at MRI by using a custom algorithm that measured and corrected for R2* signal loss, assuming exponential decay, while accounting for the multipeak complexity of fat by using the triglyceride model proposed by Hamilton et al (28). Blinded to quantitative US results, a trained image analyst placed 1-cm circular radius regions of interest on each of the nine Couinaud segments.
MRI PDFF values from liver segments 5–8 were averaged and used as the reference standard for hepatic fat content. The presence of NAFLD was defined as MRI PDFF of 5% or greater (13), which was justifiable because other causes of steatosis had been excluded.
Clinical Liver Biopsy and Fibrosis Stages
A subset of participants underwent nontargeted percutaneous biopsies of the right liver lobe if needed for clinical care (not for research purposes). A 2-cm biopsy sample was obtained by using a 16- or 18-gauge needle. When histologic analysis was available, fibrosis stages (ordinally scaled from 0 to 4) and lobular inflammation scores (ordinally scaled from 0 to 3) were determined by a hepatopathologist (M.A.V., with >10 years of experience) according to the Nonalcoholic Steatohepatitis Clinical Research Network histologic scoring system (29).
Statistical Analysis
Univariable quantitative US parameter versus MRI PDFF analysis.—The Pearson correlation coefficient between each quantitative US parameter and MRI PDFF was calculated in all participants. To assess the potential confounding effect of fibrosis and inflammation, a two-tailed t test or Mann-Whitney U test was performed for each quantitative US parameter (and MRI PDFF) to determine if the mean of the quantitative US parameter (and MRI PDFF) was statistically significantly different between different groups of participants. The level of significance was set at P < .05.
Multivariable quantitative US models.—We developed two quantitative US-based multivariable models: (a) a classifier on the basis of generalized logistic regression to differentiate participants with NAFLD (PDFF ≥ 5%) versus without NAFLD (PDFF < 5%), and (b) a fat fraction estimator on the basis of generalized linear regression to predict PDFF (Appendix E2 [online]). Stepwise regression was used for parameter selection. Leave-one-out cross validation was performed by using data from all participants to evaluate both models to avoid overestimating the model performance. Feature selection and model training were repeated for each fold of the cross validation. Classifier performance was summarized by area under the receiver operating characteristic curve and, in the case of class imbalance, also by the area under the precision-recall curve (30). Fat fraction estimator performance was evaluated by correlation (Spearman ρ and Pearson r), linearity (31), and bias. All statistical analyses were performed by using existing software (Matlab 2016a, Mathworks; and R 3.4.2, R Foundation for Statistical Computing, Vienna, Austria, http://www.r-project.org).
The sample size was derived on the basis of feasibility. A sample size of 100 was targeted. No formal power analysis was performed because no preliminary data were available. Data from this study will help inform the sample size for future studies.
Results
Participant Characteristics
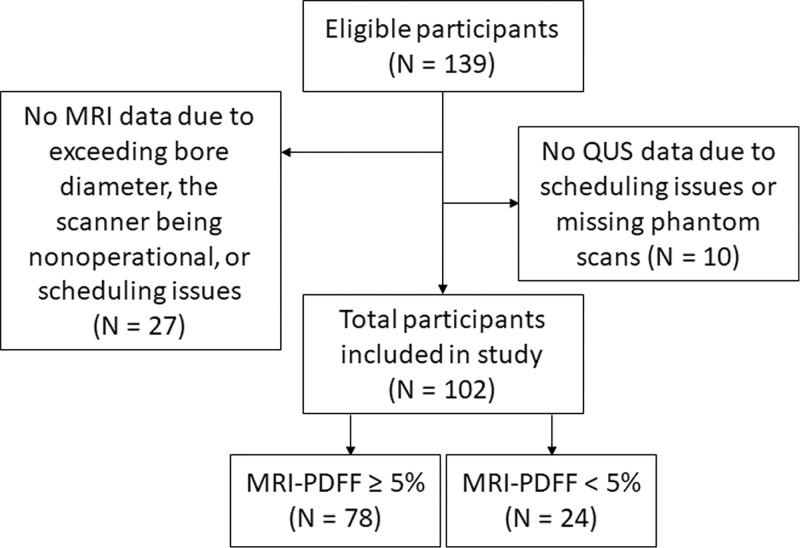
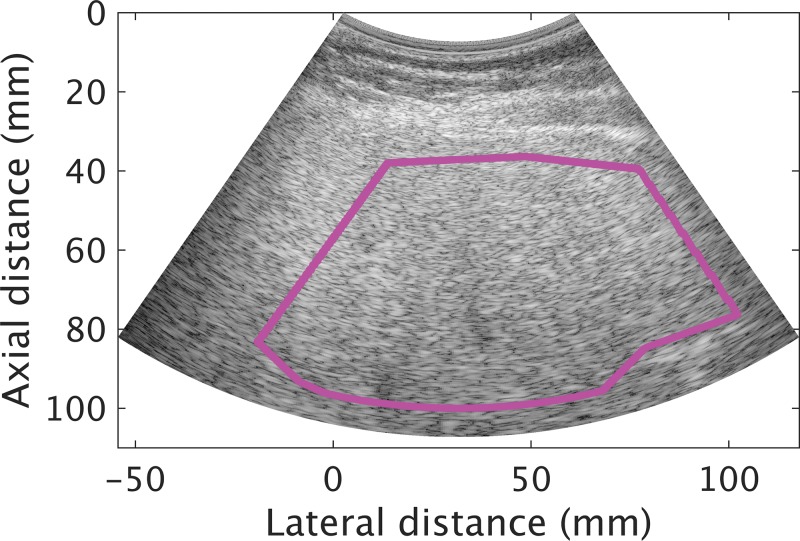
We enrolled 102 participants (mean age, 52 years ± 13 [standard deviation]; 53 women; Fig 1). Participant characteristics are summarized in Table 1. Mean age for men and women, respectively, was 48 years ± 13 and 55 years ± 13. Mean MRI PDFF for men and women, respectively, was 11.1% ± 7.9 and 14.5% ± 9.7. The MRI PDFF ranged from 0.7% to 41.1%, and 78 of 102 (76.5%) participants had NAFLD as defined previously. Among those with liver biopsy (n = 83), 62% (24 of 39) of men had no fibrosis (F0), and 43% (19 of 44) of women had no fibrosis. Average time duration between MRI and US examinations was 3 days (range, 0–67 days), and the duration between biopsy and US examinations was 50 days (range, 1–258 days). An example US image (reconstructed from the radiofrequency data) with a field of interest is shown in Figure 2.
Figure 1:
Inclusion and exclusion flowchart. PDFF = proton density fat fraction, QUS = quantitative US.
Table 1:
Demographic, Physical, Imaging, and Histologic Characteristics of Participants
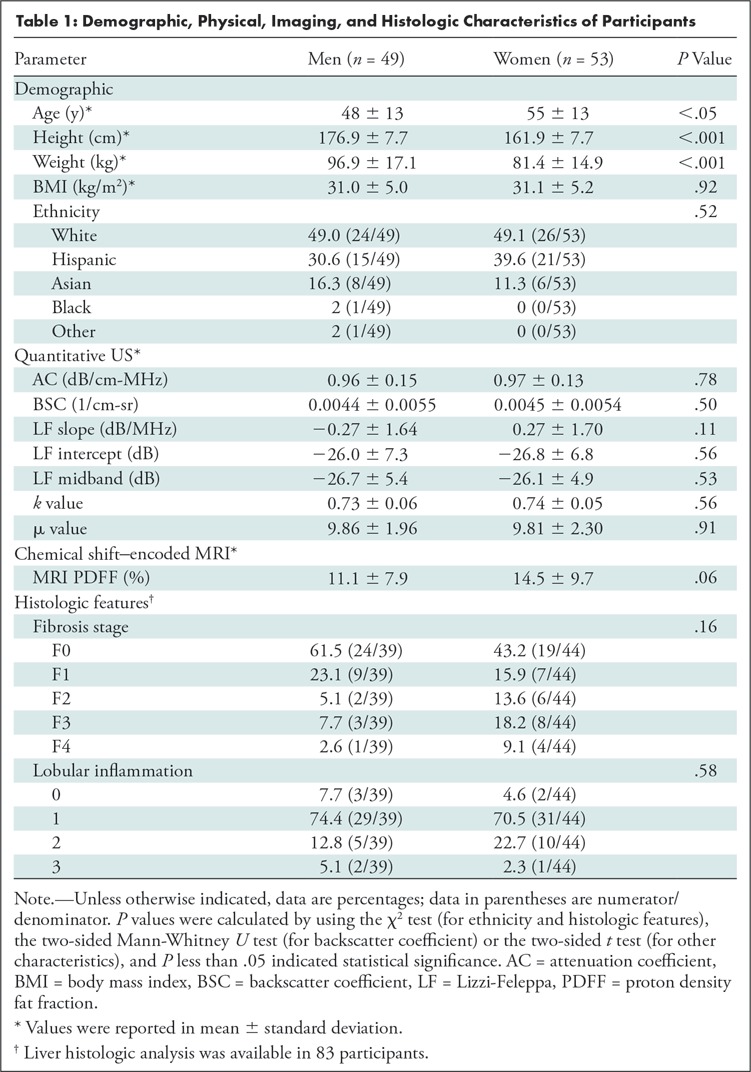
Figure 2:
Transverse plane liver B mode US image reconstructed from radiofrequency data in a 68-year-old man with nonalcoholic fatty liver disease (average MRI proton density fat fraction in liver segments 5–8 was 25.3%). The pink field-of-interest line was drawn on the reconstructed B mode image within the margin of the liver boundary.
Reproducibility of Quantitative US Parameters
Examinations to assess the intersonographer reproducibility of quantitative US parameters were performed in 29 participants. The intersonographer intraclass correlation coefficient values obtained from those participants for the seven quantitative US parameters were as follows: AC, 0.80; BSC after log transformation, 0.88; Lizzi-Feleppa slope, 0.45; Lizzi-Feleppa intercept, 0.81; Lizzi-Feleppa midband, 0.90; k = 0.82; and μ = 0.88. All intraclass correlation coefficient values were higher than 0.8 except for one.
Correlation between Quantitative US Parameters and MRI PDFF
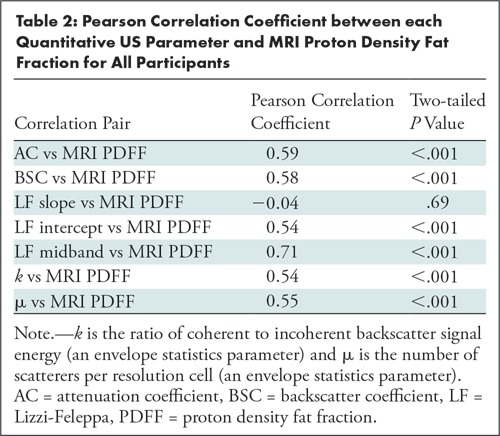
Six of the seven quantitative US parameters were correlated with MRI PDFF (r = 0.59, 0.58, 0.54, 0.71, 0.54, and 0.55 for AC, BSC, Lizzi-Feleppa intercept, Lizzi-Feleppa midband, k, and μ, respectively; P < .001 for all six correlation coefficients; Table 2). The Lizzi-Feleppa slope was not correlated with MRI PDFF (r = −0.04; P = .69).
Table 2:
Pearson Correlation Coefficient between each Quantitative US Parameter and MRI Proton Density Fat Fraction for All Participants
Potential Confounders
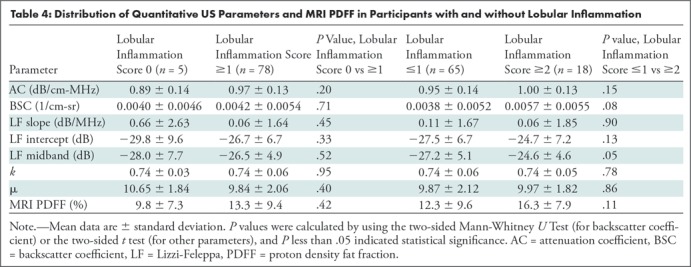
No confounding effect of either liver fibrosis or lobular inflammation was observed from the limited data set (83 participants with histologic analysis). Specifically, the seven quantitative US parameters and MRI PDFF were not different between participants without and with fibrosis, or between participants without fibrosis and who were at fibrosis stage F1 or greater (Table 3 shows numerical data and P values). Quantitative US parameters and MRI PDFF were not different between participants without and with lobular inflammation, or between participants with lobular inflammation scores of 0 and 1 versus 2 and 3 (Table 4 shows numerical data and P values).
Table 3:
Distribution of Quantitative US Parameters and MRI Proton Density Fat Fraction in Participants with and without Fibrosis
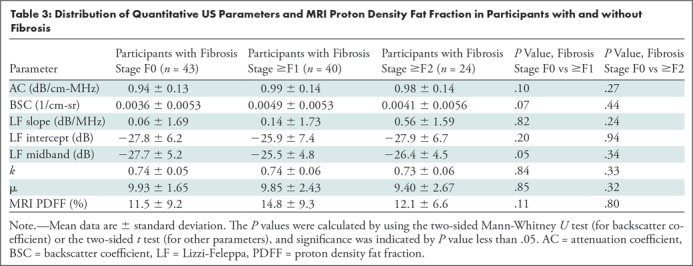
Table 4:
Distribution of Quantitative US Parameters and MRI PDFF in Participants with and without Lobular Inflammation
Multivariable Quantitative US Model Classifier
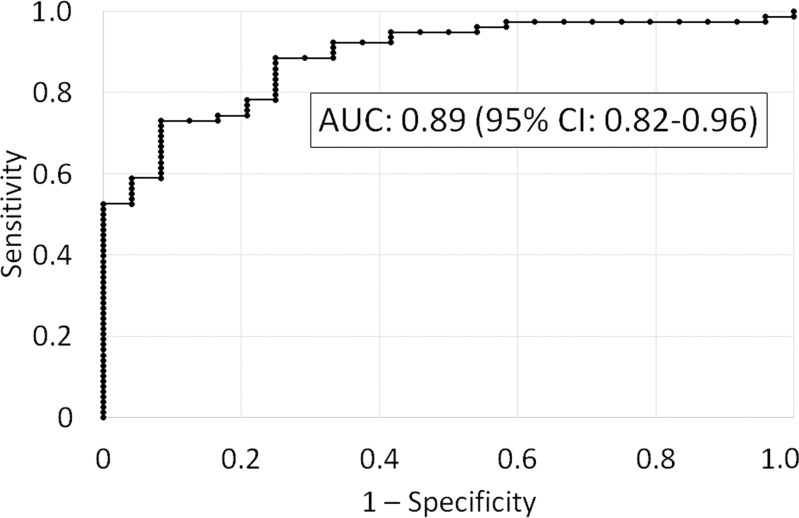
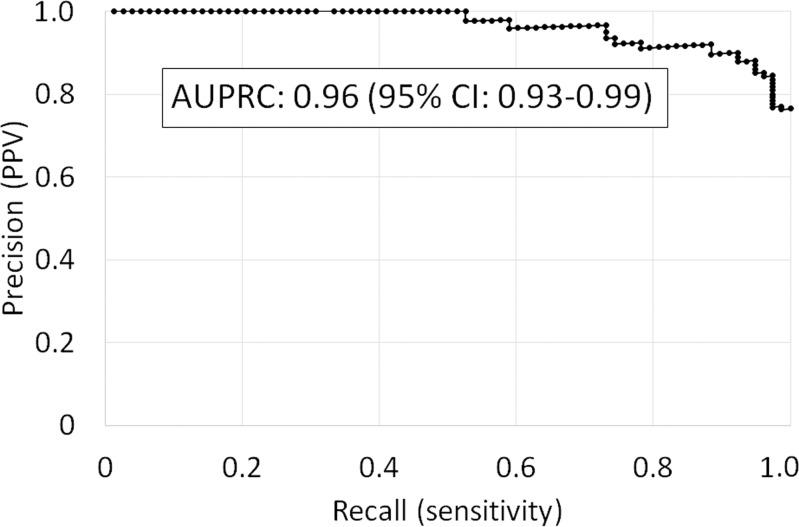
The Lizzi-Feleppa midband and k parameters were selected for the multivariable classifier in all 102 folds. Leave-one-out cross validation of the multivariable classifier yielded an area under the receiver operating characteristic curve of 0.89 (95% confidence interval: 0.82, 0.96) for diagnosing NALFD and an area under the precision-recall curve of 0.96 (95% confidence interval: 0.93, 0.99). The receiver operating characteristic and precision-recall curves are shown in Figure 3.
Figure 3a:
Leave-one-out cross validated (a) receiver operating characteristic curve and (b) precision-recall curve identifying nonalcoholic fatty liver disease by using the multivariable classifier. AUC = area under the receiver operating characteristic curve, AUPRC = area under the precision-recall curve, CI = confidence interval, PPV = positive predictive value.
Figure 3b:
Leave-one-out cross validated (a) receiver operating characteristic curve and (b) precision-recall curve identifying nonalcoholic fatty liver disease by using the multivariable classifier. AUC = area under the receiver operating characteristic curve, AUPRC = area under the precision-recall curve, CI = confidence interval, PPV = positive predictive value.
Multivariable Quantitative US Model Fat Fraction Estimator
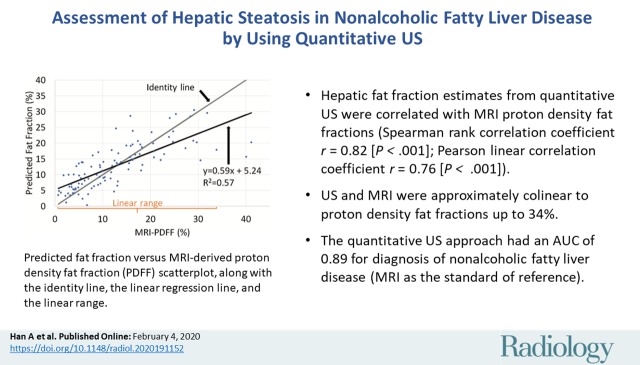
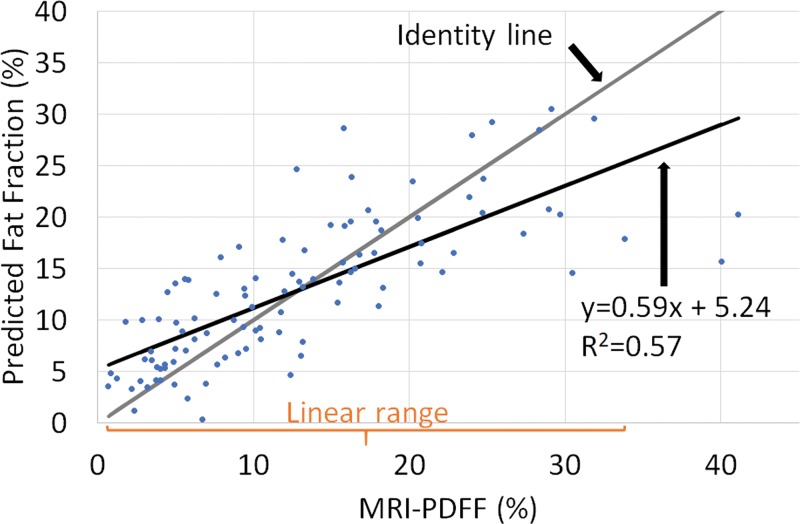
The Lizzi-Feleppa midband and k parameters were selected for the multivariable fat fraction estimator in all 102 folds. The resulting fat fraction estimator was in the form of the following equation: estimated fat fraction = a ∙ midband + b ∙ k + c ∙ midband ∙ k + d, where a, b, c, and d are coefficients. Fat fraction values predicted by this multivariable fat fraction estimator through leave-one-out cross validation were correlated with MRI PDFF (Fig 4), with Spearman correlation coefficient of 0.82 (P < .001) and Pearson correlation coefficient of 0.76 (P < .001).
Figure 4:
Predicted fat fraction versus MRI-derived proton density fat fraction (PDFF) scatterplot, along with the identity line, the linear regression line, and the linear range. Predicted fat fractions were obtained by leave-one-out cross validation.
There was no nonlinearity between predicted fat fraction and MRI PDFF for MRI PDFF 34% or less (P = .10 for the third-order term of a three-degree polynomial regression, and P = .05 for the second-order term of a quadratic polynomial regression). Linear regression of the predicted fat fraction against MRI PDFF within the linear range (MRI PDFF ≤ 34%) yielded slope of 0.69, intercept of 4.3%, and R2 of 0.63. The multivariable fat fraction predictor tended to underestimate the fat fraction for MRI PDFF greater than 34%, suggesting a saturation effect outside the linear range. Linear regression of the predicted fat fraction against MRI PDFF over the entire MRI PDFF range (MRI PDFF ≤ 41.1%) yielded a slope of 0.59, intercept of 5.2%, and R2 of 0.57.
The mean bias of the predicted fat fraction over the entire MRI PDFF range was 0.02%, not different from 0 (P = .97). The 95% limits of agreement were within ±12%.
Discussion
The earliest characteristic histologic feature of nonalcoholic liver disease (NAFLD) is hepatic steatosis. Liver biopsy is the current reference standard for NAFLD diagnosis although MRI proton density fat fraction (PDFF) is an effective noninvasive method for hepatic steatosis quantification. Because of complexity and lack of availability of MRI PDFF, we sought to evaluate the use of quantitative US for this purpose. Two multivariable quantitative US models were developed, one for hepatic steatosis diagnosis and the other for hepatic fat quantification. For diagnosis of steatosis, the area under the receiver operating characteristic curve value was 0.89 (95% confidence interval: 0.82, 0.96), and the area under the precision-recall curve was 0.96 (95% confidence interval: 0.93, 0.99). The fat fraction estimator predicted fat fraction values that were linear with MRI PDFF over a broad range of clinically relevant MRI PDFF values and that correlated with MRI PDFF over the entire MRI PDFF interval. However, a saturation effect was observed when MRI PDFF exceeded 34%. No differences in quantitative US parameters between fibrosis groups or between inflammation groups was observed, which might indicate the absence of a significant confounding effect of fibrosis and inflammation.
Quantitative US parameters AC, BSC, Lizzi-Feleppa intercept, Lizzi-Feleppa midband, k, and μ were correlated with MRI PDFF in our study. The confounding effect of fibrosis for quantitative US parameters was examined. The feasibility of the use of a multivariable quantitative US approach for hepatic steatosis diagnosis and quantification was demonstrated. To put the multivariable classifier and fat fraction estimator results into context, a study of 153 patients (9) showed that controlled attenuation parameter was correlated with the percentage of steatosis (ρ = 0.47) by using biopsy as the reference standard. The area under the receiver operating characteristic curve of the controlled attenuation parameter for identifying 5% or greater steatosis was 0.79. Controlled attenuation parameter performance was influenced by fibrosis; performance was higher in patients with mild (F0–F1) fibrosis (area under the receiver operating characteristic curve, 0.89 vs 0.72 with F2–F4; P = .03). A study (32) of 107 participants who underwent both controlled attenuation parameter and MRI PDFF assessment showed a 0.57 correlation coefficient between controlled attenuation parameter and MRI PDFF. Noncontrast agent–enhanced CT is another noninvasive imaging modality for diagnosis of steatosis. This modality has a sensitivity of 82% and a specificity of 100% for the diagnosis of 30% or greater histologic steatosis (33,34). However, CT has poor sensitivity for mild steatosis and is not reliable for liver fat quantification, in addition to requiring the use of ionizing radiation (35). Advanced MRI techniques can help to accurately and precisely measure hepatic fat fraction. A randomized clinical trial showed that MRI PDFF was able to show changes in liver fat longitudinally, which histologic analysis could not (5). MRI PDFF was used as an accurate reference standard in our study. Despite its high accuracy, precision, and repeatability and reproducibility, advanced MRI for liver fat remains relatively inaccessible.
Our study had several limitations. First, the participants were biased toward NAFLD; the percentage of participants without NAFLD was 23.5% (24 of 102). Second, radiofrequency data are not yet readily available on all commercial US systems. However, most manufacturers are starting to provide radiofrequency output capabilities. Third, the field of interest was manually drawn. Fourth, the quantitative US method can be implemented on a clinical system but requires calibration with a phantom, which may be impractical for clinical applications. Approaches without phantoms are needed. Finally, the sample size might be too small to analyze confounding factors.
In conclusion, a multivariable quantitative US approach showed promise in our study for hepatic steatosis assessment in nonalcoholic fatty liver disease. A possible direction for future studies is to automate the field of interest process by assessing the use of fixed fields of interest or incorporating state-of-the-art liver image segmentation algorithms to automatically segment the liver boundary.
APPENDIX
Acknowledgments
Acknowledgements
The authors thank the sonographers, Lara Callahan, RDMS, PAC, Lisa Deiranieh, BS, RDMS, Elise Housman, BS, RDMS, Christopher Lucas, MBA, MA(M), RT(R), ARDMS, Susan Lynch, RDMS, RDCS, RVT, and Minaxi Trivedi, RDMS, for their dedicated contributions and expertise.
Study supported by National Institute of Environmental Health Sciences (5P42ES010337), National Center for Advancing Translational Sciences (5UL1TR001442), National Institute of Diabetes and Digestive and Kidney Diseases (R01DK106419, P30DK120515), and Siemens Healthineers. The content is solely the responsibility of the authors and does not necessarily represent the official views of the National Institutes of Health. The use of the Siemens scanner was loaned to University of California, San Diego, under a research agreement with Siemens Healthineers.
Disclosures of Conflicts of Interest: A.H. disclosed no relevant relationships. Y.N.Z. Activities related to the present article: disclosed money to author’s institution for a postdoctoral fellowship education grant from GE Healthcare. Activities not related to the present article: disclosed no relevant relationships. Other relationships: disclosed no relevant relationships. A.S.B. disclosed no relevant relationships. V.M. disclosed no relevant relationships. M.P.A. disclosed no relevant relationships. J.W.E. disclosed no relevant relationships. R.L. disclosed no relevant relationships. M.A.V. disclosed no relevant relationships. C.B.S. Activities related to the present article: disclosed no relevant relationships. Activities not related to the present article: disclosed money to author’s institution for board memberships from AMRA, Guerbet, Bristol Meyers Squibb; consultancies from GE Healthcare, Bayer, AMRA, Fulcrum Therapeutics, IBM/Watson Health; grants/grants pending from Gilead, GE Healthcare, Siemens, GE MRI, Bayer, GE Digital, GE US, ACR Innovation, Philips, Celgene, Enanta, ICON Medical Imaging, Gilead, Shire, Virtualscopics, Intercept, Synageva, Takeda, Genzyme, Janssen, NuSirt, Celgene-Parexel, and Organovo; payment for lectures including service on speakers bureaus from GE Healthcare and Bayer; royalties from Wolters Kluwer Health; payment for the development of educational presentations from Medscape, Resoundant; and consulting fees from Epigenomics. Other relationships: disclosed no relevant relationships. W.D.O. Activities related to the present article: disclosed money to author’s institution for a grant from National Institutes of Health. Activities not related to the present article: disclosed no relevant relationships. Other relationships: disclosed no relevant relationships.
Abbreviations:
- AC
- attenuation coefficient
- BSC
- backscatter coefficient
- NAFLD
- nonalcoholic fatty liver disease
- PDFF
- proton density fat fraction
References
- 1.Loomba R, Sanyal AJ. The global NAFLD epidemic. Nat Rev Gastroenterol Hepatol 2013;10(11):686–690. [DOI] [PubMed] [Google Scholar]
- 2.Friedman SL, Neuschwander-Tetri BA, Rinella M, Sanyal AJ. Mechanisms of NAFLD development and therapeutic strategies. Nat Med 2018;24(7):908–922. [DOI] [PMC free article] [PubMed] [Google Scholar]
- 3.Pais R, Barritt AS, 4th, Calmus Y, et al. NAFLD and liver transplantation: Current burden and expected challenges. J Hepatol 2016;65(6):1245–1257. [DOI] [PMC free article] [PubMed] [Google Scholar]
- 4.Machado MV, Cortez-Pinto H. Non-invasive diagnosis of non-alcoholic fatty liver disease. A critical appraisal. J Hepatol 2013;58(5):1007–1019. [DOI] [PubMed] [Google Scholar]
- 5.Le TA, Chen J, Changchien C, et al. Effect of colesevelam on liver fat quantified by magnetic resonance in nonalcoholic steatohepatitis: a randomized controlled trial. Hepatology 2012;56(3):922–932. [DOI] [PMC free article] [PubMed] [Google Scholar]
- 6.Noureddin M, Lam J, Peterson MR, et al. Utility of magnetic resonance imaging versus histology for quantifying changes in liver fat in nonalcoholic fatty liver disease trials. Hepatology 2013;58(6):1930–1940. [DOI] [PMC free article] [PubMed] [Google Scholar]
- 7.Reeder SB, Cruite I, Hamilton G, Sirlin CB. Quantitative assessment of liver fat with magnetic resonance imaging and spectroscopy. J Magn Reson Imaging 2011;34(4):729–749. [DOI] [PMC free article] [PubMed] [Google Scholar]
- 8.Shiralkar K, Johnson S, Bluth EI, Marshall RH, Dornelles A, Gulotta PM. Improved method for calculating hepatic steatosis using the hepatorenal index. J Ultrasound Med 2015;34(6):1051–1059. [DOI] [PubMed] [Google Scholar]
- 9.Myers RP, Pollett A, Kirsch R, et al. Controlled Attenuation Parameter (CAP): a noninvasive method for the detection of hepatic steatosis based on transient elastography. Liver Int 2012;32(6):902–910. [DOI] [PubMed] [Google Scholar]
- 10.Chan WK, Nik Mustapha NR, Mahadeva S. Controlled attenuation parameter for the detection and quantification of hepatic steatosis in nonalcoholic fatty liver disease. J Gastroenterol Hepatol 2014;29(7):1470–1476. [DOI] [PubMed] [Google Scholar]
- 11.Imbault M, Faccinetto A, Osmanski BF, et al. Robust sound speed estimation for ultrasound-based hepatic steatosis assessment. Phys Med Biol 2017;62(9):3582–3598. [DOI] [PubMed] [Google Scholar]
- 12.Andre MP, Han A, Heba E, et al. Accurate diagnosis of nonalcoholic fatty liver disease in human participants via quantitative ultrasound. 2014 IEEE International Ultrasonics Symposium, 2014; 2375–2377. [Google Scholar]
- 13.Lin SC, Heba E, Wolfson T, et al. Noninvasive diagnosis of nonalcoholic fatty liver disease and quantification of liver fat using a new quantitative ultrasound technique. Clin Gastroenterol Hepatol 2015;13(7):1337–1345.e6. [DOI] [PMC free article] [PubMed] [Google Scholar]
- 14.Paige JS, Bernstein GS, Heba E, et al. A Pilot Comparative Study of Quantitative Ultrasound, Conventional Ultrasound, and MRI for Predicting Histology-Determined Steatosis Grade in Adult Nonalcoholic Fatty Liver Disease. AJR Am J Roentgenol 2017;208(5):W168–W177. [DOI] [PMC free article] [PubMed] [Google Scholar]
- 15.Lin YH, Wan YL, Tai DI, et al. Considerations of ultrasound scanning approaches in non-alcoholic fatty liver disease assessment through acoustic structure quantification. Ultrasound Med Biol 2019;45(8):1955–1969. [DOI] [PubMed] [Google Scholar]
- 16.Jeon SK, Lee JM, Joo I, et al. Prospective evaluation of hepatic steatosis using ultrasound attenuation imaging in patients with chronic liver disease with magnetic resonance imaging proton density fat fraction as the reference standard. Ultrasound Med Biol 2019;45(6):1407–1416. [DOI] [PubMed] [Google Scholar]
- 17.Oelze ML, Mamou J. Review of quantitative ultrasound: Envelope statistics and backscatter coefficient imaging and contributions to diagnostic ultrasound. IEEE Trans Ultrason Ferroelectr Freq Control 2016;63(2):336–351. [DOI] [PMC free article] [PubMed] [Google Scholar]
- 18.Yao LX, Zagzebski JA, Madsen EL. Backscatter coefficient measurements using a reference phantom to extract depth-dependent instrumentation factors. Ultrason Imaging 1990;12(1):58–70. [DOI] [PubMed] [Google Scholar]
- 19.Han A, Andre MP, Erdman JW, Jr, Loomba R, Sirlin CB, O’Brien WD, Jr. Repeatability and reproducibility of a clinically based QUS phantom study and methodologies. IEEE Trans Ultrason Ferroelectr Freq Control 2017;64(1):218–231. [DOI] [PMC free article] [PubMed] [Google Scholar]
- 20.Han A, Andre MP, Deiranieh L, et al. Repeatability and reproducibility of the ultrasonic attenuation coefficient and backscatter coefficient measured in the right lobe of the liver in adults with known or suspected nonalcoholic fatty liver disease. J Ultrasound Med 2018;37(8):1913–1927. [DOI] [PMC free article] [PubMed] [Google Scholar]
- 21.Han A, Labyed Y, Sy EZ, et al. Inter-sonographer reproducibility of quantitative ultrasound outcomes and shear wave speed measured in the right lobe of the liver in adults with known or suspected non-alcoholic fatty liver disease. Eur Radiol 2018;28(12):4992–5000. [DOI] [PMC free article] [PubMed] [Google Scholar]
- 22.Han A, Zhang YN, Boehringer AS, et al. Inter-platform reproducibility of ultrasonic attenuation and backscatter coefficients in assessing NAFLD. Eur Radiol 2019;29(9):4699–4708. [DOI] [PMC free article] [PubMed] [Google Scholar]
- 23.Lizzi FL, Greenebaum M, Feleppa EJ, Elbaum M, Coleman DJ. Theoretical framework for spectrum analysis in ultrasonic tissue characterization. J Acoust Soc Am 1983;73(4):1366–1373. [DOI] [PubMed] [Google Scholar]
- 24.Muleki-Seya P, Han A, Andre MP, Erdman JW, Jr, O’Brien WD, Jr. Analysis of two quantitative ultrasound approaches. Ultrason Imaging 2018;40(2):84–96. [DOI] [PMC free article] [PubMed] [Google Scholar]
- 25.Hruska DP, Oelze ML. Improved parameter estimates based on the homodyned K distribution. IEEE Trans Ultrason Ferroelectr Freq Control 2009;56(11):2471–2481. [DOI] [PMC free article] [PubMed] [Google Scholar]
- 26.Tang A, Tan J, Sun M, et al. Nonalcoholic fatty liver disease: MR imaging of liver proton density fat fraction to assess hepatic steatosis. Radiology 2013;267(2):422–431. [DOI] [PMC free article] [PubMed] [Google Scholar]
- 27.Permutt Z, Le TA, Peterson MR, et al. Correlation between liver histology and novel magnetic resonance imaging in adult patients with non-alcoholic fatty liver disease - MRI accurately quantifies hepatic steatosis in NAFLD. Aliment Pharmacol Ther 2012;36(1):22–29. [DOI] [PMC free article] [PubMed] [Google Scholar]
- 28.Hamilton G, Yokoo T, Bydder M, et al. In vivo characterization of the liver fat 1H MR spectrum. NMR Biomed 2011;24(7):784–790. [DOI] [PMC free article] [PubMed] [Google Scholar]
- 29.Kleiner DE, Brunt EM, Van Natta M, et al. Design and validation of a histological scoring system for nonalcoholic fatty liver disease. Hepatology 2005;41(6):1313–1321. [DOI] [PubMed] [Google Scholar]
- 30.Lever J, Krzywinski M, Altman N. Classification evaluation. Nat Methods 2016;13(8):603–604. [Google Scholar]
- 31.Raunig DL, McShane LM, Pennello G, et al. Quantitative imaging biomarkers: a review of statistical methods for technical performance assessment. Stat Methods Med Res 2015;24(1):27–67. [DOI] [PMC free article] [PubMed] [Google Scholar]
- 32.Guthrie H, Castro N, Beysen C. Morrow L, Hompesch M. Relationship between controlled attenuation parameter (CAP) and magnetic resonance imaging-derived proton density fat fraction (MRI-PDFF) in subjects at high risk for nonalcoholic fatty liver disease (NAFLD), ProSciento, Inc. https://prosciento.com/wp-content/uploads/2019/02/NASHTAG2019-Poster_Hompesch_FINAL-CB12292018L.pdf. Accessed April 23, 2019. [Google Scholar]
- 33.Festi D, Schiumerini R, Marzi L, et al. Review article: the diagnosis of non-alcoholic fatty liver disease -- availability and accuracy of non-invasive methods. Aliment Pharmacol Ther 2013;37(4):392–400. [DOI] [PubMed] [Google Scholar]
- 34.Wong VW, Vergniol J, Wong GL, et al. Diagnosis of fibrosis and cirrhosis using liver stiffness measurement in nonalcoholic fatty liver disease. Hepatology 2010;51(2):454–462. [DOI] [PubMed] [Google Scholar]
- 35.Springer F, Machann J, Claussen CD, Schick F, Schwenzer NF. Liver fat content determined by magnetic resonance imaging and spectroscopy. World J Gastroenterol 2010;16(13):1560–1566. [DOI] [PMC free article] [PubMed] [Google Scholar]
Associated Data
This section collects any data citations, data availability statements, or supplementary materials included in this article.


